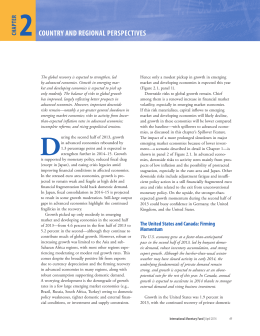
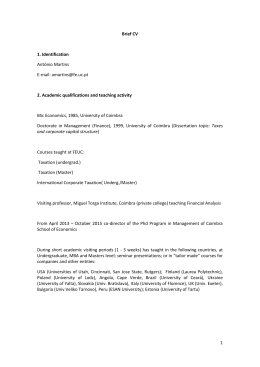
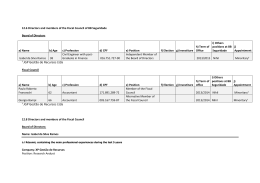
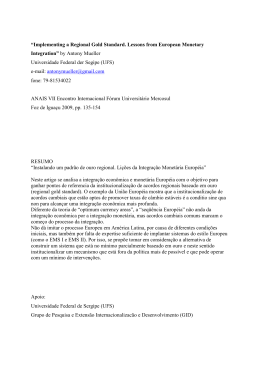
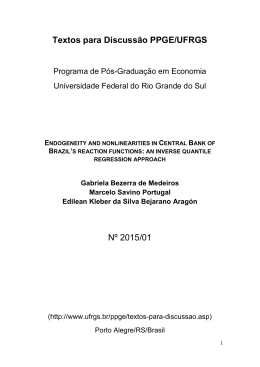
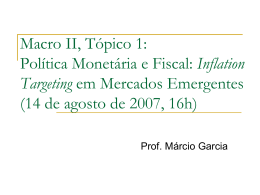
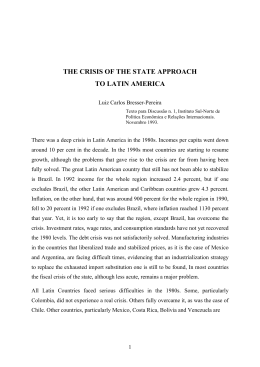
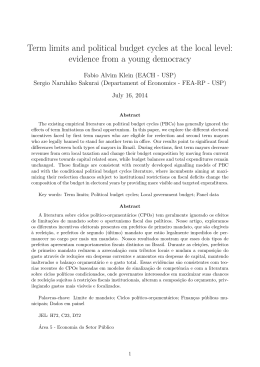
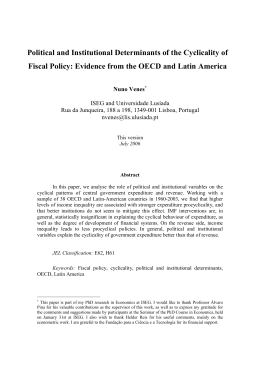
CCHAPTER
HAPTER
12
COUNTRY AND REGIONAL PERSPECTIVES
Global growth is forecast at 3.5 percent in 2015 and 3.8
percent in 2016, with uneven prospects across the main
countries and regions. Growth in emerging market economies is softening, reflecting an adjustment to diminished
medium-term growth expectations and lower revenues from
commodity exports, as well as country-specific factors. The
outlook for advanced economies is showing signs of improvement, owing to the boost to disposable incomes from lower
oil prices, continued support from accommodative monetary
policy stances, and more moderate fiscal adjustment. The
distribution of risks to near-term global growth has become
more balanced relative to October 2014 but is still tilted to
the downside. The decline in oil prices could boost activity more than expected. Geopolitical tensions continue to
pose threats, and risks of disruptive shifts in asset prices
remain relevant. In some advanced economies, protracted
low inflation or deflation also pose risks to activity.
D
uring the global financial crisis and in the
years that followed, the principal global
shocks—the 2008–09 subprime and
Lehman Brothers crisis and the 2011–12
euro area crisis—had similar effects on all regions,
albeit to varying degrees. But the forces that are now
shaping the global outlook—most notably declining oil and commodity prices—are more redistributive in nature, benefiting some regions and countries
while hurting others (Figure 2.1). Growth divergences
among the major economies, and the resulting interest
rate and currency adjustments, are also having varying
effects across regions. These forces provide the backdrop for this chapter’s regional perspectives:
• Recent sharp declines in oil (and to a lesser extent,
commodity) prices, although a net positive for
the global economy and for oil- and commodityimporting regions, are weighing on the commodityexporting countries of Latin America and the
Caribbean, the Commonwealth of Independent
States, the Middle East and North Africa, and subSaharan Africa.
• The diverging trajectories of the major economies—
robust growth in the United States, the weaker
recoveries progressing in the euro area and Japan,
and slowing growth in China—also have varying
implications across regions and countries, boosting
those with strong trade links with the United States,
but hurting those more tightly linked with the other
major economies.
• The strengthening of the U.S. dollar and the weakening of the euro and yen are also having a redistributive effect. Most obviously, they are a welcome
boost to the tepid recoveries in the euro area and
Japan and are a (so far manageable) headwind to the
U.S. recovery. But they are also generating tensions
between financial stability and competitiveness in
regions and countries that have seen rising dollardenominated indebtedness in recent years.
The United States and Canada: A Solid Recovery
Growth in the United States and Canada remains
solid. However, while lower energy prices have boosted
growth momentum in the United States, they pose
downside risks to the Canadian economy owing to the
relatively large size of its energy sector. In the United
States, labor markets and business and consumer confidence have shown solid improvements. The economy has
also so far been resilient to the weaker external conditions
and the strengthening dollar. The next prominent policy
challenge will be a smooth normalization of monetary
policy. Building political consensus around a mediumterm fiscal consolidation plan and supply-side reforms to
boost medium-term growth—including simplifying the
tax system, investing in infrastructure and human capital,
and immigration reform—will continue to be a challenge.
In Canada, continued monetary policy accommodation and gradual fiscal consolidation would help achieve
growth that is more balanced and more broadly based.
Growth in the United States has been energetic,
averaging 3.9 percent annualized in the last three
quarters of 2014. Consumption—the main engine
of growth—has benefited from steady job creation
and income growth, lower oil prices, and improved
International Monetary Fund | April 2015
45
WORLD ECONOMIC OUTLOOK: UNEVEN GROWTH—SHORT- AND LONG-TERM FACTORS
Figure 2.1. 2015 GDP Growth Forecasts and the Effects of an Oil Supply Shock
1. 2015 GDP Growth Forecasts1
(Percent)
Less than 0
Between 0 and 2
Between 2 and 4
Between 4 and 5
Between 5 and 6
Greater than or equal to 6
Insufficient data
2. Oil Trade Balance, Pure Price Effects2
(Percent of GDP)
Less than –10
Between –10 and –5
Between –5 and 0
Between 0 and 2
Between 2 and 4
Greater than 4
Insufficient data
Source: IMF staff estimates.
1
Data for Syria are excluded because of the uncertain political situation.
2
The map shows the impact on the oil trade balance (as a percentage of GDP) of the projected decline in oil prices in 2015 relative to the oil price assumption underlying
the October 2014 World Economic Outlook projections. The calculations assume unchanged volumes of oil exports and imports relative to projections in October.
46
International Monetary Fund | April 2015
CHAPTER 2 COUNTRY AND REGIONAL PERSPECTIVES
Figure 2.2. United States and Canada: A Solid Recovery
In the United States, underlying growth is solid. Consumption is growing at a
healthy pace, as improvements in labor markets have been strong, but investment
still has much room to recover. Wage and price pressures remain subdued, partly
because of lower energy prices. Canada’s growth slowed in the first quarter of
2014 but rebounded strongly in the next two quarters, with exports benefiting
from the U.S. recovery and a weaker currency. Housing market risks and the
unfolding effects of the oil shock call for continued vigilance in Canada.
6 1. Real Activity Indicators
(Percent change)
5
GDP growth
Priv. cons.
Priv. res. inv.
Net exports
4
Priv. nonres. inv.
3
2
1
15–16
2011–12
Canada
15–16
–1
13–14
U.S.
13–14
0
2011–12
consumer confidence. The unemployment rate reached
5.5 percent in February, 1.2 percentage points below
its level of a year ago (Figure 2.2). Overall, nonresidential investment has supported growth, although lower
oil prices have had a negative impact on energy sector
investment.
Despite the recovery, there is little evidence of
meaningful price and wage pressures. The core personal
consumption expenditure price index in February
was only 1.4 percent higher than a year before, with
headline inflation even lower at 0.2 percent, largely
reflecting falling energy prices. Real wages grew less
than 1 percent in 2014, even as the labor market
steadily strengthened.
Asset purchases by the Federal Reserve ended in
October 2014, and the liftoff of policy interest rates
from the zero bound is expected in the third quarter
of this year, but policy rates are expected to rise only
slowly. The Federal Reserve has clearly communicated
that the timing of the liftoff will depend on progress
toward its goals of maximum employment and 2
percent inflation. Long-term interest rates have further
declined, mainly reflecting weaker external conditions,
excess demand for safe assets, and expectations of
future dollar strength.
Conditions remain in place for robust U.S. economic performance in 2015. Markedly lower energy
prices; tame inflation; an accommodative monetary
policy stance; favorable financial conditions; reduced
fiscal drag; strengthened household, corporate, and
bank balance sheets; and an improving housing market
will combine to maintain solid growth momentum.
These forces are expected to more than offset the
strengthening of the dollar. Growth is projected to
reach 3.1 percent in 2015—as was projected in the
October 2014 World Economic Outlook (WEO)—and
to remain at 3.1 percent in 2016 (Table 2.1).
However, the picture over a longer horizon is less
upbeat. Potential growth is estimated to be only about
2.0 percent, weighed down by an aging population and
weak innovation and productivity growth (see Chapter
3).
Addressing the issue of potential growth will require
implementation of an ambitious agenda of supply-side
policies in a fractious political environment. Forging
agreement on a credible medium-term fiscal consolidation plan is a high priority, to ensure that debt does
not rise again with aging-related fiscal costs. Keeping
debt in check will require efforts to lower the growth
3. House and Equity Prices1
180
U.S. FHFA HPI
CAN
MLS
HPI
15
160
20
10
140
5
120
0
100
–5
80
–10
Right scale:
–15
2006 08
0
S&P 500
S&P/TSX
10
12
5. U.S. Trade2
60
40
Feb.
15
115
–1
110
–2
105
–3
100
–4
–5
–6
–7
–8
Non-oil trade balance
Oil trade balance
Exchange rate index
(right scale)
400 2. U.S. Labor Markets
Unemployment rate
(percent)
300
11
200
9
100
8
0
7
Change in
nonfarm business
–100 payrolls (thous. of
jobs; left scale)
–200
2011 12
13
4. U.S. PCE Inflation
(Percent change)
Fed’s long-term
objective
10
6
5
Feb.
15
3.5
3.0
2.5
2.0
1.5
1.0
Headline
Core
2007 09 11 13 15 17
6. Canada: Household
Debt Decomposition
(Percent of GDP)
Consumer credit
Nonmortgage loans
Mortgages
0.5
0.0
–0.5
20
140
120
100
80
95
60
90
40
85
20
80
0
13 14:
2000 03 06 09 12 14
Q4
Sources: Canadian Real Estate Association; Central Bank of Canada (BoC); Duke/
CFO Magazine Global Business Outlook Survey; Haver Analytics; Statistics Canada;
U.S. Bureau of Economic Analysis; U.S. Bureau of Labor Statistics; and IMF staff
estimates.
Note: Cons. = consumption; Fed = U.S. Federal Reserve; inv. = investment; FHFA =
Federal Housing Finance Agency; HPI = Housing Price Index; MLS = Multiple
Listing Service; nonres. = nonresidential; priv. = private; PCE = personal
consumption expenditure; res. = residential; S&P = Standard & Poor’s; thous. =
thousands; TSX = Toronto Stock Exchange.
1
Year-over-year percent change for house prices; index, January 2005 = 100 for
S&P and TSX.
2
Percent of GDP for the non-oil and oil trade balances; trade-weighted index,
January 1997 = 100, for the exchange rate.
2007
09
11
International Monetary Fund | April 201547
WORLD ECONOMIC OUTLOOK: UNEVEN GROWTH—SHORT- AND LONG-TERM FACTORS
Table 2.1. Advanced Economies: Real GDP, Consumer Prices, Current Account Balance, and Unemployment
(Annual percent change, unless noted otherwise)
Consumer Prices1
Real GDP
Projections
Advanced Economies
United States
Euro Area4,5
Japan
United Kingdom4
Canada
Other Advanced Economies6
Current Account Balance2
Projections
Unemployment3
Projections
Projections
2014
2015
2016
2014
2015
2016
2014
2015
2016
2014
2015
2016
1.8
2.4
0.9
–0.1
2.6
2.5
2.8
2.4
3.1
1.5
1.0
2.7
2.2
2.8
2.4
3.1
1.6
1.2
2.3
2.0
3.1
1.4
1.6
0.4
2.7
1.5
1.9
1.4
0.4
0.1
0.1
1.0
0.1
0.9
1.1
1.4
1.5
1.0
0.9
1.7
2.0
1.9
0.4
–2.4
2.3
0.5
–5.5
–2.2
4.8
0.6
–2.3
3.3
1.9
–4.8
–2.6
4.9
0.4
–2.4
3.1
2.0
–4.6
–2.3
4.3
7.3
6.2
11.6
3.6
6.2
6.9
4.7
6.9
5.5
11.1
3.7
5.4
7.0
4.7
6.6
5.1
10.6
3.7
5.4
6.9
4.6
Note: Data for some countries are based on fiscal years. Please refer to Table F in the Statistical Appendix for a list of economies with exceptional reporting periods.
1Movements in consumer prices are shown as annual averages. Year-end to year-end changes can be found in Table A6 in the Statistical Appendix.
2Percent of GDP.
3Percent. National definitions of unemployment may differ.
4Based on Eurostat’s harmonized index of consumer prices.
5Excludes Lithuania. Current account position corrected for reporting discrepancies in intra-area transactions.
6Excludes the G7 (Canada, France, Germany, Italy, Japan, United Kingdom, United States) and euro area countries but includes Lithuania.
of health care costs, reform social security, and increase
tax revenues. Policies should also be targeted toward
raising labor force participation (including removing disincentives in the tax system, providing child
care support, and enacting skills-based immigration
reform), encouraging innovation, strengthening productivity, and tackling poverty and long-term unemployment. The October 2014 WEO made a clear case
that key infrastructure investments could be made in
the United States at relatively modest near-term costs
but with important benefits for long-term output.
The risks to the near-term outlook are broadly
balanced. On the downside, a stronger dollar could
suppress exports, and low oil prices could suppress
investment in the oil sector by more than is currently
projected. Moreover, the recent compression of term
premiums could unwind, which would tighten lending
conditions and jeopardize the housing market recovery.
Uncertainty about fiscal prospects linked to political
brinkmanship over the debt limit or the 2016 budget
could also undermine confidence and damage growth.
On the upside, lower energy prices could have a bigger
effect than currently expected on consumption or on
non-oil corporate investment. And labor markets could
recover at a faster pace, boosting household incomes
and confidence. Finally, improvements in mortgage
availability resulting from recent policy efforts could
catalyze a faster housing market recovery.
Canada’s recent growth performance has been solid,
alongside a stronger recovery in the United States,
exchange rate depreciation, and high energy demand.
These developments have led to a welcome pickup in
48
International Monetary Fund | April 2015
exports but have yet to translate into strong investment and hiring. The economy is expected to grow 2.2
percent in 2015 (broadly unchanged from the October WEO forecast), helped by a strengthening U.S.
economy. But risks are tilted to the downside because
the unusually large fall in oil prices could further
weaken business investment in the energy sector and
lower employment growth.
The Bank of Canada took preemptive action and cut
its policy rate by 25 basis points in January as insurance against adverse effects of the oil price shock on
the economy. Overall, maintaining monetary accommodation along with gradual fiscal consolidation at
the general government level would be conducive to
rebalancing growth away from household consumption and toward business investment to generate a
broader, more durable recovery. Targeted macroprudential policies would help address high housing sector
vulnerabilities.
Europe
Advanced Europe: Spillovers from a Fragile Euro Area
Recovery
There are signs of a pickup and some positive momentum in the euro area, reflecting lower oil prices and
supportive financial conditions, but risks of prolonged
low growth and low inflation remain. The priority is
to boost growth and inflation through a comprehensive
approach that, in addition to quantitative easing, features
the use of available fiscal space, especially for investment;
productivity-enhancing structural reforms; and steps to
CHAPTER 2 COUNTRY AND REGIONAL PERSPECTIVES
The euro area’s recovery remains uneven across countries. The outlook is for
modest growth. Widespread low inflation has raised real interest rates. Financial
fragmentation, while improving, continues to be present. Debt and unemployment
remain high, and current account surpluses have increased. Financial markets,
pricing in ECB policy actions, have remained supportive.
10 1. WEO Growth Projections
(Percent; cumulative,
8
2014–15)
6
October 2014
Latest
4
20 2. EA: Headline Inflation 1 56
10
Overall HICP (seasonally 48
adjusted; year-over-year
40
percent change)
5
32
0
24
Number of countries in 16
deflation (right scale)
8
15
Output gap 2015
2
0
–6
–15
Spain
–10
United
Kingdom
–4
Italy
–5
France
–2
Germany
In the euro area, activity was weaker than expected in
the middle part of 2014 as private investment remained
weak, except in Ireland, Spain, and Germany. Growth
was stronger than expected in the fourth quarter, but
uneven across countries. The slowdown in investment
derives from persistent economic slack, declining growth
expectations, ongoing political and policy uncertainty,
geopolitical tensions, and tight credit conditions. In
contrast, a smaller fiscal drag and improving consumption have benefited growth, as have net exports.
The European Central Bank (ECB) announced a
decisive asset purchase program, including purchases
of sovereign bonds, to address persistently low inflation in the euro area. Both core and headline inflation
have been well below the ECB’s medium-term price
stability objective for some time (Figure 2.3), with
headline inflation turning negative in December 2014.
The larger-than-expected ECB asset purchase program has contributed to the depreciation of the euro,
mainly against the U.S. dollar. In real effective terms,
the exchange rate has depreciated more than 5 percent
since October. Preliminary indications are that ECB
action has stalled the decline in inflation expectations
and led to even more supportive financial conditions.
A push forward on policies since late 2014 has
included completion of the comprehensive assessment
of banks, launch of the Single Supervisory Mechanism, announcement of plans for a European Fund
for Strategic Investments using existing European
Union funds and country contributions to catalyze
private investment, and issuance of new guidance to
enhance flexibility under the Stability and Growth
Pact for countries undertaking structural reforms or
investment. But there has been modest progress in key
core economies with respect to a more accommodative
fiscal stance and bringing down large current account
surpluses.
The outlook for the euro area is broadly unchanged
relative to the October 2014 WEO. Growth is
expected to increase to 1.5 percent in 2015 from 0.9
percent in 2014. The higher growth in 2015 reflects
stronger growth momentum at the end of 2014, supportive wage increases, a near-term boost from lower
oil prices, and the ECB’s actions that have helped
Figure 2.3. Advanced Europe: Spillovers from a Stagnant
Euro Area
EA
strengthen bank balance sheets. Growth is more robust in
European advanced economies outside the euro area, but
some of these economies may need to tighten macroprudential policies if housing-related risks do not subside.
270 4. EA: Debt and
Unemployment
240
(Percent of GDP
unless noted otherwise)
210
Total private debt
180
Unemployment
rate (percent;
150
General right scale)
120 government
debt
90
9 3. SME Real Corporate
Lending Rates2
8
(Percent)
Germany
7
Italy
6
Spain
France
5
4
3
2
1
2007 08 09 10 11 12
0
Feb.
15
2009 10 11 12
Jan.
15
5 5. EA: Current Account
Balances
4
(Percent of EA GDP)
3
2
1
0
–1
–2
Germany
–3
Other surplus EA
Italy
Other deficit EA
–4
Spain
–5
2002 04 06 08 10
13
60
2005
08
21
19
17
15
13
11
9
7
14
11
6. Selected EA Economies: 1,600
Bank and Sovereign
1,400
CDS Spreads3
1,200
Sovereign
Bank
1,000
800
600
400
200
2010 11
12
13
0
Mar.
15
Sources: Bloomberg, L.P.; European Central Bank (ECB); Eurostat; Haver Analytics;
and IMF staff estimates.
Note: Euro area (EA) = Austria, Belgium, Cyprus, Estonia, Finland, France, Germany,
Greece, Ireland, Italy, Latvia, Lithuania, Luxembourg, Malta, Netherlands, Portugal,
Slovak Republic, Slovenia, Spain. CDS = credit default swap; HICP = Harmonised
Index of Consumer Prices; SME = small and medium-sized enterprises.
1
Shaded area shows variation in the HICP across all euro area countries.
2
Monetary and financial institutions’ lending to corporations of less than €1 million,
one to five years.
3
Euro area countries (Greece, Ireland, Italy, Portugal, and Spain) with high
borrowing spreads during the 2010–11 sovereign debt crisis. Bank and sovereign
five-year CDS spreads in basis points are weighted by total assets and general
government gross debt, respectively. Data are through March 30, 2015. Data for
sovereign spreads exclude Greece.
International Monetary Fund | April 201549
WORLD ECONOMIC OUTLOOK: UNEVEN GROWTH—SHORT- AND LONG-TERM FACTORS
improve financial conditions. Beyond 2015, euro
area growth is expected to hover around 1½ percent,
reflecting both demand- and supply-side constraints.
Inflation is forecast to be about 0.1 percent in 2015
and is expected to remain below the ECB’s mediumterm price stability objective during the forecast period
because of persistent slack.
The medium-term outlook of modest growth and
subdued inflation in the euro area is driven largely by
crisis legacies, notwithstanding the positive effects of
the ECB’s actions. High real debt burdens, impaired
balance sheets, high unemployment, and investor
pessimism about prospects for a robust recovery will
continue to weigh on demand. The comprehensive
assessment improved the transparency of bank balance
sheets and confidence, but credit flows are likely to
remain weak until bank balance sheets are strengthened and credit demand recovers. Uncertainty and pessimism regarding the euro area’s resolve to address its
economic challenges are likely to dampen confidence,
as will national and global political developments (such
as recent developments in Greece and in Russia and
Ukraine). Despite some progress, deep-seated obstacles
to productivity and competitiveness are likely to weigh
on the region’s medium-term growth potential.
Output growth is expected to be more robust in most
other advanced European economies (Table 2.2). In the
United Kingdom, lower oil prices and improved financial market conditions are expected to support continued steady growth. The robust recovery and outlook in
Sweden are supported by consumption and double-digit
housing investment. In Switzerland, however, the sharp
exchange rate appreciation is likely to weigh on growth
in the near term. Inflation has softened in all countries
as a result of the oil price decline and—to varying
degrees—because of the decline in euro area inflation.
These countries have introduced macroprudential measures to mitigate financial stability concerns arising from
their housing markets, but whether existing measures
will be sufficient to contain risks is not yet clear.
For all advanced European economies, risks to
the outlook are more balanced than in the October
2014 WEO. The most important downside risk stems
from the possibility of stagnation and persistently low
inflation in the euro area, which has been weighing
on growth and inflation elsewhere in Europe. Economic shocks—from slower global growth, geopolitical
events, faltering euro area reforms, political and policy
uncertainty, and policy reversals—could lower infla-
50
International Monetary Fund | April 2015
tion expectations and trigger a debt deflation dynamic.
Upside risks could come from a larger positive impact
of lower oil prices and the ECB’s actions. For Sweden,
Switzerland, and the United Kingdom, containing
financial stability risks from housing and mortgage
markets remains important.
A comprehensive strategy is needed to reverse low
inflation in the euro area and guard against stagnation.
Such a strategy will require simultaneous action on
many fronts, in addition to the ECB’s actions to expand
its balance sheet through sovereign asset purchases until
there is a sustained adjustment in the path of inflation.
•• Concerted efforts to address high nonperforming
loans are vital to strengthening bank balance sheets
and improving monetary transmission and credit
growth. Stricter regulations on nonperforming loans
and improvements to insolvency and foreclosure procedures would provide banks with stronger incentives
to accelerate the disposal of these loans.
•• A broadly neutral overall fiscal policy stance strikes
a balance between supporting growth and fostering
debt sustainability, but countries with fiscal space
should do more to boost growth, including via infrastructure investment. Countries with limited space
should use the new flexibility under the Stability and
Growth Pact to undertake investments and structural
reforms and pursue growth-friendly fiscal policies.
•• Structural reforms must be implemented to raise
productivity and medium-term growth, revive
investment, encourage hiring, and promote rebalancing. The priorities include greater labor and
product market flexibility, deregulation to remove
barriers to investment, and progress toward a more
integrated common market.
In other advanced European economies, policies
should focus on sustaining the recovery while ensuring
financial stability. In the United Kingdom, monetary
policy should stay accommodative for now, given currently weak inflation pressures. Some countries should
consider further easing, including through foreign asset
purchases (Switzerland) and additional quantitative easing
(Sweden). Bank capital should be strengthened to mitigate financial sector vulnerabilities, and macroprudential
measures should be tightened if housing-related risks are
not checked. Should these measures prove insufficient,
interest rate increases could be contemplated, with careful consideration given to the trade-off between damage
to the real economy and the ultimate costs of financial
vulnerabilities. Measures to increase housing supply are a
CHAPTER 2 COUNTRY AND REGIONAL PERSPECTIVES
Table 2.2. European Economies: Real GDP, Consumer Prices, Current Account Balance, and Unemployment
(Annual percent change, unless noted otherwise)
Consumer Prices1
Real GDP
Projections
Current Account Balance2
Projections
Unemployment3
Projections
Projections
2014
2015
2016
2014
2015
2016
2014
2015
2016
2014
2015
2016
1.5
1.9
2.1
1.1
0.5
1.6
1.8
2.2
1.9
...
...
...
Advanced Europe
Euro Area4,5
Germany
France
Italy
Spain
1.3
0.9
1.6
0.4
–0.4
1.4
1.7
1.5
1.6
1.2
0.5
2.5
1.8
1.6
1.7
1.5
1.1
2.0
0.6
0.4
0.8
0.6
0.2
–0.2
0.1
0.1
0.2
0.1
0.0
–0.7
1.1
1.0
1.3
0.8
0.8
0.7
2.2
2.3
7.5
–1.1
1.8
0.1
2.6
3.3
8.4
–0.1
2.6
0.3
2.4
3.1
7.9
–0.3
2.5
0.4
10.2
11.6
5.0
10.2
12.8
24.5
9.7
11.1
4.9
10.1
12.6
22.6
9.3
10.6
4.8
9.9
12.3
21.1
Netherlands
Belgium
Austria
Greece
Portugal
0.9
1.0
0.3
0.8
0.9
1.6
1.3
0.9
2.5
1.6
1.6
1.5
1.6
3.7
1.5
0.3
0.5
1.5
–1.4
–0.2
–0.1
0.1
1.1
–0.3
0.6
0.9
0.9
1.5
0.3
1.3
10.3
1.6
1.8
0.9
0.6
10.4
2.3
1.9
1.4
1.4
10.1
2.4
1.8
1.1
1.0
7.4
8.5
5.0
26.5
13.9
7.2
8.4
5.1
24.8
13.1
7.0
8.2
5.0
22.1
12.6
Ireland
Finland
Slovak Republic
Lithuania
Slovenia
4.8
–0.1
2.4
2.9
2.6
3.9
0.8
2.9
2.8
2.1
3.3
1.4
3.3
3.2
1.9
0.3
1.2
–0.1
0.2
0.2
0.2
0.6
0.0
–0.3
–0.4
1.5
1.6
1.4
2.0
0.7
6.2
–0.6
0.2
–0.4
5.8
4.9
–0.3
0.4
0.2
7.1
4.8
–0.3
0.4
–0.8
6.5
11.3
8.6
13.2
10.7
9.8
9.8
8.7
12.4
10.6
9.0
8.8
8.5
11.7
10.5
8.3
Luxembourg
Latvia
Estonia
Cyprus
Malta
2.9
2.4
2.1
–2.3
3.5
2.5
2.3
2.5
0.2
3.2
2.3
3.3
3.4
1.4
2.7
0.7
0.7
0.5
–0.3
0.8
0.5
0.5
0.4
–1.0
1.1
1.6
1.7
1.7
0.9
1.4
5.2
–3.1
–0.1
–1.9
2.7
4.7
–2.2
–0.4
–1.9
3.1
4.6
–3.0
–0.7
–1.4
3.1
7.1
10.8
7.0
16.2
5.9
6.9
10.4
7.0
15.9
6.1
6.7
10.2
6.8
14.9
6.3
United Kingdom5
Switzerland
Sweden
Norway
Czech Republic
2.6
2.0
2.1
2.2
2.0
2.7
0.8
2.7
1.0
2.5
2.3
1.2
2.8
1.5
2.7
1.5
0.0
–0.2
2.0
0.4
0.1
–1.2
0.2
2.3
–0.1
1.7
–0.4
1.1
2.2
1.3
–5.5
7.0
6.3
8.5
0.6
–4.8
5.8
6.3
7.6
1.6
–4.6
5.5
6.3
7.0
0.9
6.2
3.2
7.9
3.5
6.1
5.4
3.4
7.7
3.8
6.1
5.4
3.6
7.6
3.9
5.7
1.0
1.8
–1.0
1.6
3.5
1.0
2.0
3.2
1.1
0.6
2.0
1.1
0.8
0.9
0.4
1.6
2.1
0.9
6.3
4.7
...
6.1
6.1
...
5.5
4.7
...
6.5
5.0
8.7
6.2
4.0
8.4
5.5
4.0
7.9
2.8
2.9
3.3
2.9
2.9
3.1
3.5
2.7
3.2
3.6
3.5
2.9
3.8
8.9
0.0
1.1
2.7
6.6
–0.8
1.0
3.7
6.5
1.2
2.4
–2.9
–5.7
–1.2
–0.5
–2.4
–4.2
–1.8
–1.1
–3.0
–4.8
–2.4
–1.5
...
9.9
9.0
6.8
...
11.4
8.0
6.7
...
11.6
7.7
6.7
3.6
1.7
–1.8
–0.4
2.7
1.2
–0.5
0.5
2.3
1.5
1.5
1.0
–0.3
–1.6
2.1
–0.2
0.0
–1.0
2.7
–0.9
2.3
0.6
4.0
0.9
4.2
0.0
–6.0
0.7
4.8
0.2
–4.7
2.2
4.1
–0.8
–4.7
2.0
7.8
11.5
19.7
17.1
7.6
10.9
20.7
17.3
7.4
10.3
22.0
16.9
Europe
Denmark
Iceland
San Marino
Emerging and Developing Europe6
Turkey
Poland
Romania
Hungary
Bulgaria5
Serbia
Croatia
Note: Data for some countries are based on fiscal years. Please refer to Table F in the Statistical Appendix for a list of economies with exceptional reporting periods.
in consumer prices are shown as annual averages. Year-end to year-end changes can be found in Tables A6 and A7 in the Statistical Appendix.
2Percent of GDP.
3Percent. National definitions of unemployment may differ.
4Excludes Lithuania. Current account position corrected for reporting discrepancies in intra-area transactions.
5Based on Eurostat’s harmonized index of consumer prices.
6Includes Albania, Bosnia and Herzegovina, Kosovo, FYR Macedonia, and Montenegro.
1Movements
priority in Sweden and the United Kingdom. Internationally, the broader financial sector reform agenda should
be completed, including reforms dealing with large and
systemically important banks and those enhancing crossborder resolution mechanisms. Labor market reforms are
needed in Sweden to accelerate and sustain the transition
of vulnerable groups to employment.
Emerging and Developing Europe: Slower Growth amid
Weak External Demand
Economic activity softened in emerging and developing Europe last year, and more countries slipped
into deflation. Lower oil prices this year will boost
growth somewhat but will add to disinflation pres-
International Monetary Fund | April 201551
WORLD ECONOMIC OUTLOOK: UNEVEN GROWTH—SHORT- AND LONG-TERM FACTORS
Figure 2.4. Emerging and Developing Europe: Slower Growth
amid Weak External Demand
Economic activity slowed in 2014, but it remained solid in Hungary and Poland,
with private consumption becoming the key growth driver amid improving labor
market conditions. Inflation declined further, except in Turkey, on low euro area
inflation, remaining economic slack, and lower energy and food prices.
8 1. Hungary and Poland: Real
GDP Growth (Year-over6
year percent change)
4
2. SEE: Real GDP Growth
(Year-over-year percent
change)
2
0
–2
Consumption
Investment
–4
Net exports
–6
2010 11
12 13
14:
Q4
104 3. Employment
(Index, 2008:Q1 = 100)
102
GDP
growth
100
98
96
GDP
growth
2010 11
Consumption
Investment
Net exports
12 13
4. Headline Inflation
(Year-over-year percent
change)
HUN
POL
HRV
BIH
BGR
TUR
MNE
HUN, POL
SEE
94
20
16
12
8
4
0
92
90
14:
Q4
10
8
6
4
2
0
–2
–4
–6
–8
–10
–4
Feb.
15
220
18 5. Core CPI Inflation
(Year-over-year percent
200
15
change)
180
12
HUN
POL
160
9
140
HRV
ROU
6
BGR
TUR
120
3
100
0
80
HRV, SRB, TUR
VIX
–3
60
Jan.
July
Jan.
July
Feb. Jan. July Jan. July
Mar.
2013
13
14
14
15 2013
13
14 14
15
8. Turkey: Net Capital Flows 60
60 7. Hungary, Poland, and
SEE: Net Capital Flows2
(Billions of U.S. dollars)
50
50
(Billions of U.S. dollars)
FDI
Portfolio inv.
40
40
Total
Other inv.
FDI
Portfolio inv.
30
30
Total
Other inv.
20
20
10
10
0
0
–10
–10
–20
–20
2011
12
13
14:
2011
12
13
14:
Q4
Q4
Sources: Bloomberg, L.P.; European Bank for Reconstruction and Development;
Haver Analytics; and IMF staff calculations.
Note: Southeastern Europe (SEE) includes Albania, Bosnia and Herzegovina,
Bulgaria, Croatia, Kosovo, FYR Macedonia, Montenegro, Romania, and Serbia,
wherever data are available. All country group aggregates are weighted by GDP
valued at purchasing power parity as a share of group GDP, unless noted
otherwise. Data labels in the figure use International Organization for
Standardization (ISO) country codes. CPI = consumer price index; EMBIG = J.P.
Morgan Emerging Markets Bond Index Global; FDI = foreign direct investment;
inv. = investment.; VIX = Chicago Board Options Exchange Market Volatility Index.
1Data are through March 27, 2015.
2Data for 2014:Q4 include Bulgaria, Hungary, FYR Macedonia, Montenegro, Poland
(monthly), Romania, and Serbia.
2008 09 10 11 12 13
52
14: Jan.
July
Jan.
July
Q4 2013
13
14
14
6. EMBIG Spreads1 (Index,
May 21, 2013 = 100;
simple average)
BGR, HUN,
POL, ROU
International Monetary Fund | April 2015
sures. External demand remains subdued, and high
corporate debt continues to weigh on investment.
Monetary policy space, where available, should be
used to support domestic demand, while countries
with weak fiscal positions should shore up sustainability to counter risks of potential market volatility.
Economic growth slowed in Turkey and southeastern Europe (where some countries entered recession)
last year, but remained strong in Hungary and Poland
(Figure 2.4). Growth was generally driven by domestic
demand (except in Turkey), largely reflecting stronger private consumption as labor market conditions
improved and real wages rose with lower imported
inflation.
Headline and core inflation continued to decline
on account of very low inflation in the euro area,
lower food and energy prices, and economic slack.
Hungary and Poland joined other countries in deflation, but inflation remained high in Turkey as a result
of exchange rate depreciation, monetary easing, and
increased domestic food prices.
Lower oil prices are expected to provide a lift to the
region, offsetting the effects of weak euro area growth,
recession in Russia, and still-elevated corporate debt
(Table 2.2):
•• Growth in Hungary is forecast to soften in 2015 to
2.7 percent, on account of lower investment growth
and less supportive fiscal conditions. Growth in
Poland is projected to increase to 3.5 percent in
2015, supported by domestic demand and improved
economic conditions in trading partners.
•• Turkey’s growth is expected to average 3.1 percent
in 2015–16, up from 2.9 percent in 2014, as private
consumption gets a lift from lower energy prices. The
current account deficit will narrow further thanks to a
substantial fall in the value of energy imports.
•• Growth in southeastern Europe is projected to
improve in 2015–16, driven by rebuilding of flooddamaged areas in Bosnia and Herzegovina and
Serbia, and by employment gains elsewhere.
Risks remain tilted to the downside. A deeper recession in Russia or a slowdown in the euro area poses
external demand risks, while sudden increases in the
U.S. term premium and U.S. dollar fluctuations could
trigger market volatility in countries whose fiscal and
external deficits are still sizable. The ECB’s quantitative
easing could have a more positive effect if the impact
on euro area growth and inflation is larger. Tailwinds
from lower oil prices pose some upside risks to activity.
CHAPTER 2 COUNTRY AND REGIONAL PERSPECTIVES
Supporting domestic demand remains a priority,
especially in countries with strong links to the euro
area. Many economies need to maintain easy monetary
conditions while fiscal buffers are gradually rebuilt.
•• Monetary policy should remain accommodative in
Poland and Romania, given the benign inflation
outlook and quantitative easing in the euro area.
Hungary, with output still below potential and persistent disinflation pressures, has scope for further
cautious monetary policy easing. In Turkey, further
easing of monetary conditions should be considered
only once inflation expectations are anchored at the
target rate and the real interest rate is clearly in positive territory.
•• In a number of countries, elevated public debt
and high fiscal deficits highlight the need for fiscal consolidation, including via spending restraint
(Hungary, Serbia) and restructuring of key stateowned enterprises (Serbia). Public investment can
be brought forward to offset the drag from planned
near-term fiscal tightening, as envisaged in Poland
and Romania, supported by higher absorption of
European Union funds. A tighter fiscal stance in
Turkey—as envisaged in the new medium-term
program—will contribute to gradually narrowing
external imbalances and will reduce pressure on
monetary policy.
•• Making progress in tackling the large stock of
nonperforming loans is a priority for most countries.
Improving legal and tax treatment of loan writeoffs—as recently adopted in Albania—and further
strengthening debt restructuring and bank resolution frameworks are crucial.
Asia and Pacific: Moderating but Still
Outperforming Other Regions
Asia’s growth is forecast to hold steady in 2015, and
the region is expected to continue outperforming the rest
of the world over the medium term. While the Chinese
economy is shifting to a more sustainable pace, growth
is projected to pick up elsewhere in the region. This
reflects the boost from lower world oil prices, strengthening external demand, and still-accommodative financial conditions despite some recent tightening. Risks
are two sided, but downside risks dominate. Elevated
household and corporate debt amid higher real interest rates and a strong U.S. dollar could amplify shocks.
Growth risks from within the region are also on the
rise, and realignments of the major reserve currencies
could create an uncomfortable trade-off between financial stability and competitiveness. Policymakers should
maintain prudent frameworks and build buffers to
enhance resilience, and implement reforms to support
demand rebalancing and relieve bottlenecks to growth.
Although the Asia and Pacific region remained the
world’s growth leader, activity in the region slowed
modestly in 2014, responding to the drag from within
and outside the region. Growth decelerated last year to
5.6 percent, from 5.9 percent in 2013. While growth
picked up across much of the region, slowdowns in
several large economies, including China, Indonesia,
and Japan, provided a counterweight. Export volume
growth declined, reflecting soft demand in China, the
euro area, and Japan, which more than offset buoyancy in the United States (Figure 2.5). Investment was
generally slower, especially in China, where the correction in real estate gathered pace. Consumption, which
remained relatively robust except in Japan, was the
primary growth driver across most of the region.
In 2015, the sharp fall in world commodity prices
will support GDP growth across the region. With the
region being a net oil importer, the drop in oil prices will
generate a windfall spur to purchasing power of about
1.7 percent of regional GDP in 2015, providing support to domestic spending and raising current accounts.
Exporters of commodities (Australia, Indonesia, Malaysia, New Zealand) will see a drop in foreign earnings
and a drag on growth, although currency depreciation
will offer some cushion. Headline inflation—already
on a downward trend on cooling growth and stronger
trade-weighted exchange rates—is expected to moderate
further as the recent oil price decline is felt at the pump,
although core inflation has eased only modestly.
Accommodative financial conditions have begun
to tighten. Private-credit-to-GDP ratios are significantly above trend in some countries. Sizable portfolio
outflows, slower corporate debt issuance (especially in
emerging Asia), and rising short-term market interest rates since the last quarter of 2014 are in line with
global trends and reflect expectations of higher policy
rates in the United States. In addition, real short-term
interest rates have risen marginally with easing core
inflation, while U.S. dollar appreciation has increased
debt service costs for the region’s unhedged issuers of
foreign-exchange-denominated corporate bonds. For
households, higher real debt service costs could crimp
consumption spending. Bank lending is expanding at
a somewhat slower pace (albeit a still-buoyant one in
International Monetary Fund | April 201553
WORLD ECONOMIC OUTLOOK: UNEVEN GROWTH—SHORT- AND LONG-TERM FACTORS
Figure 2.5. Asia and Pacific: Moderating but Still
Outperforming
Asia is forecast to remain the global growth leader, although the region’s growth
momentum is moderating. Financial conditions have only recently started to tighten
and have supported domestic demand, but exports have slowed. Inflation has
dropped on the back of lower fuel and food prices, and high-frequency indicators
point to a moderation in growth.
2. Nonfinancial Corporate
Sector Debt Issuance2
(Percent of GDP)
2012
2013
2014
2005–08 average
40 1. Equity and Bond Funds,
Monthly Net Flows1
30
(Billions of U.S. dollars)
20
10
0
–10
20
15
10
Peak, 2006–07
Equity funds
Bond funds
–20
–30
25
2010 11
12
13
5
Feb.
15
90 3. Selected Asia: Exports to
Major Destinations3
75
(Three-month moving
60
average)
To JPN
To CHN
To USA
45
To euro area
30
15
0
13 Jan. 2011
15
13 Jan.
15
3 5. Contributions to Change in
Headline Inflation in 2014
2
(Percent)
1
0
–1
–2
Contribution from food
Contribution from fuel
–3
Contribution from other
–4
prices
–5
Change in headline
–6
inflation rate
–7
IND SGP THA CHN MYS TWN HKG
VNM PHL AUS NZL KOR IDN JPN
0
80 4. Selected Asia:
60
Industrial Production
and PMI Manufacturing 40
70
60
20
50
0
40
–20
30
–15
–30
2011
TWN IDN KOR CHN MYS NZL HKG
PHL IND JPN THA AUS SGP
20
PMI manufacturing
IP (right scale)
2005 07
09
11
–40
–60
13 Feb.
15
6. Real Policy Rates4
(Percent)
June 2014: inflation
expectation based
Latest: inflation expectation
based
June 2014: core based
Latest: core based
12
10
8
6
4
2
0
–2
JPN AUS KOR TWN CHN IND
VNM THA MYS PHL NZL IDN
–4
Sources: CEIC; Dealogic; Haver Analytics; and IMF staff estimates.
Note: IP = industrial production; PMI = purchasing managers’ index. Data labels in
the figure use International Organization for Standardization (ISO) country codes.
1
Data include exchange-traded fund flows and mutual fund flows for Australia,
emerging Asia, Hong Kong SAR, Korea, New Zealand, Singapore, and Taiwan
Province of China.
2
Data include both bond issuance and syndicated loan issuance. Data are compiled
on residency basis.
3
Selected Asia comprises East Asia (China, Hong Kong SAR, Korea, Taiwan Province
of China), Japan, Malaysia, the Philippines, Singapore, and Thailand. Indonesia and
Vietnam are excluded because of data lags.
4
Data are as of March 2015. Core inflation used for the latest core-based rate is as
of February 2015 or latest available.
54
International Monetary Fund | April 2015
major economies), with rising loan-to-deposit ratios
possibly portending additional slowing.
Despite the tailwind from oil prices, Asia’s near-term
growth outlook has been marked down slightly. Downward growth revisions for major emerging markets
outside Asia will soften the external contribution to
Asia’s growth, as will the further tightening of international financial conditions. A slower but more sustainable growth path in China will exert additional drag.
Relative to the October 2014 WEO, Asia’s growth
forecast has been trimmed very modestly to 5.6 and
5.5 percent in 2015 and 2016, respectively, but with
diverse performances across the region (Table 2.3):
•• In China, growth fell to 7.4 percent in 2014 and
is expected to fall further to 6.8 percent in 2015
(0.3 percentage point lower than the October 2014
WEO forecast) as previous excesses in real estate,
credit, and investment continue to unwind. Ongoing implementation of structural reforms and lower
commodity prices are expected to expand consumeroriented activities, partially buffering the slowdown.
•• In Japan, activity disappointed following the mid2014 consumption tax hike, which caused a sharperthan-predicted contraction in consumption. GDP
growth is projected to pick up to 1 percent in 2015
(above potential and broadly unchanged from the
October 2014 WEO forecast) from –0.1 percent in
2014. This increase reflects support from the weaker
yen, higher real wages, and higher equity prices
due to the Bank of Japan’s additional quantitative
and qualitative easing, as well as lower commodity
prices. By 2016, with output above potential, the
pace of growth is expected to help push up underlying price and wage inflation.
•• India’s growth is expected to strengthen from 7.2
percent in 2014 to 7.5 percent in 2015. Growth will
benefit from recent policy reforms, a consequent
pickup in investment, and lower oil prices. Lower
oil prices will raise real disposable incomes, particularly among poorer households, and help drive down
inflation.
•• The downturn in the global commodity cycle is
continuing to hit Australia’s economy, exacerbating the long-anticipated decline in resource-related
investment. However, supportive monetary policy
and a somewhat weaker exchange rate will underpin
nonresource activity, with growth gradually rising in
2015–16 to about 3 percent (broadly as projected in
the October 2014 WEO).
CHAPTER 2 COUNTRY AND REGIONAL PERSPECTIVES
Table 2.3. Asian and Pacific Economies: Real GDP, Consumer Prices, Current Account Balance, and Unemployment
(Annual percent change, unless noted otherwise)
Consumer Prices1
Real GDP
Projections
Current Account Balance2
Projections
Unemployment3
Projections
Projections
2014
2015
2016
2014
2015
2016
2014
2015
2016
2014
2015
2016
5.6
5.6
5.5
3.2
2.6
2.8
1.6
2.4
2.2
...
...
...
1.6
–0.1
3.3
2.7
3.7
2.9
2.2
1.0
3.3
2.8
3.8
3.0
2.4
1.2
3.5
3.2
4.1
3.0
2.2
2.7
1.3
2.5
1.2
1.0
1.2
1.0
1.5
2.0
0.7
0.0
1.6
0.9
2.5
2.3
1.3
1.7
2.2
0.5
6.3
–2.8
12.3
19.1
3.1
1.9
7.1
–4.0
12.4
20.7
2.8
2.0
5.2
–3.7
11.7
18.8
3.8
3.6
3.5
6.1
4.0
2.0
3.9
3.7
3.6
6.4
4.0
2.0
3.9
3.7
3.5
6.2
4.0
2.0
Hong Kong SAR
New Zealand
2.3
3.2
2.8
2.9
3.1
2.7
4.4
1.2
3.2
0.8
3.4
2.1
1.6
–3.5
2.0
–4.8
2.2
–5.2
3.2
5.4
3.2
5.3
3.1
5.2
Emerging and Developing Asia
China
India
6.8
7.4
7.2
6.6
6.8
7.5
6.4
6.3
7.5
3.5
2.0
6.0
3.0
1.2
6.1
3.1
1.5
5.7
1.3
2.0
–1.4
2.1
3.2
–1.3
2.0
3.2
–1.6
...
4.1
...
...
4.1
...
...
4.1
...
ASEAN-5
Indonesia
Thailand
Malaysia
Philippines
Vietnam
4.6
5.0
0.7
6.0
6.1
6.0
5.2
5.2
3.7
4.8
6.7
6.0
5.3
5.5
4.0
4.9
6.3
5.8
4.7
6.4
1.9
3.1
4.2
4.1
4.1
6.8
0.3
2.7
2.1
2.5
4.2
5.8
2.4
3.0
2.8
3.2
1.3
–3.0
3.8
4.6
4.4
5.4
1.1
–3.0
4.4
2.1
5.5
4.8
0.6
–2.9
2.4
1.4
5.0
4.9
...
6.1
0.8
2.9
6.8
2.5
...
5.8
0.8
3.0
6.2
2.5
...
5.6
0.8
3.0
6.0
2.5
Other Emerging and Developing Asia4
6.4
6.7
6.7
5.9
5.5
5.7
–2.5
–2.7
–2.7
...
...
...
6.8
6.6
6.4
3.4
2.9
3.0
1.4
2.2
2.1
...
...
...
Asia
Advanced Asia
Japan
Korea
Australia
Taiwan Province of China
Singapore
Memorandum
Emerging Asia5
Note: Data for some countries are based on fiscal years. Please refer to Table F in the Statistical Appendix for a list of economies with exceptional reporting periods.
1Movements in consumer prices are shown as annual averages. Year-end to year-end changes can be found in Tables A6 and A7 in the Statistical Appendix.
2Percent of GDP.
3Percent. National definitions of unemployment may differ.
4Other Emerging and Developing Asia comprises Bangladesh, Bhutan, Brunei Darussalam, Cambodia, Fiji, Kiribati, Lao P.D.R., Maldives, Marshall Islands, Micronesia, Mongolia, Myanmar,
Nepal, Palau, Papua New Guinea, Samoa, Solomon Islands, Sri Lanka, Timor-Leste, Tonga, Tuvalu, and Vanuatu.
5Emerging Asia comprises the ASEAN-5 (Indonesia, Malaysia, Philippines, Thailand, Vietnam) economies, China, and India.
•• Korea’s growth momentum has stalled somewhat,
reflecting fragile household and investor sentiment.
The projected growth of 3.3 percent this year rests
on the assumption that supportive monetary and
macroprudential policies and more favorable terms
of trade spur a rebound in aggregate demand.
•• Trends within the Association of Southeast Asian
Nations will continue to diverge. Indonesia’s
growth is forecast to remain broadly unchanged
in 2015 (though this is lower than previously
projected), but to rise in 2016 as reforms are
implemented. Malaysia’s growth is expected to
slow this year (to 4.8 percent) on weaker terms of
trade. Thailand’s outlook is expected to improve on
greater clarity on near-term policies, and growth
in the Philippines has been revised upward to 6.7
percent in 2015 on stronger consumption from the
oil price windfall.
•• As a group, Asia’s other emerging and developing
economies are projected to see a pickup in growth, but
with variation across countries. In Papua New Guinea,
the coming on stream of a large natural gas project
will provide a one-time boost to growth. Activity in
the Pacific island countries and other small states is
also expected to be robust. On the other hand, low
commodity prices will curtail Mongolia’s growth.
Downside risks continue to dominate the growth
outlook, including the following:
•• Slower growth in China and Japan—Significantly
slower growth than currently projected for China or
Japan would also affect the rest of the region and the
world economy given these economies’ large size and
deep trade and financial linkages with other nations.
For China, the main risk is failure to implement the
reform agenda to address financial risks, rebalance the
economy, and tap new sources of growth. In Japan,
the challenge is to implement structural reforms to
boost medium-term growth prospects while balancing
near-term fiscal stimulus with a convincing mediumterm consolidation plan. Asia’s medium-term growth
International Monetary Fund | April 201555
WORLD ECONOMIC OUTLOOK: UNEVEN GROWTH—SHORT- AND LONG-TERM FACTORS
prospects are also critically dependent on the success
of these reform strategies.
•• Persistent U.S. dollar strength against the euro and
yen—Sustained realignments of the major reserve
currencies brought about by asynchronous monetary
policies could pose a growth risk to Asia through
trade and balance sheet channels. Asian emerging markets whose firms borrowed heavily in U.S.
dollars may need to find an appropriate balance
between preserving financial stability (via moving
their currency in tandem with the U.S. dollar) and
maintaining external competitiveness (by stabilizing their exchange rate against major trade partners
and competitors). This process could also trigger a
cascade of disruptive adjustments.
•• Side effects from global financial conditions—
Increased leverage by households and firms within
Asia spurred by accommodative global financial
conditions increases sensitivity to changes in monetary policy abroad. Higher debt-servicing costs and
reduced rollover rates would affect corporate profitability and investment and could pose a significant
drag on household consumption, particularly if
accompanied by a drop in house prices.
Policies should remain focused on maintaining prudent frameworks and boosting resilience and potential
growth:
•• Monetary policy should not respond to the decline
in headline inflation from the drop in oil prices.
However, loosening is called for if the effect of
lower oil prices is transmitted to core inflation
or inflation expectations. To date, moderating
prices are apparent only in narrow categories of
the consumer basket. However, in economies in
which output gaps are currently negative (Australia,
Japan, Korea, Thailand), policymakers may need
to act to prevent a persistent decline in inflation
expectations.
•• On the fiscal policy front, and following the lead
of India, Indonesia, and Malaysia, countries should
seize the opportunity provided by the current low
fuel and food prices to further reform or phase out
subsidies, which tend to be poorly targeted. Doing
so would improve spending efficiency and shield
public spending from future oil price fluctuations.
Countries with elevated public debt (Japan, Malaysia) should continue to consolidate, with the conduct of fiscal policy attuned to economic conditions
and prospects. Asian emerging markets with large
infrastructure gaps should consider giving public
56
International Monetary Fund | April 2015
investment spending priority over easing monetary
policy.
•• Exchange rates should be permitted to respond to
shifts in balance of payments flows due to changes
in commodity prices and capital flows, including
from asynchronous monetary policies in advanced
economies. Foreign exchange intervention should
remain in the toolkit to address disorderly market
conditions, especially in cases in which overshooting
threatens financial stability.
•• In addition to strong regulation and supervision,
protecting financial stability may also require proactive use of macroprudential policies to tame the
effects of the financial cycle on asset prices, credit,
and aggregate demand.
•• Structural reforms are needed to restart productivity gains across the region. In China, financial
and state-owned enterprise reforms are needed
to increase the efficiency of resource allocation.
Reforms in the pension system and other social
safety net areas will help shift the composition of
growth toward domestic consumption, which is
likely to prove more sustainable in the long term. In
Japan, policy initiatives to raise services productivity and labor force participation should be further
implemented. For other countries, including India,
members of the Association of Southeast Asian
Nations, and most other emerging market and
developing economies, addressing supply bottlenecks
by expanding essential infrastructure and raising
productivity would increase near-term demand
and support resilience to realignments of reserve
currencies.
Latin America and the Caribbean: Another Year
of Subpar Growth
Growth in Latin America and the Caribbean slowed
to 1.3 percent in 2014 and is projected to soften to
an even lower rate in 2015. The downturn in global
commodity markets remains the main drag on activity
in South America, even though lower oil prices and a
solid U.S. recovery provide a boost to other parts of the
region. Low business and consumer confidence in Brazil
and the intensifying economic crisis in Venezuela weigh
further on the near-term outlook. Flexible exchange rates
can play a critical role in adapting to tougher external
conditions, but policymakers will also need to ensure
prudent fiscal positions are in place and catch up on
structural reforms to raise investment and productivity.
CHAPTER 2 COUNTRY AND REGIONAL PERSPECTIVES
Figure 2.6. Latin America and the Caribbean: Persistent
Weakness
Growth in Latin America and the Caribbean has slowed further as falling commodity
prices have hit the region’s commodity exporters. External current account deficits
have continued to widen in most countries in the region, although the recent
collapse in oil prices has provided relief to net importers, notably in Central America
and the Caribbean. Lower oil prices should also assist disinflation, but their effects
will be partly offset by weaker exchange rates, which are playing a crucial role in
facilitating external adjustment.
14 2. LA6: Current Account 200
and Terms of Trade
12
180
10 Current account balance
8 (percent of GDP; left scale) 160
6 Terms of trade
140
4 (index, 2000 =
100)
2
120
0
100
–2
–4
80
2000 04
08
12
16
4. LA6: 12-Month CPI Inflation 8
Minus Inflation Target
6
(Percent)
4
2
0
0
–10
9.0
8.5
8.0
7.5
BRA
MEX
URY
Average: CHL, COL, PER
100
7.0
90
6.5
80
6.0
5.5
Jan. July Jan. July
13
13 14
14
–4
14 Feb.
15
6. Change in Exchange Rate vs.
Change in Net Commodity
Price Index since April 30,
20
20134
Latin American
10
economies
0
–10
–20
Others –30
–40
–50
–6 –3 0 3 6 9
Change in net commodity
price index (percent)
2011
5. Latin America: Financial
Markets3
Yield on external bonds 130
(percent; left scale)
120
Equity index
Currency index
110
70
Mar.
15
–2
12
13
Change in bilateral U.S. dollar
exchange rate (percent)
25 1. LA6: Contributions to Real
GDP Growth1 (Year-over20
year percent change)
15
10
5
0
–5
Consumption
Investment
–10
Inventories
Net exports
–15
GDP growth
–20
2008 09 10 11 12 13 14:
Q4
40 3. Net Oil Exports, 2014 2
(Percent of GDP)
Central America
30
Caribbean, commodity
exporters
20
Caribbean, tourism
dependent
10
VEN
BOL
ECU
COL
BRA
PER
ARG
CHL
URY
PRY
Growth in Latin America and the Caribbean
declined for the fourth consecutive year, to 1.3 percent
in 2014, coming close to the October 2014 WEO projection (Figure 2.6). Investment continued to lead the
downturn, as subdued external demand and worsening terms of trade caused companies to curtail capital
budgets, notably in South America. In some countries,
policy uncertainties intensified weak private sector sentiment. Falling commodity prices also prompted further
widening of external current account deficits in most
commodity-exporting economies, although net importers benefited from the sharp decline in oil prices.
Currencies in countries with flexible exchange rates
reacted quickly to the shifting external outlook and
weaker domestic conditions, depreciating by about 10
percent on average in trade-weighted terms since the
end of August 2014 and in some cases by as much as
15–20 percent. Equity markets fell and external credit
spreads widened. Corporate bond issuance generally
held up, but companies exposed to the commodity
market have started to face tighter financing conditions. Credit growth has continued to slow.
With no apparent impulse for a near-term pickup
in activity and the prospect of persistently lower
commodity prices and reduced policy space in many
economies, regional growth is now projected to dip
below 1 percent in 2015 (about 1¼ percentage points
lower than projected in the October 2014 WEO), well
below the 4.1 percent average growth observed during
2004–13 (Table 2.4). Downward revisions are concentrated among South American commodity exporters.
Meanwhile, output remains close to potential, as evidenced by still-low unemployment in many economies.
•• Brazil’s economy is projected to contract by 1 percent in 2015—almost 2½ percentage points below
the October 2014 WEO forecast. Private sector
sentiment has remained stubbornly weak, even since
election-related uncertainty dissipated, reflecting
the risk of near-term electricity and water rationing,
unaddressed competitiveness challenges, and fallout
from the Petrobras investigation. The Brazilian
authorities’ renewed commitment to rein in the fiscal deficit and reduce inflation will help restore confidence in Brazil’s macroeconomic policy framework,
but it will further curb near-term demand.
•• Projections for the Andean economies are comparatively favorable but have also been pared down
since October—projected growth this year for Chile,
Colombia, and Peru is ½ to 1.3 percentage points
lower than in October. In Chile, uncertainty over
Sources: Bloomberg, L.P.; Haver Analytics; national authorities; and IMF staff
estimates.
Note: CPI = consumer price index; LA6 = Brazil, Chile, Colombia, Mexico, Peru,
Uruguay. Country group aggregates are weighted by purchasing-power-parity GDP
as a share of group GDP, unless noted otherwise. Data labels in the figure use
International Organization for Standardization (ISO) country codes.
1
Seasonally adjusted, purchasing-power-parity-weighted average. Inventories
include statistical discrepancies.
2
Data for Bolivia include natural gas exports. Simple average for Central America
(Belize, Costa Rica, El Salvador, Guatemala, Honduras, Nicaragua, Panama);
Caribbean, commodity exporters (Guyana, Suriname, Trinidad and Tobago); and
Caribbean, tourism dependent (The Bahamas, Barbados, Eastern Caribbean
Currency Union countries, Jamaica).
3
Yield on external bonds is based on the J.P. Morgan Emerging Markets Bond Index
for Latin America. Equity index is the MSCI Emerging Markets Latin America equity
local net total return index. Currency index is the Bloomberg J.P. Morgan Latin
America Currency Index. Both indices are rebased to January 2, 2013 = 100. Data
are through March 26, 2015.
4
Net commodity price index is based on Gruss 2014. Data are through the end of
February 2015.
International Monetary Fund | April 201557
WORLD ECONOMIC OUTLOOK: UNEVEN GROWTH—SHORT- AND LONG-TERM FACTORS
Table 2.4. Western Hemisphere Economies: Real GDP, Consumer Prices, Current Account Balance, and Unemployment
(Annual percent change, unless noted otherwise)
Consumer Prices1
Real GDP
Projections
Current Account Balance2
Projections
Unemployment3
Projections
Projections
2014
2015
2016
2014
2015
2016
2014
2015
2016
2014
2015
2016
North America
United States
Canada
Mexico
2.4
2.4
2.5
2.1
3.0
3.1
2.2
3.0
3.0
3.1
2.0
3.3
1.9
1.6
1.9
4.0
0.5
0.1
0.9
3.2
1.7
1.5
2.0
3.0
–2.3
–2.4
–2.2
–2.1
–2.3
–2.3
–2.6
–2.2
–2.4
–2.4
–2.3
–2.2
...
6.2
6.9
4.8
...
5.5
7.0
4.3
...
5.1
6.9
4.0
South America4
Brazil
Argentina5,6
Colombia
Venezuela
Chile
0.7
0.1
0.5
4.6
–4.0
1.8
–0.2
–1.0
–0.3
3.4
–7.0
2.7
1.3
1.0
0.1
3.7
–4.0
3.3
...
6.3
...
2.9
62.2
4.4
...
7.8
18.6
3.4
96.8
3.0
...
5.9
23.2
3.0
83.7
3.0
–2.9
–3.9
–0.9
–5.0
4.3
–1.2
–3.5
–3.7
–1.7
–5.8
–4.7
–1.2
–3.2
–3.4
–1.8
–4.9
–0.8
–2.0
...
4.8
7.3
9.1
8.0
6.4
...
5.9
7.0
9.0
12.8
7.2
...
6.3
8.1
8.9
16.1
7.0
Peru
Ecuador
Bolivia
Uruguay
Paraguay
2.4
3.6
5.4
3.3
4.4
3.8
1.9
4.3
2.8
4.0
5.0
3.6
4.3
2.9
4.0
3.2
3.6
5.8
8.9
5.0
2.5
3.2
5.1
7.9
3.6
2.0
3.0
5.0
7.5
4.5
–4.1
–0.8
0.7
–4.7
0.1
–4.6
–3.3
–2.8
–3.8
–1.7
–4.3
–3.0
–4.2
–4.1
–2.2
6.0
5.0
4.0
6.5
5.5
6.0
5.0
4.0
6.8
5.5
6.0
5.0
4.0
7.0
5.5
Central America7
4.0
4.2
4.3
3.4
2.6
3.3
–5.9
–5.0
–5.2
...
...
...
Caribbean8
4.7
3.7
3.5
4.0
3.3
4.2
–3.1
–2.4
–2.7
...
...
...
Memorandum
Latin America and the Caribbean9
Excluding Argentina
Eastern Caribbean Currency Union10
1.3
1.4
1.7
0.9
1.0
2.0
2.0
2.2
2.1
...
7.9
0.8
...
9.0
0.7
...
7.6
1.6
–2.8
–3.0
–15.8
–3.2
–3.4
–13.9
–3.0
–3.1
–14.5
...
...
...
...
...
...
...
...
...
Note: Data for some countries are based on fiscal years. Please refer to Table F in the Statistical Appendix for a list of economies with exceptional reporting periods.
in consumer prices are shown as annual averages. Year-end to year-end changes can be found in Tables A6 and A7 in the Statistical Appendix.
2Percent of GDP.
3Percent. National definitions of unemployment may differ.
4Includes Guyana and Suriname. See note 6 regarding consumer prices.
5The GDP data for Argentina are officially reported data as revised in May 2014. On February 1, 2013, the IMF issued a declaration of censure, and in December 2013 called on Argentina
to implement specified actions to address the quality of its official GDP data according to a specified timetable. On December 15, 2014, the Executive Board recognized the implementation
of the specified actions it had called for by end-September 2014 and the initial steps taken by the Argentine authorities to remedy the inaccurate provision of data. The Executive Board will
review this issue again as per the calendar specified in December 2013 and in line with the procedures set forth in the Fund’s legal framework.
6Consumer price data from December 2013 onwards reflect the new national CPI (IPCNu), which differs substantively from the preceding CPI (the CPI for the Greater Buenos Aires Area,
CPI-GBA). Because of the differences in geographical coverage, weights, sampling, and methodology, the IPCNu data cannot be directly compared to the earlier CPI-GBA data. Because of
this structural break in the data, the average CPI inflation for 2014 is not reported in the April 2015 World Economic Outlook. Following a declaration of censure by the IMF on February 1,
2013, the public release of a new national CPI by end-March 2014 was one of the specified actions in the IMF Executive Board’s December 2013 decision calling on Argentina to address
the quality of its official CPI data. On December 15, 2014, the Executive Board recognized the implementation of the specified actions it had called for by end-September 2014 and the steps
taken by the Argentine authorities to remedy the inaccurate provision of data. The Executive Board will review this issue again as per the calendar specified in December 2013 and in line
with the procedures set forth in the Fund’s legal framework.
7Central America comprises Belize, Costa Rica, El Salvador, Guatemala, Honduras, Nicaragua, and Panama.
8The Caribbean comprises Antigua and Barbuda, The Bahamas, Barbados, Dominica, the Dominican Republic, Grenada, Haiti, Jamaica, St. Kitts and Nevis, St. Lucia, St. Vincent and the
Grenadines, and Trinidad and Tobago.
9Latin America and the Caribbean comprises Mexico and economies from the Caribbean, Central America, and South America. See also note 6.
10Eastern Caribbean Currency Union comprises Antigua and Barbuda, Dominica, Grenada, St. Kitts and Nevis, St. Lucia, and St. Vincent and the Grenadines as well as Anguilla and Montserrat, which are not IMF members.
1Movements
the impact of policy reforms appears to be weighing
on investment, although there are signs that growth
has started to recover. In the case of Peru, weak
exports and investment caused a sharp slowdown in
2014, but concerted policy action and new mining
operations should support a rebound this year. In
Colombia, lower oil prices will cause growth to dip
below 4 percent.
•• Argentina’s growth is projected to be slightly negative in 2015, with stronger public spending and
higher private consumption partly offsetting falling
58
International Monetary Fund | April 2015
investment and exports. In Venezuela, the oil price
collapse has compounded an already difficult situation. Pervasive administrative controls and other
policy distortions have intensified shortages of basic
goods, driven up inflation to above 60 percent in
2014, and caused a deep recession.
•• Mexico’s economy is projected to grow by 3 percent
this year—a solid prospect, though lower than previously expected, as lingering sluggishness in domestic
demand and a tighter fiscal stance dampen the positive spillovers from stronger U.S. growth.
CHAPTER 2 COUNTRY AND REGIONAL PERSPECTIVES
•• On the bright side, lower oil prices and the robust
U.S. recovery have improved the outlook for Central
America. Remittances grew 9 percent in 2014
and, together with stronger exports, will continue
to underpin domestic activity and facilitate the
important task of strengthening fiscal positions in a
number of countries.
•• Similarly, the tourism-dependent economies of the
Caribbean have started to see a recovery in tourist
arrivals. Nonetheless, long-standing competitiveness
gaps, high public debt, and financial sector fragilities
remain pressing concerns.
Risks around this subdued outlook are considerable
and somewhat weighed to the downside. Activity in
the region’s commodity exporters might weaken further
in the face of adverse shocks, notably a sharper-thanexpected investment slowdown in China. To be sure,
further declines in commodity prices would bolster
net importers, especially in Central America and the
Caribbean. The caveat is that many of these economies
currently obtain concessional financing from Venezuela
on part of their oil imports. A possible curtailment of
this Petrocaribe support could put pressure on public
finances in some of these countries.
Lackluster economic prospects, along with an
impending rise in U.S. interest rates, might also restrict
the availability of external funding and cause further
corrections in financial markets. This scenario could
put strains on some corporate borrowers, especially in
sectors facing sharply lower earnings and elevated leverage. On the upside, strong U.S. growth could provide
a larger-than-expected lift to trading partners in the
region.
A key risk in the medium term is protracted weakness in investment that would further reduce the
region’s potential growth. Misguided efforts to address
the current slowdown with excessive policy stimulus,
rather than by tackling supply-side bottlenecks and
competitiveness problems, could also undermine countries’ hard-won macroeconomic stability.
The principal challenge for the region, therefore, is
to manage the adjustment to a new external environment while preserving sound fundamentals and raising
potential growth.
Exchange rate flexibility can play a critical role in
absorbing adverse terms-of-trade shocks and rebalancing demand. The room for easing monetary policy is
limited: inflation generally exceeds midpoint targets,
and depreciating currencies will at least partly offset
the benign effect of lower commodity prices. Nonethe-
less, countries with well-anchored inflation expectations still have some flexibility to fine-tune their policy
stances in response to weak incoming data.
The weakening of public finances since the global
financial crisis constrains fiscal policy options in many
of the region’s countries. Commodity exporters with
solid buffers can still afford to smooth the ongoing
slowdown but will also need to avoid a lasting rise in
deficits. Many commodity importers, in turn, have
gained relief from declining fuel subsidy burdens and
should seize the opportunity to secure these gains by
moving toward market-based pricing.
Beyond such adjustments, the difficult current outlook underscores the urgency of supply-side reforms.
Enhancing growth prospects and sustaining poverty
reduction in a more challenging external environment
will require determined efforts to improve the business
environment, raise productivity, and increase saving
and investment.
Commonwealth of Independent States: Oil
Price Slump Worsens Outlook
The Commonwealth of Independent States region is
projected to slide into recession in 2015. For oil exporters, sharply lower oil prices and the significant contraction in Russia imply a much weaker outlook. For oil
importers, the benefits from lower oil prices will likely
be more than offset by domestic economic weaknesses
and spillovers from the contraction in Russia through
remittances, trade, and foreign direct investment.
The European economies of the Commonwealth
of Independent States slowed further in the second
half of 2014, with the contribution from private
consumption turning negative (Figure 2.7). Falling
oil prices on top of international sanctions compounded Russia’s underlying structural weaknesses,
undermining confidence and resulting in a significant
depreciation of the ruble, which added to inflation
pressures. In response, the Central Bank of Russia
hiked its policy rate by 750 basis points to 17 percent
in December, and the Russian authorities announced
various measures to normalize market conditions.
Contagion from ruble depreciation also spread to
other Commonwealth of Independent States countries. The recession in Ukraine deepened in 2014,
largely reflecting the economic impact of the conflict in the east. Since last October, pressure on the
hryvnia has increased substantially, contributing to
International Monetary Fund | April 201559
WORLD ECONOMIC OUTLOOK: UNEVEN GROWTH—SHORT- AND LONG-TERM FACTORS
Figure 2.7. Commonwealth of Independent States: Coping
with Geopolitical Risks and Lower Oil Prices
Russia and Ukraine are entering into recession amid high inflation as geopolitical
tensions and the oil price slump take their toll. Other Commonwealth of
Independent States (CIS) economies are also experiencing slowing growth and a
deteriorating fiscal stance on account of negative spillovers, particularly from
Russia.
12
10
8
6
4
2
0
–2
–4
–6
–8
–10
–12
1. European CIS: Real GDP
Growth1 (Quarter-overquarter percent change)
GDP growth
Private consumption
Public consumption
Investment
Net exports
2011
12
13
RUS
UKR
14:
Q3
60 3. European CIS: Capital
Flows
40
(Billions of U.S. dollars)
20
Total
0
Foreign direct
investment
–20
–40
–60
–80
35
30
2. Real GDP Growth
(Percent)
Other CIS energy
exporters
Other CIS energy
importers
Portfolio investment
Bank loans and other
2013: 13: 13: 13: 14: 14: 14:
Q1 Q2 Q3 Q4 Q1 Q2 Q3
5. Inflation
(Percent)
2014
2015
25
20
2004 06
08
10
12
14
2
260 4. Currency Depreciation
(Against U.S. dollar;
240
index, Jan. 2012 = 100)
220
RUS
KAZ
200
BLR
ARM
180
160
GEO
TKM
140
UKR (right scale)
MDA
500
450
400
350
300
250
200
120
100
150
100
80
Jan.
2013
July
13
Jan.
14
50
Mar.
15
July
14
6. Fiscal Balance 3
25
(Percent of fiscal year GDP)
20
Net energy exporters
excl. RUS
15
Net energy importers
10
15
5
10
0
CIS
RUS
5
0
24
20
16
12
8
4
0
–4
–8
–12
–16
16
UKR RUS KGZ AZE MDA KAZ
2004 06
BLR TJK UZB TKM ARM GEO
–5
08
10
12
14
–10
16
Sources: Bloomberg, L.P.; Haver Analytics; and IMF staff estimates.
Note: European CIS = Belarus, Moldova, Russia, Ukraine; non-European CIS =
Armenia, Azerbaijan, Georgia, Kazakhstan, Kyrgyz Republic, Tajikistan,
Turkmenistan, Uzbekistan. Net energy exporters excl. Russia = Azerbaijan,
Kazakhstan, Turkmenistan, Uzbekistan; net energy importers = Armenia, Belarus,
Georgia, Kyrgyz Republic, Moldova, Tajikistan, Ukraine. Data labels in the figure
use International Organization for Standardization (ISO) country codes.
1Moldova is excluded because of data limitations.
2Data are through March 27, 2015.
3Non-oil primary deficit for Russia, overall balance for net energy importers, and
general government net lending/borrowing for both CIS and net energy exporters
excluding Russia.
60
International Monetary Fund | April 2015
a drop in foreign exchange reserves and accelerating
inflation.
The outlook for the Commonwealth of Independent
States has deteriorated markedly, with a 2.6 percent
contraction now projected in 2015 (about 4 percentage points below the October 2014 WEO forecast)
and double-digit inflation projected in many countries
(Table 2.5). Growth in the Caucasus and Central Asia
is also expected to drop—from 5.3 percent in 2014
to 3.2 percent in 2015, a downward revision of 2.4
percentage points relative to the October 2014 WEO.
The decline is projected as a result of spillovers from
Russia (through remittances, trade, and foreign direct
investment) and lower export prices for oil, metals, and
minerals.
•• The oil price slump, tighter financial conditions,
international sanctions, and weaker confidence are
projected to result in a recession in Russia in 2015.
Output is expected to contract by 3.8 percent, a
downward revision of about 4¼ percentage points
compared with the October WEO forecast. In 2016,
the output contraction is projected to ease to 1.1
percent as falling inflation and some import substitution contribute to a modest recovery in demand.
•• Despite a recently announced government stimulus in Kazakhstan, lower oil prices and production
delays in the Kashagan oil field, as well as weakness in the global economy, are expected to keep
growth at 2.0 percent in 2015 (a downward revision
of almost 3 percentage points) and 3.1 percent in
2016.
•• Ukraine’s economy is expected to bottom out in 2015
as activity stabilizes with the recovery in consumer and
investor confidence and the commencement of reconstruction work. Output is still projected to decline
by 5.5 percent in 2015, marking some improvement
from the 6.8 percent contraction in 2014.
•• Armenia and Belarus are projected to enter into
recession in 2015, and Georgia’s growth will slow.
In all three economies, the downward turns reflect
spillovers from Russia. In Moldova, lower credit
growth together with lower exports and remittances
will result in a small GDP contraction this year.
Risks to the outlook are largely on the downside. A
prolonged period of uncertainty and the imposition
of more sanctions on Russia could further weaken
investment. Deterioration in bank and corporate balance sheets owing to the recent sharp depreciation of
national currencies across the region could pose financial stability risks. An earlier-than-expected rebound
CHAPTER 2 COUNTRY AND REGIONAL PERSPECTIVES
Table 2.5. Commonwealth of Independent States Economies: Real GDP, Consumer Prices, Current Account Balance, and
Unemployment
(Annual percent change, unless noted otherwise)
Consumer Prices1
Real GDP
Projections
2014
Commonwealth of Independent States4
2015
2016
Current Account Balance2
Projections
2014
2015
2016
Unemployment3
Projections
2014
2015
2016
Projections
2014
2015
2016
1.0
–2.6
0.3
8.1
16.8
9.4
2.2
2.5
3.7
...
...
...
Net Energy Exporters
Russia
Kazakhstan
Uzbekistan
Azerbaijan
Turkmenistan
1.5
0.6
4.3
8.1
2.8
10.3
–2.4
–3.8
2.0
6.2
0.6
9.0
0.1
–1.1
3.1
6.5
2.5
9.2
7.5
7.8
6.7
8.4
1.4
6.0
15.6
17.9
5.2
9.5
7.9
7.7
9.1
9.8
5.5
9.8
6.2
6.6
3.1
3.1
1.6
0.1
15.3
–5.9
3.4
5.4
–4.1
0.2
5.3
–11.1
4.6
6.3
–3.1
0.2
8.2
–6.7
...
5.1
5.2
...
6.0
...
...
6.5
5.2
...
6.0
...
...
6.5
5.2
...
6.0
...
Net Energy Importers
Ukraine5
Belarus
Georgia
Armenia
Tajikistan
–2.6
–6.8
1.6
4.7
3.4
6.7
–3.7
–5.5
–2.3
2.0
–1.0
3.0
1.6
2.0
–0.1
3.0
...
4.1
12.3
12.1
18.1
3.1
3.1
6.1
25.2
33.5
22.1
3.0
6.4
12.8
11.4
10.6
17.4
5.0
4.0
6.3
–5.7
–4.0
–6.1
–9.6
–9.2
–9.1
–5.2
–1.4
–7.0
–11.5
–8.6
–7.1
–4.2
–1.3
–4.2
–12.0
–8.6
–5.8
...
10.5
0.5
...
18.0
...
...
11.5
0.5
...
17.9
...
...
11.0
0.5
...
17.7
...
3.6
4.6
1.7
–1.0
3.4
3.0
7.5
5.1
10.7
7.5
8.6
6.3
–13.7
–5.5
–17.0
–4.5
–15.2
–5.4
7.6
4.0
7.5
4.5
7.4
4.3
5.3
6.7
5.4
3.2
4.2
3.4
4.2
5.0
4.4
5.8
6.9
5.9
6.9
8.7
6.9
6.6
8.2
6.7
1.7
–4.2
3.0
–3.4
–3.8
–2.6
–2.0
–3.6
–1.2
...
...
...
...
...
...
...
...
...
Kyrgyz Republic
Moldova
Memorandum
Caucasus and Central Asia6
Low-Income CIS Countries7
Net Energy Exporters Excluding Russia
Note: Data for some countries are based on fiscal years. Please refer to Table F in the Statistical Appendix for a list of economies with exceptional reporting periods.
1Movements in consumer prices are shown as annual averages. Year-end to year-end changes can be found in Table A7 in the Statistical Appendix.
2Percent of GDP.
3Percent. National definitions of unemployment may differ.
4Georgia, Turkmenistan, and Ukraine, which are not members of the Commonwealth of Independent States (CIS), are included in this group for reasons of geography and
similarity in economic structure.
5Starting in 2014 data exclude Crimea and Sevastopol.
6Caucasus and Central Asia comprises Armenia, Azerbaijan, Georgia, Kazakhstan, the Kyrgyz Republic, Tajikistan, Turkmenistan, and Uzbekistan.
7Low-Income CIS Countries comprise Armenia, Georgia, the Kyrgyz Republic, Moldova, Tajikistan, and Uzbekistan.
in oil prices confers some upside risks for oil exporters and also, via the beneficial impact on the Russian
economy, for oil importers in the Commonwealth of
Independent States.
With worsening economic conditions and significant
downside risks, a key priority is to preserve macroeconomic stability. For Russia, monetary policy tightening
and the central bank’s move to a floating exchange
rate regime ahead of schedule were appropriate. With
monetary policy constrained by above-target inflation
and financial stability concerns, and in light of Russia’s
large fiscal buffers, a limited loosening of the non-oil
structural balance in 2015 would be warranted. For
Ukraine, bolstering reserves and a tighter fiscal stance
remain appropriate. For Belarus, greater exchange rate
flexibility combined with tight macroeconomic policies
and deep structural reforms is needed to durably curb
inflation and reduce external imbalances.
Faced with adverse spillovers from Russia, countries
in the Caucasus and Central Asia should implement
countercyclical fiscal policy if fiscal space, available
financing, and the external position permit. These
countries should generally allow greater exchange rate
flexibility supported by appropriate macroeconomic and
structural policies and, if necessary, further depreciation
to minimize loss of reserves and the erosion of competitiveness. Increased exchange rate flexibility over time
would also help economies adjust to adverse shocks.
Tighter monetary policy may be needed to address inflation pressure resulting from currency depreciation.
In the medium term, most oil exporters will need to
recalibrate their fiscal consolidation plans, since the oil
shock is expected to persist. Priority should go to reining
in hard-to-reverse current expenditures, widening tax
bases, and strengthening tax administration. Growthenhancing spending on infrastructure, health, and
education as well as targeted social assistance should be
preserved where possible. Oil importers should resume
fiscal consolidation to rebuild buffers as soon as cyclical
conditions allow. Structural reforms in governance, cor
International Monetary Fund | April 201561
WORLD ECONOMIC OUTLOOK: UNEVEN GROWTH—SHORT- AND LONG-TERM FACTORS
ruption, education, and the financial sector need to be
stepped up to diversify economies, improve the business
climate, and enhance financial intermediation.
Figure 2.8. Middle East, North Africa, Afghanistan, and
Pakistan: Oil, Conflicts, and Transitions
Growth remained tepid across the Middle East, North Africa, Afghanistan, and
Pakistan (MENAP) in 2014 amid declining oil prices, intensifying conflicts, and
continued policy uncertainty. The steep decline in oil prices has weakened the
external and fiscal balances of the region’s oil exporters, while providing muchneeded breathing room for the oil importers. Across the region, lower oil prices
provide an opportunity for structural and subsidy reforms, which would create
fiscal space for growth-enhancing investments, improve competitiveness, and
support jobs and inclusive growth.
6
5
1. Overall Real GDP Growth
(Percent change)
4
3
MENAPOI
GCC
Non-GCC
2
1
0
2013
14
15
2. MENAPOE: Fiscal Balances 30
(Percent of GDP; dashed
25
lines are from the October
20
2014 WEO)
15
GCC
Non-GCC 10
5
0
–5
–10
16 2012 13 14 15 16 17 18 19
KWT
QAT
IRQ
OMN
LBY
SAU
ARE
DZA
BHR
IRN
YEM
SDN
AFG
EGY
JOR
PAK
TUN
DJI
MRT
LBN
MAR
30 3. External Gains and Losses
from Lower Oil Prices,
20
20151 (Percent of GDP)
10
0
–10
–20
–30
–40
–50
250 5. MENAPOE: Fiscal
Breakeven Prices, 2015
(U.S. dollars a barrel)
200
150
The Middle East, North Africa, Afghanistan, and
Pakistan: Oil, Conflicts, and Transitions
GCC
Non-GCC
World oil price
4. MENAPOE: Pretax Fuel
Subsidies, 2015 2
(Percent of GDP)
6
5
4
3
IRN LBY IRQ BHR YEM ARE
SAU DZA KWT OMN QAT
6. MENAPOI: Expenditure
(Percent of GDP; average)
Subsidies and transfers
Wages
Other
2
Oil-Exporting Economies
1
As a result of the steep decline in oil prices, oil
exporters in MENAP are experiencing large losses of
export and fiscal revenues (Figure 2.8). Most of the
region’s oil exporters are expected to avoid sharp cuts
in spending by drawing on their large buffers and
using available financing.
Growth is now projected to remain broadly
unchanged in 2015, at 2.4 percent, reflecting a downward revision of 1½ percentage points relative to the
October 2014 WEO, and pick up to 3.5 percent in
2016 (Table 2.6). More specifically:
• Growth forecasts for Saudi Arabia have been marked
down to 3.0 percent in 2015, 1½ percentage points
downward relative to the October 2014 WEO, and
to 2.7 percent in 2016. About half of the revisions
are due to a rebasing of real GDP data.1 With the
decline in oil prices, the fiscal balance in Saudi
Arabia will move into substantial deficit in 2015
and 2016.
• Growth in the Islamic Republic of Iran is projected
to be 0.6 percent in 2015 and 1.3 percent in 2016,
a downward revision from the October 2014 WEO
0
50
40
30
100
20
50
10
0
KWT IRQ IRN OMN DZA LBY
QAT ARE BHR SAU YEM
0
2013–14
2015–16
Sources: Haver Analytics; IMF, Information Notice System; International Energy
Agency; national authorities; and IMF staff estimates.
Note: Gulf Cooperation Council (GCC) = Bahrain, Kuwait, Oman, Qatar, Saudi Arabia,
United Arab Emirates; MENAP oil exporters (MENAPOE) = Algeria, Bahrain, Islamic
Republic of Iran, Iraq, Kuwait, Libya, Oman, Qatar, Saudi Arabia, United Arab
Emirates, Yemen; MENAP oil importers (MENAPOI) = Afghanistan, Djibouti, Egypt,
Jordan, Lebanon, Mauritania, Morocco, Pakistan, Sudan, Syria, Tunisia. Data labels
in the figure use International Organization for Standardization (ISO) country codes.
Data from 2011 onward exclude Syria.
1
External losses (gains) from lower oil prices are calculated as the projected
difference in the U.S. dollar value of net oil exports in 2015, using the 2015 oil price
assumptions in the April 2015 and October 2014 World Economic Outlooks, and the
volume of net oil exports in the latter, with adjustments for idiosyncratic
country-specific factors.
2
The size of the subsidy bill is estimated using 2013 data. Calculations are based on
a price-gap analysis following Clements and others 2013 and Sdralevich and others
2014.
62
Growth remained tepid across the Middle East, North
Africa, Afghanistan, and Pakistan (MENAP) in 2014
amid declining oil prices, raging conflicts, and continued
policy uncertainty. Only modest strengthening is expected
this year, and substantial downward revisions to regional
growth projections can be traced to the region’s oil exporters. Risks remain to the downside. Faced with large losses
from lower oil prices, most oil exporters need to recalibrate
their medium-term fiscal consolidation plans. Across the
region, lower oil prices create conditions for continuing subsidy reforms to build fiscal space for growthenhancing spending. Structural reforms are also needed
to raise prospects in a sustainable and inclusive manner.
International Monetary Fund | April 2015
1The rebasing to 2010 has resulted in a higher share of oil GDP
(43 percent compared with 21 percent previously) and, consequently, lower real GDP growth rates in 2013–14, when oil GDP
growth was subdued.
CHAPTER 2 COUNTRY AND REGIONAL PERSPECTIVES
Table 2.6. Middle East and North African Economies, Afghanistan, and Pakistan: Real GDP, Consumer Prices, Current
Account Balance, and Unemployment
(Annual percent change, unless noted otherwise)
Consumer Prices1
Real GDP
Projections
Projections
2014
2015
2016
2014
2015
2016
2.6
2.9
3.8
6.7
6.1
2.4
3.6
3.0
3.6
4.1
–2.4
2.4
3.0
0.6
3.2
2.6
1.3
3.5
2.7
1.3
3.2
3.9
7.6
5.6
2.7
15.5
2.3
2.9
2.2
5.6
2.0
16.5
2.1
4.0
3.0
Qatar
Kuwait
6.1
1.3
7.1
1.7
6.5
1.8
3.0
2.9
Oil Importers5
Egypt
Pakistan
Morocco
Sudan
Tunisia
3.0
2.2
4.1
2.9
3.4
2.3
4.0
4.0
4.3
4.4
3.3
3.0
4.4
4.3
4.7
5.0
3.9
3.8
Lebanon
Jordan
2.0
3.1
2.5
3.8
2.4
2.8
1.0
2.2
2.7
3.5
3.3
3.9
Middle East, North Africa, Afghanistan,
and Pakistan
Oil Exporters4
Saudi Arabia
Iran
United Arab Emirates
Algeria
Iraq
Memorandum
Middle East and North Africa
Israel6
Maghreb7
Mashreq8
Current Account Balance2
Unemployment3
Projections
Projections
2014
2015
2016
2014
2015
2016
6.2
6.4
–1.9
–0.1
...
...
...
6.0
2.5
17.0
2.3
4.0
3.0
10.0
14.1
3.8
12.1
–4.3
–3.5
–1.0
–1.0
0.8
5.3
–15.7
–9.6
1.7
3.7
1.2
7.2
–13.2
–3.6
...
5.5
11.2
...
10.6
...
...
...
12.3
...
11.8
...
...
...
13.2
...
11.9
...
1.8
3.3
2.7
3.6
25.1
35.3
8.4
15.7
5.0
19.3
...
2.1
...
2.1
...
2.1
9.2
10.1
8.6
0.4
36.9
4.9
7.0
10.3
4.7
1.5
19.0
5.0
6.6
10.5
4.5
2.0
10.5
4.1
–4.0
–0.8
–1.2
–5.8
–5.2
–8.9
–4.2
–3.3
–1.3
–3.4
–4.2
–6.4
–4.5
–4.3
–1.4
–3.3
–3.9
–5.2
...
13.4
6.7
9.1
13.6
15.3
...
13.1
6.5
9.0
13.3
15.0
...
12.5
6.1
8.9
13.0
14.0
2.5
4.5
1.9
2.9
1.1
1.2
2.8
2.5
–24.9
–7.0
–22.2
–7.6
–21.7
–6.6
...
11.9
...
...
...
...
3.7
3.3
5.6
4.2
6.5
0.5
2.5
8.9
6.2
–0.2
3.3
8.9
6.4
2.1
3.6
9.3
7.0
3.0
–8.1
–4.7
–2.0
4.5
–14.6
–6.2
0.0
4.4
–11.6
–6.8
...
6.0
...
...
...
5.5
...
...
...
5.3
...
...
Note: Data for some countries are based on fiscal years. Please refer to Table F in the Statistical Appendix for a list of economies with exceptional reporting periods.
1Movements in consumer prices are shown as annual averages. Year-end to year-end changes can be found in Tables A6 and A7 in the Statistical Appendix.
2Percent of GDP.
3Percent. National definitions of unemployment may differ.
4Includes Bahrain, Libya, Oman, and Yemen.
5Includes Afghanistan, Djibouti, and Mauritania. Excludes Syria because of the uncertain political situation.
6Israel, which is not a member of the economic region, is included for reasons of geography. Note that Israel is not included in the regional aggregates.
7The Maghreb comprises Algeria, Libya, Mauritania, Morocco, and Tunisia.
8The Mashreq comprises Egypt, Jordan, and Lebanon. Syria is excluded because of the uncertain political situation.
of about 1½ percentage points and 1 percentage
point, respectively. The revisions reflect the impact
of lower oil prices and continued uncertainty regarding progress toward a full agreement with the P5+1.2
•• Growth in Iraq is projected to be 1.3 percent in
2015, supported by increased oil production, but
non-oil activity is expected to stay flat because of
difficult security conditions and fiscal spending cuts
in response to lower oil prices.
•• Growth in Algeria is expected to slow from 4.1
percent in 2014 to 2.6 percent in 2015, as lower oil
prices exacerbate the economy’s existing fiscal and
external vulnerabilities.
Oil production and prices, as well as continued
conflicts in the region, constitute important risks to
2The P5+1 are the five permanent members of the United Nations
Security Council and Germany.
the outlook. Heightened uncertainty in the oil market
persists, with oil price volatility at historically high
levels and risks for oil production skewed to the downside. Downside risks to non-oil growth also arise from
the possibility that fiscal adjustment will be stronger
than currently expected or private investment will be
affected by declining confidence. Deepening conflicts
and security disruptions in a number of oil-exporting
countries could further undermine economic activity,
delay reforms, and dampen confidence.
Policymakers need to prepare for a sustained period
of lower oil prices and reassess their medium-term
spending plans accordingly. Countries need to address
fiscal vulnerabilities from rapidly eroding buffers
and high break-even oil prices and to save equitable
amounts of their nonrenewable oil wealth for future
generations. To limit the drag on growth, fiscal consolidation plans should focus on reining in current
International Monetary Fund | April 201563
WORLD ECONOMIC OUTLOOK: UNEVEN GROWTH—SHORT- AND LONG-TERM FACTORS
expenditures, including by limiting growth of public
wage bills and reducing generalized energy subsidies,
which remain large in many countries despite lower
oil prices. Prioritizing capital expenditure and raising
non-oil revenue collection should accompany efforts to
contain spending.
In tandem with fiscal consolidation, significant
structural reforms are needed to move away from
past growth models driven by oil-backed government
spending and raise productivity in the non-oil private
sector. The challenge will be to promote diversification
toward tradable activities and enable the private sector
to become a more self-reliant engine of growth, while
encouraging private sector job creation.
Oil-Importing Economies
In the region’s oil importers, a weak recovery continued in 2014. The impetus provided by increased
political stability and initial reforms was dampened by
intensified regional conflicts and continued sociopolitical and security tensions. Weak growth in the euro area
and deteriorating competitiveness from a strengthening
U.S. dollar (against which some countries peg their
exchange rates) also weighed on economic activity.
However, signs of nascent improvement in confidence
have emerged, reflected, among other things, in a
rating upgrade for Egypt’s and Pakistan’s first international bond issues in seven years.
Growth is expected to rise from 3.0 percent last
year to 4.0 percent in 2015 and 4.4 percent in 2016
(Table 2.6). Domestic demand should strengthen with
improved confidence, monetary easing, and reduced
fiscal drag. Recovery in Europe will support export
growth, offsetting adverse effects from slower growth
in the oil-exporting countries of the region. Lower oil
prices are reducing vulnerabilities, but their growth
impact is limited as governments will save much of the
oil windfalls. Moreover, intensified security challenges
and regional spillovers will constrain reform prospects.
Country-specific factors are also at play:
•• Egypt’s macroeconomic stabilization plans and
wide-ranging structural reforms are expected to
increase confidence, and growth is expected to rise
to 4 percent this year.3 Nevertheless, continued fiscal
consolidation, steady implementation of reforms,
3 Projections do not incorporate the potential impact of the
investment agreements reached at the March 2015 Egypt Economic
Development Conference.
64
International Monetary Fund | April 2015
and external financing are needed to maintain macroeconomic stability and generate sustainable growth
and jobs.
•• In Morocco, steadfast policy implementation
(including elimination of energy subsidies) has
helped stabilize the economy. Improved external
demand, strengthened domestic confidence, and
recovery of agricultural production should boost
growth to 4.4 percent in 2015 and 5 percent in
2016, but continued structural reforms, including
to the business environment, are needed to improve
competitiveness and employment.
•• Pakistan’s economy has stabilized, with a 4.3 percent
growth forecast for 2015 and gradually improving
fiscal and external positions. Further bold reforms
are critical to solidify this progress and counter
adverse effects on economic activity of falling cotton
prices and security and political tensions.
•• Confidence and growth in Tunisia are expected to
return with the completion of the political transition, but widening external imbalances, lingering
banking vulnerabilities, and security tensions will
weigh on economic activity. In Jordan, lower oil
prices and further reforms should contribute to
higher growth this year. Lebanon’s economy is
weighed down by the political impasse and spillovers from the conflict in Syria. And Sudan is still
adjusting to lower oil revenues due to the secession
of South Sudan, in the context of a volatile regional
environment, sanctions, and a heavy debt burden.
Risks to the outlook for the region are tilted to the
downside. Intensified tensions and setbacks in political
transitions could further undermine trade, confidence,
reform efforts, and macroeconomic stability. Lowerthan-expected growth in Europe, the member countries of the Cooperation Council for the Arab States of
the Gulf, or emerging markets could slow tourism and
exports, and with some lag, remittances and financing
support. On the upside, greater-than-expected windfalls from lower oil prices could further bolster growth.
Increasing economic prospects and job creation will
require multifaceted structural reforms. Business climate and governance reforms, better access to finance,
and improved labor market efficiency and infrastructure are critical to lowering firms’ operating costs and
creating new jobs. Fostering worker talent through
education aligned with private sector needs, adopting
the latest technologies and management techniques,
striving for greater trade integration, and recalibrating
the role of the government toward supporting the pri-
CHAPTER 2 COUNTRY AND REGIONAL PERSPECTIVES
vate sector will promote productivity and innovation.
International support through financing, access to key
export markets, technical assistance, and policy advice
would bolster these reform efforts.
Macroeconomic policies can support these growthand equity-enhancing reforms while ensuring macroeconomic stability. The decline in oil prices creates
favorable conditions for accelerating subsidy reforms
and increasing energy taxes. Where fiscal and external
sustainability is a concern, windfall gains should be
saved. Where there is space, freed resources could be
spent on growth-enhancing infrastructure, health care,
and education. Given uncertainties surrounding the
persistence of the oil price decline, countries should
avoid entering into irreversible spending commitments,
including increases in public sector wage spending.
Increased reserves and low inflation provide an opportunity to enhance exchange rate flexibility to improve
competitiveness—especially following the appreciation
of the U.S. dollar—and the ability to adjust to shocks.
Sub-Saharan Africa: Resilience in the Face of
Headwinds
Growth in sub-Saharan Africa remains strong,
although it is expected to slow in 2015 in the face of
headwinds from declining commodity prices and the
epidemic in Ebola-affected countries. Key downside risks
include further downgrades to growth in major trade partners, a sharper-than-expected tightening of global financing conditions, and mounting domestic security threats
and policy uncertainty ahead of elections. Oil-exporting
countries should enact prompt fiscal adjustments, while
oil importers’ policy stances should strike the right balance
between promoting growth and preserving stability.
Sub-Saharan African growth for 2014 as a whole
remained solid at 5.0 percent, albeit lower than the
5.2 percent growth in 2013. Growth in South Africa
fell from 2.2 percent in 2013 to 1.5 percent in 2014,
on account of mining strikes and electricity supply
constraints. Elsewhere in the region, growth, driven
by strong investment in mining and infrastructure
and by private consumption, held up well, especially
in the region’s low-income countries. Exceptions were
Guinea, Liberia, and Sierra Leone, where growth
declined sharply as a result of the Ebola epidemic,
which caused severe disruptions in agriculture and
services and the postponement of mining development
projects.
The region’s oil-exporting countries, especially
those with limited buffers (Chad, Nigeria), started
to adjust to the decline in oil prices. This adjustment
led to lower growth than was previously expected. By
contrast, growth in the region’s oil-importing countries
was broadly in line with previous projections, although
with considerable variation across countries.
Fiscal and current account balances worsened significantly in the region’s oil-exporting countries, reflecting
ambitious infrastructure investment agendas financed
with shrinking oil revenues (Figure 2.9). Fiscal balances
also deteriorated in other parts of the region, reflecting
continued fiscal strains in the Ebola-affected countries
and strong exceptional spending in Mozambique. By
contrast, consolidation efforts led to improvement in
fiscal balances in Ghana and Zambia. Weak oil and
food prices have helped reinforce the region’s generally low-inflation environment, which could allow
countries dealing with lower growth to adopt more
accommodative monetary policy stances. The dollar
has appreciated recently, and this could undermine
the competitiveness of some countries that are broadly
pegged to the dollar.
Favorable global financing conditions for most of
the year encouraged a surge in sovereign bond issuance
from $6.5 billion in 2013 to $8.7 billion in 2014,
with maiden issuances by Côte d’Ivoire, Ethiopia, and
Kenya. However, financing conditions have tightened
considerably since December, and yields on the region’s
bonds have been trending up, especially in Ghana
(owing to a high fiscal deficit) and Gabon and Nigeria
(owing to lower oil prices).
Sub-Saharan Africa is projected to experience solid
growth in 2015–16, but given the weaker global
outlook, its economic prospects have been revised
downward relative to earlier expectations (Table 2.7).
In 2015, growth in sub-Saharan Africa is projected to
fall to 4.5 percent—a substantial downward revision
of 1¼ percentage points relative to the October 2014
WEO—before rebounding to 5.1 percent in 2016. Oil
exporters in the region will be severely affected, with
growth in 2015 marked down by almost 2½ percentage points. By contrast, growth in the region’s oil
importers in 2015–16 is expected to average 4¾ percent, a downward revision of 0.3 percentage point
relative to the October 2014 WEO prediction, as the
favorable impact of lower oil prices will be offset to a
large extent by lower commodity export prices.
This outlook for the region is subject to significant
downside risks. Recent episodes of volatility sug
International Monetary Fund | April 201565
WORLD ECONOMIC OUTLOOK: UNEVEN GROWTH—SHORT- AND LONG-TERM FACTORS
Figure 2.9. Sub-Saharan Africa: Resilience in the Face of
Headwinds
Sub-Saharan African growth will remain solid notwithstanding a significant
adverse shock from the decline in oil prices. Oil exporters will be faced with a
formidable challenge to cope with the shock. For the rest of the region, lower oil
prices represent a favorable development, which will be offset in some cases,
however, by lower prices for other commodity exports.
1. Real Output Growth
16
(Percent)
14
Oil exporters
MICs
12
LICs
10
8
6
4
2
0
–2
2004 06 08 10 12
2. Terms of Trade
(Index, 2004 = 100)
SSA
Oil exporters
MICs
LICs
15 2004 06
25 3. Current Account Balance
(Percent of GDP)
20
SSA
15
Oil exporters
MICs
10
LICs
5
08
10
12
4. General Government
Fiscal Balance1 (Percent
of GDP)
SSA
Oil exporters
MICs
LICs
180
170
160
150
140
130
120
110
100
90
15
15
12
9
6
3
0
0
–5
–3
–10
–6
–15
2004 06
30
08
10
12
15 2004 06
5. Inflation2 (Year-over-year
percent change)
20
15
10
5
0
2007
09
11
13
10
12
6. Bond and Equity Flows
to Emerging and
Frontier Economies3
Eurobond
3.0
issuances (right
2.0
scale)
4.0
SSA
Oil exporters
MICs
LICs
25
08
15
–9
15
24
18
12
1.0
6
0.0
0
–1.0
–6
–2.0
SSA frontier markets –12
South Africa
–18
2013
14
Mar.
15
–3.0
Sources: EPFR Global; Haver Analytics; IMF, International Financial Statistics
database; and IMF staff estimates.
Note: LIC = low-income country (SSA); MIC = middle-income country (SSA); SSA =
sub-Saharan Africa. Oil exporters refer only to SSA oil exporters. See Table 2.7 for
country groupings and the Statistical Appendix for country group aggregation
methodology.
1
General government includes the central government, state governments, local
governments, and social security funds.
2
Because of data limitations, Eritrea is excluded from LICs, Zimbabwe from LICs
before December 2009, and South Sudan from oil exporters before June 2012.
3
Bond and equity data refer to cumulative flows since January 2013 in billions of
U.S. dollars. Frontier economies = Botswana, Democratic Republic of the Congo,
Côte d’Ivoire, Gabon, Ghana, Kenya, Malawi, Mauritius, Namibia, Nigeria, Zambia,
and Zimbabwe.
66
International Monetary Fund | April 2015
gest that frontier market economies and oil exporters planning to cover their financing needs through
international markets could be vulnerable to a reversal
in investor sentiment, especially in a tighter U.S.
monetary policy environment. Further weakening of
growth in Europe or in emerging markets, in particular
in China, could reduce demand for exports, further
depress commodity prices, and curtail foreign direct
investment in mining and infrastructure. Failure to
implement appropriate policies, most notably where
large fiscal adjustments are needed, could also weaken
macroeconomic stability. Risks originating within
the region include stronger persistence and regional
impact of the Ebola epidemic, rising security concerns,
and political uncertainty ahead of key elections (for
example, in Nigeria and Tanzania).
In view of their limited buffers, most oil exporters in the region will need to undertake prompt fiscal
adjustment to address the persistent terms-of-trade
shock that they are facing. Where feasible, such adjustment should be combined with increased exchange
rate flexibility. Elsewhere, to sustain high and inclusive
growth, policies will need to continue to strike the
right balance between scaling up public investment
and preserving debt sustainability and rebuilding fiscal
buffers. The current environment of low oil prices
provides a unique opportunity to undertake politically
difficult reforms to eliminate remaining fuel subsidies.
In anticipation of possible surges in the volatility of
exchange rates and capital flows, countries should also
carefully monitor their financial sectors, and those
planning Eurobond issues may need to prepare contingency plans.
CHAPTER 2 COUNTRY AND REGIONAL PERSPECTIVES
Table 2.7. Sub-Saharan African Economies: Real GDP, Consumer Prices, Current Account Balance, and Unemployment
(Annual percent change, unless noted otherwise)
Consumer Prices1
Real GDP
Projections
Current Account Balance2
Projections
Unemployment3
Projections
Projections
2014
2015
2016
2014
2015
2016
2014
2015
2016
2014
2015
2016
5.0
4.5
5.1
6.3
6.6
7.0
–3.3
–4.6
–4.1
...
...
...
Oil Exporters4
Nigeria
Angola
Gabon
Chad
Republic of Congo
5.8
6.3
4.2
5.1
6.9
6.0
4.5
4.8
4.5
4.4
7.6
5.2
5.2
5.0
3.9
5.5
4.9
7.5
7.3
8.1
7.3
4.5
1.7
0.9
9.2
9.6
8.4
2.5
3.2
3.0
9.6
10.7
8.5
2.5
2.9
2.9
1.2
2.2
–0.8
11.2
–8.7
–6.2
–1.5
0.7
–6.3
–2.3
–10.5
–11.3
–0.3
1.3
–4.2
0.9
–8.3
–3.1
...
...
...
...
...
...
...
...
...
...
...
...
...
...
...
...
...
...
Middle-Income Countries5
South Africa
Ghana
Côte d'Ivoire
Cameroon
Zambia
Senegal
2.9
1.5
4.2
7.5
5.1
5.4
4.5
3.2
2.0
3.5
7.7
5.0
6.7
4.6
3.6
2.1
6.4
7.8
5.0
6.9
5.1
6.0
6.1
15.5
0.4
1.9
7.9
–0.5
4.8
4.5
12.2
1.2
2.0
7.7
1.5
5.3
5.6
10.2
1.5
2.1
6.5
1.4
–4.8
–5.4
–9.2
–3.3
–4.2
–0.2
–10.3
–4.0
–4.6
–7.0
–2.3
–4.8
0.3
–7.6
–4.1
–4.7
–6.2
–1.7
–4.8
0.9
–7.3
...
25.1
...
...
...
...
...
...
25.1
...
...
...
...
...
...
24.9
...
...
...
...
...
Low-Income Countries6
Ethiopia
Kenya
Tanzania
Uganda
Madagascar
Democratic Republic of the Congo
6.5
10.3
5.3
7.2
4.9
3.0
9.1
6.3
8.6
6.9
7.2
5.4
5.0
9.2
6.9
8.5
7.2
7.1
5.6
5.0
8.4
5.1
7.4
6.9
6.1
4.7
6.1
1.0
4.8
6.8
5.1
4.2
4.9
7.6
2.4
5.2
8.2
5.0
4.5
4.8
6.9
3.5
–11.0
–9.0
–9.2
–10.2
–7.5
–2.3
–9.6
–11.1
–6.6
–7.7
–10.0
–8.8
–3.2
–10.7
–11.0
–6.3
–7.4
–9.5
–9.0
–3.4
–9.5
...
...
...
...
...
...
...
...
...
...
...
...
...
...
...
...
...
...
...
...
...
Memorandum
Sub-Saharan Africa Excluding South
Sudan
5.0
4.5
5.0
6.4
6.4
7.0
–3.3
–4.5
–4.1
...
...
...
Sub-Saharan Africa
Note: Data for some countries are based on fiscal years. Please refer to Table F in the Statistical Appendix for a list of economies with exceptional reporting periods.
1Movements in consumer prices are shown as annual averages. Year-end to year-end changes can be found in Table A7 in the Statistical Appendix.
2Percent of GDP.
3Percent. National definitions of unemployment may differ.
4Includes Equatorial Guinea and South Sudan.
5Includes Botswana, Cabo Verde, Lesotho, Mauritius, Namibia, Seychelles, and Swaziland.
6Includes Benin, Burkina Faso, Burundi, the Central African Republic, Comoros, Eritrea, The Gambia, Guinea, Guinea-Bissau, Liberia, Malawi, Mali, Mozambique, Niger,
Rwanda, São Tomé and Príncipe, Sierra Leone, Togo, and Zimbabwe.
International Monetary Fund | April 201567
WORLD ECONOMIC OUTLOOK: UNEVEN GROWTH—SHORT- AND LONG-TERM FACTORS
References
Clements, Benedict, David Coady, Stefania Fabrizio, Sanjeev
Gupta, Trevor Alleyne, and Carlo Sdralevich. 2013. Energy
Subsidy Reform: Lessons and Implications. Washington: International Monetary Fund.
Gruss, Bertrand. 2014. “After the Boom—Commodity Prices
and Economic Growth in Latin America and the Caribbean.”
IMF Working Paper 14/154, International Monetary Fund,
Washington.
Sdralevich, Carlo, Randa Sab, Younes Zouhar, and Giorgia
Albertin. 2014. “Subsidy Reform in the Middle East and
North Africa: Recent Progress and Challenges Ahead.”
Middle East and Central Asia Departmental Paper, International Monetary Fund, Washington.
68
International Monetary Fund | April 2015
Download