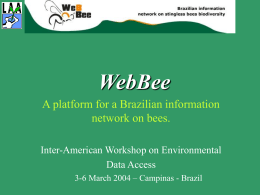
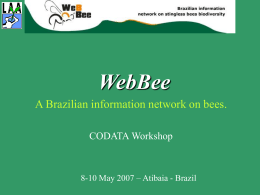
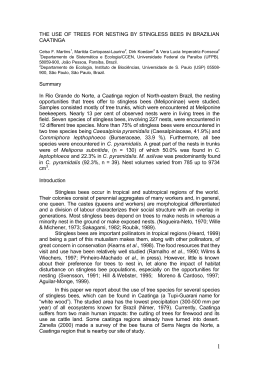
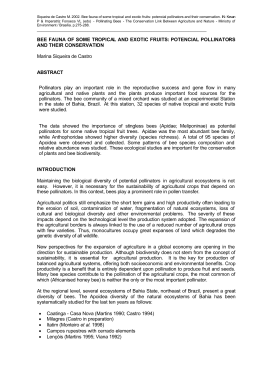
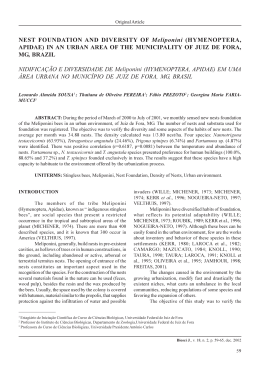
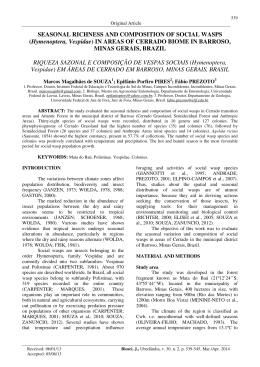
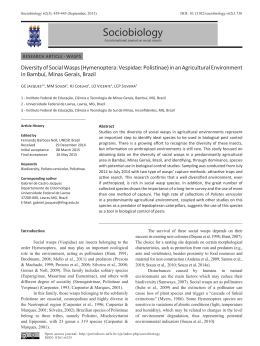
Abiotic correlates of bee diversity and composition along
eastern Neotropics
Luiz Faria, Rodrigo Gonçalves
To cite this version:
Luiz Faria, Rodrigo Gonçalves. Abiotic correlates of bee diversity and composition along eastern
Neotropics. Apidologie, Springer Verlag, 2013, 44 (5), pp.547-562. <10.1007/s13592-013-0205x>. <hal-01201325>
HAL Id: hal-01201325
https://hal.archives-ouvertes.fr/hal-01201325
Submitted on 17 Sep 2015
HAL is a multi-disciplinary open access
archive for the deposit and dissemination of scientific research documents, whether they are published or not. The documents may come from
teaching and research institutions in France or
abroad, or from public or private research centers.
L’archive ouverte pluridisciplinaire HAL, est
destinée au dépôt et à la diffusion de documents
scientifiques de niveau recherche, publiés ou non,
émanant des établissements d’enseignement et de
recherche français ou étrangers, des laboratoires
publics ou privés.
Apidologie (2013) 44:547–562
* INRA, DIB and Springer-Verlag France, 2013
DOI: 10.1007/s13592-013-0205-x
Original article
Abiotic correlates of bee diversity and composition
along eastern Neotropics
Luiz Roberto Ribeiro FARIA1 , Rodrigo Barbosa GONÇALVES2
1
Departamento de Ciências Agrárias e Biológicas, Centro Universitário do Norte do Espírito Santo, Universidade
Federal do Espírito Santo, Rodovia BR-101 Norte, Km 60, Litorâneo, 29932-540, São Mateus, ES, Brazil
2
Setor Palotina, Universidade Federal do Paraná, Rua Pioneiro, 2153, Jd. Dallas, 85950-000, Palotina, PR, Brazil
Received 31 August 2012 – Revised 13 January 2013 – Accepted 19 March 2013
Abstract – Native bee diversity is poorly documented for many regions of the globe, particularly in the
Neotropics. The available structured inventories in this biogeographical region provide reliable data, but they
lack a comprehensive interpretation due to the absence of an effort to relate diversity and composition data with
environmental variables. We aimed to answer the following questions: (1) Do abiotic factors explain variations
in the richness, diversity, and composition of bee assemblages? (2) If so, which abiotic factors explain each of
these community descriptors? We used a database comprising 33 systematic surveys of bee assemblages along
eastern Neotropics. We found significant effect of abiotic variables on biotic diversity parameters and
assemblage composition. Temperature annual range was the main abiotic predictor affecting bee richness and
diversity, while composition was explained by annual mean temperature, temperature seasonality, temperature
annual range, and by annual precipitation.
Apidae / Apoidea / bee fauna / diversity / pollinator
1. INTRODUCTION
It has been recognized that the main importance
of bees in the ecosystems is their pollination
services for natural vegetation (Michener 2007).
Many cultivated plants need bees as pollinators,
and natural areas can support a number of potential
pollinators for these crops and orchards (e.g.,
Steffan-Dewenter 2003). Due to anthropic pressures, especially extensive habitat loss (Winfree et
al. 2009), these insects are considered under
diversity decline (e.g., Biesmeijer et al. 2006), with
some local extinction reports (e.g., Kosior et al.
2007; Martins & Melo 2010), and with commitment to ecosystem process (Schleuning et al.
Corresponding author: L.R.R. Faria,
[email protected]
Manuscript Editor: Marina Meixner
2011). The impacts on bees are worldwide and
the concern is surely applied to megadiverse
tropical areas which fauna are far from being
properly described. As an example, in Brazil, there
are about 1,700 known bee species (Melo 2007),
but the richness is estimated to be 3,000 species,
more than 10 % of the entire global bee diversity
(Silveira et al. 2002a). This noticeable richness can
be related to the continental size of this country
combined to the great diversity of landscapes.
Many efforts to document the Brazilian bee
fauna are concentrated in standardized inventories,
which summed more than 80 studies so far (up-todate number follows Pinheiro-Machado (2002); see
also Biesmeijer et al. 2005). These inventories are
based on net sampling flower visitors in a previously defined area of usually few hectares for about
a 1-year period (Sakagami et al. 1967). This active
sampling can be disadvantageous due to the
548
L.R.R. Faria and R.B. Gonçalves
difficulty to replicate the sampling effort among
different studies, but it is for long considered the
best way to sample a diversity of bees groups in
distinct vegetation kinds (Laroca and Orth 2002).
The available studies usually report bee assemblages as species abundance lists, often with
additional data of seasonality (e.g., Aguiar and
Martins 2003; Aguiar and Zanella 2005; Madeirada-Silva and Martins 2003) and flower visit
records (e.g., Faria-Mucci et al. 2003; Gonçalves
and Melo 2005).
These bee inventories, as for active sampling
of other insects, have some important challenges that can prevent the representation of the
assemblages and the comparison among them.
The first challenge is to encompass the great
heterogeneity of habitats in order to produce an
accurate checklist that can be considered representative of a certain area (Gonçalves et al.
2009). A second is the difficulty to standardize
the effort of sampling, due to bias on sampling
intervals, number of collectors, and seasonality
(Cure et al. 1991. A third is the complication to
handle with the taxonomical impediment
(Silveira et al. 2002b), the lack of revised
scientific names that constraint the identification
at species level, leaving many unidentified
specimens determined as morphospecies.
Another important issue is how to contextualize the results of the inventories with biotic and
abiotic variables (Grundel et al. 2010). For this
contextualization, it is necessary to have a
background of how richness, diversity, abundance, and composition of bees from different
assemblages correlate with the environment. Few
attempts were made to produce these comparative
studies and/or meta-analysis on bee sinecology,
and these are restricted to exploitation of particular ecosystems, bee groups, and analytical
approaches (Silveira and Campos 1995; Zanella
2000; Biesmeijer and Slaa 2006; Gonçalves et al.
2009; Sydney et al. 2010). Examples of interesting results of these attempts are: the indication that
different open vegetation ecosystems have particular genus composition (Silveira and Campos
1995; Gonçalves et al. 2009); the relationship
between stingless bee richness and latitude
(Biesmeijer and Slaa 2006); and the influence of
latitudinal, longitudinal (Sydney et al. 2010),
precipitation (Abrahamczyk et al. 2011; Sydney
et al. 2010), and temperature seasonality
(Abrahamczyk et al. 2011) gradients on orchid
bee communities.
Despite the aforementioned attempts, there is
no single study to compare the structure of bee
communities relating their biotic (i.e., diversity
related) parameters to environmental variables.
In this context, the goal of the present work is to
explore the role of abiotic factors on bee
assemblages in eastern Neotropics. The specific
addressed questions are: (1) Do abiotic factors
explain variations in the richness, diversity, and
composition of bee assemblages? (2) If so,
which abiotic factors explain each of these
community descriptors?
2. MATERIAL AND METHODS
2.1. Database
We used a database comprising 33 systematic
surveys of bee assemblages concentrated on eastern
Neotropics, due to the inexistence or scarcity of
systematic surveys on western, northern, and southern portion of the region. The inclusion of surveys
relied upon the following criteria: (1) studies comprising at least 9 months including, necessarily, the
hot season; (2) active netting as sampling method; (3)
presence of species lists with respective abundances;
and (4) studies carried out in restricted areas (few
hectares), with geographic coordinates available.
Presence and abundance of the exotic Apis mellifera
Linnaeus, 1758, the Africanized honey bee, was not
considered for the construction of the database. A list
of the selected studies appears on Table I, and the
geographical range of them can be evaluated in
Figure 1.
Abiotic data were obtained from the WorldClim
database, with spatial resolution of 2.5 min and
comprising the 1950–2000 period (Hijmans et al.
2005). We firstly selected the annual mean temperature (BIO1) and annual precipitation (BIO12), but
consider the inclusion of temperature (BIO4) and
precipitation seasonality (BIO15) and also the temperature annual range (BIO7), assuming that the
seasonality is an important issue on bee communities.
549
Abiotic correlates of bee diversity
Table I. Surveys along eastern Neotropical region considered in this study.
Code
Location
Vegetation
SR*
N
SR
Reference
MAPA
Coastal
Dunes
Capoeira
30
2,641
21
36
866
32
82
1,672
57
−37.25
Cerrado/
DOF
Caatinga
Oliveira et al.
(2010)
Albuquerque et al.
(2001)
Santos et al. (2004)
82
1,155
61
Zanella (2003)
−6.67
−35.2
Caatinga
113
2,361
74
−7.05
−35.85
Caatinga
39
974
34
São João do
Cariri, PB
Chã-Grande,
PE
−7.42
−36.5
Caatinga
40
839
31
−8.19
−35.47
Caatinga
79
889
65
BACN
BALE
BAIT
Casa Nova, BA
Lençois, BA
Itatim, BA
−9.43
−12.57
−12.70
−41.83
−41.38
−39.77
Caatinga
Caatinga
Caatinga
42
151
59
507
1,490
557
34
90
55
DFBR
GOIP
Brasília, DF
Iporá, GO
−15.87
−16.45
−47.85
−51.13
Cerrado
Cerrado
215
61
2,438
818
115
46
MGLN
Lavras Novas,
MG
Santana do
Riacho, MG
Paraopeba, MG
−19.30
−43.58
Cerrado
72
576
65
−19.30
−43.58
Cerrado
107
632
94
−19.33
−44.33
Cerrado
172
1,135
123
Cajuru, SP
Luis Antonio,
SP
Corumbataí,
SP
São Paulo, SP
Salesópolis,
SP
Jaguariaíva,
PR
Tunas do
Paraná, PR
Ponta Grossa,
PR
Antonina, PR
Guarapuava,
PR
−21.33
−21.55
−47.27
−47.85
Cerrado
Cerrado
195
138
3,509
2,687
89
74
Aguiar and Martins
(2003)
Madeira-da-Silva
and Martins
(2003)
Aguiar and Martins
(1997)
Millet-Pinheiro and
Schlindwein
(2008)
Martins (1994)
Martins (1990)
Aguiar and Zanella
(2005)
Boaventura (1998)
Santiago et al.
(2009)
Faria-Mucci et al.
(2003)
Faria and Camargo
(1996)
Silveira and
Campos (1995)
Pedro (1992)
Mateus (1998)
−22.25
−47.0
Cerrado
123
708
100
−23.37
−23.63
−46.43
−45.87
DOF
DOF
168
258
6,028
6,748
61
113
Silveira and
Campos (1995)
Ramalho (1995)
Wilms (1995)
−24.17
−49.65
Cerrado
167
1,491
81
Almeida (2003)
−25.03
−49.08
SSF
135
733
110
Weiss (2008)
−25.23
−49.99
OE
181
1,122
122
−25.32
−25.39
−48.66
−51.46
DOF
OE
118
148
844
1,733
91
88
Gonçalves and
Melo (2005)
Maia (2008)
Bortoli and Laroca
(1997)
MAVI
TOES
RNSN
PBMA
PBCA
PBSJ
PECG
MGSR
MGPA
SPCA
SPLA
SPCO
SPSP
SPSA
PRJA
PRTP
PRPG
PRAN
PRGU
Latitude
Longitude
Panaquatira,
MA
Vitória do
Mearim, MA
Esperantina,
TO
Serra Negra
do Norte, RN
Mamanguape,
PB
Cabedelo, PB
−2.47
−44.05
−3.48
−44.5
−5.33
−48.58
−6.57
550
L.R.R. Faria and R.B. Gonçalves
Table I (continued)
Code
Location
Latitude
Longitude
PRCU
PRMO
PRLA
Curitiba, PR
Morretes, PR
Lapa, PR
−25.48
−25.48
−25.73
SCSB
São Bento do
Sul, SC
Pato Branco,
PR
Porto União,
SC
Viamão, RS
PRPB
SCPU
RSVI
Vegetation
SR*
N
SR
Reference
−49.24
−48.82
−49.78
OE
DOF
OE
120
111
159
1,439
1,194
2,361
72
84
88
−26.05
−49.05
DOF
71
682
58
−26.23
−52.68
OE
146
1,069
94
−26.32
−50.92
MOF
129
498
124
−30.08
−51.03
SE
140
1,597
92
Cure et al. (1991)
Barbola (2000)
Barbola and Laroca
(1993)
Mouga and Krug
(2010)
Jamhour and Laroca
(2004)
Krug and Alvesdos-Santos (2008)
Hoffmann (1990)
SR* original species richness, N number of specimens, SR rarefied species richness (cutoff, 450 individuals, see
Section 2). Vegetation: Capoeira secondary vegetation composed of grasslands and scattered shrubs, DOF dense
ombrophylous forest, SSF semidecidual seasonal forest, OE ombrophylous estepe, SE seasonal estepe. Brazilian
political divisions: BA Bahia, DF Distrito Federal, GO Goiás, MA Maranhão, MG Minas Gerais, PB Paraíba, PE
Pernambuco, PR Paraná, RN Rio Grande do Norte, RS Rio Grande do Sul, SC Santa Catarina, SP São Paulo, TO
Tocantins
Regarding altitude, the original values presented by
the authors in the original papers were always
preferred, but in the case this information was
missing, the value was also assessed in WorldClim
database.
2.2. Analysis
In order to compare the richness in the different
studies, we used the rarefaction method based on the
number of individuals. This technique is used to
approach the richness expected in a subsample of
specimens selected at random from a larger sample
(Sanders 1968; Hurlbert 1971; Simberloff 1972;
Koellner et al. 2004). Instead of using a cutoff score
equivalent to the survey with the lowest abundance
(498 individuals in Krug and Alves-dos-Santos
2008), we used a standardized subset of 450 individuals to allow even sub-sampling with the lowest
number of bees collected in the dataset. Besides
species richness (SR), Shannon diversity index (H′),
probability of an interspecific encounter (PIE;
Hurlbert 1971) was utilized as a evenness measure,
and the Dominance index (D) were calculated based
on the rarefied dataset; all calculations were carried
out with EcoSim (Gotelli and Entsminger 2004).
Verification of the hypothesis of normality was made
by using the Jarque-Bera test (Jarque and Bera 1980;
see Thadewald and Büning (2007)). As normality
was not achieved for PIE and D, in these cases, data
were transformed according to the logit procedure as
recommended by Warton and Hui (2011).
Regarding composition of bee assemblages, a
non-metric multidimensional scaling ordination analysis (NMDS) was performed based on Jaccard’s
similarity index, a standard index for binary data.
This analysis, regarded by ecologists as one of the
most robust ordination methods (e.g., Minchin 1987),
is a nonlinear data-dependent technique applicable to
the analysis of wide environmental gradients (Ludwig
and Reynolds 1988). The NMDS stress was calculated to approach the quality of this analysis. Stress
values lower than 0.2 are regarded to represent a
good adjustment of the ordination (Clarke and
Warwick 2001). For this analysis, a presence/
absence matrix of bee genera was constructed based
on the data from the 33 selected surveys. The
comparison between assemblages from different
locations is only possible using genera as units of
comparison due to the high number of unidentified
species (Gonçalves et al. 2009). The values of the
first two axes of NMDS were then selected to be
analyzed as the variables regarding composition of
the assemblages.
Abiotic correlates of bee diversity
551
Figure 1. Bee assemblages along Neotropics included in the analysis. Neotropical region (sensu Morrone
2006) is depicted in gray. Abbreviations according to Table I.
Initially, Pearson correlations were utilized to explore the relationships between the descriptors of the
selected assemblages (dependent variables at 450 individuals: SR, PIE, H′, D, and NMDS axes) and the
environmental predictors. We then used linear models
(ordinary least squares regressions, OLS) to test the
effect of the predictors on the dependent variables. A
model selection approach, using the Akaike
Information Criterion (AIC) (Burnham and Anderson
2002), was utilized to recognize the best among all
possible models, i.e., all the different combinations of
predictors for each of the descriptors of assemblages. In
order to avoid the collinearity problem, the variance
inflation factors (VIFs) and the condition number (CN)
values for each model were analyzed (see, e.g., O'Brien
(2007) and Lazaridis (2007)). Maximum VIF values
lower than 10 (Mason et al. 1989; Neter et al. 1989) and
CN values lower than 5 (Lazaridis 2007) were
considered as indicating that collinearity was not a
major problem for a given model. When the best model
was composed by two or more variables, a partial
regression analysis was performed to evaluate the
proportion of variance explained by each variable.
Since observed relationships in ecology tend to be
spatially variable (“nonstationarity”), even if the underlying ecological processes are more general, the realized
patterns will vary with local conditions (e.g., Jetz et al.
2005; Cassemiro et al. 2007). As neighboring residuals
tend to be more similar than distant ones, the significance and values of model parameters may be affected
(see Diniz-Filho et al. (2003)). We utilized geographical
weighted regression (GWR) procedures to deal with
spatial autocorrelation. These analyses were performed
with a bisquare spatial weighting function and with
bandwidth optimized to minimize AIC values.
Statistical analyses were performed in Past (Hammer
et al. 2001) and Spatial Analysis in Macroecology
(SAM; Rangel et al. 2010) software packages.
552
L.R.R. Faria and R.B. Gonçalves
3. RESULTS
In general, significant correlations were found
among assemblage parameters and abiotic predictors (Figures 2, 3, 4, and 5; Table II). Species
richness, more specifically, appeared positively
correlated with altitude, temperature seasonality
(BIO4), temperature annual range (BIO7), and
annual precipitation (BIO12), and negatively
correlated with annual mean temperature (BIO1)
and precipitation seasonality (BIO15). The same
pattern of correlation was found for the Shannon
diversity index. The taxonomic composition was
also related to the abiotic predictors, NMDS1 with
all the predictors, and NMDS2 only with annual
precipitation.
Regarding the ordination analysis (NMDS; S0
0.175), it was not possible to recognize distinct
groupings of assemblages, which could be related
to the vegetation cover. Nonetheless, the analysis
suggests a gradient where genera composition
from tropical areas (mainly negative values on
NMDS1) are being replaced towards to colder
regions (mainly positive values on NMDS1)
along the first ordination axis (Figure 6). This
interpretation is supported by the OLS results for
the first axis of NMDS (see below).
In relation to regression analysis (Table III),
the best model explaining community structure
(SR, H′, PIE, and D) included only the
temperature annual range (BIO7) (SR: r2 0
0.456, P<0.001; H′: r2 00.346, P<0.001; PIE:
r2 00.278, P00.002; D: r2 00.205, P00.008).
With respect to variables related to taxonomic
composition (NMDS axes), the selected models
were more complex. The best model for the first
axis (NMDS1) included annual mean temperature (BIO1) and temperature seasonality (BIO4)
Figure 2. Scatter plots correlating assemblages’ parameters and abiotic variables. a SR×altitude, b SR×BIO 1,
c SR×BIO 4, d H′×altitude, e H′×BIO 1, f H′×BIO 4, g PIE×altitude, h PIE×BIO 1, i PIE×BIO 4. For
abbreviations, see Section 2.
Abiotic correlates of bee diversity
553
Figure 3. Scatter plots correlating assemblages’ parameters and abiotic variables. a SR×BIO 7, b SR×BIO 12,
c SR×BIO 15, d H′×BIO 7, e H′×BIO 12, f H′×BIO 15, g PIE×BIO 7, h PIE×BIO 12, i PIE×BIO 15. For
abbreviations, see Section 2.
(r2 00.757, P<0.001), but these effects on the
first axis were opposite (BIO1: t0−3.170, P0
0.004; BIO4: t02.736, P00.011). Partial regression analysis revealed that BIO1 and BIO4
shared most of the variance explained by them
(0.615; against 0.081 explained by BIO1 and
0.061 explained by BIO4 only). This way, the
survey distribution on the first axis of NMDS
respected a decrease on annual mean temperature, while the temperature seasonality increased. Regarding the second axis of variation
(NMDS2), the best model included temperature
annual range (BIO7) and annual precipitation
(BIO12; r2 00.485, P<0.001). When considered
by themselves, only BIO12 explained the
variance on NMDS2 (t05.297, P<0.001). The
partial regression results attested to the major
importance of precipitation, since the variance
explained only by BIO12 (0.482) was much
higher than explained by BIO7 itself (0.041;
shared explained variance, −0.038).
The GWR analysis, taking spatial structure
into account, showed very similar patterns to
those found in OLS analysis. The exception was
D, since we found no significant values for
GWR analysis despite the results found when
performing the standard regression (Table IV).
4. DISCUSSION/CONCLUSION
In relation to the first specific objective of
this study, abiotic variables were correlated with
diversity and composition of bee assemblages
along eastern Neotropics. It is important to note
that in many cases we found, despite their
statistical significance, low values of r and r2
(regarding, respectively, correlation, and regression analyses). This shows that, although these
554
L.R.R. Faria and R.B. Gonçalves
Figure 4. Scatter plots correlating assemblages’ parameters and abiotic variables. a D×altitude, b D×BIO 1, c
D×BIO 4, d NMDS1×altitude, e NMDS1×BIO 1, f NMDS1×BIO 4, g NMDS2×altitude, h NMDS2×BIO 1,
i NMDS2×BIO 4. For abbreviations, see Section 2.
climatic variables are quite relevant to understand how bee richness, diversity and composition vary along Neotropics, these parameters are
too complex to be explained only by the abiotic
predictors considered in the regression models
analyzed in this paper (see discussion above).
Regarding the regression analyses, diversity
and composition were explained by different set
of abiotic variables. Temperature annual range,
the difference between the higher and lesser
temperatures, was the most important factor
describing bee diversity, as we observed an
increase in species richness, H, and PIE, besides
a decrease in D, at places with higher temperature annual range.
On the other side, the generic composition of
bee assemblages varied in response to annual mean
temperature and temperature seasonality
(NMDS1), and to temperature annual range and
annual precipitation (NMDS2). The bee composition analysis was based on the presence/absence
matrix of bee genera, which adds an historic
perspective, in the sense of a deeper relation of
these supra-specific taxa with the localities. The
NMDS1 (Figure 6) suggests a spatial gradient
pattern, with a subtle separation of −21 and lower
latitudes areas (Dry Forests, Cerrado and Caatinga)
and −22 and higher latitudes areas (Atlantic Forest
and grasslands). This separation possibly reflects a
bee composition response to annual mean temperature and temperature seasonality, the abiotic
correlates of NMDS axis 1. A gradient between
Cerrado and the southern grasslands areas was
discussed by Gonçalves et al. (2009), but the
hereby inclusion of other vegetational areas did not
quantitatively enhance the understanding of how
bee composition varies among different biomes.
The NMDS2 showed a different gradient,
555
Abiotic correlates of bee diversity
Figure 5. Scatter plots correlating assemblages’ parameters and abiotic variables. a D×BIO 7, b D×BIO 12, c:
D×BIO 15, d NMDS1×BIO 7, e NMDS1×BIO 12, f NMDS1×BIO 15, g NMDS2×BIO 7, h NMDS2×BIO
12, i NMDS2×BIO 15. For abbreviations, see Section 2.
explained mainly by annual precipitation, a variable for long recognized as related to diversity
patterns (Gaston 2000). The localities of Caatinga,
a biome known for water stress and historic lower
precipitation values (Zanella 2000; 2003), have
shown higher negative values on this axis, and this
Table II. Pearson correlation coefficients of assemblages' parameters and abiotic variables.
Parameter
Altitude
BIO 1
BIO 4
BIO 7
BIO 12
BIO 15
SR
H′
PIE
D
NMDS1
NMDS2
0.481*
0.403***
0.358***
−0.322
0.518*
−0.060
−0.611**
−0.546*
−0.477*
0.388***
−0.834**
−0.065
0.585**
0.556**
0.499*
−0.406***
0.822**
0.071
0.675**
0.587**
0.528*
−0.453*
0.786**
0.054
0.409***
0.344***
0.303
−0.251
0.347***
0.666**
−0.478*
−0.465*
−0.422*
0.352***
−0.681**
−0.154
Cutoff (in all cases): 450 individuals, see Section 2
SR rarefied species richness, H′ rarefied Shannon index, PIE rarefied proportion of interespecific encounter, D rarefied
dominance index, NMDS1 and NMDS2 values for the first and second axis of ordination in the NMDS analysis, BIO1 annual
mean temperature, BIO4 temperature seasonality, BIO7 temperature annual range, BIO12 annual precipitation, BIO15
precipitation seasonality
*P<0.01, **P<0.001, ***P<0.05
556
L.R.R. Faria and R.B. Gonçalves
Figure 6. NMDS ordination plot. S00.175. Abbreviations according to Table I.
dry condition found in Caatinga is probably also
reflected in bee diversity. The precipitation in this
case has an indirect effect on the bee diversity:
higher precipitation affects positively the flower
resources, while bees themselves response negatively to rainfall (Gonzalez et al. 2009).
It is important to note that the present
objective was not to test the response of
Neotropical bees (regarding diversity and composition) to the latitudinal gradient. However, as
the abiotic variables tested here are correlated
with latitude, its influence permeates our discussion. It has been generalized that for most of
the organisms there is a decline of biodiversity
with the latitude (e.g., Hildebrand 2004), but the
opposite tendency is frequently reported (Willig
et al. 2003) and, possibly, this is the case of bees
(see discussion below).
When we consider the influence of abiotic
correlates on bee diversity, two main reasons are
suggested for that: (1) a deeper, historic association,
defined by composite causes; (2) the importance of
a broad temperature range for species coexistence
mediated by temporal species turnover.
First of all, the response to the abiotic gradient
reflects the historic association of bees and areas
with lower latitudes, and consequently higher
temperature range and other related abiotic correlates. Michener`s classic “Biogeography of the
Bees” (1979) generalized that bee diversity and
abundance was greater in warm temperate areas
than on tropics. For the Neotropical region,
Michener (1979) points that areas from southern
Brazil and Argentina have a more speciose bee
fauna comparatively to northern areas. This
observation is also perceived for composition; it
is quite difficult to separate the effects of abiotic
predictors on species richness and composition
individually, because they often appear together.
The perception of ultimate drivers of bee
assemblages composition should be appraised, since distinct bee groups have
different diversity gradients patterns, as the
relation of short-tongued bees with higher
latitudes (Sakagami et al. 1967; Michener
1979; Roubik 1989), and the contrary pattern
found in stingless bees (see below) and
orchid bees (e.g., Moure 1967; Roubik and
557
−0.038
0.482
0.041
0.615
0.061
0.081
<0.001
<0.001
0.002
0.008
0.004
0.011
0.134
<0.001
1.466
0.485
14.117
<0.001
5.099
4.046
3.457
−2.83
−3.17
2.736
−1.543
5.297
<0.001
<0.001
0.002
0.008
<0.001
25.997
16.372
11.954
8.007
46.788
0.456
0.346
0.278
0.205
0.757
NMDS2
t
P
F
CN
1
1
1
1
3.119
Temperature annual range
Temperature annual range
Temperature annual range
Temperature annual range
Annual mean temperature (a)
Temperature seasonality (b)
Temperature annual range (a)
Annual precipitation (b)
SR
H′
PIE
D
NMDS1
Explained by (b)
only
Explained by (a)
only
r2
Model selected
P
Partial regression analysis
Regression analysis
Model selection
Dependent
variable
Table III. Best model selected for each of the dependent variables, regression (OLS) and partial regression analysis. CN: Condition Number.
Shared explained
variance
Abiotic correlates of bee diversity
Table IV. Geographically weighted regression analysis (GWR). The dependent variables and models
utilized here were the same models used in OLS.
Dependent variable
r2
F
P
SR
H′
PIE
D
NMDS1
NMDS2
0.448
0.392
0.289
0.153
0.813
0.538
3.98
3.339
2.414
1.538
13.239
4.22
0.001
0.003
0.018
0.102
<0.001
<0.001
Hanson 2004), they both with higher species
richness in forested areas at lower latitudes.
Other important examples regard Centridini
(see Silveira and Campos 1995; Zanella
2002) and some Tapinotaspidini bees (e.g.,
Arhysoceble, Caenonomada, Tapinotaspis,
and Tapinotaspoides; Aguiar and Melo 2008),
characteristic taxa in the Neotropical bee fauna
that are much more related to open formations.
Therefore, we cannot overlook the existence of a
phylogenetic and biogeographic signal in the
evolution of the communities of bees.
The positive response to the abiotic gradient
is largely caused by the inherent evolutionary
tendency of bees, but indirect response also
must be taken in account to understand the role
of abiotic variables. Temperature and precipitation gradients influences host plants communities in their richness, composition, and
physiognomy, affecting differently bee species.
Pollen and nectar are important resources for
bees, but plants also provide resources for
nesting, as leaves or cavities (Wcislo and Cane
1996). The availability of suitable substrates for
nesting is one of the most important factors
limiting the distribution of bee species (e.g.,
Michener 2007) and nesting biology is influenced
by abiotic variables. Higher precipitation values,
for instance, can be related to a severe restriction
for soil nesting bees (Michener 1979) while, on
the other side, in forested areas the availability of
cavities may favor cavity-nesting species (e.g.,
Morato and Martins 2006).
Regarding the vegetation type, the richest
assemblages found after rarefaction techniques
558
L.R.R. Faria and R.B. Gonçalves
were located in grasslands or in Mixed
Ombrophilous Forests, a physiognomy strongly
patched by grassland elements (Martins-Ramos et
al. 2011). Grasslands seem to harbor the maximum plant species richness in small spatial grains
(Wilson et al. 2012) what may have a significant
impact on bee communities, especially taking into
account the methodology used to study them
(generally with low geographic coverage).
Ecological theory foretold that habitats with
higher resource availability (in this case, plant
species) would allow higher species packing. But
this statement does not seem to apply to social and
solitary species in the same way. An important
shift in community structure may benefit solitary
species: towards the south, highly eusocial bees
are generally less prominent in the bee assemblages (Roubik 1989; Camargo 1994; Biesmeijer
and Slaa 2006). Biesmeijer and Slaa (2006) in
particular observed that, regarding eusocial bee
assemblages, the more food plant species the
lower the species packing. According to them, an
explanation for that might be that a wider range of
food plants creates new niches for specialists, but
does not necessarily create more niches for
generalists, e.g., social bees. This statement was
recently confirmed by Ebeling et al. (2011), who
noted that flower resource specialization of
solitary bees increased with increasing flowering
plant species richness. Therefore, the increase on
the number of available plant species, followed by
the reduction in richness and abundance of
“toughest competitors” (the highly eusocial bees)
may benefit most bee groups.
A higher temporal species turnover may be a
consequence of a direct influence of the temperature range on species richness and diversity.
Temporal environmental variability can promote
species richness (e.g., Chesson 2000; Soininen
2010) as species can exploit temporal niches
created by environmental fluctuations (see White
2010). So, one should expect a higher rate of
substitution of species along time, if temporal
turnover is indeed larger in places with more
pronounced temperature ranges. Besides,
voltinism of tropical bees has been less studied
than temperate zones bees (Cardoso and Silveira
2012), a general rule for insects is that the lower
the latitude the greater is the number of generations produced per year (e.g., Ishihara 1998),
since life history traits related to diapauses and
voltinism are also a consequence of climatic
adaptations (Tauber and Tauber 1981; Noriyuki
et al. 2011). So, one could expect to find a
significant number of univoltine species with a
short lifespan in places with higher climatic
variability. But of course this does not imply
replacement of species along the year, as it may
only reflect a strong seasonal pattern on bee
assemblages. In spite of few studies on this issue,
the seasonal pattern of activity appears to be a
general characteristic of subtropical bee communities in Brazil (Kamke et al. 2011), where the
richest assemblages are encountered.
We would like to emphasize that generalizations
from our results should be viewed with caution for
two main reasons. Firstly, our analyses did not
consider data from Amazonian Forest and areas
from higher latitudes (more than latitude −30,
mainly in Argentina). Surveying bees on forests
are restrictive due to the difficulty of visualization
and capture of bees (Silveira et al. 2002a),
including the Atlantic Forest (e.g., Gonçalves and
Brandão 2008), and the absence of data from the
Amazonian bee fauna brings an enormous difficulty to evaluate the response of bees to broad
ecological patterns, as the forest covers most
portions of lower latitudes of South America.
Assessments of bee assemblages from temperate
areas south of −30 could also provide interesting
results, helping to refine the perception of these
patterns. In second place, available studies suggest
that bee faunas are locally diverse in response to
habitat heterogeneity (e.g., Gonçalves et al. 2009;
Silveira and Campos 1995; Zanella 2003), highly
variable in space and time, and often rich in rare
species. All of these attributes indicate that intense
sampling among sites and years will be required to
characterize bee assemblages (Williams et al.
2001). But all is not lost. Besides a judicious
choice of surveys for the dataset and the use of
rarefaction techniques, bee communities as a
whole seem to be stable in comparison to the
stability of individual species (e.g., Wolda and
Roubik 1996; Roubik and Ackerman 1987;
Ebeling et al. 2011). And the power of subsamples
Abiotic correlates of bee diversity
to provide reliable estimates of bee richness, also
dealing with different sampling efforts, cannot be
disregarded (Cure et al. 1991; Williams et al. 2001).
We found that bee diversity and composition in
eastern Neotropics respond to abiotic variables,
according to the expected prediction that bees are
positively related to latitude and, consequently, to
its collinear components, a result, for sure,
important to contextualize discussion on bee
assemblages on the region. There is an intricate
response of bees to a gradient of temperature, and
assemblages along this gradient are understood to
be important units of diversity, claiming for a wide
preservation strategy. We see interesting perspectives with the future investigations based on
structured inventories of communities from south
and western portions of the continent, which will
help expanding and refining our knowledge on the
diversity of bees along the Neotropical Region.
ACKNOWLEDGEMENTS
We thank Antonio J. C. Aguiar and Gabriel A. R.
Melo for early help on data tabulation and discussion. We
are grateful to Eduardo A. B. Almeida for critically
reading and reviewing the grammar and style of the
manuscript, Rogério Rosa da Silva and Claus Rasmussen
for critically reading the manuscript, Elaine D. G. Soares
for helping with the preparation of Figures 1 and 6, and
Peter Löwenberg Neto for providing the shape file of
Neotropics depicted in Figure 1.
Corrélations entre facteurs abiotiques et diversité et
composition des assemblages d’espèces d’abeilles le
long de la zone néotropicale orientale
Apidae / Apoidea / diversité faunistique / pollinisateur
Abiotische Faktoren korrelieren mit Diversität und
Zusammensetzung von Bienenarten in der östlichen
Neotropis
Apidae / Apoidea / Bienenfauna / Diversiät / Bestäuber
REFERENCES
Abrahamczyk, S., Gottleuber, P., Matauschek, C., Kessler,
M. (2011) Diversity and community composition of
euglossine bee assemblages (Hymenoptera: Apidae) in
559
western Amazonia. Biodivers. Conserv. 20, 2981–
3001
Aguiar, A.J.C., Martins, C.F. (2003) The bee diversity of the
Tabuleiro vegetation in the Guaribas Biological Reserve
(Mamanguape, Paraíba, Brazil). In: Melo, G.A.R.,
Alves-dos-Santos, I. (eds.) Apoidea Neotropica:
Homenagem aos 90 Anos de Jesus Santiago Moure,
pp. 209–216. Editora UNESC, Criciúma
Aguiar, A.J.C., Melo, G.A.R. (2008) Biogeografia de
áreas abertas da América do Sul, com ênfase em
abelhas da tribo Tapinotaspidini (Hymenoptera,
Apidae). In: de Jong, D., Francoy, T.M., Santana,
W.C. (eds.) Anais do VIII Encontro sobre Abelhas,
pp. 218–223. FUNPEC, Ribeirão Preto
Aguiar, C.M.L., Martins, C.F. (1997) Abundância relativa,
diversidade e fenologia de abelhas (Hymenoptera,
Apoidea) na caatinga, São João do Cariri, Paraíba.
Brasil. Iheringia Ser. Zool. 83, 151–163
Aguiar, C.M.L., Zanella, F.C.V. (2005) Estrutura da
comunidade de abelhas (Hymenoptera: Apoidea:
Apiformis) de uma área na margem do domínio
da caatinga (Itatim, BA). Neotrop. Entomol. 34,
15–24
Albuquerque, P.M.C., Ferreira, R.G., Rêgo, M.M.C.,
Santos, C.S., Brito, C.M.S. (2001) Levantamento da
fauna de abelhas silvestres (Hymenoptera: Apoidea)
na região da “Baixada Maranhense”: Vitória do
Mearim, MA, Brasil. Acta Amaz. 31, 419–430
Almeida, M.C. (2003) Taxonomia e biocenótica de
Apoidea (Hymenoptera) de áreas restritas de cerrado
no município de Jaguariaíva, Paraná, sul do Brasil.
PhD thesis, Universidade Federal do Paraná, Curitiba.
Barbola, I.F. (2000) Biocenótica de Apoidea
(Hymenoptera) de uma área restrita da Floresta
Atlântica, Morretes, Paraná, Brasil, e aspectos da
ecologia da polinização de Stachytarpheta maximiliani
(Verbenaceae). PhD thesis, Universidade Federal do
Paraná, Curitiba.
Barbola, I.F., Laroca, S. (1993) A comunidade de Apoidea
(Hymenoptera) da Reserva Passa Dois (Lapa, Paraná,
Brasil): 1. Diversidade, abundância relativa e atividade
sazonal. Acta Biol. Par. 22, 91–113
Biesmeijer, J.C., Slaa, E.J., de Castro, M.S., Viana, B.F.,
Kleinert, A.M.P., Imperatriz-Fonseca, V.L. (2005)
Connectance of Brazilian social bee: food plant
networks is influenced by habitat, but not by latitude,
altitude or network size. Biota Neotrop. 5, 85–93
Biesmeijer, J.C., Roberts, S.P.M., Reemer, M.,
Oholemuller, R., Edwards, M., et al. (2006) Parallel
declines in pollinators and insect-pollinated plants in
Britain and the Netherlands. Science 313, 351–354
Biesmeijer, J.C., Slaa, E.J. (2006) The structure of eusocial
bee assemblages in Brazil. Apidologie 37, 240–258
Boaventura, M.C. (1998) Sazonalidade e estrutura de uma
comunidade de abelhas silvestres (Hymenoptera,
Apoidea) numa área de cerrado do Jardim Botânico
de Brasília, Distrito Federal. MSc thesis, Universidade
de Brasília, Brasília.
560
L.R.R. Faria and R.B. Gonçalves
Bortoli, C., Laroca, S. (1997) Melissocenologia no
Terceiro Planalto Paranaense. I: Abundância relativa
das abelhas silvestres em um biótopo urbano de
Guarapuava (PR, Brasil). Acta Biol. Par. 26, 51–86
Burnham, K.P., Anderson, D.R. (2002) Model selection
and multimodel inference: a practical informationtheoretic approach. Springer, New York
Camargo, J.M.F. (1994) Biogeografia de Meliponini
(Hymenoptera, Apidae, Apinae): a fauna Amazônica.
In: Garófalo, C.A. (ed.) Anais do II Encontro sobre
Abelhas, pp. 46–59. FFCLRP/USP, Ribeirão Preto
Cardoso, C.F., Silveira, F.A. (2012) Nesting biology of two
species of Megachile (Moureapis) (Hymenoptera:
Megachilidae) in a semideciduous forest reserve in
southeastern Brazil. Apidologie 43, 71–81
Cassemiro, F.A.S., Barreto, B.S., Rangel, T.F.L.V.B.,
Diniz-Filho, J.A.F. (2007) Non-stationarity, diversity
gradients and the metabolic theory of ecology.
Global Ecol. Biogeogr. 16, 820–822
Chesson, P. (2000) Mechanisms of maintenance of species
diversity. Annu. Rev. Ecol. Syst. 31, 343–366
Clarke, K.R., Warwick, R.M. (2001) Change in marine
communities. An approach to statistical analysis and
interpretation. Primer-E, Plymouth
restrita de campo natural no Parque Estadual de Vila
Velha, Paraná: diversidade, fenologia e fontes florais
de alimento. Rev. Bras. Entomol. 49, 557–571
Gonçalves, R.B., Melo, G.A.R., Aguiar, A.J.C. (2009)
A assembléia de abelhas de uma area restrita de
campos naturais do Parque Estadual de Vila Velha.
Paraná e comparações com áreas de campos e
cerrado. Pap. Avulsos Zool. 49, 163–181
Gotelli N.J., Entsminger G.L. (2004) EcoSim: Null
models software for ecology. Version 7. Acquired
Intelligence Inc. and Kesey-Bear. Burlington.
Grundel, R., Jean, R.P., Frohnapple, K.T., Glowacki, G.A.,
Scott, P.E., Pavlovic, N.B. (2010) Floral and nesting
resources, habitat structure, and fire influence bee
distribution across and open-forest gradient. Ecol.
Appl. 20, 1678–1692
Hammer, O., Harper, D.A.T., Ryan, P.D. (2001) PAST:
Paleontological statistics software package for education and data analysis. Palaeontol. Electron. 4, 1–9
Hijmans, R.J., Cameron, S.E., Parra, J.L., Jones, P.G.,
Jarvis, A. (2005) Very high resolution interpolated
climate surfaces for global land areas. Int. J.
Climatol. 25, 1965–1978
Hildebrand, H. (2004) On the generality of the latitudinal
diversity gradient. Am. Nat. 163, 192–211
Cure, J.R., Bastos, G.S.B., Oliveira, M.J.F., Souza, O.F.
(1991) Influência do tamanho da amostra na
estimativa da riqueza em espécies em levantamentos
de abelhas silvestres (Hymenoptera, Apoidea). Rev.
Bras. Zool. 7, 101–110
Hoffmann, M. (1990) Estrutura e importância de uma
comunidade de abelhas no Rio Grande do Sul, para
a polinização de plantas cultivadas. PhD thesis,
Universidade Federal do Paraná, Curitiba.
Diniz-Filho, J.A.F., Bini, L.M., Hawkins, B.A. (2003)
Spatial autocorrelation and red herrings in geographical ecology. Global Ecol. Biogeogr. 12, 53–64
Hurlbert, S.H. (1971) The non-concept of species
diversity: a critique and alternative parameters.
Ecology 52, 577–586
Ebeling, A., Klein, A.-M., Tscharntke, T. (2011) Plant–
flower visitor interaction webs: temporal stability and
pollinator specialization increases along an experimental
plant diversity gradient. Basic Appl. Ecol. 12, 300–309
Ishihara, M. (1998) Geographic variation in insect developmental period: effect of host plant phenology on the
life cycle of the bruchid seed feeder Kytorhinus
sharpianus. Entomol. Exp. Appl. 87, 311–319
Faria-Mucci, G.M., Camargo, J.M.F. (1996) A flora
melitófila e a fauna de Apoidea em um ecossistema de
campos rupestres, Serra do Cipó, Minas Gerais, Brasil.
In: Garófalo, C.A. (ed.) Anais do II Encontro sobre
Abelhas, pp. 217–224. FFCLRP/USP, Ribeirão Preto
Jamhour, J., Laroca, S. (2004) Uma comunidade de abelhas
silvestres (Hym., Apoidea) de Pato Branco (PRBrasil): diversidade, fenologia, recursos florais e
aspectos biogeográficos. Acta Biol. Par. 33, 27–119
Faria-Mucci, G.M., Melo, G.A.R., Campos, L.A.O. (2003)
A fauna de abelhas (Hymenoptera, Apoidea) e plantas
utilizadas como fonte de recursos florais, em um
ecossistema de campos rupestres em Lavras Novas,
Minas Gerais, Brasil. In: Melo, G.A.R., Alves-dosSantos, I. (eds.) Apoidea Neotropica: Homenagem aos
90 Anos de Jesus Santiago Moure, pp. 241–256. Editora
UNESC, Criciúma
Gaston, K.J. (2000) Global patterns in biodiversity.
Nature 405, 220–227
Gonçalves, R.B., Brandão, C.R.F. (2008) Diversidade de
abelhas (Hymenoptera, Apidae) ao longo de um
gradiente latitudinal na Mata Atlântica. Biota Neotrop.
8, 51–61
Gonçalves, R.B., Melo, G.A.R. (2005) A comunidade de
abelhas (Hymenoptera, Apidae s.l.) em uma área
Jarque, C., Bera, A. (1980) Efficient tests for normality,
homoscedasticity and serial independence of regression residuals. Econ. Let. 6, 255–259
Jetz, W., Rahbek, C., Lichstein, J.W. (2005) Local and
global approaches to spatial data analysis in ecology.
Global Ecol. Biogeogr. 14, 97–98
Kamke, R., Zillikens, A., Steiner, J. (2011) Species richness
and seasonality of bees (Hymenoptera, Apoidea) in a
restinga area in Santa Catarina, southern Brazil. Stud.
Neotrop. Fauna Environ. 46, 35–48
Koellner, T., Hersperger, A.M., Wohlgemuth, T. (2004)
Rarefaction method for assessing plant diversity on
a regional scale. Ecography 27, 532–544
Kosior, A., Celary, W., Olejniczak, P., Fijal, J., Król, W.,
Solarz, W., Ponka, P. (2007) The decline of bumble bees
and cuckoo bees (Hymenoptera: Apidae: Bombini) of
western and central Europe. Oryx 41, 79–89
Abiotic correlates of bee diversity
Krug, C., Alves-dos-Santos, I. (2008) O uso de
diferentes métodos para amostragem da fauna de
abelhas (Hymenoptera: Apoidea), um estudo em
Floresta Ombrófila Mista em Santa Catarina.
Neotrop. Entomol. 37, 265–278
Laroca, S., Orth, I. (2002) Melissocoenology: historical
perspective, methods of sampling, and recommendations. In: Kevan, P.G., Imperatriz-Fonseca, V.L.
(eds.) Pollinating bees: the conservation link between agriculture and nature, pp. 217–225. Ministry
of Environment, Brasília
Lazaridis, A. (2007) A note regarding the condition number:
the case of spurious and latent multicollinearity. Qual.
Quant. 41, 123–135
Ludwig, J.A., Reynolds, J.F. (1988) Statistical ecology: a
primer on methods and computing. Wiley, New York
Madeira-da-Silva, M.C., Martins, C.F. (2003) Abelhas
(Hymenoptera, Apoidea Apiformes) de uma área de
restinga, Paraíba, Nordeste do Brasil: abundância,
diversidade e sazonalidade. Rev. Nordest. Biol. 17,
75–90
Maia, C.M. (2008) Fauna de abelhas da Reserva
Particular do Patrimônio Natural do Rio Cachoeira
no município de Antonina, Paraná. MSc thesis,
Universidade Federal do Paraná, Curitiba.
Martins, A.C., Melo, G.A.R. (2010) Has the bumblebee
Bombus bellicosus gone extinct in the northern
portion of its distribution range in Brazil? J. Insect
Conserv. 14, 207–210
Martins, C.F. (1990) Estrutura da comunidade de abelhas
(Hymenoptera, Apoidea) na Caatinga (Casa Nova,
BA) e na Chapada Diamantina (Lençóis, BA). PhD
thesis, Universidade de São Paulo, São Paulo.
Martins, C.F. (1994) Comunidade de abelhas (Hym.,
Apoidea) da caatinga e do cerrado com elementos de
campo rupestre do estado da Bahia. Brasil. Rev.
Nordest. Biol. 9, 225–257
Martins-Ramos, D., Chaves, C.L., Bortoluzzi, R.L.C.,
Mantovani, A. (2011) Florística de floresta ombrófila
mista altomontana e de campos em Urupema, Santa
Catarina. Brasil. Rev. Bras. Bioci. 9, 156–166
Mason, R.L., Gunst, R.F., Hess, J.L. (1989) Statistical
design and analysis of experiments: applications to
engineering and science. Wiley, New York
Mateus, S. (1998) Abundância relativa, fenologia e visita às
flores pelos Apoidea do cerrado da estação Ecológica
de Jataí–Luis Antonio–SP. MSc thesis, Faculdade de
Filosofia, Ciências e Letras, Universidade de São
Paulo, Ribeirão Preto.
Melo, G.A.R. (2007) Introductory Remarks. In: Moure, J.S.,
Urban, D. and Melo, G.A.R. (eds.) Catalogue of Bees
(Hymenoptera, Apoidea) in the Neotropical Region, pp.
v–xi. Sociedade Brasileira de Entomologia, Curitiba.
Michener, C.D. (1979) Biogeography of the bees. Ann.
Mo. Bot. Gard. 66, 277–347
Michener, C.D. (2007) The bees of the world. The Johns
Hopkins University Press, Baltimore
561
Millet-Pinheiro, P., Schlindwein, C. (2008) Comunidade
de abelhas (Hymenoptera, Apoidea) e plantas em
uma área do Agreste pernambucano. Brasil. Rev.
Bras. Entomol. 52, 625–636
Minchin, P.R. (1987) An evaluation of relative robustness of techniques for ecological ordinations.
Vegetatio 69, 89–107
Morato, E.F., Martins, R.P. (2006) An overview of proximate factors affecting the nesting behavior of solitary
wasps and bees (Hymenoptera: Aculeata) in preexisting
cavities in wood. Neotrop. Entomol. 35, 285–298
Morrone, J.J. (2006) Biogeographic ares ans transition
zones of latin America and the caribbean islands
based on panbiogeographic and cladistic analyses of
the entomofauna. Annu. Rev. Entomol. 51, 467–494
Mouga, D.M.D.S., Krug, C. (2010) Comunidade de abelhas
nativas (Apidae) em Floresta Ombrófila Densa Montana
em Santa Catarina. Zoologia 27, 70–80
Moure, J.S. (1967) A check-list of the known euglossine
bees (Hymenoptera: Apidae). Atas Simp. Biota Amaz.
5, 395–415
Neter, J., Wasserman, W., Kutner, M.H. (1989) Applied
linear regression Models. McGraw-Hill, Homewood
Noriyuki, S., Akiyama, K., Nishida, T. (2011) Lifehistory tratits related to diapause in univoltine and
bivoltine populations of Ypthima multistriata
(Lepidoptera: Satyridae) inhabiting similar latitudes.
Entomol. Sci. 14, 254–261
O'Brien, R.M. (2007) A caution regarding rules of thumb for
variance inflation factors. Qual. Quant. 41, 673–690
Oliveira, F., Mendonça, M.W.A., Vidigal, M.C.S., Rego,
M.M.C., Albuquerque, P.M.C. (2010) Comunidade de
abelhas (Hymenoptera, Apoidea) em ecossistema de
dunas na Praia de Panaquatira, São José de Ribamar,
Maranhão. Brasil. Rev. Bras. Entomol. 54, 82–90
Pedro, S.R.M. (1992) Sobre as abelhas (Hymenoptera,
Apoidea) em um ecossistema de cerrado (Cajuru,
Estado de São Paulo): composição, fenologia e visita
às flores. MSc thesis, Faculdade de Filosofia, Ciências
e Letras, Universidade de São Paulo, Ribeirão Preto.
Pinheiro-Machado, C. (2002) Brazilian bee biodiversity:
what has been done and what is to be done. In:
Garófalo, C.A., Freitas, G. (eds.) Anais do V Encontro
Sobre Abelhas, pp. 95–107. FUNPEC, Ribeirão Preto
Ramalho, M. (1995) A diversidade de abelhas (Apoidea,
Hymenoptera) em um remanescente de Floresta
Atlântica, em São Paulo. PhD thesis, Universidade
de São Paulo, São Paulo.
Rangel, T.F., Diniz-Filho, J.A.F., Bini, L.M. (2010)
SAM: a comprehensive application for spatial
analysis in macroecology. Ecography 33, 46–50
Roubik, D.W. (1989) Ecology and natural history of
tropical bees. Cambridge University Press, New York
Roubik, D.W., Ackerman, J.D. (1987) Long-term ecology of euglossine orchid-bees (Apidae: Euglossini)
in Panama. Oecologia 73, 321–333
562
L.R.R. Faria and R.B. Gonçalves
Roubik, D.W., Hanson, P.E. (2004) Orchid bees of tropical
America: biology and field guide. INBIO, San Jose
Sakagami, S.F., Laroca, S., Moure, J.S. (1967) Wild bee
biocoenotics in São José do Pinhais (PR), South
Brazil. Preliminary report. J. Fac. Sci. Hokkaido
Univ. Ser 6 (Zool.) 16, 253–291.
Sanders, H.L. (1968) Marine benthic diversity: a
comparative study. Am. Nat. 102, 243–282
Santiago, L.R., Brito, R.M., Muniz, T.M.V.L., Oliveira,
F.F., Francisco, F.O. (2009) A fauna apícola do
Parque Municipal Cachoeirinha (Iporá, GO). Biota
Neotrop. 9, 393–397
Warton, D.I., Hui, F.K.C. (2011) The arcsin is asinine:
the analysis of proportions in ecology. Ecology 92,
3–10
Wcislo, W.T., Cane, J.H. (1996) Floral resource utilization by solitary bees (Hymenoptera: Apoidea) and
exploitation of their stored food by natural enemies.
Annu. Rev. Entomol. 41, 257–286
Weiss, G. (2008) A fauna de abelhas (Hymenoptera,
Apidae) do Parque Estadual de Campinhos, Paraná,
Brasil. Undergraduate thesis, Universidade Federal
do Paraná, Curitiba.
Santos, M.F., Carvalho, C.A.L., Silva, R.F. (2004)
Diversidade de abelhas (Hymenoptera: Apoidea) em
uma área de transição Cerrado-Amazônia. Acta Amaz.
34, 319–328
Wilms, W. (1995) Die bienenfauna im Küstenregenwald
Brasiliens und ihre Beziehungen zu Blütenplanzen:
Fallstudie Boracéia, São Paulo. PhD thesis, Fakultät
für Biologie der Eberhard-Karls-Universität Tübingen,
Tübingen.
Schleuning, M., Farwig, N., Peters, M.K., Bergsdorf, T.,
Bleher, B., et al. (2011) Forest fragmentation and
selective logging have inconsistent effects on multiple
animal-mediated ecosystem processes in a tropical
forest. PLoS ONE. doi:10.1371/journal.pone.0027785
Williams, N.M., Minckley, R.L., Silveira, F.A. (2001)
Variation in native bee faunas and its implications
for detecting community changes. Conserv. Ecol.
5. Available in: http://www.consecol.org/vol5/iss1/
art7/.
Silveira, F.A., Campos, M.J.O. (1995) A melissofauna de
Corumbataí (SP) e Paraopeba (MG) e uma análise da
biogeografia das abelhas do cerrado brasileiro
(Hymenoptera, Apoidea). Rev. Bras. Entomol. 39,
371–401
Willig, M.R., Kaufman, D.M., Stevens, R.D. (2003)
Latitudinal gradients of biodiversity: pattern, process, scale and synthesis. Annu. Rev. Ecol. Evol.
Syst. 34, 273–309
Silveira, F.A., Melo, G.A.R., Almeida, E.A.B. (2002a)
Abelhas brasileiras: sistemática e identificação.
Author’s edition, Belo Horizonte
Silveira, F.A., Pinheiro-Machado, C., Alves-dos-Santos, I.,
Imperatriz-Fonseca, V.L., Kleinert, A.M.P. (2002b)
Taxonomic constraint for the conservation and sustainable use of wild pollinators—the Brazilian wild bees. In:
Kevan, P.G., Imperatriz-Fonseca, V.L. (eds.) Pollinating
bees: the conservation link between agriculture and
nature, pp. 41–50. Ministry of Environment, Brasília
Simberloff, D.S. (1972) Properties of the rarefaction
diversity measurement. Am. Nat. 106, 414–418
Soininen, J. (2010) Species turnover along abiotic and
biotic gradients: patterns in space equal patterns in
time? BioScience 60, 433–439
Steffan-Dewenter, I. (2003) Importance of habitat area
and landscape context for species richness of bees
and wasps in fragmented orchard meadows.
Conserv. Biol. 17, 1036–1044
Sydney, N.V., Gonçalves, R.B., Faria, L.R.R. (2010) Padrões
espaciais na distribuição de abelhas Euglossina
(Hymenoptera, Apidae) da região Neotropical. Pap.
Avulsos Zool. 50, 667–679
Tauber, C.A., Tauber, M.J. (1981) Insect seasonal cycles:
genetics and evolution. Annu. Rev. Ecol. Syst. 12,
281–308
Thadewald, T., Büning, H. (2007) Jarque–Bera test and
its competitors for testing normality—a power
comparison. J. Appl. Stat. 34, 87–105
Wilson, J.B., Peet, R.K., Dengler, J., Pärtel, M. (2012)
Plant species richness: the world records. J. Veg.
Sci. 23, 796–802
White, E.P., Morgan Ernest, S.K., Adler, P.B., Hurlbert,
A.H., Kathleen Lyons, S. (2010) Integrating spatial
and temporal approaches to understanding species
richness. Philos. Trans. R. Soc. B 365, 3633–3643
Wolda, H., Roubik, D.W. (1996) Nocturnal bee abundance and seasonal bee activity in a Panamanian
forest. Ecology 67, 426–433
Winfree, R., Aguilar, R., Vazquez, D.P., LeBuhn, G.,
Aizen, M.A. (2009) A meta-analysis of bees responses
to anthropogenic disturbance. Ecology 90, 2068–2076
Zanella, F.C.V. (2000) The bees of the Caatinga
(Hymenoptera, Apoidea, Apiformes): a species list
and comparative notes regarding their distribution.
Apidologie 31, 579–592
Zanella, F.C.V. (2002) Sistemática, filogenia e
distribuição geográfica das espécies sul-americanas
de Centris (Paracentris) Cameron, 1903 e de
Centris (Penthemisia) Moure, 1950, incluindo uma
análise filogenética do "grupo Centris" sensu Ayala
1998 (Hymenoptera, Apoidea, Centridini). Rev.
Bras. Entomol. 46, 435–488
Zanella, F.C.V. (2003) Abelhas da Estação Ecológica do
Seridó (Serra Negra do Norte, RN): aportes ao
conhecimento da diversidade, abundância e distribuição
espacial das espécies na Caatinga. In: Melo, G.A.R.,
Alves-dos-Santos, I. (eds.) Apoidea Neotropica:
Homenagem aos 90 Anos de Jesus Santiago Moure, pp.
231–240. Editora UNESC, Criciúma
Download