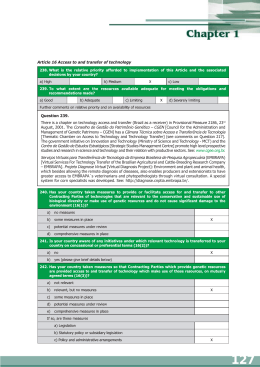
Tropentag 2015, Berlin, Germany
September 16-18, 2015
Conference on International Research on Food Security, Natural Resource
Management and Rural Development
organised by the Humboldt-Universität zu Berlin and the Leibniz Centre for
Agricultural Landscape Research (ZALF)
Human development and food (in)security in Brazil: Prioritisation of regions for policies
targeting rice and bean production
Silvaa, Osmira Fátima da, Alcido Elenor Wanderab, José Geraldo Di Stéfanoa and Agostinho
Dirceu Didoneta
a Brazilian Agricultural Research Corporation (EMBRAPA), National Rice and Beans Research Center (CNPAF),
Brazil. Email [email protected].
b Faculdades Alves Faria (ALFA), Av. Perimetral Norte, 4129 - Vila João Vaz, CEP 74445-190 Goiânia, GO, Brazil.
Introduction
Rice and beans represent staple crops in Brazil. They are grown mainly for domestic
consumption. Small farmers, in Brazil commonly considered as ‘family farmers’, do a significant
part of the production of both staples.
The Human Development Index (HDI) as considered in the UN Human Development Report,
considers important areas of human development to ensure quality of life for the population, such
as health, education and income. Health, measures the longevity index (long and healthy life); in
education, it is considered the access to knowledge, i.e. investigates the average years of adult
education and expected years of schooling for children at the age of starting school life and, with
respect to income (standard of living), measure the GDP per capita. Brazil is among the countries
with high human development.
In Brazil, rural poverty often relates to regions where small farming is the main form of
agricultural production. In those areas, farming is directly linked with food security of rural
population.
Thus, the objective of this study was to identify the main poverty areas in Brazil and check if they
are important in growing rice and beans in order to be considered as priority areas for agricultural
research and extension services.
Material and Methods
As poverty, we consider a monthly per capita income of less than US$ 100 and very low (0 0.499) and low (0.5 – 0.599) HDI according to the Human Development Report 2014 (UNDP,
2014).
The HDI at municipality level (HDI-M) has been obtained from the Brazilian Institute of
Geography and Statistics (IBGE, 2015a/b) and are considered as follows: very low (0.0 – 0.499),
low (0.5 – 0.599), average (0.6 – 0.699), high (0.7 – 0.799) and very high (0.8 – 1.0).
Poverty data are based on national household survey data.
Rice and bean production data is based on national statistics from several official sources
(Agricultural Census and annual estimations). According to last Agricultural Census, Brazil had
313,561 farms growing rice (Silva and Wander, 2014) and 1,208,545 farms producing dry beans
(cow peas and common beans) (Silva and Wander, 2013).
Cluster analysis and spatial correlation is done to identify priority target regions for
implementation of technology transfer and extension services focusing on improving food
security.
Results and Discussion
Analysing the average national bean production in the municipalities that have the lowest HDI,
their average yields are much below expectations for common beans (Phaseolus vulgaris L.). In
2013, average common bean yield was 1,214 kg/ha and 1,205 kg/ha in 1st and 2nd harvest seasons,
respectively. Rice yields in these municipalities with low HDI were also much lower than the
national average of 5,003 kg paddy/ha in 2013, being 1,701 kg paddy/ha for upland rainfed rice
and 7,219 kg paddy/ha for lowland irrigated rice.
Looking to data from selected Brazilian states (Table 1), it becomes clear that states like
Maranhão, Tocantins, Piauí and Bahia are among the regions that have weak human development
and high poverty rates, and low yields for rice and beans. Together, these states form the region
called MATOPIBA (Figure 1), which is considered the last agricultural frontier in Brazil and one
of the last frontiers worldwide. Several policies are targeting this region in order to promote
agribusiness development in this region.
Table 1: Rice and bean production combined with poverty and human development indicators, selected Brazilian
states.
Harvested area
Production
Average
Number of ‘family
Poverty
HDI(1,000 ha)
(1,000 t)**
yield (kg/ha)
farms’ (in 1,000)***
index (%)
M
Brazil (whole
Beans
3,065
3,041
992
1,209
0.744
country)
Rice
2,506
12,270
4,895
314
Maranhão
Beans
90
40
449
28
56.38
0.639
Rice
431
543
1,260
121
Tocantins
Beans
25
28
1,111
3
41.28
0.699
Rice
120
435
3,640
11
Piauí
Beans
197
49
247
98
53.11
0.646
Rice
121
164
1,360
56
Bahia
Beans
327
187
570
200
43.47
0.660
Rice
14
25
1,748
4
Minas Gerais
Beans
399
594
1,488
100
26.6
0.731
Rice
30
62
2,113
16
São Paulo
Beans
119
213
1,793
4
26.6
0.783
Rice
23
96
4,273
1
Paraná
Beans
485
731
1,507
64
39.07
0.749
Rice
36
182
5,115
11
Mato Grosso
Beans
186
240
1,289
2
34.34
0.725
Rice
168
536
3,186
5
Goiás
Beans
134
314
2,335
2
33.90
0.735
Rice
58
177
3,061
6
Rio Grande do Beans
81
100
1,236
93
25.94
0.746
Sul
Rice
1,097
8,244
7,514
6
Santa Catarina Beans
89
136
1,521
33
27.19
0.744
Rice
149
1,033
6,924
6
* Beans represent the sum of 3 cropping seasons. ** Rice is considered as paddy (before milling). *** ‘Family farms’ in Brazil
refer to small holdings with mainly family labor and farm income represent main part of total household income (Brasil, 2006).
Source: Own compilation from several official sources (UNDP, IBGE etc.).
State
Crop*
Within the MATOPIBA states Maranhão, Tocantins, Piauí and Bahia states, several
municipalities will be the focus of development-oriented projects. Food crops liken rice and
beans are crucial for local communities but there are open questions not answered yet, like if
those crops will be competitive at local level, since cash crops (soybeans, cotton, maize etc.) are
being promoted at large scale.
Figure 1: Map of the MATOPIBA region inside Brazil.
Source: https://www.embrapa.br/busca-de-noticias/-/noticia/2248938/gestao-territorial-e-essencial-paracompreender-a-dinamica-da-producao-agricola-do-matopiba.
MATOPIBA region is formed by 31 micro regions and 337 municipalities of four states. The
total area is 73 million hectares.
Since rice and bean yields are comparatively low in MATOPIBA states, except Tocantins,
specific measures focusing on increasing efficiency of staple crops are to be taken. Among those
actions are extension services to delivery adequate knowledge about good agricultural practices
associated with credit and infrastructure.
In May 2015 Brazil launched the Development Agency of the Matopiba region. This Agency will
be in charge of research, innovation, precision agriculture and technical assistance to farmers in
this region.
Conclusions and Outlook
In the majority of municipalities with the lowest HDI, rice and bean production is weak and of
low technological level, mainly done by family labour. In the states of Maranhão and Piauí, who
are part of the “MATOPIBA” region (last agricultural frontier region of Brazil, as part of the
states of Maranhão, Tocantins, Piauí and Bahia), the lowest HDI’s are found. Education
dimension represent the weakest part of HDI in those states. The municipalities with the lowest
HDI’s are also located in those states. They represent poverty zones where families have less
income than the daily limit of US$ 1.25 recommended by the United Nations. Low HDI in those
municipalities require targeted policies including training and extension services in order to
improve rice and bean production and, thus, improving food security of poor population.
Acknowledgment
The authors acknowledge the support received from Fundação de Amparo à Pesquisa do Estado
de Goiás (FAPEG) to present this contribution at Tropentag 2015.
References
BRASIL. (2006). Lei nº 11.326, de 24 de julho de 2006. Estabelece as diretrizes para a
formulação da Política Nacional da Agricultura Familiar e Empreendimentos Familiares
Rurais. Diário Oficial da República Federativa do Brasil, Brasília, DF, v.143, n.141, p.1,
25 jul. 2006, Seção 1.
IBGE (2015a). Produção Agrícola Municipal – PAM. Available at:
<http://www.sidra.ibge.gov.br/bda>.
IBGE (2015b). Agricultural Census 2006. Available at: <http://www.sidra.ibge.gov.br>.
SILVA, O.F. da; WANDER, A.E. (2013). O feijão-comum no Brasil: passado, presente e futuro.
Santo Antônio de Goiás: Embrapa Arroz e Feijão. (Embrapa Arroz e Feijão.
Documentos, 287).
SILVA, O.F. da; WANDER, A.E. (2014). O arroz no Brasil: evidências do censo agropecuário
2006 e anos posteriores. Santo Antônio de Goiás: Embrapa Arroz e Feijão. (Embrapa
Arroz e Feijão. Documentos, 299).
UNDP (2014). Human Development Report – 2014.
Download