LIMPOPO CORRIDOR SPATIAL
DEVELOPMENT PROMOTING
AGRO-INDUSTRIAL
PROCESSING
ETC International´Study together with the SEED
STUDY TEAM
António da Silva Francisco
Marco Machado
José Castro
Filomena dos Anjos
Jacinto Mutemba
António André
October 2002
_____________________________________________________________
__________________________________________________
Main Report
ii
_____________________________________________________________
iii
CONTENTS
CONTENTS .............................................................. III
LIST OF TABLES ...................................................... VII
LIST OF GRAPHS ................................................... VIII
LIST OF MAPS .......................................................... IX
EXECUTIVE SUMMARY.............................................. XI
VISION AND DIAGNOSIS .................................................................... xi
ESTRATEGY: SUMMARY OF THE VIABILITY OF THE THREE
ANCHOR PROJECTS ............................................................ xii
PART I. VISION ......................................................... 1
1 INTRODUCTION: Principles, Objectives e Methodology .................... 1
1.1 What does this study offer .......................................................................... 1
1.2 SOME PRINCIPLES UNDERLYING THE STUDY .............................................................. 3
1.3 OBJECTIVES AND MAIN RESULTS OF THE STUDY...................................................... 6
1.4 Methodology ............................................................................................. 7
2 LIMPOPO VALLEY: Area, Population and Economy ............................ 9
2.1 THE LIMPOPO CORRIDOR – the geographical DEFINITION AND SCOPE ............ 9
2.2 BROAD AND NARROW definitionS of the limpopo corridor ............................... 9
2.3 Unprecedented future opportunities for the Limpopo Corridor? ....................... 12
2.4 geral constraints on investment in the Limpopo Corridor.................................. 14
PART II. DIAGNOSIS ............................................... 21
3 HYDRO-AGRICULTURAL INFRASTRUCTURES .................................... 22
3.1 Hydro-agricultural infrastructures along the Limpopo Valley ............................. 23
3.2 Current situation of the irrigated perimeters in the Limpopo Valley .................... 23
3.3 The most common types of irrigation ........................................................... 23
3.4 Potential for irrigation development in the Limpopo Valley ............................... 24
3.5 Prospects for the development of irrigation.................................................... 25
4 AGRICULTURAL SECTOR ................................................................. 26
__________________________________________________
Main Report
_____________________________________________________________
iv
4.1 Agricultural production ..............................................................................27
4.2 Production sytems ....................................................................................29
4.3 Agricultural potential of the area ................................................................30
4.4 The Irrigated Areas...................................................................................30
4.5 Potential for rice production: main production systems .................................32
4.6 Potential for tomato production ...................................................................38
4.7 Investments needed to make tomato production viable ...................................40
4.8
Coastal area .......................................................................................41
4.9
Coconut palms and copra: potential production ......................................41
5 LIVESTOCK SECTOR ........................................................................ 44
5.1
Potential for livestock production ..........................................................44
5.2
Current production and products...........................................................45
5.3
Evolution of numbers of animals - cattle ................................................45
5.4
Projection (forecast for the next 10 years) .............................................46
5.5
Small ruminants (sheep and goats) .......................................................46
5.6
Pigs ..................................................................................................46
5.7
Livestock production ...........................................................................47
5.8
Livestock policy and strategy................................................................48
6 SECTOR AGRO-INDUSTRIAL ........................................................... 51
6.1 conceptual approach .................................................................................51
6.2
Methodology for the approach used in the study .....................................52
6.3
Territory covered by the study .............................................................53
6.4
Crops studied .....................................................................................54
6.5
Potential of the agro-industrial processing sector ....................................55
6.6
Constraints on the agro-industrial processing sector...............................57
6.7
Implications for the selected projects ....................................................58
PART III. STRATEGY ............................................... 62
7 Public Investment to improve the conditions for private
investment ........................................................................ 63
8 Anchor projects identified and developed ...................................... 65
8.1
Anchor projects identified ....................................................................65
8.2
Anchor projects developed ...................................................................66
8.3
Main results of the 3 pre-viability studies ...............................................66
9 PRE-VIABILITY ASSESSMENTS FOR THREE PROJECTS .................... 67
9.1
PROJECT 1: Recovery of the Conhane rice processing factory ...................67
__________________________________________________
Main Report
_____________________________________________________________
9.2
v
PROJECT 2: Chilembene processing factory -Tomatoes, tinned vegetables
and fruit juice concentrates .................................................................. 72
9.3
PROJECT
3:
Construction
of
a
coconut
products
factory
in
Inhambane/Maxixe. ............................................................................ 77
10 BIBLIOGRAPHY ............................................................................ 82
APPENCIES .............................................................. 86
Appendix 1: Terms of Reference
Appendix 2: Pre-viability Study for the Conhane Rice Factory
Appendix 3: Pre-viability Study for the Chilembene Tomato
Factory
Appendix 4: Pre-viability Study for the Coconut Products Factory
in Inhambane/Maxixe
__________________________________________________
Main Report
_____________________________________________________________
__________________________________________________
Main Report
vi
_____________________________________________________________
vii
List of Tables
Table SUMEXC Summary table of the viability indicators of the three
anchor projects ..................................................................... xii
Table 1.1 Estimate of the surface area and population of the Limpopo
Corridor, 1997-2002 ............................................................. 10
Table 1.2: The Index of Economic Freedom, Mozambique 1995-2002 ............. 17
Table 1.3: Business people: What do they want to see solved, and what
do they demand of the Government and of the CTA? ................. 18
Table 2.1 - Irrigable area by basin .............................................................. 24
Table 2.2: Development Potential in the Limpopo Valley ................................ 25
Table 2.3: Use of the area by type of crop ................................................... 27
Table 2.4: Crop areas in Gaza as a percentage of the country ....................... 28
Table 2.5: Number of fruit trees and production, 2000 .................................. 29
Table 2.6: Differing Productive Regions. Area occupied and potential
area (in hectares) ................................................................. 30
Table 2.7: Investment needed to prepare and operate 1,000 hectares
of rice .................................................................................. 35
Table 2.8: Machinery: the costs per hour of the machinery are the same
as the Technological charter, plus 20-25% for
replacement ......................................................................... 36
Table 2.9: Inputs ...................................................................................... 36
Table 2.10: labour .................................................................................... 36
Table 2.11: Transport ................................................................................ 36
Table 2.12: Family Sector: Initial Investment ............................................... 37
Table 2.13: Operation: the costs per H/M are the same as the current
ones plus 20-25% for replacement .......................................... 37
Table 2.14: Inputs .................................................................................... 38
Table 2.15: Minimum areas doer rice ......................................................... 38
Table 2.16: Operation per hectare .............................................................. 40
Table 2.17: Inputs per ha .......................................................................... 40
Table 2.18: Potential production of Copra .................................................... 42
Table 2.19: Place of occupation of the land .................................................. 43
Table 2.20: Rhythm of plant production ....................................................... 43
Table 2.21: Number of each species (Gaza), 2000 ........................................ 44
Table 2.22: Evolution of numbers of pigs ..................................................... 46
Table 2.23: Places visited for the agro-processing industry ............................ 54
Table 3.1: Anchor projects identified ........................................................... 65
__________________________________________________
Main Report
_____________________________________________________________ viii
Table 3.2: Anchor projects developed ......................................................... 66
Table 3.3: PROJECT 1 - Recovery of the Conhane rice processing factory
(short presentation) .............................................................. 78
Table 3.4: Costs and Benefits for Conhane rice processing factory .................. 69
Table 3.5: Rice sale price, August 2002 ....................................................... 70
Table 3.6: Paddy rice – Estimated price paid to the farmer ............................ 70
Table 3.7: Summary of pre-viability indicators for Project 1 - Conhane
rice processing factory ........................................................... 71
Table
3.8:
PROJECT 2 - Chilembene processing factory (short
presentation) ....................................................................... 72
Table 3.9: Costs and Benefits for Chilembene Processing Factory ................... 74
Table 3.10: Tomato Sales Prices, August 2002 ............................................ 75
Table 3.11: Summary of pre-viability indicators for Project 2 –
Chilembene tomato processing factory .................................... 75
Table 3.12: PROJECT 3 – Construction of a coconut products factory in
Inhambane/Maxixe (short presentation) .................................. 77
Table 2.13: Costs and Benefits for Coconut Products Factory in
Inhambane .......................................................................... 78
Table 3.14: Coconut derivatives sales prices, August 2002 ........................... 79
Table 3.15: Summary of pre-viability indicators for Project 3 –
Integrated coconut derivatives processing factory in
Inhambane .......................................................................... 80
List of Graphs
Graph 1.1 Gross domestic product, Mozambique 1996-2000 .......................... 11
Graph 1.2 Weight of the Limpopo Valley in the National Economy
compared with Maputo City and the Southern Region ............... 11
Graph 1.3. Weight of the GDP of the Limpopo Corridor in the Economy
of the Southern Region, Mozambique 1996-2000 ...................... 11
Graph 1.4 Limpopo Corridor, 1996-2000 ..................................................... 12
Graph 1.5 Structure of the GDP of the southern region, with and
without Maputo city, by economic activity, Annual
average between 1996 and 2000 ............................................ 13
Graph 1.6 Evolution of some indicators on investment, and on food and
non-food production: Mozambique versus Sub-Saharan
Africa, 1975-1999 ................................................................. 15
Graph 1.7 African countries ranked according to the improvement index
(1996/1999) of the Africa Competitiveness Report,
2000/2001 ........................................................................... 16
Graph 1.8 Economic Freedom and per Capita Income, 1999 .......................... 19
Graph 1.9 Projection of Property Rights and per Capita Income, 1999 ............. 20
__________________________________________________
Main Report
_____________________________________________________________
ix
Graph 2.1 Rainfall versus Coastal Distance................................................... 26
Graph 2.2 Distribution of Cultivated Area by size of farms .............................. 27
Graph 2.3 Area Used by Type of Crop .......................................................... 28
Graph 2.4 Evolution of Number of Cattle, 1980-2001 .................................... 45
Graph 2.5 Evolution of Number of Goats and Sheep, 1995-2001..................... 46
Graph 2.6 Percentage Contributed to Meat by Species .................................. 47
Graph 2.7 Evolution of Beef Production, 1992-2001 ..................................... 48
Graph 2.8 Rice production in the Limpopo valley........................................... 58
Graph 2.9 RICE: dehusking capacities ......................................................... 59
List of Maps
Map 1.1 Location of Limpopo Cooridor in the Map of Mozambique .................. 1
Map 1.2 Area covered by the Limpopo Corridor ............................................ 10
Map 2.1 Southern provinces of Mozambique ................................................. 26
Map 2.2 Gaza Province .............................................................................. 45
__________________________________________________
Main Report
_____________________________________________________________
xi
EXECUTIVE SUMMARY
VISION AND DIAGNOSIS
1. The main audience for this study consists of business people interest in
investing in the agro-industrial sector in the Limpopo Corridor (CL) region, as
well as all the public or private bodies who are assisting their clients in this
task.
2. The main objective of the study is "To identify agricultural and agro-processing
projects worthy of consideration by the private sector, but which need
additional public investment so that the investment environment may become
truly favourable". More than a simple opportunity study, this work offers a previability assessment, which pre-supposes a pre-selection of projects from a vast
range of possible investment opportunities.
3. The following report has three main parts: Part I - Vision: The Limpopo Corridor
in the context of the Spatial Development Initiative (SDI); Part II - Diagnosis of
the agricultural, livestock and agro-industrial situation, as well as the relevant
infrastructures and investments; Part III - General and specific strategy for
promoting agro-industrial processing in the Limpopo Corridor, including the
results of the pre-viability assessments of three specific projects. So as not to
make the report too exhaustive the complete details of the three specific previability assessment studies have been put in appendices.
4. The study considers the strategic framework and current socio-economic
context, in which agro-industrial processing in the Limpopo Corridor is
emerging, as not only promising and attractive, but also unprecedented.
Indeed, it is even forecast that the Limpopo Corridor will be able, over the next
10 to 20 years, to undergo a radical transformation in its structure of economic
activity, a transformation resulting from the impact of large and medium
projects under implementation in the region - namely, the heavy mineral
sands, the Pande natural gas, the Massingir dam, and cross-border tourism,
among others. These undertakings could, in themselves, revolutionise the
economic structure of southern Mozambique, which is currently heavily
dependent on agriculture. Two possible shifts may occur. One alternative is that
the economic structure of the Limpopo Corridor region changes in a direction
identical to that of the capital; that is, it comes to be dominated by the tertiary
sector, because of growing transport, tourism and commercial activity. The
other possibility is that the secondary sector (mining and manufacturing
industry) comes to play an increasingly dynamic, if not dominate, role in the
region's economy.
5. This is not the first time that attempts have been made to stimulate agroindustrial processing in the Limpopo Valley, but will this process now become
__________________________________________________
Main Report
_____________________________________________________________
xii
sustainable and lastiSubject:ng? The direct and simple answer offered by the
study may be summarised in two words - it depends! It depends, not so much
on extreme economic strategies, like the colonial and the socialist policies of
past decades, but on what is really done so that national capital develops and is
consolidated in Mozambique. In this regard, two important instruments may
contribute to the success of encouraging agro-industrial processing. First, the
Spatial Development Initiative, which has financed this work, and has been
financing various initiatives in the Limpopo Corridor and beyond. Second, and
perhaps even more important, promoting agro-industrial processing will depend
in the long term on Mozambique's capacity to develop legal and institutional
mechanisms able to convert the savings and assets available in the country into
productive and competitive capital.
6. The diagnosis of the current situation stresses the hydro-agricultural sector,
agricultural production, particularly the products selected for pre-viability
assessment, presented in part III, livestock, and agro-industrial processing. The
study also lists the opportunities and the specific constraints on agro-industrial
investment in the Limpopo Corridor.
ESTRATEGY: SUMMARY OF THE VIABILITY OF THE THREE ANCHOR
PROJECTS
7. Three pre-viability studies were selected from among the anchor projects
identified, and their indicators referring to one of the two scenarios considered
(the "realistic" one) are as follows:
TABLE SUMEXC: SUMMARY TABLE OF THE VIABILITY
INDICATORS OF THE THREE ANCHOR PROJECTS
Project 1 – Conhane rice processing factory (recovery,
modernisation and diversification)
Investment needed
Break-even year
"Break-Even"
Sales in Break-even year
Time to recover investment
IRR
NPV
1 333 125$00 USD
Year 3
1 646752 983$00 USD
1 797 277$00 USD
54 months
22,97 %
267 775$00 USD
Project 2 - Chilembene processing factory (tomato paste, tinned
vegetables and fruit juice concentrates: recovery, modernisation
and diversification)
Investment needed
__________________________________________________
Main Report
3,110,442 USD
_____________________________________________________________ xiii
Year 3
%UHDNHYHQ\HDU
"Break-Even"
Sales in Break-even year
Time to recover investment
IRR
NPV
1,221,052 USD
1,850,869 USD
55 months
21,01 %
437,035 USD
Project 3 - Integrated Coconut derivatives processing factory
(Construction of a new factory in Inhambane/Maxixe)
Investment needed
Break-even year
"Break-Even"
Sales in Break-even year
Time to recover investment
IRR
NPV
3,317,469 USD
Year 3
1,637,010 USD
2,356,473 USD
55 months
21.67 %
517,617 USD
For the three 3 projects
Interest rate of bank financing (70% of
the total investment)
10%
Taxes
Payment in full of all existing
taxes is contemplated
Safety for inputs supply (quality, Investment are expected for
quantity and competitiveness)
agricultural tools (in Project 2),
financing of agricultural
productive factors (in the 3
projects), and the required
extension services (in the 3
projects)
8. From the analysis of the economic and financial profitability indicators, it can be
noted that the three projects summarised above are technically, economically
and financially viable, at least in term of pre-viability at the moment. The
precautions taken in the assumptions used and the sensibility analysis made of
the project's critical parameters, give them a very reasonable margin of safety,
and significantly reduce the project risk. For purposes of pre-viability, the net
benefits arising from the processing of produce envisaged for later stages,
which will bring much greater added value to the project, were not considered.
These conclusions will be real to the extent that the constraints identified in
general terms on the agricultural sector and on agro-industry are overcome. In
the investment and costs forecast, measures and the respective resources for
ensuring the supply of raw material, which has been one of the main
constraints on the factories already established, are safeguarded.
9. In sum, with a total private investment in the three anchor projected
selected, amounting about 9 to 10 million US dollars (including investment
into the agricultural sector as a way to unsure the adequate supply in terms
__________________________________________________
Main Report
_____________________________________________________________ xiv
of the required quality, quantity and competitiveness), the basic conditions
can be set up for the promotion of the agricultural and the agro-industrial
activities in the Limpopo Valley. Besides being technically, economically and
financially viable, these three projects can me used, in the way them have
been conceived, as good references of the advisable type of strategy for new
agro-processing projects that eventually will emerge in the Limpopo Valley.
__________________________________________________
Main Report
_____________________________________________________________
1
PART I. VISION
T
TH
HE
EL
LIIM
MP
PO
OP
PO
OC
CO
OR
RR
RIID
DO
OR
R IIN
NT
TH
HE
E
C
CO
XT
ON
TO
NT
TE
OF
EX
FT
TH
HE
ES
SP
PA
AT
TIIA
AL
L
D
DE
EV
VE
EL
LO
OP
PM
ME
EN
NT
T IIN
NIIT
TIIA
AT
TIIV
VE
E
1 INTRODUCTION: PRINCIPLES, OBJECTIVES E METHODOLOGY
1.1 WHAT DOES THIS STUDY OFFER
The main audience for this study consists of businesses interested in investing in
the agro-industrial sector in the Limpopo Corridor (CL) region, as well as all private
or public entities who assist their clients in this task.
Like the other development corridors
already established in Mozambique, the
Limpopo Corridor is defined more by a spirit
of cooperation, generated by a series of
geographical and socio-economic synergies,
than
by
the
politico-administrative
boundaries
fixed
by
the
national
government and by local administrations.
This study intends to go beyond the many
surveys on the rich opportunities for agroindustrial investment in the Limpopo Valley.
Rather than an opportunity study, it is a
study assessing the pre-viability1 of specific
projects resting, on the one hand, on
selecting
some
of
the
commercial
opportunities identified in earlier studies;
and on the other hand, in recognising
projects which, although in an advanced
stage of implementation, are faced with a
range of difficulties.
The context for this study is also different
from the context of earlier studies, both in
1
The term "pre-viability" means the possibility that something specific may be undertaken,
among many others that are necessary or which one would like to do. That is, in the previability phase, one selects the projects to be prioritised, out of a vast range of investment
opportunities.
__________________________________________________
Main Report
_____________________________________________________________
2
terms of the framework for its strategic planning, and in the socio-political
circumstances in which it arose.
The main strategic framework for the study is the so-called Spatial Development
Initiative (SDI); a strategy for encouraging private investment opportunities,
proven to be viable and profitable, in specific areas of southern Africa.
As
for
the
sociocircumstances in which
This study intends to go
the
economic
beyond
the many surveys
the commercial risk
on the rich opportunities
country
particularly
for agro-industrial
the last five years, the
investment in the
by the Limpopo river
Limpopo Valley. Rather
Limpopo railway has
than an opportunity
the most privileged and
study, it is a study
for private investment.
assessing the pre-viability
by the presence of
projects
in
several
of specific projects
activity, which are now
resting, on the one hand,
stage of design, or of
on selecting some of the
such
as
"Corridor
commercial opportunities
processing of heavy
identified in earlier
the Limpopo National
studies; and on the other
Massingir dam; and
hand, in recognising
infrastructure projects
projects which, although
important benefits for
in an advanced stage of
of the Valley in the
implementation, are faced
term - the high tension
with a range of
Inhambane, and the
difficulties.
the natural gas at
Mining Corporation Limited, 2001).
political
the study arose,
environment and
factors in the
stand out. Over
region
covered
basin and the
become one of
attractive areas
This is confirmed
major
anchor
sectors
of
in an advanced
implementation:
Sands"
(the
mineral sands);
Park,
the
two
major
which will bring
the development
medium and long
power
line to
exploitation
of
Pande (Southern
These projects have already benefited from the improvement in economic
conditions for investment and exports created in Mozambique over the past
decade. But their main contribution to a business climate favourable to the
development of agricultural processing takes place mostly at the micro-economic
level: increased size of local markets, re-establishment of trust between
businesses, the public and public bodies, and the improvement in the business
environment
necessary
for
encouraging
efficiency,
productivity
and
competitiveness between the various economic agents at the level of local and
regional markets.
The study report contains three major parts:
Part I.
Vision: The Limpopo Corridor in the context of the Spatial
Development Initiative (SDI);
Part II: Diagnosis of the agricultural, livestock and agro-industrial situation,
as well as the relevant infrastructures and investments;
Part III: General and specific strategy for encouraging agro-industrial
processing in the Limpopo Corridor, including the results of the pre-viability
assessments of three specific projects.
__________________________________________________
Main Report
_____________________________________________________________
3
So as not to make the report too exhaustive the complete details of the three
specific pre-viability assessment studies have been put in appendices.
1.2 SOME PRINCIPLES UNDERLYING THE STUDY
THIS IS NOT THE FIRST TIME THAT ATTEMPTS HAVE BEEN MADE TO PROMOTE
AGRO-INDUSTRIAL PROCESSING IN THE LIMPOPO VALLEY... In the last halfcentury, on at least two other occasions, efforts were made to encourage agroindustrial processing in the Limpopo Corridor region. These efforts ended in failure,
for different reasons, but in both cases due principally to the nature of the political
and economic system which gave birth to the economic and development policies
implemented.
The first experience of agro-industrial transformation in Mozambique occurred
under the first and second Promotion Plans of the Portuguese colonial
administration. National independence, in 1975, put an end to that experiment, but
with an important particularity. Apart from overthrowing the colonial regime and
administration, the revolutionary and socialist nature of independence also
provoked the destruction of the mercantile-capitalist system developed in the
country in the 20th century (Newitt, 1995; SOGREAH & INGENIERIE, 1996: 7.1).
The second experience of promoting an agro-industrial sector in Mozambique arose
out of the socialist strategy, designed as an alternative to the model of capitalist
economic development. The new strategic framework of agro-industrial processing
and, indeed, of the national economy in general, was implemented between 1977
and 1985. State and cooperative ownership of production were prioritised to the
detriment both of private foreign investment, and even of the scarce agrarian and
productive capital which was accumulated during the colonial period by a small
number of Mozambicans, who obtained it, among other ways, because they
enjoyed "assimilated" status. Thus, just as in the first experiment, so the second
attempt to promote agro-industrial processing in the Limpopo Valley region also
failed. In this case, the failure was due not so much to the marginalisation of
Mozambicans from the main opportunities of accumulating productive capital
available, but to the denial of the role that capital plays in increasing productivity,
production and the national wealth in general (Newitt, 1995).
… BUT WILL THIS BE THE TIME WHEN AGRO-INDUSTRIAL PROCESSING IN THE
LIMPOPO VALLEY PROVES SUSTAINABLE AND LASTING? The most direct answer to
this doubt may be summarised in two words - it depends! It depends, not so much
on extreme economic strategies, like the colonial and the socialist policies of past
decades, but on what is really done so that national capital develops and is
consolidated in Mozambique.
After more than a decade and a half of profound economic reforms in the country,
there have been various expressions of frustration and critical observations made
of the Mozambican economy's structural adjustment programme. The structural
adjustment programme has led to criticisms, within and outside of the national and
international institutions that designed it, even though Mozambique is regarded as
a success story in implementing this kind of programme. The problems identified
include: the growing trap of foreign dependence; the content of specific sector
policies; the limitation of technical and financial resources. Because of the
__________________________________________________
Main Report
_____________________________________________________________
4
limitations identified, the International Monetary Fund (IMF) and the World Bank
have been giving increasing support to the PRSPs. Other international agencies,
such as the UNDP (1996, 1999, 2002) and UNCTAD (2002) go further, in insisting
on the need to replace the poverty reduction strategy based on the structural
adjustment perspective, with a strategy oriented towards human development.
Throughout this work, a vast range of opportunities and constraints, relevant to the
pre-viability assessments of the specific projects selected, are identified. However,
at this introductory level, it seems useful to stress the core of one fundamental
constraint, even though it is very politically controversial, and which is behind the
failure of the market economy, and specifically of capitalism, in non-western
countries such as Mozambique. To this end, it is worth stressing the vision
sketched out by de Sotto (2000), a vision which offers a more constructive
perspective than many discourses manacled by a growing attention on the
pauperisation of poverty itself.
De Sotto argues that Third World leaders do not need to wander through the
corridors of Foreign Ministries or of the international financial institutions of the
world in search of
their future. Inside
THIS
IS
NOT
THE
FIRST
the poor areas and
the shanty towns
TIME THAT ATTEMPTS HAVE
of
their
own
countries,
claims
BEEN MADE TO PROMOTE
de
Sotto
(2000),
there are trillions
AGRO-INDUSTRIAL
of dollars completely
available
to
be
PROCESSING IN THE LIMPOPO
used. To do this, it is
sufficient to solve
VALLEY …
the mystery of how
these goods can be
… BUT WILL THIS BE THE
transformed
into
productive capital.
TIME WHEN AGROIf de Sotto is right,
specific reforms and
including,
for
which motivated this
the economic reforms
the
Mozambican
depend
on
ability to transform
existing but unused
productive
capital.
in Mozambique, as in
countries,
are
so much for lack of
because they do not
institutional
convert their savings
capital.
INDUSTRIAL PROCESSING IN
THE LIMPOPO VALLEY PROVES
SUSTAINABLE AND LASTING?
INVESTING IS NOT A GAME,
MUCH LESS A LEAP IN THE
DARK
COMPLEMENTARITY AND
CONFIDENCE IN THE
AGREEMENTS ESTABLISHED
PRODUCTIVITY AND
COMPETITIVENESS
THE GOAL OF THE
INVESTOR - SECURITY AND
TIME
the
success
of
initiatives,
example, the SDI
study, and many of
implemented
by
government,
will
Mozambique's
the
countless
assets
into
Millions of citizens
many of the poor
decapitalised, not
money,
but
have the legal and
mechanisms
to
into
productive
Hundreds or thousands of small business people emerge every year in the informal
sector, filling in the gaps and limitations of the legal economy. They stay in the
extra-legal sector because of the non-existence of mechanisms for access to the
enormous potential that property possesses when, apart from a mere paper or
title, it can and should serve as a mediating instrument that attracts and keeps
practically everything that is necessary to make a market economy function. De
Sotto also holds that property launches the seeds of the system in making people
__________________________________________________
Main Report
_____________________________________________________________
5
responsible and goods fungible, in following transactions, and therefore offering all
the mechanisms needed so that the monetary and banking systems operate and so
that investment performs its function. The link between capital and money, as
understood today, is made through property (de Sotto, 2000).
In Mozambique, it was only as from 1990, with the approval of the new
Constitution of the Republic, that the judicial recognition of the post-independence
capitalist market economy was formalised, But the formal property system that
should allow the procedure, forms and rules which establish the conditions under
which goods are transformed into active capital is still incipient and very inefficient.
The absence of such a system is perhaps the greatest constraint on the
development of a healthy, efficient and sustainable market economy.
INVESTING IS NOT A GAME, MUCH LESS A LEAP IN THE DARK. Investors do not
take decisions based on hunches, but on specific data that are, to some extent,
immune both to exaggerated optimism and to baseless pessimism. Thus the
current work takes two main concerns into consideration: to be of good
professional and technical quality, on the one hand, and to be intellectually
creative, on the other. In this context, the question of creativity is far from obvious
or recognised as an explicit criterion of quality.2 Common sense is dominated by
various and confused notions of creativity, some of which reduce it to merely
artistic aspects, and others to thoughtless spontaneity. However, for this work,
creativity is understood as a series of skills, which cannot be reduced to technical
aspects, but are indispensable for making real changes in perceptions and ideas, as
well as in attitudes and behaviour, of the parties involved in any private
investment: the investors and the beneficiaries of the investment.
COMPLEMENTARITY AND CONFIDENCE IN THE AGREEMENTS ESTABLISHED - What
Mozambique most needs, for private investment to increase in key sectors in order
to improve the living standards of Mozambicans, and not just in a few oases, is:
complementarity and confidence in the agreements established.
The worst thing you can ask - and much more so if you demand it - from a private
investor is that he takes the place or carries out the social duties that are entirely
the responsibility of public, non-profit making bodies. Unfortunately for the
economic development of Mozambique, a great deal of confusion has existed in this
regard, both in the past and today. It thus seems important to clarify explicitly, and
right at the start, that this work rests on a simple but crucial idea: there can only
be good conditions for investment when complementarity of interests prevails,
instead of union, mixture or subordination.
Complementarity, rather than antagonism and distrust, is the motor of the
commercial relationship between the parties involved in the investment: on the one
hand, the companies, in their individual or collective name, national or foreign, who
are looking for new places for their applications; and on the other hand, the
countries, or specific regions within a particular country, which are trying to attract
financial and human resources in order to generate wealth, The drawing together
of the two sides is far from simple and direct. While the companies have their
2
In its simplest definition "creative" means generating or producing something which did
not exist before. But as de Bono (1996: 3) points out, from such a perspective "creating
confusion" could also be seen as an example of creativity.
__________________________________________________
Main Report
_____________________________________________________________
6
specific strategic objectives, notably profit, countries and societies have economic
and social objectives that transcend the attraction of the investment (UNCTAD,
2001).
PRODUCTIVITY AND COMPETITIVENESS. These two concepts mean little to most
Mozambicans. Perhaps the idea that increased income depends on individual
capacity and effort means rather more? But even this probably still means very
little... for the time being.
National lack of productivity is serious and worrying, and with current levels of
productivity, Mozambicans will never attain international levels of income. It is in
productivity that the key to improving Mozambican living standards is to be found,
the key to reducing dependence and poverty, as well as the gap between the
Mozambican economy and the regional and international economy.
In an economy that is now very open to the outside world, but more in terms of
dependence and imports, the only way in which Mozambique can aspire to living
standards ever closer to the international average, is through improving economic
competitiveness. But the solution for greater competitiveness lies, in the last
instance, in productivity.
THE GOAL OF THE INVESTOR - SECURITY AND TIME: it is not by chance that
investment is often, metaphorically, called a "vehicle". In other words, it is a more
effective means for the investor to move from one particular stage, where he
currently is financially, to where he wants to be in the future. If there is a risk, a
direct threat, or even a simple suspicion that the main objective of the investment
will not be achieved, then it would be difficult to expect a great inflow of investors.
Serious investors do not invest their money for philanthropic or charitable reasons,
nor are they motivated by a special affection for a particular product. And why
should they, when here is room for such activities, but at other levels? All that the
investor wants is to go from place A to place B in financial terms, but for this he will
need a minimum of confidence, if guarantees are not given, that he will do so
safely and within a reasonable time. Thus security and time are crucial in the
considerations that investors make: is it worthwhile trying to achieve their financial
objectives in that country or region?
In this context, the preparation of the current work rests on the clear assumption
that it is real opportunities for profit, and not the plans and much less the clientship
of middlemen, which in the final instance can determine continual and sustainable
economic growth. In this context, what role is the government expected to play in
the area where it is hoped that private business will invest? A role that is limited
(from the directly economic viewpoint), but crucial: to protect property rights and
the goods of citizens, to ensure compliance with contracts, to treat people equally
before the law, and to minimise macro-economic imbalances, among many other
aspects. Is this not more than enough to keep government members fully
occupied?
1.3 OBJECTIVES AND MAIN RESULTS OF THE STUDY
__________________________________________________
Main Report
_____________________________________________________________
7
The specific objectives of this study are:
To assess the role that agriculture plays in the Valley, and which it could
play in the future in the economy of the region, and of the country in general.
To review in detail agricultural production capacity;
To review the available and potential irrigation conditions, as well as other
infrastructures and their management capacity;
To assess the capacity for processing agricultural produce and the
production technology;
To develop the scenarios and policies that could unleash agricultural and
agro-processing potential;
To draw up a strategic development concept which takes into consideration
family producers and the initiatives of the medium and large business sector; and
To identify agricultural and agro-processing products worthy of
consideration by the private sector, but which need additional public investment so
that the investment climate may be truly favourable.
In this context, the Terms of Reference (TORs) established by the promotor and
direct client of this work expect to receive the three following specific results:
(i)
a general agricultural and agro-processing assessment of the region
under study;
(ii)
a list of projects identified; and
(iii)
presentation of at least three detailed pre-viability projects for
investment for selected products out of the vast range of existing
possibilities.
Among the specific objectives presented by the Client in the Terms of Reference
(TORs), the last one captures the main aim of the study: "To identify agricultural
and agro-processing products worthy of consideration by the private sector, but
which need additional public investment so that the investment climate may be
truly favourable". At the end of the study, the client, the immediate beneficiary of
this work, expects to have available three pre-viability assessments for projects in
the agro-industrial processing sector.
1.4 METHODOLOGY
Bearing in mind that there have been several studies in the past concerning the
development of the Limpopo Valley, the present study was prepared in three
phases, namely: (i) review of the available secondary literature; (ii) work assessing
conditions on the ground, assessing and updating the available data, and collecting
indispensable new data; and (iii) analysis of the information and preparing the final
report.
In the course of the work, the team responsible for the study contacted
governmental and non-governmental bodies, members of the business community
__________________________________________________
Main Report
_____________________________________________________________
8
who have been investing, or who are willing to invest, particularly those who are
interested in agricultural production and in agro-industrial processed.
A preliminary draft, containing the provisional results of the study, was discussed
at meetings with the main stakeholders. A first meeting was held with the Competir
Group at Chokwe on 2/09/2002. A second much wider meeting was held
specifically to discuss the results of the first draft was also held in Chokwe on
3/10/2002. A third meeting was in Johannesburg, at The Development Bank of
Southern Africa Limited (DBSA) on 11/10/2002, which included participation by
teams involved in similar studies, particularly those undertaken in the Beira and
Zambezia Corridors.
__________________________________________________
Main Report
_____________________________________________________________
9
2 LIMPOPO VALLEY: AREA, POPULATION AND ECONOMY
2.1 THE LIMPOPO CORRIDOR – THE GEOGRAPHICAL DEFINITION
AND SCOPE
Today Mozambique has a well-established SDI programme, with at least five
specific SDIs at various stages of implementation. Through various studies, the SDI
has identified specific places in accordance with their privileged potential, so far
under-used and latent, and their leadership possibilities in terms of accessibility
and competitive viability among the various commercial investments eligible.
In particular, the Limpopo Valley is one of the privileged places within the Limpopo
Corridor, in terms of agro-industrial processing. Located to the north of Maputo
city, the Limpopo Valley covers the Limpopo River Basin, and the Limpopo Railway
that links Zimbabwe to the Port of Maputo. As regards its agricultural potential, the
Limpopo valley has good soils, proven practical antecedents, sufficient water, and
market opportunities, both nationally and regionally.
Since the SDIs seek to promote the creation of new and viable jobs, as well as
potential opportunities for investment, identified for private businesses, the main
focus of this study is to set forth the most advisable strategy for launching agroprocessing activity in the CL, as well as identifying and formulating projects that
could, in the short to medium term, act as catalysts for the agricultural
development of the area in question. In particular, the specific objectives of the
Limpopo Corridor are:
1. Undertake activities which seek to restore to health the economy of the
area, particularly in the traditional sectors of agriculture, agro-industry, and
livestock, and to promote new investments in tourism, mines, production of
electricity and others, so as to create jobs, and thus guarantee the long
term sustainable economic development of the region;
2. Establish attractive conditions in the Corridor for public and private
investment, in partnership with the communities, in sectors of the economy
that present comparative advantages so as to guarantee rapid growth in the
region's economy; and
3. Develop an adequate transport and communication system that makes the
region competitive in terms of investments.
2.2 BROAD AND NARROW DEFINITIONS OF THE LIMPOPO CORRIDOR
Located north of Maputo, the Limpopo Valley is constituted by the Limpopo River
Basin and the Limpopo Railway linking Zimbabwe and Maputo Port. This area was,
not so long ago, considered the bread-basket of Mozambique in terms of its
agricultural potential. A huge irrigation scheme was established by the Portuguese
in the mid 1950's with the intention of settling Portuguese farmers as a way of
__________________________________________________
Main Report
_____________________________________________________________
10
effectively occupying the country. Downstream and upstream of the irrigation
scheme other developments took place such as raising livestock and medium-scale
agro-processing industries. Rice from the Limpopo Valley, as well as dairy produce
were exported to European markets as well as to some of the neighbouring
countries.
In more specific terms, the Limpopo Corridor is defined by the railway which runs
from the Port of Maputo to Chicualacuala, linking southern Mozambique to the
neighbouring Republic of Zimbabwe. For purposes of planning, three main regions
may be identified within the perimeter of the Limpopo Corridor: primary, secondary
and tertiary.
The primary region of the corridor consists of the transport and communications
infrastructures that have been developed along the corridor.
The secondary region consists of the various admininistrative divisions crossed by
the primary infrastructural axis, namely the districts of Manhica, Magude, Chokwe,
Macia, Xai-Xai, Chibuto, Guija, Mabalane e Chicualacuala.
The third region consists of other areas outside of the main axis by resources which
influence and economically subsidise the primary region, such as the Massingir
dam, the Pande and Temane gas fields, and the Banhine and Zinave National
Parks.
While aware that the area included in the Limpopo Corridor is not defined, or
limited by the established administrative boundaries, for the purposes of this
current study, two definitions of the extension of the CL are considered, one broad
and one narrow. Table 1.1 summarises the data concerning the broad definition of
the CL, covering the above mentioned three main sub-regions: primary, secondary
and tertiary. In terms of the existing administrative district division this
Table 1.1 Estimate of the surface area and population of the Limpopo Corridor, 1997-2002
Surface
Population
Population
1997 2002
(1000 km % (1000 people.) %
Density
District
Valley total
Gaza
Xai-Xai City
Bilene
Chibuto
Chicualacuala
Chigubo
Chokwe
Guijá
Mabalane
Mandlakazi
Massangena
Massingir
Xai-Xai
Other districts
Inhambane
Maxixe
Jangamo
Morrumbene
Massinga
Mabote
Funhalouro
Panda
Inharrime
Zavala
Magude
Manhiça
125 100 2.013 2.297 100
76 61 1.117 1.266 55
0,1
0
112
145
6
2,2
2
139
161
7
5,7
5
169
165
7
18,2 15
36
38
2
14,9 12
14
15
1
2,5
2
182
226 10
4,2
3
60
65
3
9,1
7
27
29
1
3,8
3
167
176
8
7,5
6
13
14
1
5,6
4
25
25
1
1,9
2
174
208
9
49 39
896 1.031 45
0,2
0
58
64 2,8
0,3
0
99
133 5,8
1,3
1
84
113 4,9
2
2
115
129 5,6
2
1
63
68 3,0
14,2 11
38
38 1,7
7,9
6
15
17 0,7
7,0
6
47
49 2,1
2,1
2
79
93 4,0
2,6
2
131
157 6,8
7,0
6
40
34 1,5
2,4
2
127
137 6,0
18
17
1.448
73
29
2
1
90
15
3
46
2
4
110
21
320
442
87
54
38
3
2
7
44
60
5
58
Note: 1/2 of Funhalouro, 1/3 of Massinga
Source: INE. 1999. Demographic Projections 1997-2010
corresponds roughly to the Gaza province, 10 of the 14 districts of Inhambane
province, and the two districts in Maputo province that border on Gaza (Magude
__________________________________________________
Main Report
_____________________________________________________________
11
and Manhica). In summary terms, the broad definition of the CL covers about
125,000 square kilometres of surface area, and between 2 and 2.3 million
inhabitants. This represents 15-20 per cent of the total surface area of
Mozambique, and 10-15 per cent of the country's total population. In a narrower
definition of the Limpopo Corridor, from which Inhambane Province is totally
excluded, the CL covers about 85,000 square kilometres and between 1.3 and 1.5
million inhabitants. The broad definition of the CL is that which responds better to
the TSRs, particularly as regards coconut production, which is mainly concentrated
in Inhambane province.
A further important dimension of the CL, if not the most important from the
point of view of the concept of a
development corridor, concerns the
Graph 1.1 Gross domestic product, Mozambique 1996-2000
size and characteristics of its
(in US$ 106)
economy,
its
weight
in
the
3.600
economy of the region, and of the
3.400
country in general. As with its
3.200
surface area and population, the
immediate
estimate
of
the
3.000
economy of the CL can only be
2.800
done in an approximate and
2.600
indicative fashion.
1996
1997
1998
1999
2000
3.189
3.453
3.473
2.947
GDP 2.937
Mozambique's
southern
region,
which includes the CL, produces
almost 50% of the national economy, estimated at 3.2 billion US dollars a year,
over the last five years of the 1990s (Graph 1). However, of this 50%, Maputo city
represents about 72%, while the other three provinces (Maputo, Gaza and
Inhambane) represent only 28% (UNDP, 2000, 2002).
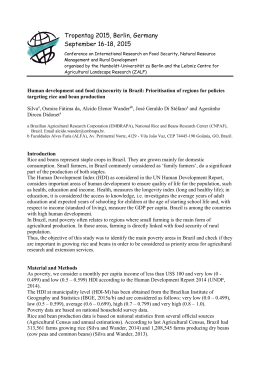
Graphs 1.2 and 1.3 show, in a summary and approximate manner, what the CL, in
its broad definition, represents in terms of the national wealth. It is assumed that
Graph 1.2. Weight of the Limpopo Valley in the National
Economy compared with Maputo City and the Southern Region
Graph 1.3. Weight of the GDP of the Limpopo Corridor in the
Economy of the Southern Region, Mozambique 1996-2000
(in US$ 109)
9%
1200
Limpopo Corridor
1000
35%
800
Maputo City
600
400
14%
200
South, without Maputo
city.
0
0%
5%
10%
15%
20%
25%
30%
35%
40%
Maputo City
Lim popo Corridor
Rest of the South
%
72%
17%
11%
US$ 10^9
1133
274
166
Gaza Province has contributed all of its
production to the CL; Inhambane province 58%; and Maputo province around
36%.3
3
The formula used in estimated the GDP of the LCwas as follows:
GDPLV
Gaza
G 100%
Inhambane
I
58%
Mapto
M
Pr ovince36%
__________________________________________________
Main Report
_____________________________________________________________
12
Thus the CL may currently represent about 9% of the national economy. In
monetary terms, this corresponds to more or less 274 million US dollars per year,
over the last five years of the 1990s, in comparison with about 440 million US
dollars from the three southern provinces (not counting Maputo city, which
contributed around 1,133 million US dollars to the national economy).
Thus, while Maputo City represents 72% of the economy of the southern region,
the Limpopo Corridor represents between 15 and 20 per cent, and the rest of the
south accounts for the other 11% (UNDP, 2002).
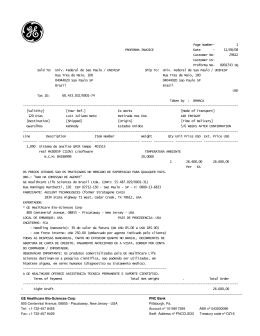
2.3
UNPRECEDENTED FUTURE
LIMPOPO CORRIDOR?
OPPORTUNITIES
FOR
THE
As already mentioned, the CL region, particularly the Limpopo River Basin and the
Limpopo Railway Line, has become one of the most attractive places for private
investment in Mozambique. Important
Graph 1.4 Limpopo Corridor, 1996-2000
large and medium-sized projects have
been drawn to the area in recent years,
such as Corridor Sands (the processing
of heavy mineral sands), the National
Prim ary
Tertiary
Limpopo Park, the Massingir Dam; the
36%
49%
high tension power line to Inhambane
Secundary
and the Pande natural gas - these are
15%
two major infrastructure projects which
in the medium and long term will bring
important benefits to the development
of the Valley.
Mozambique has a total surface area of
78.5 million hectares, but currently only
3.9 million hectares are being used for agricultural purposes. This represents 5%,
or one twentieth, of the total surface area, in contrast to the 12,5%, or one eighth,
used for agriculture, which was attained in the early 1970s.
This contrast with the current agricultural under-use of the land become still clearer
when we consider that three decades ago, with 42 million hectares of land
(practically half the territory) unoccupied, but capable of agricultural use,
Mozambique had an estimated active population of four million people, of whom
90% (mostly women) were occupied in the primary sector, mainly in agriculture.
Currently, with an agricultural usage that is about 40% less than that of 1970,
Mozambique has a population twice as large, and the active population is over six
million; of these people, 90% of the women and about 70% of the men are
occupied in agricultural activity.
In the particular case of Gaza Province, which covers much of the CL, currently
only about 460,000 hectares is being used for agriculture, compared with 2.5
__________________________________________________
Main Report
_____________________________________________________________
13
million hectares that was in use at the end of the 1960s. That is, agricultural usage
stands at just a sixth, or 18%, of what was achieved more than three decades ago
(DSPIE, 1973; INE, 2001).
Currently about 16-20% of the total land in the country is used for agriculture. Of
this 95% consists of household farms, 4.5 per cent is medium farms, and less than
1% consists of large farms. In turn, while the weight of the primary sector in the
GDP is around 36% (Graph 1.4), it absorbs more than 85% of the economically
active population.
But will this structure of production and occupation of the labour force remain the
same over the next 10-20 years? The data currently available allows us to foresee
two alterative answers to this question.
One alternative is that the current production and employment structure remains
unchanged. This hypothesis is not very likely, and would only happen if the large
and medium investment projects did not become reality, or were failures.
The other alternative is radical change in the current structure of production,
Graph 1.5 Structure of the GDP of the southern region, with and without Maputo city, by
economic activity, Annual average between 1996 and 2000
0
5
10
15
20
25
in %
30
35
Agriculture
Livestock
Florestry
Fisheries
Mining Industry
Manufacturing Industry
Electricity and Water
Construction
Transport and Communications
Commerce
Restaurants and Hotels
Public Administration and Defense services
Financial Services and Insurance
Real estate, renting and business activities
Educational Services
Health Services
Other Services and adjustment
South w ithout Maputo C.
South w ith Maputo C.
Source: UNDP, 2002
either to the kind of structure similar to that of Maputo City (4% primary sector,
20% secondary sector, and 76% in the tertiary sector), or to a structure where
the secondary sector dominates, due to the contribution from mining and
manufacturing industry. Graph 1.5 illustrates the two hypotheses mentioned
above: the first, represented by the blue bars, in which the GDP of the southern
region contains a major contribution from agriculture; and the second, shown by
the brown bars, illustrates the kind of structure that may be expected, should
__________________________________________________
Main Report
_____________________________________________________________
14
services (transport, tourism and trade) grow faster, relatively and absolutely,
than the secondary sector. Otherwise, as soon as extractive and manufacturing
industry begin to produce in Gaza and Inhambane, structural changes will be
noted immediately in productive activity. It is enough to mention, for example,
that extractive industry in Gaza province is currently represented solely by salt
extraction, which contributes 0.1% of the provincial GDP. Within the next 5 to 10
years, when Corridor Sands begins to produce, extractive industry in Gaza
should grow by many thousands of per cent.
But while it is possible to envisage radical changes in the medium or even the
short term in the production structure of the southern region, the same cannot
be said for the structure of occupation of the economically active population. The
large projects will offer important job opportunities, but perhaps the more
significant opportunities are indirect rather than direct. If this is the case, then it
may be envisaged that while the primary sector might represent 10% or less of
GDP, the transfer of workers from the agricultural sector to the secondary and
tertiary sectors will be much slower.
This is not the place to imagine the consequences of this latter scenario, but it is a
factor which should deserve attention at other opportunities. In any case, in
relation both to job opportunities and to the need to promote agro-industrial
production, the socio-economic framework sketched out above for the near future
of the southern region shows a promising and unprecedented scenario.
As described above, the Limpopo Valley has a range of characteristics which, added
to a series of large scale private and public initiatives, presents an environment
that is favourable, and has great potential, for the development of the agricultural
sector and for agro-industry. These characteristics and initiatives are detailed
further below, in section 6.5.
2.4 GERAL CONSTRAINTS ON INVESTMENT IN THE LIMPOPO
CORRIDOR
The following series of four graphs summarise eloquently the annual average
percentage growth trends in gross internal investment, public and private,
compared with the average annual growth of food and non-food production, in
Mozambique and in sub-Saharan Africa. Obviously, with negative private
investment in the first decade after independence, and investments not higher than
the average annual population growth in the second decade, the crisis in food and
non-food production in the country was inevitable.
Apart from the improvement shown in the series of previous graphs concerning
private investment, there are other indicators, which are generally used by
investors and international agencies, that bear witness to serious progress in the
past decade, concerning the elimination of the basic constraints on investment.
For example, UNCTAD (2001) in its An Investment Guide to Mozambique:
Opportunities and Conditions stresses the current competition index in Africa,
shown in the following chart. Mozambique seems to emerge as a possible chosen
spot for investment.
__________________________________________________
Main Report
_____________________________________________________________
15
Graph 1.6 Evolution of some indicators on investiment, and on food and non-food
production: Mozambique versus Sub-Saharan Africa, 1975-1999
Food Production versus non-food production,
Mozambique 19975-99
Gross investmentas as a percentageof GDP: domestic, public
private, Mozambique, 1975-1999
Average annual % growth
Average annual % growth
25
20
15
10
5
0
-5
19'75-84
1985-89
1990-Mr
-10
Gross domestic investment
Gross Public Investment
10
8
6
4
2
0
-2
-4
-6
-8
Gross Private Investment
19'75-84
Food production index
Source: Word Bank, 2001
1985-89
non-food production index
1990-Mr
Per capita food production index
Source: Word Bank, 2001
Gross investmentas as a percentageof GDP: domestic, public
private, SubSahara Africa
Average annual % growth
25
Food production versus Nonfood production,
SubSahara Africa 1975-99
Average annual % growth
5
20
4
15
3
10
2
5
1
0
0
19'75-84
Gross domestic investment
1985-89
Gross Public Investment
1990-Mr
Gross Private Investment
-1
19'75-84
Food production index
1985-89
non-food production index
Source: Word Bank, 2001
1990-Mr
Per capita food production index
Source: Word Bank, 2001
However, a variety of evidence suggests that, notwithstanding the deep reforms
and improvement in conditions for national and foreign investment, there is still an
enormous gap between the high latent demand that exists in Mozambique and
effective access. As the ICON Group International (2000) notes, a country can
possess high latent demand, but provide low access, thus becoming a much less
attractive market than many small countries who present greater levels of access.
Table 1.2 summarises the evolution of the indicators that form the economic
freedom index. The Economic Freedom Index (EFI), produced by O'Driscoll et al.
(2002) of the Heritage Foundation and the Wall Street Journal, measures the
impact of taxes and customs duties, of commercial regulation, of government
intervention in the economy, of corruption in the government, of the judicial
system, and of the customs services, among other relevant factors. In his last
report, O'Driscoll (2002: xiv) mentions Mozambique as a country that has
undergone great changes. In 1996, it was classified as economically unfree.
However, due to the improvements observed in recent years Mozambique has now
been classified as economically "mostly unfree" instead of "unfree".
__________________________________________________
Main Report
_____________________________________________________________
16
This type of classification may be questioned because of its more or less subjective
character, and the value judgements inherent to it. In any case, the indicators that
form the EFI synthesise and capture important aspects of business activity, and, in
many cases, find empirical testimony in day-to-day economic life, in this case in
Mozambique. For example, Hamela (2002a, 2002b) recently summarised "What
business people want to see solved... by the government and the CTA".
__________________________________________________
Main Report
_____________________________________________________________
17
Table 1.2: The Index of Economic Freedom, Mozambique 1995-2002
1995
97
4.20
Repressed
Year:
Rank
Score
Category
2002
76
3.05
Mostly unfree
1995
Trade
Policy
Fiscal
Burden
5.0
Government
intervention
3.0 Monetary Policy
4.0
5.0
Foreign
investment
Banking
and
Finance
4.0
4.0
Wages and
Prices
Property
Rights
4.0 regulation
4.0
4.0 Black Market
5.0
3.0 Regulation
4.0
4.0 Black Market
4.0
2002
Trade
Policy Fiscal
Burden
Country
Trend
3.0
Government
intervention
3.0
Foreign
Investment
Banking and
3.5 Monetary Policy
1.0
2002
3.05
2001
3.35
Finance
2000
3.80
2.0
3.0
Wages and
Prices
Property
Rights
1999
3.90
1998
4.10
1997
4.00
1996
4.10
1995
4.20
From 1990 to 1999, according to World Bank Group data, compound growth in GDP averaged 3.9 percent annually and
per capita GDP increased from $144 to $198 (in constant 1995 U.S. dollars). Mozambique's government intervention
score is 1 point worse this year; however, its monetary policy, foreign investment, and black market scores are,
respectively, 2 points, 1 point, and 1 point better this year. As a result, Mozambique's overall score is 0.30 point better
this year.
Trade Policy – Score: 3 – Stable (moderate level of protectionism).
Fiscal Burden of Government: Score – Income and Corporate Taxation: 3 – Worse (moderate tax
rates); Score – Government Expenditure: 4-Stable (high level of government expenditure); Final
Score: 3,5-Stable (High cost of government)
Government Intervention in the Economy – Score: 3-Worse (moderate level)
Monetary Policy – Score: 1-Better (very low level of inflation)
Capital Flows and Foreign Investment – Score: 2-Better (low barriers)
Banking and Finance – Score: 3-Stable (moderate level of restrictions)
Wages and Prices – Score: 3-Stable (moderate level of intervention)
Property Rights – Score: 4-Stable (low level of protection)
Regulation – Score: 4-Stable (high level)
Black Market – Score: 4-Better (high level of activity).
Source: http://cf.heritage.org/index/
Many of the problems and concerns listed by Hamela illustrate and support the
pointing and classification summarised in Table 1.2, which may be verified in the
summary presented in Table 1.3
__________________________________________________
Main Report
_____________________________________________________________
18
The business people of Manica and Cabo Delgado raised the old question of land - which
still cannot be used as collateral to obtain credit for agriculture. They do not believe that
property in land, or at least a market in land titles, would prejudice the peasants: on the
contrary, it could be the key to their access to capital, vital for the practice of agriculture
on a business footing. A lot of land remains unused because of politically influential people.
For their part, the investors don't know why they have to go around discussing with 10, 20
or more peasants in order to obtain a land title.
As for the one stop counter (BU), at least in Zambezia business people question its impact
in reducing the time and paperwork necessary for obtaining any licence. Worse still if the
activity intended includes obtaining a piece of land. The procedures and papers necessary
have not been changed in the various directorates, It is just that now it is the BU rather
than the investor that goes up and down flights of stairs in order to obtain any government
authorisation. Indeed, the time needed to obtain a licence has become even longer,
because the official of the BU is not going to use "lubricants" (i.e. bribes) throughout the
entire process, because he is not an interested party.
PROAG
RI
Land
Inspections by the Finance Ministry (MPF).
The businesses of central and northern Mozambique are aghast at the MPF's multiinstitutional inspections. They complain that they receive local, provincial and central
(Maputo) inspections. The inspectors do not educate, they merely repress. The
"southerners" (central inspectors) multiply the penalties and the "famous" fines. Reimbursement of VAT for the "provincials" is increasingly expensive, because of the "fee for
speeding things up", as the businessmen call it, which varies between 5 and 10 per cent.
Informal versus formal sector: the same old war. The businessmen believe that the fines,
and not the taxes in themselves, are responsible for driving business into the informal
sector.
Labour Ministry promotes unemployment.
Labour legislation: For the private sector in the centre and north, the Labour Law is
"socialist", it only protects the worker, it encourages indiscipline, it discourages foreign
investors who come looking for cheap and disciplined labour, and it sponsors very low
productivity.
Recruitment of foreigners: why does the government have to interfere in the hiring of
foreign managers, when there are no qualified staff at provincial level ? Experience shows
that it is more expensive to recruit a good quality national cadre to go to the provinces,
than to recruit a foreigner.
Certain business people say that the Ministry of Labour is promoting unemployment
(instead of prioritising job creation) by frightening away foreign investment (take the
example of the Zimbabweans registered to invest in Manica. Out of 50 only 5 are
implementing their projects. Faced with a variety of complications, the rest gave up and
went to Australia, South Africa and New Zealand.)
One Stop
Counter
Government intervention in the economy
Table 1.3: Business people: What do they want to see solved, and what
do they demand of the Government and of the CTA?
The business people think that those involved in this programme have been affected by
"navel syndrome": their objective is to develop themselves. Hence the quantity of "4 x 4"s
and other trappings worthy of a programme of hundreds of millions of dollars, part of
which is in the form of loans, which our children and grandchildren are going to pay further
down the line.
Source: Hamela, 2002a, 2002b.
Among the various objectives of the present study, the most important specific
objective is to produce three pre-viability studies of projects in the agro-industrial
processing sector. In practice, however, the demonstration of the viability of a
specific project is just one of the purposes of a broader assessment of the
__________________________________________________
Main Report
_____________________________________________________________
19
possibilities of the financial viability, in this case, of agro-industrial activity in the
country. There are other objectives and results which are part of the indispensable
requirements to optimise the positive and wide-ranging effect of investment, such
as: defining priorities among the countless possible projects; minimise the
investment risk, or better still, choose the best combination of risk, profitability and
other objectives.
The sensibility analysis of results, like that presented here for the three projects
selected, leaves the final conclusion in the hands of the investors and the decisionmaking authorities. The decision makers and investors will have to choose from a
range of possible results, the probability of which in many cases is not specified.
Risk analysis tries to minimise he uncertainties which persist, since it is a tool for
assessing the probability that certain events will occur. However, even if it is very
improbable that at a particular moment all the worst, or all the best estimates of
the variables under analysis will occur, most investors are convinced that, at least
in relation to the worst, it was not long ago that Mozambique experienced them.
A good risk analysis eliminates the need to qualify estimates in advance as
pessimist or conservative, optimistic or realistic. But, in the final analysis, it is the
investor who, faced with data on the micro- and macro-economic situation of the
country, has to decide whether to take the risk, or to wait for economic freedom to
evolve from an unfree to a mostly free situation as graphs 1.8 and 1.9 illustrate.
The perceptions and ideas shown in Graphs 1.8 and 1.9 are present, more or less
consciously, in the thoughts of investors and of many other people. It is scarcely
worth conjuring away the validity of the notion of "free" and "unfree" in terms of
the Mozambican economy. In the final instance it is the enormous persuasive
power of such ideas, perceptions and images, such as those in graphs 1.8 and 1.9,
that
countries
like
Mozambique have to face,
Gragh 1.8 Economic Freedom and Per Capita Income
and to which they must find
(Per capitar income in Purchasing Pow er Parity, 1999)
$25.000
effective solutions, if they
$23.325
are
really
banking
on
$20.000
promoting
private
investment, whether foreign
or
national.
Thus
$15.000
considerations of the power
$11.549
of this sort of representation
$10.000
is no less important than
observing the IRR (internal
$3.829
$5.000
$3.238
rate of return) and the NPV
(net present value of the
$0
cash flows) of the projects
Free
Mostly free
Mostly unfree
Represed
2002 Level of Econom ic Freedom
Fo nte: O'Drisco ll, 2002: 2
selected.
The main constraints which
explain the current reduced economic activity are, without any doubt, the
following:
Lack of coordination of public policies with a direct or indirect influence on
agricultural and agro-industrial activity:
__________________________________________________
Main Report
_____________________________________________________________
20
Support for agriculture granted late, and allocated according to criteria that
are difficult to understand
Graph 1.9 Protection of Property Rights and Per Capita Income
Water has also
been
made
available late
(Real GDP per Capita in 1999 Purchasing Pow er Parity)
$ 2 5 .0 0 0
$ 2 3 .7 6 9
Absence of tax
and
customs
inspection
$ 2 0 .0 0 0
$ 1 5 .0 0 0
$ 1 3 .0 2 7
$ 1 0 .0 0 0
$ 4 .9 6 3
$ 5 .0 0 0
$ 3 .0 1 0
$ 2 .6 5 1
Lo w P ro t e c t io n
V e ry Lo w
P ro t e c t io n
$0
V e ry H igh
P ro t e c t io n
H igh
P ro t e c t io n
M o de ra t e
P ro t e c t io n
Protection of Property Rights
Strong parallel
economy which
discourages
businessmen
from going into
debt and from
restoring their
production
Poor
investment by the state in "R & D", which is a determinant factor for the
competitiveness of the agricultural sector;
So urce: O'Drisco ll, 2002: 2
Lack of tax incentives or reduced interest rates offered by the state in
accordance with the performance of economic agents;
Lack of belief in public policies and in the central state actors implementing
them. The economic agents do not believe in the capacity of the state to intervene
in managing public policies and making them operational
Poor supply of agricultural machinery services: these are scarce and
expensive;
Agricultural inputs not available locally, and on time, and sold by economic
agents at grossly inflated prices, which they seem to have fixed among
themselves;
Poor supply of technical services: extensionists, agricultural technicians,
consultancy in management and marketing;
Difficult access to credit (the financial sector refuses to finance agriculture,
because of the activity's risk, and because of the impossibility of farmers providing
acceptable guarantees), and interest rates that are completely intolerable for any
economic activity (about 40%);
Non-existence or shortage of raw materials (e.g.: rice, cashew, copra);
In general, poor quality of raw materials;
The difficulties faced by many of the existing industrial units and farmers in
the business sector of restoring their productive capacity with new financing, while
they are still burdened with debts contracted before the floods of 2000;
The available labour is poorly qualified, poorly motivated and his lost the
feeling
that
they
are
"industrial
professionals".
__________________________________________________
Main Report
___________________________________________________________ 21
__
PART II. DIAGNOSIS
O
OF
FT
TH
HE
EA
AG
GR
RIIC
CU
UL
LT
TU
UR
RA
AL
LA
AN
ND
DL
LIIV
VE
ES
ST
TO
OC
CK
KS
SE
EC
CT
TO
OR
R
A
AN
ND
ND
NG
DO
DU
G
US
OF
ST
FA
TR
RIIA
AG
GR
AL
RO
LP
O--IIN
PR
RO
OC
CE
ES
SS
SIIN
__________________________________________________
Main Report
___________________________________________________________ 22
__
Once the data, both secondary and primary, was collected, selected, analysed
and discussed, the general diagnosis that the team made can be grouped, in a
summary manner, as follows:4
Agricultural water resources
Agricultural sector
Livestock sector
Agro-industry
Potential of the Limpopo Valley
Main constraints
So as not to make the present report too exhaustive, in this second part, a
summary of the chapters drawn up, individually or jointly, by the members of
the team is presented.
3 HYDRO-AGRICULTURAL INFRASTRUCTURES
The Limpopo Valley combines natural conditions and infra-structures which
justify investment in agricultural production with the use of irrigation. The
Limpopo Basin covers an area of 412,000 square kilometres, of which 19% is
inside Mozambique. The Massingir dam, were it to operate at 100% (storage
capacity of 125 million cubic metres), bearing in mind urban and rural use of
water and a reserve of 410 million cubic metres to control saline intrusion, could
supply about 1,690 million cubic metres of water for irrigation, allowing the
existing irrigation schemes to function fully, and to extend the current irrigated
areas.
The main tributaries of the Limpopo river outside Mozambique are the Sasha,
Bubye and Nuanetze rivers in Zimbabwe (left bank), and the Palala, Sand, Sterk
and Pafuri rivers in South Africa (right bank). Within Mozambique, the main
tributary is the Elephants River on the left bank of the Limpopo.
Within Mozambique, the Limpopo basin is almost flat, with a slight inclination in
the direction NW-SE. The Limpopo River is 1,461 kilometres long, of which 516
kilometres are inside Mozambique. The average height of the entire basin is
about 840 metres above sea level.
4
The complete individual reports will be include din the appendix.
__________________________________________________
Main Report
___________________________________________________________ 23
__
3.1
HYDRO-AGRICULTURAL
LIMPOPO VALLEY
INFRASTRUCTURES
ALONG
THE
According to the survey undertaken in May 2002 (FDHA, Survey of Existing
Irrigation Schemes in the country - Phase III, 2002), the total area identified as
being currently equipped with irrigation infrastructures in the three southern
provinces of Mozambique (Inhambane, Gaza and Maputo) is 75,747 hectares, of
which only 23,145 hectares (30.6%) is operational.
Gaza is the province that has the largest area equipped for irrigation (50,323
hectares), of which about 17.5% (8,825 hectares) are currently irrigated.
30,000 hectares of the equipped land (60%) belongs to the Eduardo Mondlane
Irrigation System, in Chokwe district, but currently only 7,500 sectors are being
exploited. Inhambane is the province with the smallest areas equipped for
irrigation and actually irrigated (1,285 hectares and 177 hectares respectively).
In Maputo province the area equipped for irrigation is 24,139 hectares, of which
about 59% (14,143 hectares) are currently irrigated.
3.2 CURRENT SITUATION OF THE IRRIGATED PERIMETERS IN
THE LIMPOPO VALLEY
The largest area equipped for irrigation in the south of the country is in Gaza
province, along the Limpopo Valley. The Eduardo Mondlane Irrigation System, in
Chokwe district, is that which has the largest area with infrastructures, around
30,000 hectares, though only 7,500 hectares is currently regarded as
operational. In terms of the size of the irrigation systems, stress should also be
laid on the Macia, Matuba and Xai-Xai irrigation systems (8,000 hectares, 3,834
hectares and 2,970 hectares respectively). These schemes are the largest
irrigated perimeters, and where there has been large investment through public
funds for the development of irrigated agriculture. The state is still the owner of
these irrigation systems.
Each of these irrigation systems was designed to be used as part of a giant state
farm. Since such farms no longer exist, it is now urgent to seek solutions for
defining the property regime of these systems, and types of management and
operation that allow the most to be made of the investment that has occurred.
The management of some of the state-owned irrigation schemes is being
transferred in part to peasants' associations and to the private sector, who are
responsible for paying the running costs inherent to operating the systems, as
well as for their sustainable management.
3.3 THE MOST COMMON TYPES OF IRRIGATION
Gravity fed irrigation, whether by channels (vegetables, beans, maize) or by
flooded basins (rice, fruit trees), and manual irrigation (watering cans) are the
methods most commonly used. Irrigation by sprinkling covers an area of about
8,330 hectares, of which 7,800 hectares are sugar cane plantations
(conventional sprinkling, central pivot, rain gun and floppy). Irrigation by
manipulation of the water table occurs, and is also practiced in areas along the
__________________________________________________
Main Report
___________________________________________________________ 24
__
coastal strip. Drop-by-drop irrigation is a new method of irrigation in
Mozambique, and has been identified only in Maputo province, where it currently
occupies an area of 115 hectares (vegetables and fruit trees).
3.4
POTENTIAL FOR IRRIGATION
LIMPOPO VALLEY
DEVELOPMENT
IN
THE
In southern Mozambique, the total area equipped for irrigation is 75,747
hectares, of which 1,170 hectares are in Inhambane, 50,323 hectares are in
Gaza, and 24,139 hectares are in Maputo. The most important irrigation
schemes in the south of the country are in Gaza province along the Limpopo
Valley (Chokwe: 30,000 hectares; Macia, 8,000 hectares, Matuba, 2, 834
hectares, and Xai-Xai, 2,970 hectares). Along the three river basins in the
southern area, there is a development potential of about 280,000 hectares of
land, appropriate for irrigated agriculture. Of this area, about 53% is along the
Limpopo Valley.
Table 2.1 - Irrigable area by basin
Basin
Area that could be
irrigated
%
21 000
7.5
Umbeluzi
Incomati
111 000
39.6
Limpopo
148 000
52.9
Total
280 000
In the Limpopo valley, of the about 150,000 hectares available for irrigation,
only 50,323 (34%) were developed, and of these only 8,825 (17.5%) are
currently operational. The rehabilitation (about 41,500 hectares), and extension
of the existing irrigation systems, as well as the construction of new irrigation
systems would have a great impact on reactivating the agricultural potential of
the valley and on promoting agro-industry.
There are three regions with development potential in the short and medium
term, namely:
The Chokwe region;
The Elephants River region;
The Xai-Xai region.
These regions were selected bearing in mind that the rehabilitation of Massingir
and Macaretane, in conformity with the existing social infrastructure (roads,
power supply etc), has been approved. In the long term, other regions along the
valley could come to be integrated into the areas development.
__________________________________________________
Main Report
___________________________________________________________ 25
__
3.5 PROSPECTS FOR THE DEVELOPMENT OF IRRIGATION
Based on the potential that the Limpopo Valley presents, and in line with the
existing infrastructures, it is envisaged that in the short and medium term, and
in the context of agricultural hydraulics, projects that will make an impact on the
development of the valley in particular and the country in general would rest
essentially on:
Rehabilitation of the Eduardo Mondlane Irrigation System, and extending
the irrigated area (through building new irrigated parameters);
Rehabilitation of the Xai-Xai irrigation system, and possibly extending the
currently existing irrigable area;
Building new irrigation systems along
downstream from the Massingir dam;
the
Elephants
River
and
Training activities for farmers in relation to the best crops, best height,
nest manner and best place to market their production;
Rehabilitation of some local agro-industries which have been paralysed
for a long time, and building new ones;
Establishing a system in the region for supplying inputs and technical
assistance;
Setting up services for maintaining hydraulic infrastructures;
Setting up a technological and market information system in the Chokwe
region.
These activities would make possible the relaunching of the valley's agricultural
potential and would set up the basic conditions for the long term projection of a
more integrated plan for the development of the entire Limpopo Valley. A
projection for the development of the irrigation sector, presented in the
SOCREAH study (1993) estimated that an area of 150,000 hectares could be
considered as fit for irrigation. Table 2.2 summarises how this area is distributed
between the main regions.
Table 2.2: Development Potential in the Limpopo Valley
(in hectares)
Region
Current
Mid-term
Long Term
Elephants river
427
15,800
15,800
Upper Limpopo
500
500
500
49,500
59,500
133,700
Middle and Lower Limpopo
__________________________________________________
Main Report
___________________________________________________________ 26
__
4 AGRICULTURAL SECTOR
The agricultural area considered in this
study covers around 8 million hectares,
mostly in Gaza province. Apart from Gaza,
this study includes the coastal areas of
Inhambane province.
From the physiographical point of view, the
agricultural area may be divided into two
major zones. The first zone, consisting of
an alluvial valley and marine sediments,
has good agricultural potential;, both for
rain-fed agriculture, in the areas with
greatest rainfall, and for irrigation in well
drained soils.
The
second
zone,
with
ondulating
topography, has deep and well drained
sandy soils, that allow deep rooting of
trees. Its fertility is low, as is its capacity to
retain water at the surface, though the depth of the soil allows orchards and
forests, as well as some crops such as cassava and "boer" beans, to make good
use of rain water.
The agricultural productivity of the area under study is determined by the
availability of water
rather
than
by
fertility. Rainfall in
the coastal areas is
about 1,000 mm,
but in the interior
rainfall
falls
off
rapidly as can be
seen
from
the
typical
extinction
curve shown in the
accompanying
graph,
until
it
reaches less than
400 mm in the
areas
furthest
removed from the
coast.
In the first kilometres, the reduction in rainfall is higher than 10 mm per
kilometre. Consequently the growing period drops from 6-7 months (NovemberMay) at the coast to 3-4 months (November to March) in Chibuto, and there is
practically no growing season in Pafuri, Chicualacuala and Mapai, in the interior,
__________________________________________________
Main Report
___________________________________________________________ 27
__
more than 300 kilometres from the coast, which makes it non-viable to grow
most crops.
4.1 AGRICULTURAL PRODUCTION
Agricultural production in the area under study is mostly in the hands of the
peasant family sector, which represents 99% of rural farms, and 95% of the
cultivated area. Graph 2.2 and
Table 2.3 show the distribution of
Distribuição da Área Cultivada pela Área das
the cultivated area according to
Explorações
the size of farms.
It is estimated that the average
size of fields, without counting
fruit trees, is 1.7 hectares for the
family sector, which is slightly
larger than the average for the
country which is estimated at 1.3
hectares. For medium and large
producers, it is estimated that
average areas of cultivation are
6.3 and 41 hectares, respectively.
Grande 50 Ha <
0.04%
Média 10 Ha <
50 Ha >
1.16%
Pequena < 10
Ha
98.80%
Table 2.3: Use of the area by type of crop
Type of
farm
Use of cultivated area
Food crops
Area
%
Cash crops
Area (ha)
%
(ha)
Small
Medium
Large
340
550
14 646
913
Vegetable
Area
%
(ha)
95,6
871
32,2
4,1
0,3
174(1)
1 661(2)
6,4
61,4
22
317
1 259
706
91,9
5,2
2,9
Drawn up on the basis of CAP 1999-200. (1) Rice, cotton and sugar cane. (2) Rice
Rice is practically the only cash crop on the large and medium farms of Gaza
province. Cotton, which in the past covered important areas, is now limited to
27 hectares. However, the small farms are responsible for 160 hectares of
cotton, 438 hectares of sugar cane, 170 hectares of sunflower, and 103 hectares
of tobacco.
__________________________________________________
Main Report
___________________________________________________________ 28
__
In this province, as in the rest of the country, maize is the dominant food crop,
accounting for almost 50% of the cultivated area. Also important are cassava, a
crop very well adapted to the agro-climatic conditions of the area and which, by
its
characteristics,
can
make use not only of
Utilização da Área por Tipo de Cultura
rainfall during the rainy
season,
but
also
of
100%
unseasonal rains which are
80%
common
in
the
area.
60%
Pulses,
mainly
nhemba
40%
beans and groundnuts are
20%
also crops adapted to sandy
0%
soils, and tolerant of dry
Culturas
Culturas de Hortícolas
Alimentares Rendimento
periods.
Tipo de Cultura
Table 2.4 shows a summary
of the cultivated area, in
Pequena Média Grande
comparison with the rest of
the country. As the table shows, vegetables have considerable importance, and
this area has traditionally been one of the main suppliers of vegetables to
Maputo city.
Table 2.4: Crop areas in Gaza as a percentage of the Country
Crop
Food crops
Gaza
Country
(%)
299 126
3 110 610
9,6
Groundnuts
41 424
319 482
13,0
Sweet potato
13 407
46 305
30,0
“Boer” beans
1 915
72 700
2,6
“Jugo” beans
11 660
83 564
14,0
Butter beans
3 495
59 721
5,8
“Nhemba” beans
40 078
207 158
19,4
Cassava
61 693
637 847
9,7
Sorghum
3 914
232 447
1,68
Millet
3 238
39392
8,4
Maize
156 157
1 268 075
12,3
2 564
202 372
1,3
182
131 284
0,1>
1 661
---
100
443
35 294
1,2
Sunflower
170
7 555
2,2
Tobacco
107
26 635
0,1>
24 424
200 957
12,2
Cash crops
Cotton
Rice
Sugar Cane
Vegetables
CAP 1999-2000. INE
__________________________________________________
Main Report
___________________________________________________________ 29
__
The sandy soils and fossil dunes of the coastal areas are very appropriate for
fruit trees and have been traditionally used for these crops. Up to 20 kilometres
from the coast, rainfall is still higher than 800 mm, which is sufficient for fruit
trees, including those most demanding in rainfall, as is the case with coconut
palms. This represents a total area of Gaza and Inhambane coastal zones of
about 1,300,000 hectares that are fit for producing these crops. The area
available is still greater, if we consider that crops such as cashew and mafurra
oilseeds are more tolerant and can be grown is areas with lesser amounts of
rainfall. The number of fruit trees in the Gaza and Inhambane coastal region is
shown in Table 2.5.
Table 2.5: Number of fruit trees and production, 2000
Fruit(1)
Yield
Gaza
(ton/tree)
Nº
Inhambane
Prod.
Nº
(ton)
Total
Prod.
Prod.
(ton)
(ton)
Avocado
0,040
119 366
4 775
153 927
6 175
10 950
Guava
0,005
58 751
294
90 466
452
746
Orange
0,040
598 638
23 946
1 490 153
59 606
83 552
Lemon
0,050
231 412
11 571
225 593
11 280
22 851
Mafurra
0,010
511 576
5 116
112 369
11 237
16 353
Mango
0,050
795 171
39 758
1 238 714
61 936
101 694
Paw-paw
0,020
944 495
18 890
1 092 321
21 846
40 736
Tangerine
0,050
365 963
18 298
2 335 839
116 792
135 090
Grapefruit
0,040
3 352
134
25 614
1 025
1 159
0,010
(2)
5034 600
25 732
16052171
16 052
41 784
0,006
(3)
912 996
4 382
20722889
99 470
103 852
Cashew
Palms
(1)
(2)
(3)
The number of trees comes from CAP 1999-2000, INE, and the yields from qualified informants.
Based on the cashew nuts market by tree in the provinces in the 97-98 to 99-00 campaigns, and considering that
only 30% of the nuts are marketing through the formal system. Data from INCAJU.
Copra. A production of six kilos per tree, and a use of 80% is estimated.
In 2000, there were a total of 8.7 million fruit trees in Gaza, and 43.4 million in
Inhambane, giving a total of 52 million trees in the two provinces. Estimating an
average of 100 trees per hectare, the area occupied represents 40% of the area
potentially fit for fruit trees. Even in relation to this level of occupation, the
under-used production is enormous. This offers good possibilities for industrial
processing of this raw material.
4.2 PRODUCTION SYTEMS
One of the major limitations on peasant production is the poor availability of
labour. Over time, farmers have developed technologies that allow them to
__________________________________________________
Main Report
___________________________________________________________ 30
__
increase the efficiency of this scarce factor and reduce the risks, such as sowing
in groups (with an area equivalent to 1.2-1.3 hectares, according to the
calculations made by INIA).
Other techniques to overcome the limitations of the labour force include planting
fruit trees which, even under current conditions of a low rate of use of the fruit
produced, is highly profitable in relation to the low level of demand put on
existing labour. Another way of increasing labour productivity is through
livestock. Animal traction is very widespread in the areas, being used by at least
50% of the peasants.
4.3 AGRICULTURAL POTENTIAL OF THE AREA
From the point of view of actual and potential agricultural and livestock
productivity, three main regions can be identified, as shown in Table 2.6.
Table 2.6: Differing Productive Regions. Area occupied and potential
area (in hectares)
Province
Coastal
Inhambane
Gaza
Region
Irrigable
Extensive
Grazing (2)
Current
Potential
Current
Potential
Current
Potential
434 389
1 006 000
---
---
---
---
86 633
244 000
50 322(1)
133 700
2 500 000
4 000 000
The area currently exploited is about 9,000 hectares
As subsistence agriculture, system 2 of Region R3 of PROAGRI (INIA, 194).
Table 2.6 shows that there is a vast margin for expansion of agricultural
production in the Limpopo area. The limitation are more in terms of technical,
financial and economic capacity, rather that availability of land or adequate
infrastructures.
The remaining pages of the diagnosis stress only the crops, both in the irrigated
areas, and in the coastal area which, in Part III of this work will be the object of
assessing pre-viability projects, namely: rice, tomatoes and some fruits, and
coconuts. In particular, the intention here is to stress the production potential
and the investments needed to make viable the crops selected as a priority in
promoting agro-industrial processing.
4.4 THE IRRIGATED AREAS
With the repair of the Chokwe irrigation structures and the planned development
of other irrigation schemes, the minimum area of rice (soils with irrigation
structures and without alternative uses) may reach 11,000 hectares in the
2002-02 campaign, and to 40,000 hectares in the medium term. It could occupy
__________________________________________________
Main Report
___________________________________________________________ 31
__
even larger areas if the results prove economically attractive (in the 1970s, the
area under rice cultivation in the Chokwe irrigation scheme reached 18,000
hectares). The situation of this crop for the coming campaign may be
summarised as follows:
Irrigated land available that is well suited to rice production
(minimum of 11,000 ha.)
Good quality water in sufficient quantities for the timely flooding of
the sown basins;
Rice varieties that are of proven adaptation to the area, of modern
design, and consequently with good productive capacity. With regard to this, it
can be guaranteed that the current yields (less than 3 tonnes per hectare on
average, but reaching 7 tonnes/hectare by the greatest users) are not limited in
the rainy season sowings by problems with the varieties or seeds being used.
Significant increases in yields cannot be expected in the short term through
genetic improvements. This does not mean that improvement work should be
stopped. The introduction, development and evaluation of new crop varieties, as
well as the production of mother seed are continual and priority activities for the
maintenance of productive systems. Furthermore, the development of varieties
tolerant to low temperatures during flowering, as well as the adaptation of
aromatic varieties (both exotic and semi-aromatic varieties of local origin) will
be very important in raising yields from rice production in the valley.
Capacity to produce seed that is adequate to the needs in both
quality and quantity.
Producers who have a good knowledge of the crop and a good
business attitude, but who lack organisation.
Technicians who are well trained in research and extension, but with
weak financial support for developing their activities.
There are no important pests or diseases, with the exception of the
weeds common to all rice-growing area (Echinochloa Sps. among the grasses,
and Commelina among broad leafed plants), and birds, which are the main pest,
particularly in late harvests when the bird population is larger.
Aged fleet of machinery, with no chance of renovation, involving low
yields and high costs, which prevents agricultural work, mainly sowing and
harvesting, from taking place on time. We can give an example of this by
comparing the costs of preparing the land in the Rice Technological Chart (Rural
Consult Ltd 2002), which records 3 H/M for ploughing, plus 1 H/M for levelling,
with a total cost of US$ 43/ha. On the other hand, with preparation using a
heavy plough with offset discs ( 5 m of working width), with a tractor of 150 HP
and a working speed of 6.5 km/H, one hectare can be prepared in 0.4 H
(estimating a loss of 30% on the turns) at an operational cost of US$ 6/ha.
High costs of inputs (worsened by exaggerated financial costs) and
bad use of them. For example the Rice Technological Chart records the
application of 12 l of Propanil (for the control of grasses), and 4 l of MCPA (for
controlling broad-leafed weeds), with a total cost of US$ 43/ha/ But with good
levelling of the ground better results can be achieved (since the greatest
__________________________________________________
Main Report
___________________________________________________________ 32
__
reduction in yields because of weed infestation occur in the first 20-30 days of
crop development) with the application of 2 l of Pendimethalin with a cost of less
than US$ 10/ha. It is similar with sowing, which is done manually with the
consumption of 120 kgs of seed per hectare (with more levelling to cover the
seeds); but it could be done, together with application of fertiliser, in a single
operation using a line sower and fertiliser, and using 100 kg/ha of seed.
Finally, we should mention industrial productivity which is one of the
aspects where comparison with the Asian productive systems is most
unfavourable. The efficiency of the Inacio de Souza mill is 43% (43% of whole
grains and 23% broken ones). The Orli rice factory estimates a total efficiency
(whole plus broken grains) of 63%, thus the efficiency of the milling is probably
less. In comparison with the mills of a modern industry, with efficiency in the
order of 60%, the difference is 39%. Although broken grain has a relatively high
commercial value in Mozambique, industrial efficiency continues to be an
extremely negative factor, faced with the competition from Asian rice.
The rice production potential of the valley is large, but under the current
conditions it cannot face competition from imported Asian rice. One can sharpen
one's pencil and refine one's costs, but the differences are too large for cosmetic
arrangements. the solution involves total replacement, both in agricultural
production and in industry, and this means investment, organisation and
support structures.
4.5 POTENTIAL FOR RICE PRODUCTION: MAIN PRODUCTION SYSTEMS
Rice has traditionally been a dominant crop in the Limpopo Valley irrigation
areas. It once covered 18,000 hectares in the Chokwe irrigated area, and in the
1970s reached total production in the Valley of over 70,000 tonnes of husked
rice. Currently, with the rehabilitation of the irrigation schemes in the area under
way, and with local rice facing strong competition on the local market from
imported Asian rice, the viability of this crop has been questioned.
With regard to this, there is one fact to be borne in mind: there are no
alternatives to rice for heavy, poorly drained soils, at least in the rainy season.
The area of these soils has been estimated at 29,000 hectares, for the
potentially irrigable areas of Gaza (INIA Series Terra e Agua. Technical Note 26).
In the Chokwe irrigation scheme, they occupy an area of 11,000 hectares. This
doe snot imply, logically, that rice cannot occupy other irrigated soils in the
Valley but that, with the future development of irrigated areas, there will be an
area of 40,000 hectares which should be covered with rice, or with a
hypothetical alternative crop. The challenge, however, lies in developing
alternative technologies that make rice in this area profitable. The main systems
of commercial rice production in the world can be classified as:
System of the Developed Countries
Totally mechanised and with a high level of investment. Irrigated fields (in some
cases even before the sowings, which are done using aircraft with soaked
__________________________________________________
Main Report
___________________________________________________________ 33
__
seeds), with very good levelling of the soil and regulation of the water, as well
as chemical control of pests and diseases. The production is complemented with
post-harvest systems which include driers, silos, high yielding (more than 60%)
mills and industrialisation of the grain and the by-products. The types of rice
produced have large and rounded grains (Caroline type) Yields are around 5
tonnes/hectare. With some variations, this system is practiced in the USA
(Florida), Europe (Spain and Italy) and Japan.
System of the Asian Countries
This productive system is basically the traditional one, with a series of improved
varieties, fertilisers and chemical to control pests. In the most humid areas, the
crop is rain-fed (upland rice). Traditional irrigation, using surface springs, as well
as gravity-fed irrigation is the common method for paddy rice. Levelling is
frequently done by ploughing in flooded soils using traction from water buffalo.
The nursery and transplanting system is universally applied. The post harvest
systems, post-harvest treatment conditions and milling are very efficient. The
type of rice produced is mainly “patna” but the production of aromatic varieties
is also frequent. Unit yields are relatively low (around 2.5 tonnes/hectare) but
the costs are also low, and post-harvest yields are high.
Chinese system
This may be described as a mixture of the two previous systems. Extensive use
of hybrid rice varieties. It is the only region that currently uses this technology
which is only recently being developed by transnational seed companies. Yields
are around 4 tonnes/hectare.
Extensive-Intensive system
This system is used in Australia and in Uruguay, and is being introduced into
some parts of Argentina and southern Brazil. The system is based on alternating
rice with periods of mixed pastures, grasses with forage legume (2 years of rice,
and 2-3 years of grazing). The use of inputs is high, with the exception of
nitrogen fertilisers, which are left by the pulses. The varieties produced are
patna, carolina and also aromatic rice. the use of direct sowing methods is
common. This system gives the highest yields per sown area, reaching an
average of 6 tonnes/hectare. Milling, and the use of by-products, including the
oil, are efficient. In west Africa, the successful spread of varieties (including the
Jasmin aromatic variety), improved technologies and production support
systems have resulted in important increases in production, but one cannot
speak of a different production system.
"Madagascar" System
Based on the transplant of plants that are a few days old, with intervals of 40
centimetres, and with just one plant per hole, Irrigation keeps the soil
continually humid, but without being flooded, and no agricultural chemicals or
fertilisers are used. Weed control is through the leaves keeping the soil in
__________________________________________________
Main Report
___________________________________________________________ 34
__
shadow, since horizontal leaved varieties are used. Apart from the practical
difficulties in transplanting plants that are so small (outside of small, gardentype areas), there is no explanation, either physiological or agricultural, for how
this system manages to obtain yields of 9-10 tonnes/hectare, as claimed by the
creators of this method. Thus these revelations have been received with
interest, but also with scepticism. Furthermore, these results have not been
repeated by IRRI researchers.
In southern Africa, Mozambique is the only country with good conditions for rice
production. thus there are broad possibilities, from the viewpoint of the market
(starting with the domestic market, for rice, but only if it can be produced in
conditions that are competitive with the current supplier of these markets,
mainly the Asian countries. There are two clearly different regions for rice
production in Mozambique:
The region of Sofala, Zambezia and part of Nampula, where climate and
soil conditions allow production in conditions similar to those of the Asian
countries, with advantages in transport costs and labour. Indeed, two rice
production projects have already been drawn up, one in the Beira Corridor and
the other in the Zambezia development area, which seek to produce 300,000
tonnes of husked rice per year.
The irrigated areas in the south of the country, where investments in
irrigation infrastructures and the costs if machinery and inputs, indicate that
competition should be undertaken mainly by increasing yields. In this area,. the
immediate possibilities are the use of technologies from the developed
countries, while at the same time carrying out research to adopt technologies for
handling the crop which make it possible to reduce production costs and
increase yields in the productive systems.
The use of hybrid rice varieties, for instance, seems interesting, as does
cultivating Azolla (a symbiosis of a fern and algae, able to fix atmospheric
nitrogen) in the rice flood water; crop rotation with forage legumes, in order to
fix nitrogen, the poridtion of fodder, the reduction of infesting weeds (Sesbania
aculeata or S. exaltata which can grow in flooded soils and fix nitrogen in the
above water areas of the plant, or some annual pulse which can grow in the dry
seasons like Crotalaria or Styloshantes, the latter with the ability to re-seed), or
even breeding fish in the flood water where more than 500 kilos/ha of fish per
crop season can be produced.
Investments needed to make rice viable
Mozambique has made, and continues to make, major investments in repairing
the Limpopo Valley irrigation systems. The investment must be supplemented
with developing production that allows making the most out of them. It is not
possible to do this by maintaining rain-fed subsistence agricultural production
systems, in these relatively expensive areas. Investments, and organisation of
production and marketing will be needed to develop efficient and profitable
productive systems.
__________________________________________________
Main Report
___________________________________________________________ 35
__
This does not necessarily mean replacing the small scale producer by large
commercial companies, but it does mean the integration of agro-industrial
companies that finance, promote and add value to the production of the small
and medium agricultural producers.
Business sector: Initial investment
The viability of growing rice, faced with imports of Asian rice, would involve
modernising the machinery used and a good levelling of the land, that would
follow the repair of the irrigation infrastructures that is currently under way. The
estimated costs per 1,000 hectares in the commercial sector are shown in Table
2.7.
Table 2.7: Investment needed to prepare and operate
1,000 hectares of rice
Item
Operation
1
2
Levelling the land (1) Hectares
3
Machinery for preparing the sowing.
Preparation calculated at 25 days of 16
effective working hours.
Tractor dual traction of 150 HP
Heavy offset harrow, 5.1 m broad
Chain harrow
Sowing and applying fertiliser
Sowing and applying fertiliser. (6 m
wide de largo). To sow in 25 working
days of 16 effective hours per day.
Yield 0.4 H/hectare.
Centrifugal
4
Tractor dual traction, 80 HP.
Application of herbicides
Sprayer with 2,000 l tank. 15m
range of work, Yield 0.15 H/ha.
Tractor dual traction, 80 HP
5
Harvest
Combine harvester with 4.3m of cutting
Mechanical unloading wagon
No. units
Unit price
Item
Price
1 000
200
200 000
2
50 000
100 000
2
2
7 500
500
15 000
1 000
2
10 000
20 000
1
2
1 000
30 000
1 000
60 000
1
4 000
4 000
1
30 000
30 000
4
8
150 000
5 000
600 000
40 000
Total
(3) (1) Hired machinery
Business sector: Operational costs
__________________________________________________
Main Report
1 070 000
___________________________________________________________ 36
__
Table 2.8: Machinery: the costs per hour of the machinery are
the same as the Technological charter, plus 20-25% for
replacement
Operation
Preparation of the soil
Sowing and application of fertiliser
Application of herbicides
Coverage with urea
Harvest
Levelling (20 % of the area)
Total
Data from the Technological Chart
Difference
H/M
US$
1,80
21,60
0,40
4,80
0,15
1,80
0,20
2,40
0,30
7,20
20,00
57,80
111,00
-53,20
2,85
8,00
-5,15
Table 2.9: Inputs
Input
Unit
Amount/
ha
Unit cost
(US$)
Cost/ha
Fertiliser NPK 12-24-12
Ton.
0,2
316
63,0
Seeds
Ton.
Ton.
0,1
0,15
250
236
25,0
35,4
L
2.0
4
8,0
L
1,5
3
4,5
Ha/year
0,5
20
10,0
145,9
169,4
Surface fertiliser (urea)
Pre-emergent herbicides
Broad leaf herbicide, 24D or MCPA
Water ( 6 moths)
Total inputs
Data
from
Technological Chart
Difference
the
-23,5
Table 2.10: Labour
Opening of fields, control of birds,
25 days
US$ 30
Technological Chart
57 days
US$ 57
-32 days
US$ - 27
Difference
Table 2.11: Transport
Transport of inputs and harvest
US$ 25.0
Total direct costs
US$ 258.7
Technological
US$ 365.0
Difference
US$ 106.3
__________________________________________________
Main Report
___________________________________________________________ 37
__
Average yields expected, assuming that the agricultural operations are carried
out on time: >5 tonnes/hectare
Family Sector: Initial Investment
Table 2.12: Family Sector: Initial Investment
Item
Operation
1
2
Levelling the land (1) Hectares
No Unit.
Unit Price
Item
Price
1 000
200
200 000
3
35 000
105 000
3
6 000
18 000
3
500
1 500
50
20
1 000
3
1 000
3 000
1
4 000
4 000
Machinery for preparing the sowing.
Preparation calculated at 25 days of
16 effective working hours.
Tractor dual traction of 100 HP
Heavy offset harrow, 3.6 m broad
Chain harrow
Sowing and applying fertiliser
3
"Matraca" sower
10H/hectare.
with
yields
of
Centrifugal
Application of herbicides
"Mocila" type sprayer with 20 l tank,
and 2m range of work, Yield 4H/ha.
Harvest and threshing
4
5
Manual
Total
328 500
Family sector: direct costs
Table 2.13 summarises the total direct costs for the family sector, which come
to US$ 269.2/hectare with a yield of 4.5 tonnes/hectare. The yield is relatively
lower than that of the business sector, because of problems in carrying out
agricultural operations on time.
Table 2.13: Operation: the costs per H/M are the same as the
current ones plus 20-25% for replacement
Operation
Preparing the soil
Fertilising. Centrifuge
plus chain harrow
Sowing
Application herbicides
Covering with urea
Harvest and threshing
Labour. Opening fields, irrigation, loading and
unloading bird control etc
Total
Days
H/M
1,0
0,5
2,0
4,0
2,0
20,0
30
58,0
__________________________________________________
Main Report
US$
12,0
6,0
2,0
4,0
2,0
20,0
30
1,5
76,0
___________________________________________________________ 38
__
Table 2.14: Inputs
Input
Unit
Fertiliser NPK 12-24-12
Seeds
Surface fertiliser (urea)
Pre-emergent herbicide
Post-emergent herbicide
Water (6 months)
Total inputs
Hire of transport
Ton.
Ton.
Ton.
L
L
Amount
/ha
0,2
0,05
0,15
2,0
1,5
ha/year
0,5
Unit
US$
Price
Cost/ha
316
250
333
4
3
63,2
12,5
50,0
8,0
4,5
20
10,0
148,2
45,0
Development of production
Once the investments envisaged have been made, later, with the development
of new irrigated areas, the minimum areas for rice cultivation in the valley would
be those shown on Table 2.15:
Table 2.15: Minimum areas doer rice
Year
Area (ha)
1-5
5-10
5-10
10
and
seg.
(1)
15 000
22 000
15 000
37 000
40 000
28 000
68 000
Yield
Ton/ha
5
5
4,5
5,5
5,0
Production
(Tonnes)
45 000
110 000
67 500
177 500
220 000
140 000
360 000
Observations
Rice 2nd session (1)
Total Production
Prod, total
Second season rice will probably give lower unit yields because of solar radiation, but it
will also have lower fertiliser costs, making use of the residual effect of the P applied on
the first sowing. It will also have fewer problems with birds.
With this production, and with rice in Zambezia and Sofala already being
developed, as from the fifth year, Mozambique may be able to pass from net
importer to net exporter of rice, to the neighbouring markets, since the country
has the best conditions in southern Africa for rice production.
4.6 POTENTIAL FOR TOMATO PRODUCTION
Tomatoes were the most important vegetable in the valley's irrigated area,
when the Chilembene processing factory was operating, with a capacity of 230
__________________________________________________
Main Report
___________________________________________________________ 39
__
tones/hour, and tomato paste was exported to the GDR, and later to Japan. In
this period, over 500 hectares in the Chokwe irrigation scheme were planted
with tomato.
The tomatoes produced in the valley are mainly on the industrial type, with
small fruit, less juice than the table varieties, and with a strongly coloured
paste. This type of tomato is ideal for the production of concentrate. In addition,
it is well accepted as tomato for consumption in the Maputo market. SEMOC
markets 3 varieties of the industrial-type tomato, at the price of US$ 50 per kilo
of seed.
A tomato processing factory will need about 1,000 hectares of this type of
tomato. Production from the irrigated area could also expand its participation in
the Maputo market, which consumes 19,000 tonnes of this type of tomato in the
dry season. In total, the area planted with this type of tomato could reach 1,300
hectares.
There are also good possibilities of exporting table tomatoes to the South
African market, particularly in the May-September period, competing with the
winter tomatoes from southern South Africa. The quality is for these exports, as
well as for a more demanding market than that of Maputo. For this, "long life"
varieties must be used, with a good appearance and which last for a long time
after harvesting, or hybrids may be used, such as HTX 14, marketed by SEMOC
at US$ 350/kg.
Crop management, particularly irrigation, is different for the two types of
tomato. In tomatoes for industry, the main objective is to obtain intensely
coloured tomatoes, a high concentration of solids, and uniform ripening, so as to
achieve one, or at most two, harvests. To this end, spaced irrigation shifts must
be used, and irrigation must be abandoned in the final period of ripening. But, in
the case of tomatoes for direct consumption, irrigation must be frequent, which
favours the development of large fruit, with a high juice content.
The crop cycle is also different in the two types of production. For the industrial
tomatoes, the cycle is 100-120 days (including 30 days in the nursery), while in
tomatoes for direct consumption, the cycle may be 120 days. The cycle may
even reach 150 days, if supports are used, since the plants continue to grow
and to flower, but the cuttings do not support the weight of the fruit in highly
grown plants.
Tomatoes are a crop that is not sensitive to the photo-period so that, in theory,
they could be planted at any time. High temperatures, however, lead to
exaggerated vegetative growth, to the prejudice of fruit production.
Temperatures higher than 25 degrees C, accompanied by high atmospheric
humidity, also favour the development of diseases and pests, especially the
rotting of fruit. For this reason, the production period is limited to the dry period,
from June-July to December.
__________________________________________________
Main Report
___________________________________________________________ 40
__
4.7 INVESTMENTS NEEDED TO MAKE TOMATO PRODUCTION VIABLE
Industrial Tomatoes
Crop cycle 100 days
Sowing in nurseries, March-August. Transplant at 30 days.
Table 2.16: Operations per hectare
N.º Operation
H/M Days Observations
15 In plastic trays or bags made
Preparing
nurseries
1
and sowing
2
3
of newspaper. Subtract of
ermiculite or turf
Ploughing,
weeding
formation
of
ridges
and
depth
fertiliser
Transplanting
4
5
6
Irrigation
7
Harvest and transport
5
4
10
Ridges at 0.8m
Distance between plants 0.3
m.40,000 plants/ha
6
Wedding and prunning
10
Application of agrochemicals and surface
10
Total
10
20
15
75
Track
Table 2.17: Inputs per ha
Input
Unit
Amounts
Total Price
US$
Boxes
and
substract
Seeds
Fertiliser
(deep)
Urea
Water
Agrofertilizer
Total
box
400
500
g
ton
200
0.75
12
250
ton
Year
0.05
0.5
12
20
30
Observations
15-15-15
2 months after transplant
Ridomil, Difolatan,
similares
824
Yields: 45 ton/ha
__________________________________________________
Main Report
Lorsbn
ou
___________________________________________________________ 41
__
4.8
COASTAL AREA
This region extends for more than 600 kilometres, along the Gaza and
Inhambane coast, with a total area of over 1.5 million hectares. Sandy and very
deep soils, plus its sub-humid climate, with rainfall in excess of 900 mm, make
this zone ideal for tree production.
The rainy period extends for 6-7 months, and there is still rainfall greater than
20 mm, even in the dry months - which favours the production of those fruit
trees that flower in the dry season, such as cashew and mango trees.
On the basis of 100 plants per hectare, and in comparison with the area
available, it has been estimated that about 35% of the potential area for fruit is
currently occupied by fruit trees. The percentage is much lower, if we take into
consideration that the area with rainfall of between 900 and 700 mm is also fit
for fruit production and this area amounts to millions of hectares in the two
provinces.
With the exception of coconut palms, the fruit trees are not grouped into
commercial plantations. Instead they are scattered and alternate with other
crops and with spontaneous vegetation. This characteristic makes it difficult to
collect the fruit for sale, but on the other hand it explains the surprisingly good
health of the plants, given that production is totally organic, with out any use of
agro-chemicals.
There are real conditions for exporting fruit to South Africa, taking into account
the quality of the fruit produced, and the difference in ripening, which ranges
from more than two months for the north of Inhambane to 1 month for Gaza.
These advantages are not currently being made use of, for lack of organisation
in harvesting the fruit and preparing it for export. With regional support and
transport centres for the “Typification and Packaging Centre” this possibility
could become real.
4.9
COCONUT PALMS AND COPRA: POTENTIAL PRODUCTION
Coconut plantations are found the length of the Mozambican coast, with the
highest concentrations in Zambezia and Inhambane provinces. For a very long
time, these two provinces have had an organisation for the production and
ownership of the trees. While in Zambezia copra production has mostly been in
the hands of companies who, since colonial days, used abundant and cheap
waged labour for their production, in Inhambane production has always been
undertaken by peasant farmers who immediately sold the crop to vegetable oil
factories.
Strangely enough, currently, while participation by the family and private
sectors is growing in Zambezia, where the companies are even hiring out the
management of the plantations, and buy more than 20,000 tonnes from the
family and private sectors, in Inhambane there are complaints of a shortage of
raw materials, and companies are starting to plant dwarf palms on a total of
10,000 hectares (a million trees).
__________________________________________________
Main Report
___________________________________________________________ 42
__
Production in Inhambane is normally estimated at 100 coconuts/palm tree for
the tall variety, and 250 for the dwarf palm. Technical international data
estimates that it takes 4,000 to 6,000 coconuts from tall palms or 5,000 to
9,000 from dwarf palms to produce a tonne of copra. Thus the production of
copra per tree will be at least 16 kilos for the tall variety and 38 kilos for the
dwarf palm. This is much more than estimated in table no, 5, based on the
production and number of plants in the 1970s.
Even with these low estimates, the potential production of copra in Inhambane
and Gaza is almost 300% higher than that presented by the factories which is
shown in the following Table 2.18:
Table 2.18: Potential production of Copra
Factory
Tonnes of copra
Processed
Copromol
Oil production
Bagasse production
(tonnes)
(tonnes)
24 000
12 000
8 000
Somoil
6 000
3 000
2 000
Inhacongo
6 000
3 000
2 000
36 000
18 000
12 000
Total
The prices paid to the producers have been falling in recent years, from a
maximum of US$ 150 per tonne in 1996 to the current price of 1,900,000
meticais (US$ 79), so that it is possible that part of the shortage of raw
material experienced by the factory is due to an increase of auto-consumption,
the sale of fresh coconuts (much more profitable than copra), and the
production of sura (a drink made out of palm tree sap).
On the other hand, the plantations show no shortage of trees, nor the
dominance of old trees. The decline in prices is due in part to the fall in
international prices faced with the competition of African palm oil, and in part to
the high financial costs of the companies.
Both Copromol and Somoil are planning to plant 5,000 hectares with dwarf
palms, with an approximate total of a million plants. The formalities for
granting land for these plantations are being finalised, and the availability of
seeds is guaranteed. It is estimated that the pace of occupation of the land will
be as follows Table 2.19:
__________________________________________________
Main Report
___________________________________________________________ 43
__
Table 2.19: Pace of occupation of the land
Year 0
Preparation of land and nurseries
Year 1
1,000 ha; 100,000 plants
Year 2
3,000 ha; 300,000 plants
Year 3
7,000 ha; 700,000 plants
Year 4
10,000 ha; 1,000,000 plants
The dwarf varieties are very precocious. They begin to bear fruit as from the
second year, but commercial production only begins in the third year (10%).
They reach 50% in the third year, and can reach 100% as from the fifth year.
In accordance with this, the actual productions of the new plantations would be
as indicated in Table 2.20:
Table 2.20: Rhythm of plant production
Project
Year
Age, number and production of the plants
Third year
Fourth year
No.
plants
Tonnes
1
---
2
Fifth and later
years
Nº
plants
Tonnes
Tonnes
Tonnes
Copra
Copra
---
---
---
---
---
---
---
---
---
---
---
---
---
3
100 000
250
---
---
---
---
250
4
200 000
500
100 000
1 250
---
---
1 750
5
400 000
1 000
200 000
2 500
100 000
2 500
6 000
6
300 000
750
400 000
5 000
300 000
7 500
13 250
7
---
---
300 000
3 750
700 000
17 500
21 250
8
---
---
---
---
1 000
000
25 000
25 000
copra
Nº plants
Total
Copra
__________________________________________________
Main Report
___________________________________________________________ 44
__
5 LIVESTOCK SECTOR
In principle, the livestock sector is not considered within the projects to be
selected for pre-viability assessment in accordance with the terms of reference
set for the present study. However, both the review of secondary sources and
the field visits, immediately showed the difficulty of leaving aside the livestock
sector, at least from the general diagnosis of the current situation.
5.1
POTENTIAL FOR LIVESTOCK PRODUCTION
The livestock potential of Gaza province has been calculated by INIA (on the
basis of an Australian model adapted by Reddy and Timberlake) at 590,000 UA.
As Table 2.22 shows, in 2000 the livestock herd estimated on the basis of
Census included 178,097 cattle, 383,214 goats and 30,620 sheep. Using the
equivalence that 1 UA = 1.6 head of cattle = 5 goats = 5 sheep, the total
population would be 194,077 UA. That is, it is estimated that only a third of the
province's livestock potential is currently being used.
As can be seen from this Table 2.21, the data reported by the Provincial
Livestock Service (SPP) are lower than the real number of animals registered in
the census. this discrepancy results from the inefficiency of the data collection
system.
Table 2.21: Number of each species (Gaza), 2000
SPECIES
Number
Percentage
SPP*
Number
( Census) **
Cattle
153 152
53,7%
178 097
Sheep
17 786
6.2%
30 620
Goat
68 282
24%
383 214
7 119
2.5%
109 039
Chicken
23 536
8.2%
1 532 488
Ducks
12 735
4.5%
30 620
2 198
0.7%
5 350
Pig
Donkey
Total
284 808*
Source : * SPP- 2001;** Census agro-pecuário ( 1999-2000)
__________________________________________________
Main Report
___________________________________________________________ 45
__
5.2
CURRENT PRODUCTION AND PRODUCTS
Currently, according to the SPP in Gaza cattle are the species with the largest
weight, representing about 54% of the total animal population. Goats account
for 19.7% and chickens for 14,6%, according to the data obtained in 2001
(SPP). The survey of 2001 reports that, compared with the previous year, there
was an increase in the number of cattle of 13%, in goats of 38%, in sheep of
71.6%, and in pigs of 10.6% (Table 2.21).
EVOLUTION OF NUMBERS OF ANIMALS - CATTLE
The annual survey (2001) found a
total of 153,152 heads of cattle,
corresponding to an annual rate of
growth in numbers of 13%, and a
birth rate of 44.1%.
Graph 2.4: Evolution of number of catle
500000
400000
Heads
5.3
300000
200000
Despite the low levels of birth
100000
recorded, numbers are growing.
0
This growth is, on the one hand,
1980
1990
1992
2000
the result of restocking (which, to
our understanding, is insignificant).
Years
Under the restocking programme,
Gaza province, in the 1992-2000
period, received only 2,757 cattle. NGOs and private farmers imported 861
cattle between 1997 and 2001. On the other hand, improved veterinary care
has positively influenced
this growth.
The
greatest
concentrations of cattle in
Gaza province are to be
found
in
Mabalane,
Chokwe, Chibuto and XaiXai districts. It is said that
Chokwe district has the
highest concentration of
cattle (SPP, 2001).
The ratio of cattle to land
in Gaza is 2.02 head per
square kilometre and the
ratio of cattle to human
inhabitants is o.144 head
per person. It should be noted that in 1970 the density was 1.7 head per
square kilometre throughout the country (Quental Mendes, 1974).
__________________________________________________
Main Report
2001
___________________________________________________________ 46
__
5.4
PROJECTION (FORECAST FOR THE NEXT 10 YEARS)
According to the data presented in the appended table, in 10 years from how
the number of animals will be the same or greater than the number listed in
1975. With an annual rate of extraction of 4.7%, and an average growth rate of
15%, average annual production of 3,250 tonnes of beef could be reached, with
a peak of 7,414 tonnes in 2011.
5.5
SMALL RUMINANTS (SHEEP AND GOATS)
The results from the agricultural and livestock census show that Gaza provinces
has 7.59% of the country's goats and 17.59% of its sheep. Based on the
annual information from the province, the districts with the largest
concentration of small ruminants are Mabalane, Chicualacuala, Guija and
Chokwe. These districts contribute with 65.7% of the province's goats and
76.9% of its sheep.
The Graph 2.5 on how the numbers are evolving shows that between 1995 and
2001 there has been an increase of about 92% in the number of goats, and
117% in the number of sheep.
Graph 2.5: Evoluion of the number of goats and
sheep (1995-2001)
80000
60000
1995
40000
2000
20000
2001
0
Goats
Sheep
The
re are 0.9 goats per square kilometre and 0.2 sheep per square kilometre.
There are 0.06 goats per person in the province.
5.6
PIGS
The number of pigs in Gaza is growing. According to the information from the
census, 4.55% of the country's pigs are in this province. Table 2.22 shows the
way number have grown from 1995 to 2001:
Table 2.22: Evolution of numbers of pigs
Number
1995
2000
2001
Census (99-200)
3.605
6.453
7.119
109.039
__________________________________________________
Main Report
___________________________________________________________ 47
__
Source: DINAP, 2000; SPP’S, 2001
The largest concentrations of pigs in 2001 were in the district of Manjakaze,
Mabalane, Guija and Chokwe. It should be mentioned that almost all the pigs
belong to the family sector.
5.7
LIVESTOCK PRODUCTION
Meat production, from the various species exploited in Gaza, amounted to
227.48 tonnes in 2001. One should note that beef accounted for 97.6% of this.
Graph 2.6: Percentage contribution to meat
by species
1%
1,32%
97,6%
Beef
Meat fromgoats and sheep
Pork
Beef
Beef production in Gaza in 2001 was 222.21 tonnes (about 1,300 head), which
was an increase of 35% when compared to 2000. The family sector accounted
for 79.5% and the private sector for 20.5%. Average carcass weight was 168
kilos, compared with 152 kilos recorded in 2000, and was about 1.45 kilos per
existing head. It should be noted that, in 2000, 66% of the animals slaughtered
in the Maputo municipal slaughterhouse came from Gaza (DINEP, 2000). The
rate of extraction, in 2001, was 0.7% and 1.7% for the family and private
sectors respectively. It is important to note that the average in the country was
13.1% in the 1967-1974 period, reaching a maximum of 15.2% in 1971. Over
the same period (1967-1971), the business sector south of the Save showed an
annual average rate of extraction of 17.1%
__________________________________________________
Main Report
___________________________________________________________ 48
__
Graph 2.7: Evolution of beef production, 19922001
250
Tonnes
200
150
100
50
0
1992 1993 1994 1995 1996 1997 1998 1999 2000 2001
Years
5.8
LIVESTOCK POLICY AND STRATEGY
Based on government guidelines, the Ministry of Agriculture, through its
National Livestock Directorate, defines its strategy/policy as promoting livestock
development so that this sector may contribute to increased food security and
improved household diet, using rationally and sustainably the available
resources.
To reach the objectives mentioned above, the following policy has been
defined;
Rehabilitate livestock infrastructures (including drinking point, dip tanks,
handling corridors and corrals, quarantine units, analysis and diagnosis
laboratories, breeding posts, etc.)
Undertake restocking (priority for ruminants and the family sector as
target group)
Promote development of the institutions linked to livestock.
Support for the family sector, apart from promotion activities, involves:
Assistance for milk producers
Introducing programmes to expand use of animal traction
Promotion of increased poultry production
__________________________________________________
Main Report
___________________________________________________________ 49
__
Support for extension services.
In the private sector, the programme seeks to improve the skills of commercial
breeders and undertake activities in order to continue restocking: to
rehabilitate milk production capacity and increase production of pork.
Main constraints on the livestock sector
Defective general management
Defective veterinary care
Insufficient breeding cows
Prevalence of disease
Defective health coverage to prevent and control diseases
Insufficient livestock infrastructures
Water shortages during 4-6 months of the year
Absence of available credit
Lack of a commercial culture
Defective commercial network for family sector livestock products
Lack of industries (meat, milk, animal feed)
Limited extension for publicising technical norms on breeding ad
handling animals/
Main opportunities for the livestock sector
Existence of various livestock species. There is a good beef cattle unit.
Existence of some livestock infrastructures (dip tanks, treatment corridors,
drinking points)
Quality grazing land, though scarce in the dry season
Existence of livestock farmers with some knowledge of breeding (there is a
tradition of breeding animals)
Willingness of the breeders to develop animal production.
Strategy to be adopted
Despite the negative factors, there is the potential to develop livestock
production in the Limpopo Valley. This potential is related to the existence of
animals (several species), grazing land, agro-industrial infrastructures, and
organisation of livestock breeders (albeit at an embryonic stage). Some
changes in the breeding system could contribute to developing livestock
production aimed at the market.
__________________________________________________
Main Report
___________________________________________________________ 50
__
Gaza province is the second largest producer (24.66% of head) of cattle in the
country, and occupies top position in the southern region. In possesses 54.2%
of the number of cattle in the south. In the region, Inhambane province is in
second position (31.7%), and in last place is Maputo province, with 14% of the
number of cattle south of the Save. As for goats, top position goes to
Inhambane (52.3%), followed by Gaza with 34.2%. As for sheep, Gaza has
63% of the numbers in the southern region.
The Limpopo Valley has as its main advantages the fact that it possesses good
agro-climatic conditions for the production of ruminants, such as: good and
large areas for grazing, relatively cheap labour, and a relatively favourable
climate. This aspect may be observed from the fact that livestock numbers are
growing. Despite this, the Valley does not stand out as a major meat and milk
producer because the extensive breeding system practiced and the seasonal
rainfall does not favour year-round pastures. Because of this, the animals lose
weight in the dry season and gain weight in the rainy season.
It should be stressed that the existence/re-activation of agro-industries in the
region also plays an important role in livestock production, because their byproducts can be used to feed the animals, as well as contributing to improved
quality of livestock produce through meat and milk processing.
Changes in the production system by some of the large and medium breeders
may be advantageous, particularly in the dry season, by keeping the growth
and fattening of the animals constant, and thus achieve greater productivity
from the herd. this is because it will make possible a speedy return on the
capital invested, with results in increased productivity by area, greater weight
gain in short time, better health control etc.
Base don what has been described above, we suggest that the following
projects be promoted:
Beef cattle
Building a slaughterhouse
Production of fodder
Promotion of livestock fairs
Establishment of a tanning industry
Milk cattle
Small ruminants
Pigs
Use of wild animals as
livestock
__________________________________________________
Main Report
___________________________________________________________ 51
__
6 SECTOR AGRO-INDUSTRIAL
6.1 CONCEPTUAL APPROACH
The relaunching of agro-processing in the Limpopo Valley, which is the purpose
of the present study, is necessarily linked to the effective exploitation of the
Valley's agricultural potential. Indeed, relaunching agro-industry is, in itself, the
incentive needed to relaunch agricultural activity since it represents, in addition
to a way of absorbing agricultural production, also, at least from the macroeconomic perspective, the factor that adds value to this production.
However, during intensive consultations, interviews and discussions that we
undertook during the present study, it was shown to be crucial that, in order to
envisage or encourage private investors to take party in the agro-processing
business in the valley, whether to reactivate existing plants, or to start up
entirely new projects, it was certainly necessary to answer the question: When
will there be stable and sustainable reactivation of competitive and quality
agricultural production in Chokwe ?
If this question is not answered quickly, in a consistent manner, with concrete
and convincing projects and activities - particularly public ones - then it will be
difficult to see other private investors joining the longstanding drama of the
farmers who are already there. And the public investments must be viewed as
the
indispensable
catalyst
for
private
investment, both by granting it the necessary
One cannot envisage
security, and by acting in areas where recovery
any flow of private
is difficult or slow. Thus aspects linked to
investment into agro-
physical infrastructures;
processing while there
agricultural support structures;
agricultural
strategies;
research
policy
and
rural extension;
stimulating credit for agricultural activity;
systems to absorb production;
storage systems;
mechanisms to certify origin and quality,
is no security as to an
abundance of good
quality raw materials
at tolerable prices, for
a long enough period
to allow these
investments to be
are an important part of institutional package
profitable.
that is indispensable for successful agriculture.
These
components
are
eminently
public
investment - even if carried out by private suppliers. To them will be added the
private investment initiatives, stimulated by the public investments and attitude
towards agriculture.
__________________________________________________
Main Report
___________________________________________________________ 52
__
The drama currently experienced in the Mozambican agricultural sector, and in
the Limpopo Valley in particular, is in itself sufficiently demotivating, because,
apart from all the risk factors linked to the business, there are also the risks of
natural disasters - cyclical drought and floods - which make investment in this
sector still more vulnerable. More seriously, they also keep the financial sector
away from rural business. The possibility of agriculture, and then agro-industry,
of attracting quality investments in the Limpopo Valley is thus linked to a clear
and interested positioning of the state at the head of the relaunching process.
A special note, and one that illustrates the drama that agriculture in the valley
is going through, should be made of the imminent closure of the only seed
processing company in Chokwe, belonging to SEMOC/SEED Co., because of an
alleged lack of viability resulting from a low level of sales. If this happens, the
paralysis of this unit will certainly compromise the entire agricultural production
system in the Valley, particularly rice production. When it came to rice seed,
SEMOC was noteworthy both as a producer/promoter and as a processor/seller.
6.2
METHODOLOGY FOR THE APPROACH USED IN THE STUDY
The concept of Anchor Project has headed the methodology adopted for
undertaking this study.
This concept is based on the conviction that a good anchor project contains the
potential to carry with it a series of positive multiplier effects. And, in the
conviction that a good agro-industrial project, rather than necessarily a good
agricultural project, may contribute in a decisive and effective form to carry
along not only the directly associated agricultural activity, but also the transport
system, the distribution of inputs, the mechanisation services, savings and
credit services, and storage systems, among others. That is, a series of anchor
projects could set in motion the recovery of an entire integrated production,
processing and marketing system in the Limpopo Valley, for one crop or a
series of crops. Thus:
It has been assumed that each of the crops selected for this study obeys
a specific geographical distribution along the Valley: Rice in Chokwe and
Macia; vegetables in Chokwe and Xai-Xai; copra, cassava, tangerines
and paw-paws in Inhambane. Thus each visit to each of these places
had in mind analysing the problematic of the agro-processing of each
local crop. Looking at this distribution, the crops were divided between
those already processed, within the Valley perimeter or along it, and
those not yet processed, but with potential for processing.
For the crops already processed, the study was guided towards deeper
knowledge of the capacities, types of technology, and current
state of the processing units, through making an inventory of them,
and how operational they are, as well as the most probable causes for
__________________________________________________
Main Report
___________________________________________________________ 53
__
the current state of affairs. The principle is that if this study and
subsequent activities result in the relaunching of the agro-processing
units at the highest levels of production attained in their history, then it
will have been worthwhile. But the study has greater and wider
ambitions.
The yields from the technologies used in the established agroprocessing units were analysed and compared with those of competing
countries to determine their competitiveness and viability.
Once the overall agro-processing capacities for each crop with the
Valley or its surroundings were determined, a comparative analysis was
made of the potential capacity of agricultural production to supply raw
material to the established processing units and excess production which
could justify the appearance of other processing units.
For each crop, the agro-processing potential was assessed: based not
exclusively on the local experience, but above all on the known
international experience, for each crop possible levels of processing,
their applications, yields and costs were studied, as well as the
processing of by-products. The possibilities for the agro-processing of
each crop were outlined. The reference point always borne in mind was
the international market for the processed product. That is: when is the
agro-processing of a particular drop regarded as competitive, faced with
the most competitive markets known ? If it is not competitive, how can
it be made competitive ? Determining this agro-processing potential by
crop took as references two main objectives:
i.
To extract the maximum value added per crop, in a
competitive manner;
ii.
To expand the market for the crop, and reward it better.
Scenarios were drawn up that would determine the pre-viability of
private investment in agro-processing in the Limpopo Valley and thus
projects were defined to be recommended for seeking out/encouraging
investors.
6.3
TERRITORY COVERED BY THE STUDY
Gaza province
Inhambane province
Maputo province
__________________________________________________
Main Report
___________________________________________________________ 54
__
Gaza, Inhambane and Maputo provinces were covered - Maputo not because it
is within the Limpopo Valley, but because Maputo City is the market par
excellence of the products produced in the Valley, and because it has agroprocessing units, such as the Inacio de Sousa rice dehusking plant, which take
as their raw materials agricultural products produced in the Valley.
Maputo city, apart from being the main market for Limpopo Valley agricultural
produce, is also the corridor through which markets such as South Africa can be
reached.
The places shown in Table 2.23 were visited, in line with what they represent in
terms of agricultural production and the agro-processing industry in the
Limpopo Valley
Table 2.23 Places visited for the agroprocessing industry
Gaza
Inhambane
Maputo province
6.4
Xai-Xai;
Chokwé city
Conhane;
Chilembene;
Lionde;
Macia.
1. Maxixe city
2. Inhambane city
3. Palmeira
CROPS STUDIED
The criteria followed for selecting crops, the agro-processing of which was the
object of the current study were as follows:
Crops suggested by the study's TORs;
Crops confirmed statistically as having productive potential that could
make agro-processing profitable;
Crops favoured by agro-climatic conditions for agricultural production
within the Valley perimeter;
Crops that can be processed in the processing units already established
within or along the perimeter of the Valley.
Thus the following crops were dealt with in a context of agro-processing:
__________________________________________________
Main Report
___________________________________________________________ 55
__
Rice;
1.
Tomato;
Potato;
Onion
Vegetables
Cabbage,
Lecture
Cashew nuts
Cassava
Tangerine
Mango
Copra
Paw-Paw
Banana
Fruit
6.5
POTENTIAL
SECTOR
OF
THE
AGRO-INDUSTRIAL
PROCESSING
As described above, the Limpopo Valley has a range of characteristics which,
added to a series of large scale private and public initiatives, presents an
environment that is favourable, and has great potential, for the development of
the agricultural sector and for agro-industry. These characteristics and
initiatives can be summarised as follows:
The presence of anchor projects in other sectors of activity, at the start
of implementation, or close to this stage: "Corridor Sands"; "Limpopo
National Park"; "Massingir Dam".
The Limpopo Valley is also crossed by two major infrastructure projects
which, in the medium to long term, will bring important benefits for the
development of the Valley: the high tension power line to Inhambane,
and the Pande gas pipeline;
__________________________________________________
Main Report
___________________________________________________________ 56
__
Proximity to Maputo city and its infrastructures; port, airport, railways,
the N4 road to South Africa, public and private services, and the centre
of political and administrative power, which is still highly centralised in
Mozambique;
Easy access to the northern and central provinces of Mozambique, to
South Africa, to Zimbabwe and to Swaziland;
Availability in the province of: hydraulic infrastructures; vast areas with
irrigation potential (current irrigated area - 50,427 hectares; medium
term - 75,800 hectares; long term - 150,000 hectares); water in
abundance in the urban areas and the areas with greatest agricultural
potential; electricity in the main settlements; fixed and mobile
telecommunications; road network in reasonable condition, and with the
major stretches tarred; Limpopo Railway in Gaza province functioning.
Good agro-climatic conditions, which makes it possible to grow more
than 40 crops, with strong competitive advantages, duly adapted to the
terrain (fruit trees along the coast from Bilene to Inhambane; rice in
Chokwe, Xai-Xai and Massingir; vegetables in Chokwe etc.)
Tradition of high levels of production of a variety of important crops
such as vegetables (tomatoes, cabbage, water-melons, lettuce,
pumpkins), food crops (groundnuts, sweet potatoes, jugo beans,
nhemba beans, maize, cassava, millet), cash crops (rice), fruit trees
(cashews, tangerines, mangoes, coconuts, oranges, mafurra oilseeds).
Some of these crops already have good levels of competitiveness and
great potential, notably: Rice, sweet potatoes, nhemba beans,
tomatoes, pumpkins, tangerines, coconuts, mangoes, cashews;
Current levels of livestock production and recent performance that
indicate the excellent potential of this sector: Beef cattle
(150,000/180,000 head); sheep and goats (over 300,000 head, though
the figure oscillates greatly from source to source), and pigs (over
100,000 head);
Existence of know-how on the part of local businessmen, workers
(former workers of the flourishing industry which once existed in the
Valley, and on good farms and projects funded by donors or NGOs) and
staff in public bodies linked to agriculture (SIREMO; HICEP, INIA;
Provincial Directorates).
Existence of agro-industries that are already operating: the Copra
Industry in Maxixe and Inhambane (5 factories producing oil, and one of
them undertaking investments to produce laundry soap, toilet soap and
grated coconut); meat derivatives industry in Chokwe (5 tonnes a day
of boiled and smoked beef and pork products), with a slaughterhouse
for 60 cows a day and 50 pigs a day; rice dehusking industry (Orli and
Inacio de Sousa, with a capacity of around 4 tonnes an hour of paddy
rice).
Major installed agro-industrial capacity, and ready to function on private
initiative, as soon as the raw material exists: Cashew in Xai-Xai
__________________________________________________
Main Report
___________________________________________________________ 57
__
("MOCITA" - 40 tonnes a day), and in Macia ("Macia Castanha de
Mocambique" - 4 tonnes a day); Rice in Chibuto (4 tonnes per hour of
paddy rice); Seeds (SEMOC - capacity for 20,000 tonnes a year).
There is a national market for most of the crops and livestock, which in
itself can make viable the first agro-industrial units to appear producing
for the market, which is currently supplied by South Africa and
Swaziland;
There is a strong potential for exports to South Africa, other
neighbouring countries, and other international markets, (making use,
in particular, of the commercial agreements with the USA and the EU),
of the following raw materials (and of some products processed from
them): Rice; coconuts; cashew; sunflower; tomatoes; dried beans;
mangoes; pineapples; bananas; grapefruit; tangerines.
6.6
CONSTRAINTS ON THE AGRO-INDUSTRIAL PROCESSING SECTOR
The main constraints which explain the current reduced economic activity are,
without any doubt, the following:
Lack of coordination of public policies with a direct or indirect influence
on agricultural and agro-industrial activity:
Support for agriculture granted late, and allocated according to
criteria that are difficult to understand (e.g.: farmers who do not
return the money for one campaign, again have access to credit
in subsequent campaigns, without returning what they already
owe)
Water has also been made available late
Absence of tax and customs inspection
Strong parallel economy which discourages businessmen from
going into debt and from restoring their production (this activity
even takes on patterns of acceptance and encouragement by the
state. There is even an association of the parallel businessmen
which the state consults. At the frontier with Swaziland, there
are always full of local people paid to cross the border and
undertake small purchases for businessmen on the Mozambican
side)
Poor investment by the state in "R & D", which is a determinant
factor for the competitiveness of the agricultural sector;
Lack of tax incentives or reduced interest rates offered by the state in
accordance with the performance of economic agents;
Lack of belief in public policies and in the central state actors
implementing them. The economic agents do not believe in the
__________________________________________________
Main Report
___________________________________________________________ 58
__
capacity of the state to intervene in managing public policies and
making them operational;
Poor supply of agricultural machinery services: these are scarce and
expensive;
Agricultural inputs not available locally, and on time, and sold by
economic agents at grossly inflated prices, which they seem to have
fixed among themselves;
Poor supply of technical services: extensionists, agricultural technicians,
consultancy in management and marketing;
Difficult access to credit (the financial sector refuses to finance
agriculture, because of the activity's risk, and because of the
impossibility of farmers providing acceptable guarantees), and interest
rates that are completely intolerable for any economic activity (about
40%);
Non-existence or shortage of raw materials;
Poor quality of cashew nuts;
The difficulties faced by many of the existing industrial units and
farmers in the business sector of restoring their productive capacity
with new financing,
while they are still
Graph 2.8: Rice production in the
burdened
with
Limpopo Valley
debts
contracted
before the floods of
120.000
2000;
100.000
The available labour
is poorly qualified,
poorly
motivated
and has lost the
feeling that they
are
"industrial
professionals".
Production
Volumes and
areas
80.000
60.000
40.000
20.000
0
Macia
Xai-Xai
Zones of Production
Production area (Ha)
Production per hectare
Maximum potential (ton/year)
6.7
IMPLICATIONS FOR THE SELECTED PROJECTS
Since it is fundamental in the context of agro-processing, for each crop we shall
present scenarios for the agricultural potential in the Valley, and we shall follow
this by presenting the capacities - installed and current - for processing this
crop in the vicinity of the valley. We shall then present the limits of agroprocessing imposed by agro-climatic factors. A profound analysis of the critical
viability factors will lead to a recommendation on the projects to be adopted for
subsequent treatment, seeking to stimulate the flow of investment - domestic
__________________________________________________
Main Report
___________________________________________________________ 59
__
and foreign - both for rehabilitation/modernisation, and for entirely new
undertakings, with the purpose of exploiting to the full this potential, looking to
the domestic market, to the regional market, and even to the international
market.
RICE:AGRICULTURAL POTENTIAL VS. AGRO-PROCESSING POTENTIAL: THE
VIABILITY OF THE RICE PROCESSING INDUSTRIES
There are four pockets of rice production in the Valley: Chokwe (16,000 ha);
Macia (7,000 ha); Xai-Xai (3,000 ha) and Manjacaze (3,000 ha). From the data
in this table, one can estimate at 116,000 tonnes/year the potential of rice
production
in
the
Valley, for an available
area of about 30,000
hectares,
and
an
average yield of 4
tonnes/ha.
According
to
the
data
on
irrigation potential, it is
possible to mobilise at
least another 30,000
irrigated hectares in
the Massingir lowlands,
benefiting from the
rehabilitation of the
Massingir dam. Thus
the
potential
rice
production
in
the
Valley could double in a period of 2-3 years.
However, of this enormous potential for rice production, the data for production
from the 2000/2001 campaign, even taking into account all the effort made to
rehabilitate the irrigation scheme, points to less that 5,500 tonnes, grown on
about 2,500 hectares (average yield is 2.3 tonnes per hectare, although there
are references to cases where production reached 5-6 tonnes/hectare in the
2001/02 campaign).
From the data on the above table - extracted from the visits, interviews and
consultations undertaken - one concludes that the total installed rice dehusking
capacity in the perimeter of the Limpopo Valley is about 45,000 tonnes/year. or
about 30% of the potential capacity for agricultural production, without
including Massingir. However, the dehusking capacity currently used is much
less, mainly because:
SORGAZA is completely paralysed. It was fully rehabilitated in 1998,
but was submerged during the floods of 2000;
The Conhane factory is completely paralysed. It needs investment for
the total rehabilitation of the dehusking line and of the silos;
__________________________________________________
Main Report
___________________________________________________________ 60
__
The Chibuto factory has been paralysed since about 1991, and the current state
of its equipment is unknown. It was rehabilitated in the late 1980s, but it can
be imagined that it is weak in terms of modern technology. From comparing
these two graphs, one may draw the following conclusions:
At current levels of use of the Limpopo Valley's agricultural potential, the rice
dehusking units located on the perimeter of the valley - which, as mentioned
above, would not absorb even 30% of the potential rice production - currently
do not have enough raw material to work at more than 105 of installed
capacity.
Technological modernisation should be definitively considered in order, not only
to guarantee minimum losses during dehusking, but also to ensure the
processing of by-products, extracting the maximum possible value added from
the rice.
Box: In the Limpopo Valley, within the - unavoidable and urgent - context of
relaunching rice production in a sustainable and competitive manner, there is
relevant room for investments in the industries to process rice and its byproducts, as long as this processing is undertaken in effective and competitive
ways, so as to guarantee the competitiveness of the rice chain.
THE MAIN FOUNDATIONS FOR MAKING A RICE PROCESSING INDUSTRY
VIABLE:
OPTIMUM LOCATION: As far as we are concerned, it is not the centres of
consumption, but the centres of production of raw material, which are also
centres for consumption of by-products, which provide the best location for a
rice processing unit;
NECESSARY INFRASTRUCTURES: Without doubt, electrical power is a heavy
factor in the profitability of a rice processing industry. Access roads to supply
the raw material, and distribute the final product are of great importance in
making a rice processing industry viable.
PRODUCTS EXTRACTED FROM RICE PROCESSING: Solid viability studies
should precede the decision on investments to be made. The diversity of
products to be extracted should be subject to careful assessment in order to
guarantee the returns expected by the investors. However, apart from the
classical products extracted from rice, there is a greater diversity of other
products, some with much greater commercial value.
__________________________________________________
Main Report
___________________________________________________________ 61
__
ITEM
PRODUCT
OBTAINED
RAW
MATERIAL
%/1Kg
HUSKED
RICE
APPLICATION
MARKET
1
Whole rice
Husked rice
52%
Human food
SADC
2
Broken rice
Husked rice
15%
Human
food/animal
food
Mozambican
3
Rice bran
Rice grain
2%
Animal food
Mozambican
4
Oils rice
Rice grain
6%
Human food
International
5
Plaster-broad
Rice straw
Construction
and furniture
International
6
Boards
Rice husks
Construction
and furniture
International
20%
OPTIMAL SIZE AND TECHNOLOGY: There are several high-yielding
technological options in the world. The principle for selecting the technology has
to do with the final product one wishes to obtain, that is:
Two stages of whitening: less refinement of the final quality;
Three stages of whitening: more refinement of the final quality.
In terms of processing capacity (by which we here mean whitening the rice),
there is a vast range, which could province:
250 kg/H to 1,000 kg/H, for small diesel-operated units - machines for a
single passage - at prices which may vary from US$ 8,000 to US$
20,000, depending on how robust the motor and the equipment are;
100 to 300 tonnes/day, for major processing industries, at costs which
may vary from US$ 60,000 to over US$ 1.5 million, depending greatly
on the origin of the equipment.
Technically, the greater the processing capacity, the higher the yields tend to
be, but also the greater the demand for raw material and for management
capacity.
__________________________________________________
Main Report
___________________________________________________________ 62
__
PART III. STRATEGY
P
PR
RO
ND
OM
DU
MO
US
OT
ST
TIIO
TR
RIIA
ON
NO
AL
LP
OF
FA
PR
RO
AG
OC
GR
CE
RO
ES
O--IIN
SS
SIIN
NG
G
__________________________________________________
Main Report
___________________________________________________________ 63
__
7 PUBLIC INVESTMENT TO IMPROVE THE CONDITIONS FOR PRIVATE
INVESTMENT
The following measures are part of a long term strategy, managed along
business lines, less subject to market oscillations, more flexible, and of great
national added value, unlike the strategies that rest on short term competitive
advantages and on price factors.
Create a "harvest insurance" in partnership with the relevant entities,
place it on the market, but pay part of the re-insurance, or set up a
Guarantee Fund, to reduce the cost to the producer;
Creation of a "Limpopo Valley" Certificate of Origin;
Set up a Rural Development Company with the following characteristics
and objectives:
Characteristics (commercial company; shares held by the state;
associations or companies that manage the irrigation systems;
associations of peasant farmers; associations of commercial farmers;
associations of agro-industrial businesses; Limpopo Valley Corridor;
financial institutions; body that represents research; no single
shareholder should have a majority of the capital; private management).
Objectives 1. - Create and manage "Limpopo Valley" brands; 2 - Set up
and manage a modern laboratory; 3 - Create a "Limpopo Valley"
Certificate of Origin", necessary regulations, handle and inspect
permanent compliance; 4 - create certification of organic or ecological
produce - Set up a GAE, Business Support Office, in take-off and
operation, which deals with and provides information on all the
bureaucratic aspects, which centralises collection of and research into all
manner of information on technologies, markets, prices etc.; 9 - Set up
and manage a Professional Training Centre for agriculture and agroindustry; 7 - Provide extension services to peasant farmers and small
scale businessmen.
Revenue: Annual registration as the "Limpopo Valley" company; services
provided to economic agents; part of the VAT, Corporation Tax and other
taxes collected from commercial companies and service providers
registered as processing or marketing "Limpopo Valley" products, which
would be handed over directly by the taxpayers to this company, based
on a specific appendix to tax declarations (e.g.: that they have move
than 50% of their business volume with these products).
To set up an Investment Company with the following objectives and
characteristics:
Characteristics: shares held by the previous company (with management
control), financial institutions, promotion funds, donors, and quoted on
the stock exchange so as to attract all types of national and foreign
investors; private management.
__________________________________________________
Main Report
___________________________________________________________ 64
__
Objectives: to finance agriculture and agro-industry at reduced interest
rates (in accordance with the strategic priorities; quality of products;
excellence in management; type of investments - research,
modernisation, improvements in quality, environmental, productive); to
carry out viability and credit analysis studies; to place loans at premium.
Revenue: Services and interest
Set up a "Task Force" to increase the efficiency of customs control
Set up a "Task Force" to increase the efficiency of inspecting economic
activities (to verify registration for tax purposes, permits, licences etc.)
Concentrate powers in a single member of the Government to clear away
bureaucratic obstacles from access and dispatch in the other ministries
and public institutes.
Establish Tax Benefits: Reduce VAT and Corporation Tax rates, and
provide exemptions from customs duties for previously listed capital
goods or productive factors, in the first 3 years of activity of companies
that process or market "Limpopo Valley" products or provide services
(hire of machinery; maintenance; suppliers of agricultural chemicals;
transporters of merchandise; consultants; auditors; accountants;
hotels/restaurants). Set criteria on the basis of strategic priorities,
quality of products/services, excellence in management, effective
investment.
The state may, in partnership with the private sector, use the
establishment of food reserves, as a way of reducing the financial costs
of agro-industry and agriculture (the state acquires and/or receives
foreign aid for food security, which will be stored and conserved by the
private sector, without costs for the state. The private sector uses these
stocks, under rigidly established rules monitored by the state, as a way
of not having to invest right at the start in acquiring raw materials and
occupying its productive capacity to the full without having to wait for the
relaunching of agriculture).
Investment in "R & D" and in extension services for the peasant sector:
Strengthen the budget and human resources of INIA and other bodies
linked to R & D, giving them the conditions to play the determinant role
in the sustainable development of the Limpopo Valley.
Strengthen
investments
infrastructures
in
recovering
agricultural
hydraulic
Education Investment Plan: the existence of professional schools and
polytechnic education is essential, but also increase the level of literacy
among farmers and the public at large. This is the determinant factor for
sustainable economic development.
Health Investment Plan
__________________________________________________
Main Report
___________________________________________________________ 65
__
Investment plan for improvements in infrastructures, mainly outside the
cities.
8 ANCHOR PROJECTS IDENTIFIED AND DEVELOPED
8.1
ANCHOR PROJECTS IDENTIFIED
Table 3.1 Anchor projects identified
Sector
Description
Recovery of the "Conhane Factory"
Rice Industry
1st Phase: Promotion; Extension; Processing and storing the rice
2nd phase: Production of plasterboards from rice straw; Use of
the silos for the country's food reserve.
Industry of fruit and
1st Phase
vegetable juices,
Agricultural production in partnership with farmers
concentrates, jams,
Production of tomato paste
canned and frozen
Production of concentrates, juices, canned goods, fruit and
goods
vegetable jams
2nd Phase
Frozen potatoes and mixed vegetables
Pre-cooked meals, and canned vegetables and meat
Integrated
production and manufacturing; promotion/partnership,
Coconut
products
extension,
processing
of coconuts and derivatives
factory
Extension and promotion
Packaging
and
Acquisition,
selection,
washing,
calibrating,
preparation,
marketing vegetables,
packaging, labelling, storage, refrigeration
fruit and meat
Market with Commercial Agents who buy from the farmer,
accompany
the respective processing and sell wholesale.
Cashew
processing Two integrated units (production and processing, with mutual
factory
shareholdings); Promotion, extension, processing the nuts,
production of spirit and wine from the false cashew fruit.
Acquisition of raw material: rice bran with the oil removed;
Animal feed industry
coconut bagasse; maize
Processing, Packaging, storage
Edible oil industry
Acquisition of raw material: Rice bran, soya, dried mafurra seed,
maize, Processing by solvent, packaging and storage.
Promotion, extension and processing or rice seeds and others.
Seeds Industry
Wholesale purchase and marketing of chemical and agro-chemicals,
Agricultural Services
mixing and packaging, services to hire agricultural tools,
extension services
Sector
Description (Opportunities with great potential to be
studied more deeply)
Cattle fattening unit
Promotion, extension and intensive fattening, purifying the breed
Meat Industry
Slaughterhouse,
packaged
and
classified
fresh
meat, various cattle and pork derivatives
Dairy produce
Factory for milk and dairy products
industry
Tanning
and Extension and tanning of hides
__________________________________________________
Main Report
___________________________________________________________ 66
__
button industry
Pig breeding unit
8.2
Making buttons from hooves
Intensive
production
cycle"
of
pigs
in
"closed
ANCHOR PROJECTS DEVELOPED
Table 3.2: Anchor projects developed
DESCRIPTION
TIPOLOGY
PONTO SITUAÇÃO
Rice Processing factory
Recovery
Ready Pre-feasibility
Investors identified
Vegetable and
fruit processing industry
(concentrates, juices, frozen goods)
Recovery
Ready pre-feasibility
Investors identified
Coconut processing industry
Creation
Ready pre-feasibility
Investors identified
Vegetable and fruit processing
Creation
Project file
Investors identified
Centre
Company
to
provide
services
in
mechanisation,
extension
and
marketing
of productive factors
Creation
Project file
8.3
MAIN RESULTS OF THE 3 PRE-VIABILITY STUDIES
The
three
pre-viability
studies
anchor projects are the following;
selected
among
the
5
identified
1)
"Rice
processing
factory:
Recovery,
modernisation
product diversification of the Conhane factory"
and
2)
"Factory for processing tomato paste, canned vegetables, and
fruit juice concentrates: Recovery, modernisation and product
diversification of the Chilembene factory"
5
The basic elements of pre-viability presented here should be deepened through
subsequent market studies, and technical and economic viability studies.
__________________________________________________
Main Report
___________________________________________________________ 67
__
3)
"Integrated processing factory of coconut derivatives
Construction of a new factory in Inhambane/Maxixe".
-
9 PRE-VIABILITY ASSESSMENTS FOR THREE PROJECTS
9.1
PROJECT 1: RECOVERY OF THE CONHANE RICE PROCESSING
FACTORY
The main reasons for choosing the Conhane rice project as one of the anchor
projects for CL agro-industry are the following:
Optimal location, since this is a zone of intensive rice production, it is easily
accessible, and possesses infrastructures such as good roads, and water and
electricity supplies;
Availability of a shareholding structure that brings together a range of
stakeholders in the rice chain: Members of the producers' association
(AGRIGAZA), Producers and Traders;
It can play an important role in encouraging rice production, serving as a
bridge between the funding agencies and the producers, and absorbing their
production;
With its previously installed capacity of 12,000 tonnes/year, the Conhane
factory was already the largest unit of the kind in Chokwe district; once
rehabilitated and modernised, it could play a crucial role in processing the
rice produced in the region;
There are already advanced studies for its rehabilitation, including a
complete rehabilitation/modernisation project (to 13,550 tonnes/year),
including a study on the use of by-products;
It is one of the productive units that most needs support in terms of access
to funding, because of its long paralysis, worsened by the floods of 2000;
It possesses a complex of silos with a capacity of 10,000 tonnes. These are
the only ones in the area, and there is the possibility of storing food reserves
there.
SHORT PRESENTATION (for a more detailed presentation see Appendix 2)
__________________________________________________
Main Report
___________________________________________________________ 68
__
Table 3.3. PROJECT 1: Recovery of the Conhane rice processing factory
Products/
Strong points
By-products
1st Phase
Valuing traditional aromatic varieties
Top grade Indian
rice
Introduction of new aromatic varieties highly valued on
the
international market (similar to "Basmati")
Top
grade
Aromatic
rice
Broken rice
Rice bran
Installation of modern Thai technology with a high
industrial yield
2nd Phase
Plasterboards of
rice straw for
the construction
sector
Possible use of
by-products:
Oil removed
from the rice
bran
Livestock feed
Boards and
blocks made
from rice husks
High yields per hectare achieved with the strategy
proposed
The agricultural strategy is viable since it is centred on
2 areas:
Commercial sector: with the capacity to obtain in the
short term average yields of 4-6 tonnes per hectare;
essentially Indian varieties (more than 4 tonnes/hectare
each), reliance on mechanisation and adequate use of agrochemicals;
Family sector and other businesses: producing
essentially aromatic varieties (with extension; with promotion,
with branding; with less need to obtain price competitiveness,
since this is a niche market, and less sensitive to the price
factor)
Competitiveness in relation to imported rice and other
Mozambican rice, achieved with a reasonable safety margin
(although starting from the principle that in terms of
agricultural production, the businessmen will have agricultural
equipment and agro-chemicals available at more competitive
prices, apart from the indispensable extension and promotion,
the assumption for the pre-viability study was that it would
take five years to obtain yields of 5.3 tonnes per hectare in
the commercial sector, and 2.6 tonnes per hectare in the
family sector and small businesses).
Other potential in order to diversify and value national
raw material:
Rice oil is highly prized on the market
Rice straw plasterboards are highly ecological products
__________________________________________________
Main Report
Other
important
Data
Investors
interested with
studies already
done to recover
the
Conhane
Factory, and in a
phase
2nd
recovery of the
Silos
for
the
food
reserve,
and introduction
of the sector
making
rice
straw
plasterboards.
___________________________________________________________ 69
__
COSTS AND BENEFITS
7$%/(&267$1'%(1(),76)25&21+$1(5,&(352&(66,1*)$&725<
&2676
%(1(),76
The raw material is acquired from the producer at
prices resulting from implementing measures laid down in
the "Draft Report" of the Agricultural Sector Diagnosis and
Strategy. The assumptions used are perfectly feasible, and
in the simulation presented, full achievement of the
productivity of the family sector and the small businesses
forecast there (4.5 tonnes/hectare) was not taken into
consideration, but only 2.6 tonnes/hectare, and only in
year five of the project (that is, 6/7 years from now).
Although the long term strategy should
follow a line of differentiating the final
product (brand, quality and aromatic
variety), with much better margins, it was
only considered that the aromatic varieties
would start with a weight of 2.5% of the
company's sales, and would reach 7.6% in
year 5;
Since new equipment with current technology will be
acquired, obtaining industrial yields at the level of the best
world producers (67%) was considered. It was also
projected that the factory will start with an 80% efficiency
in year one, advancing to 90% in year 2, and 95% in the
following years.
Although all the factors necessary to
obtain a quality product were considered in
the investment and the costs, sales prices
were considered that are competitive with
lesser quality imported rice (25% broken)
The capacity of the market to absorb
the production of this unit (quantity) is not
The provision of services, third party suppliers, a problem, if we take the following
staff costs, depreciation of equipment have been indicators into account:
exhaustively quantified at market prices (including
multi-risk insurance, work accidents, stock, 2% - Mozambique imports more than 180,000
maintenance and conservation on the initial value of tonnes a year of dehusked rice;
the investment, advertising and others), as can be - South Africa imports more than 530,000
noted in the respective tables.
tonnes/year (mostly whitened);
The staff costs envisage wages of 150 USD a
month for workers and administrative staff, which
shows a concern to value this profession, and to
obtain motivation, productivity and efficiency - that is
it does not try to obtain competitiveness at the cost
of factors that are not sustainable in the medium to
long term. Also envisaged are contracting 1 General
Manager, 1 Financial Manager, 1 Commercial
Manager, and 1 Production Manager, with monthly
wages of 1,200 to 1,500 USD, and 2 extensionists (1
senior paid 800 USD/month, and 1 junior at 450
USD/month).
- The neighbouring countries import more
than 650,000 tonnes/year;
The current productive capacity of
Mozambique is no higher than 100,000
tonnes/year.
The by-products of broken rice and bran
are quantified at Mozambican market
prices, with a descending evolution deriving
from the ever greater competitiveness of
agricultural production. Broken rice is a
particularly prized by-product on the
market. Bran is a by-product that
national
Under the heading of financial costs of operations
may
be
increasingly valued with the
are envisaged costs derived from the integral
development
of the livestock sector.
promotion of the rice production necessary for the
factory (at a rate of 15% on the value of the
purchases).
__________________________________________________
Main Report
___________________________________________________________ 70
__
Table 3.5 Rice sale price, October 2002
SALES PRICE
VARIETY
Indian
Fragrant/
Aromatic
1ST grade "Limpopo Valley" Rice
Scenario 1 - Cautious
FOB VIETNAM 25%
25-10-2002
168 USD(1)
Year 1: 212 USD/Tonne(3)
Year 2/3/4/5: 239 USD/Ton(3)
Scenario 2 – Realistic
FOB VIETNAM 25%
25-10-2002
168 USD (1)
Year 1: 239 USD/Tonne (4)
Year
2:
2/3/4/5:
252
USD/Tonne (3)
“FOB BASMATI INDIA”
25-10-2002
680 USD(2)
Year 1: 708 USD/Tonne
Year 2: 626 USD/Tonne
Year 3/4/5: 529 USD/Tonne
POB BASMATIC INDIA (4)
25-10-2002
680 USD (2)
Year 1: 708 USD/Tonne
Year 2: 626 USD/Tonne
Year 3/4/5: 529 USD/Tonne
Notes:
1.
2.
3.
4.
5.
Added cost to the FOB price until reaching the importing wholesaler: 97.5 in the Indian variety
Added cost to the FOB price until reaching the importing wholesaler: 149.6 in the aromatic variety
In year 1, the product enters the market at 20% below the cost of imported rice, in Year 2 and the
following years it is always placed at 10% below.
In year 1, the product enters the market at 10% below the cost of imported rice, in Year 2 and the
following years it is always placed at 5% below.
It has been assumed that international prices will remain stable over the five years of the study (they fall
in real terms).
Table 3.6: Paddy rice – Estimated price paid to the farmer
PRICE PAID TO THE FARMER (1)
VARIETY
"Limpopo Valley" paddy rice
Scenario 1
Scenario 2
Indian
ESTIMATED HARVEST PRICE
Year 1: 72 USD/Tonne
Year 2: 69 USD/Tonne
Year 3/4/5: 63 USD/Tonne
ESTIMATED HARVEST PRICE
Year 1: 72 USD/Tonne
Year 2: 69 USD/Tonne
Year 3/4/5: 63 USD/Tonne
Fragrant/Aromatic
ESTIMATED HARVEST PRICE
Year 1: 201 USD/Tonne
Year 2: 183 USD/Tonne
Year 3/4/5: 152 USD/Tonne
ESTIMATED HARVEST PRICE
Year 1: 201 USD/Tonne
Year 2: 193 USD/Tonne
Year 3/4/5: 152 USD/Tonne
Note: These prices allow the farmer to obtain the income adequate for sustaining his business (paying market interest rates), after implementation
of the measures proposed in the agricultural sector Draft Report, the effects of which in reducing the costs of production will make it possible to
increase the profitability, competitiveness and sustainability of the entire harvest.
__________________________________________________
Main Report
___________________________________________________________ 71
__
SUMMARY OF PRE-VIABILITY INDICATORS
Table 3.7: Summary of pre-viability indicators for Project 1 Conhane rice processing factory
I
N
D
I
C
A
T
O
R
S
SCENARIO 1 – Cautious
Investment needed
1 322 102$00 USD
Break-even year
Year 3
"Break-Even"
2 001 321$00 USD
Sales in Break-even year
1 718 140$00 USD
Time to recover investment
59 months
IRR
14,84 %
NPV
53 045$00 USD
SCENARIO 2 – Realistic
I
N
D
I
C
A
T
O
R
S
Investment needed
1 333 125$00 USD
Break-even year
"Break-Even"
Year 3
1 646752 983$00 USD
Sales in Break-even year
Time to recover investment
1 797 277$00 USD
54 months
IRR
22,97 %
NPV
267 775$00 USD
CONCLUSIONS ON PROJECT 1
From analysing the economic and financial indicators of profitability, one notes
that the "project for the recovery, modernisation and project diversification of
the Conhane rice dehusking factory" is technically, economically and financially
viable (in terms of pre-viability).
The precautions taken in the assumptions used, and sensibility analysis made of
the project's critical parameters, give it a very reasonable safety margin, and
significantly reduce the project risk. For purposes of pre-viability, the net
benefits arising from processing of the products in the 2nd phase, which will
bring much greater value added to the project, were not taken into account.
These conclusions will be real to the extent that the constraints identified in
general terms on the agricultural sector and on agro-industry are overcome. In
the Draft Report on the "Diagnosis and Strategy Advocated", suggestions are
made for solving a significant part of these constraints in terms of private
initiative.
__________________________________________________
Main Report
___________________________________________________________ 72
__
In the investment and costs forecast, measures and the respective resources for
ensuring the supply of raw material, which has been one of the main constraints
on the factories already established, are safeguarded.
PROJECT 2: CHILEMBENE PROCESSING FACTORY -TOMATOES,
TINNED VEGETABLES AND FRUIT JUICE CONCENTRATES
SHORT PRESENTATION (for a more detailed presentation see Appendix 3)
Table 3.8: Project 2 - Chilembene processing factory (short presentation)
Products/by-products
Tomato paste, peeled tomatoes,
tomato juice
Potatoes and mixed vegetables
(frozen)
Tinned pre-cooked vegetables
(dried or green beans; peas,
maize)
Juices, concentrates and jams
(pineapple, paw-paw, mango,
grapefruit, guava, passion fruit,
orange)
Pre-cooked meals (bean stew,
tripe, peas with eggs and
sausages etc)
Strong points
Absorbs surplus
Adds value to lesser quality products
Encourages farmers because it
guarantees a market for their
agricultural produce
Activity is not totally dependent on
the tomato harvest, because it relies
on diversification
It relies on its own "Limpopo Valley"
brand
Food reserve
Other
Important
Data
Total
recovery of
the existing
unit
(e.g.
"Lomaco
Factory")
Young work
force
with
know-how is
still available
at the site
(chiefs)
The following, among others, are the reasons that justify the choice of this
project as one of the anchor projects for agro-industry in the context of the
Limpopo Valley study:
There is real availability of raw materials in the area of the factory;
There is potential for diversifying production into: tomato, mango, paw-paw,
orange, passion fruit and particularly pineapple juices/concentrates; tinned
peas, beans, canned fruit in syrup, etc. This diversification is subject to
deeper technical, economic and market studies, not considered in this study;
The factory may act as a factor stimulating the production of tomatoes and
other crops to be processed. It would immediately reduce the vulnerability of
the tomato produced in Chokwe to the market for fresh tomatoes, and would
guarantee its purchase at competitive prices. The factory can also use the
__________________________________________________
Main Report
___________________________________________________________ 73
__
tomatoes rejected by the market for fresh tomatoes as raw material for its
production;
Judging from the visit made to the site, the factory infrastructure seems
intact;
A well-designed investment strategy, linked to a solid market study, would
have to ensure the technological appropriateness of the factory product,
placing it on the national and international market. This may involve strong
marketing of its own brand name - "Limpopo Valley", for example - or the
adoption of a stronger brand name on the market, in a partnership regime to
be defined.
The relaunching of the factory could re-create about 80 jobs, the maximum
number reached in the past.
The general lines of this project are;
Regardless of the brand name option adopted - own brand, or other - it
seems to us reasonable to include in the project a laboratory for certification
of quality and origin. The question of the tutelage, ownership and
management of this type of laboratory is a matter to be gone into more
deeply, but it would not be restricted to the control and certification of
tomatoes, but would extend to other crops and produce processed/produced
in the valley.
Based on the pre-assessment of the viability of the Chilembene factory,
guaranteed with the tomato paste, a product already tested and available,
advance with attracting potential investors who may be prepared to consider
the subsequent stages.
Based on a market study (funding envisaged in the calculations presented
here) on the products of greatest yield that will be processed, either from
tomatoes or from other crops, define the optimal products to be processed
and those to be extracted and the ideal size of the additional production
lines.
Design of an agricultural component which, using the factory's 600 hectares
and other irrigated areas, ensures the interested involvement of the local
producers in producing raw material and supplying the factory. This is
important to free the factory managers from agricultural management,
without putting at risk the flow and the quality of the raw material. The
acquisition of the machinery needed to serve all 600 hectares (whether
those that are currently the property of the factory, or others), the hiring of
3 extensionists and the financial costs of promotion, are envisaged in the
simulations presented.
Design of the mechanisms for a partnership (shareholding or simply
commercial) and for financing the rehabilitation/modernisation of the factory
and marketing its produce.
The project can be rapidly implemented, it has a guaranteed market
(Mozambique currently imports more tomato paste than is necessary to be
__________________________________________________
Main Report
___________________________________________________________ 74
__
sold to make the factory viable), it will have a great impact on the
economy of the region and of the country (the country needs to create
more value added from its own natural riches), and it will generate jobs
directly and indirectly (making people stay in the area and improving their
standard of living).
COSTS AND BENEFITS
7$%/(&2676$1'%(1(),76)25&+,/(0%(1(720$72352&(66,1*)$&725<
&2676
%(1(),76
Since new equipment with current technology will
be acquired, obtaining industrial yields at the level of
the best world producers (20% paste for each kilo of
fresh tomato) was considered. It was also projected
that the factory will start with a 90% efficiency in year
one, advancing to 95% in year 2, and 100% in the
following years, since there are skilled workers who
are still in the area who are able to produce
efficiently.
Although the long term strategy should
follow a line of differentiating the final product
(processing other vegetables and fruits, brand,
quality), with much better margins, only the
tomato paste product was taken into account,
since it is believed that this the product that
must guarantee the viability of the factory,
since there already exists abundant raw
material.
There is no problem with the capacity of
The costs of staff (see appended production file),
fuel, maintenance and conservation, insurance, the market to absorb the tomato paste
depreciation etc include the extensionists necessary produced by this unit (quantity), if we take the
for the production on the factory's own land, or other following indicators into account:
land, of the tomatoes needed.
- Mozambique imports more than 10,750
The provision of services, third party suppliers, tonnes/year of tomato paste;
staff costs, depreciation of equipment have been
- South Africa imports more than 1,560
exhaustively quantified at market prices (including
tonnes/year of tomato paste;
multi-risk insurance, work accidents, stock, 2%
maintenance and conservation on the initial value of - Angola imports more than 5,900 tonnes/year
the investment, advertising and others), as can be of tomato paste, with a trend for this figure to
increase;
noted in the respective tables.
The staff costs envisage wages of 150 USD a
month for workers and administrative staff, which
shows a concern to value this profession, and to
obtain motivation, productivity and efficiency - that is,
it does not try to obtain competitiveness at the cost of
factors that are not sustainable in the medium to long
term. Also envisaged are contracting 1 General
Manager, 1 Financial Manager, 1 Commercial
Manager, and 1 Production Manager, with monthly
wages of 1,200 to 1,500 USD, and 5 extensionists (1
senior paid 1.200 USD/month, and 4 juniors at 800
USD/month).
Under the heading of financial costs of operations
are envisaged costs derived from the integral
promotion of the production of fresh tomatoes needed
for the factory (at a rate of 15% on the value of the
purchases).
- The SADC countries import more than 11,000
tonnes/year of tomato paste;
- Currently over 30,000 tonnes/year of fresh
tomatoes is produced in Gaza, but with
average productivity levels of less than 15
tonnes/hectare (the medium and large
business sector achieves yields of between 25
and 35 tonnes/hectare, and the most efficient
producers in South Africa manage to obtain 60
tonnes/hectare);
- The trend towards improved standards of
living leads to an increase in per capita
consumption of tomato paste (in Mozambique
this is currently estimated at around 0.6
kilos/year per capita; in the USA the figure is
3.3 kilos/year per capita);
- And the processing capacity in the country is
currently "zero".
__________________________________________________
Main Report
___________________________________________________________ 75
__
Table 3.10 Tomato sale price, August 2002
Product
Canned tomato paste (3
and 5 kilo tins, 210 kilo
drums)
Fresh Tomato
SALES PRICE
"Limpopo Valley" Tomato
Scenario 1 – Cautious
Scenario 2 - Realistic
(1)
(1)
Year 1: 810 USD/Tonne
Year 1: 840 USD/Tonne
Year 2 to 5: 818 to 843 USD/Tonne, Year 2 to 5: 848 to 874 USD/Tonne
depending on inflation
depending on inflation.
(2)
(2)
Year 1: 50 USD/Tonne
Year 1: 45 USD/Tonne
Year 2 to 5: 51 to 52 USD/Tonne Year 2 to 5: 45 to 47 USD/Tonne
depending on inflation.
depending on inflation.
Notes:
1.
2.
3.
Prices obtained by reference to the prices in the study "Competir", which are in turn based on the publication "Tomato News", prices of the
USA and Italy (prices CIF Maputo oscillate between 832 and 900 USD/tonne). The prices from China (a major world producer) and Turkey
(www.tomatopaste.cc and www.algy.com/...) were also obtained.
Prices obtained by reference to the prices in the study "Competir" and the average prices in the two seasons at the "Malanga" market for
the sale of fresh tomatoes. In the sales price to the industry, one should take into account savings in the cost of transport and boxing, the
savings in terms of the farmer's time, who can thus devote himself to production, price stability, and the purchase of all the produce (only
the rotten tomatoes are not accepted).
It was considered that international prices will remain stable over the five years of the study, evolving only in accordance with dollar
inflation.
SUMMARY OF PRE-VIABILITY INDICATORS
Table 3.11. Summary of pre-viability indicators for Project 2:
Chilembene processing factory
I
N
D
I
C
A
T
O
R
S
I
N
D
I
C
A
T
O
R
S
SCENARIO 1 – Cautious
Investment needed
%UHDNHYHQ\HDU
3,119, 043 USD
Year 3
"Break-Even"
1,323, 422 USD
Sales in Break-even year
1,784, 767 USD
Time to recover investment
58 months
IRR
15,82 %
NPV
156,662 USD
SCENARIO 2 – Realistic
Investment needed
%UHDNHYHQ\HDU
3,110,442 USD
Year 3
"Break-Even"
1,221,052 USD
Sales in Break-even year
1,850,869 USD
Time to recover investment
55 months
IRR
21,01 %
NPV
437,035 USD
__________________________________________________
Main Report
___________________________________________________________ 76
__
CONCLUSIONS ON PROJECT 2
From analysing the economic and financial indicators of profitability, one notes
that the "project for the recovery modernisation and diversification of the
activity of the - (name) tomato processing factory at Chilembene" is technically,
economically and financially viable (in terms of pre-viability).
The precautions taken in the assumptions used, and sensibility analysis made of
the project's critical parameters, give it a very reasonable safety margin, and
significantly reduce the project risk.
For purposes of pre-viability, the net benefits arising from the processing of
other products, apart from the tomato paste, where viability is already assured,
were not considered: these other products will bring much greater value added
to the project (the products have much better commercial margins, and the
investment and marginal costs are not very significant).
These conclusions will be real to the extent that the constraints identified in
general terms on the agricultural sector and on agro-industry are overcome. In
the Draft Report on the "Diagnosis and Strategy Advocated", suggestions are
made for solving a significant part of these constraints in terms of private
initiative.
In the investment and costs forecast, measures and the respective resources for
ensuring the supply of raw material, which has been one of the main constraints
on the factories already established in other sectors, are safeguarded.
__________________________________________________
Main Report
___________________________________________________________ 77
__
9.3
PROJECT 3: CONSTRUCTION OF
FACTORY IN INHAMBANE/MAXIXE.
A
COCONUT
PRODUCTS
SHORT PRESENTATION (for a more detailed presentation see Appendix 4)
Table 3.12: Project 3 – Construction of a Coconut Products Factory
in Inhambane/Maxixe (short presentation)
Products/byproducts
Crude
oil
copra
Refined copra
oil
Strong points
Allows renewal of trees
Plant hybrid varieties where the
coconuts can be more easily
harvested (dwarf palms)
Margarine
Stabilises the market
Bagasse
Encourages farmers
Laundry soap
Toilet soap
Grated
coconut
Coconut milk
Charcoal
Other important
data
Allows industry
farmers more
to
pay
the
Large amount of value added
Less vulnerability to a single
market
This may encourage
the existing company
"Copromol" which is
operating but only
extracting crude oil
and bagasses, 100%
for export, to which
should be suggested
adjustments
to
guarantee
success:
create more value
added, and integrate
the
agricultural
component
in
partnership with the
family sector.
Fibre
Among the various processing units visited and studied, we recommend the
construction of an integrated factory of coconut derivatives, to be set up in the
Inhambane or Maxixe area, for the following reasons:
This location seems optimal to use since it is in an area thick with coconut
palms (there are no signs of the presence of the lethal yellowing disease present
in the Zambezia coconut plantations), and of easy access; a series of
infrastructures, such as electricity, are available;
A shareholding structure that brings together a range of stakeholders in the
coconut and copra chain: members of the association of producers, producers
and traders;
It can play an important role in encouraging the planting of coconut palms
(new varieties; dwarf palms), serving as a bridge between funding agencies and
the producers, and absorbing their production;
__________________________________________________
Main Report
___________________________________________________________ 78
__
It can play a decisive role as a pilot project (demonstration effect),
guaranteeing the creation of more national value added, starting from one of the
greatest natural riches of this region, and diversifying the processed products,
which have guaranteed markets;
The production is mostly for export;
It can be rapidly implemented, it has markets guaranteed, it will have a
major impact on the economy of the region and of the country (the country
needs to create more added value from its natural riches), it will generate jobs,
directly and indirectly (encouraging people to stay in the area, and improving
their standard of living).
COSTS AND BENEFITS
7$%/(&2676$1'%(1(),76)25&2&2187352'8&76)$&725<,1,1+$0%$1(
&2676
The raw material is acquired from the
producers at prices that result from the
implementation of the measures defined
in the "Draft Report" of the Diagnosis
and Strategy for the Agricultural Sector
(appendix). The assumptions used are
attainable, through a greater valuing of
copra, generating further national added
value, with the production of some of the
derivatives mentioned.
Although new equipment with current
technology will be acquired, industrial
yields 50% below the level of the best
world producers (66%) were considered.
It was also projected that the factory will
start with a 90% efficiency in year one,
advancing to 95% in year 2, and 100%
in the following years
The provision of services, third party
suppliers, staff costs, depreciation of
equipment have been exhaustively
quantified at market prices (including
multi-risk insurance, work accidents,
stock, 2% maintenance and conservation
on the initial value of the investment,
advertising and others), as can be noted
in the respective tables.
Under the heading of financial costs of
operations are envisaged costs derived
from promoting the plantation of new
coconut palms (equivalent to 2% on the
value of the annual purchases).
%(1(),76
Although the long term strategy should
follow a line of differentiating the final
product (brand, quality, and all the
derivatives already mentioned which are
found to be profitable), with much better
margins, only the processing of copra into
crude oil, refined oil and the use of the
bagasse by-product were considered.
There is no problem with the capacity of the
market to absorb the production of this unit
(quantity), if we take the following
indicators into account:
- Mozambique imports much of the refined
oil that it consumes;
- South Africa already imports 100% of the
crude
oil
produced,
over
20,000
tonnes/year;
- The current units producing copra oil in
the Limpopo Valley (five) are unable to
meet external demand, for lack of raw
material;
The productive capacity of Limpopo
Valley copra is higher than 600,000
tonnes/year (at an average of 275 grams of
copra per coconut), of which less than 10%
goes to the industry;
The bagasse by-product is quantified at
national market prices. It should be
mentioned that with the development of the
livestock sector, copra bagasse will certainly
find a large market to be supplied, given its
excellent characteristics as animal feed.
__________________________________________________
Main Report
___________________________________________________________ 79
__
Table 3.14 Coconut Derivatives Sales Price, August 2002
SALES PRICE
Product
"Limpopo Valley" coconut derivatives
Scenario 1 - Cautious
Scenario 2 - Realistic
Crude oil
(1)
Yea 1: 350 USD/Tonne
Year 2 to 5: 354 to 364 USD/Tonne
depending on inflation.
(1)
Year 1: 350 USD/Tonne
Year 2 to 5: 354 to 364 USD/Tonne
depending on inflation.
Refined oil
(1)
Year 1: 550 USD/Tonne
Year 2 to 5: 556 to 572 USD/Tonne
depending on inflation.
(1)
Year 1: 575 USD/Tonne
Year 2 to 5: 581 to 598 USD/Tonne
depending on inflation.
Copra
(2)
Year 1: 100 USD/Tonne
Year 2 to 5: 101 to 104 USD/Tonne
depending on inflation.
(2)
Year 1: 95 USD/Tonne
Year 2 to 5: 96 to 99 USD/Tonne
depending on inflation.
Notes:
1.
2.
3.
Prices obtained by reference to the market prices of the industries already operating (100% exports to South Africa), in the case of crude
oil, and international market prices for this and for refined oil (June 2002): Crude oil, CIF - duty paid Liverpool, 322 USD/tonne; Refined oil,
Ex-Works UK 442 USD/tonne.
Prices obtained by reference to the prices currently paid by the industry. These prices of around 85 USD/tonne are low, and in our
understanding do not encourage the farmer to sell fresh coconuts. or even to harvest them (shortage of labour to climb the high varieties
of trees). Price of copra from the Philippines in June 2002: CIF-Rotterdam, 266.5 USD/tonne.
It was considered that international prices will remain stable over the five years of the study, evolving only in accordance with dollar
inflation.
__________________________________________________
Main Report
___________________________________________________________ 80
__
SUMMARY OF PRE-VIABILITY INDICATORS
Table 3.15: Summary of pre-viability indicators for Project 3 Integrated Coconut derivatives processing factory in
Inhambane/Maxixe
I
N
D
I
C
A
T
O
R
S
I
N
D
I
C
A
T
O
R
S
SCENARIO 1 – Cautious
Investment needed
Break-even year
3,327,668 USD
Year 3
"Break-Even"
1,758,383 USD
Sales in Break-even year
2,321,758 USD
Time to recover investment
57 months
IRR
17.03 %
NPV
245,398 USD
SCENARIO 2 – Realistic
Investment needed
Break-even year
3,317,469 USD
Year 3
"Break-Even"
1,637,010 USD
Sales in Break-even year
2,356,473 USD
Time to recover investment
55 months
IRR
21.67 %
NPV
517,617 USD
CONCLUSIONS ON PROJECT 3
From analysing the economic and financial indicators of profitability, presented
in the following chapters, one notes that the "project to build an integrated
factory of coconut derivatives" is technically, economically and financially viable
(in terms of pre-viability).
The precautions taken in the assumptions used, and sensibility analysis made of
the project's critical parameters, give it a very reasonable safety margin, and
significantly reduce the project risk.
For purposes of pre-viability, the net benefits arising from the coconut
derivatives which constitute the diversification of this unit, and the great value
added in comparison with those already established (better margins, less
dependence on the clients for oil, greater stability, greater national value added)
were not considered.
__________________________________________________
Main Report
___________________________________________________________ 81
__
These conclusions will be real to the extent that the constraints identified in
general terms on the agricultural sector and on agro-industry are overcome. In
the Draft Report on the "Diagnosis and Strategy Advocated", suggestions are
made for solving a significant part of these constraints in terms of private
initiative.
In the investment and costs forecast, measures and the respective resources for
ensuring the supply of raw material, which has been one of the main constraints
on the factories already established, are safeguarded.
__________________________________________________
Main Report
___________________________________________________________ 82
__
10 BIBLIOGRAPHY
António Catalão Dinisio- Evolução da Produção Pecuária na República Popular
de Moçambique com especial Ênfase para Bovinos de Corte - Instituto
de Reprodução e Melhoramento Animal - (Trabalho apresentado no
Seminário de Produção Animal – 2-7 de Dezembro 1985) - Ministério
de Agricultura/Food and Agriculture Organization os United Nations.
Pag.1-39
Austral
Consultoria. 1994. ESTUDO DO SUB-SECTOR PECUÁRIO EM
MOCAMBIQUE - Austral Consultoria e projectos, LDA; Louis Berger
International, INC, 1994.
BRL ingéniere (1997). Rehabilitation Project of the Chokwé Irrigation Scheme.
Presentation Note. General Coordinator of Integrated Projects. Ministry
of Agriculture and Fisheries. Republic of Mozambique.
BTFPL (1956). Irrigação do Vale do Limpopo. Ministério do Ultramar,
Inspecção Geral do Fomento. Brigada Técnica de Fomento e
Povoamento do Limpopo.
De Bono, Edward. 1996. Serious Creativity: Using the Power of Lateral
Thinking to Create New Ideas. London: HarperCollinsBusiness.
De Soto, Hernando. 2000. The Mystery of Capital: Why Capitalism Triumphs
in the West and Fails Everywhere Else. London: Bantam Press.
Dias, J.A.Travassos Santos. 1962. Importância da fauna ungulada selvagem
no abastecimento cárneo da Província. (Separata dos Anais dos
Serviços de Veterinaria,n.10,1962).
Direcção dos Serviços de Planeamento e Integração Económica (SPIE). 1973.
IV Plano de Fomento, Parte III Relatórios Sectoriais, Vol. 1, Tomo 1,
Fomento Agrário. Lourenço Marques.
Direcção Nacional de Pecuária. 1998. Relatório Anual, 1998- Ministério da
Agricultura e Desenvolvimento Rural – Direcção Nacional de Pecuária.
Maputo: Ministério da Agricultura.
Direcção Nacional de Pecuária. Relatório Anual, 1999- Ministério da
Agricultura e Desenvolvimento Rural – Direcção Nacional de Pecuária República de Moçambique. Maputo: Ministério da Agricultura.
Direcção Nacional de Pecuária. Relatório Anual, 2000- Ministério da
Agricultura e Desenvolvimento Rural – Direcção Nacional de Pecuária República de Moçambique. Maputo: Ministério da Agricultura.
__________________________________________________
Main Report
___________________________________________________________ 83
__
Direcção Nacional de Pecuária. Relatório Anual, 2001- Ministério da
Agricultura e Desenvolvimento Rural – Direcção Nacional de Pecuária Serviços Provinciais de Pecuária de Gaza - República de Moçambique.
Maputo: Ministério da Agricultura.
Estratégia de Desenvolvimento Pecuário - (Aprovada na 11ª sessão ordinária
do Conselho de Ministros em 29 de Abril de 1997) - Conselho de
Ministros - República de Moçambique
Euroconsult (1982). Report on a Mission to The Limpopo Valley, Mozambique.
Faculdade de Veterinária. 1998. MANUAL DO CURSO DE RECICLAGEM PARA
MÉDICOS
VETERINÁRIOS
(II
EDIÇÃO)
–
Faculdade
de
Veterinária/UEM, Projecto de Reabilitação Pecuária no sector Familiar,
DINAP. Maputo. Universidade Eduardo Mondlane.
FDHA (2002). Levantamento de Regadios de Existentes no País–Fase III
(Zona Sul).
Hamela, Hipólito. 2002a. “O que os empresários querem ver resolvido pelo
Governo e CTA”, in Notícias, Economia e Negócios, 20-11-2002, p. 45.
Hamela, Hipólito. 2002b. “Empresários: o que exigem? Do Governo e CTA”, in
Notícias, Economia e Negócios, 27-11-2002, p. 7.
IG Ltd Company. 2000. Executive Report on Strategies in Mozambique, 2000
edition.
ICON
Group
International.
http://www.Icongrouponline.com/data/reports_toc
Instituto Nacional de Estatística (INE). 1999. Projecções Anuais da População,
País Total 1997-2010: Moçambique, Estudos no. 1. Maputo: INE.
Instituto Nacional de Estatística (INE). 2001. Censo Agro-Pecuário 19992000: Apresentação Sumária dos Resultados Quadros e Gráficos.
Maputo: INE.
Instituto Nacional de Investigação Agronómica (INIA). 1994. Zonas AgroEcológicas E Sistemas de Produção. Maputo: INIA.
Louis Berger International. 1994. 1994. Estudo do Sub-sector Pecuário em
Moçambique. Maputo: Austral Consultoria e Projectos,LDA.
Mendes, C. B. Quental. 1974. Produção pecuária bovina Moçambicana. Ind.
Moçamb. Lourenço Marques Vol.7 n.9 P.301-334 Set.1974
Ministério da Agricultura e Desenvolvimento Rural. 2000. Informação
Estatística do 2001. Direcção Nacional da Agricultura Provincial.
Maputo: Ministério da Agricultura e Desenvolvimento Rural.
__________________________________________________
Main Report
___________________________________________________________ 84
__
Ministério da Agricultura. 1977. Breve Monografia Agrária (A Short
Monography of Moçambique’s Agricultural Sector. Maputo: Ministerio
da Agricoltura.
Ministério da Agricultura. 1977. BREVE MONOGRAFIA AGRARIA (Short
Description of Moçambique’s Agricultural Sector. Maputo: Ministerio da
Agricultura.
Ministério da Agricultura. 1983. ELEMENTOS PARA A DETERMINAÇÃO DE
INDICADORES NO CAMPO PECUÁRIO PARA O PLANO 1984 DAS
PROVINCIAS - Ministério da Agricultura/Direcção Nacional Técnica
Agraria. Maputo: Ministério da Agricultura.
Ministério da Agricultura. 1985. Trabalhos Apresentados no Seminário de
Produção Animal (2-7-Dezembro,1985). Food And Agricultural of the
United Nations. Maputo: República Popular de Moçambique.
Mistério da Agricultura. 1985. TRABALHOS APRESENTADOS NO SEMINÁRIO
DE PRODUÇÃO ANIMAL (2-7 Dezembro 1985) - Ministério da
Agricultura - Food And Agricultural of the United Nations – Maputo:
Ministério da Agricultura.
Morgado, Fernando Pinho. 1983. Elementos para a Determinação de
Indicadores no Campo Pecuário para o Plano 1984 das Províncias.
Direcção Nacional Técnica Agrária. Maputo: Ministério da Agricultura.
Mungoi, Mário. 1998. “Pastagens Maneiro e Melhoramento”, in Manual do
Curso de Reciclagem para Médicos Veterinários, Ed. Mário Mungoi, 2ª
Edicção. Projecto de Reabilitação Pecuària no sector Familiar/DINAP.
Maputo: Universidade Eduardo Mondlane; pp. 128-164.
Newitt, Malyn. 1995. A History of Mozambique. London: Hurst & Company.
O’Driscoll, Gerald P., Kim R. Holmes and Mary Anastasia O’Grady. 2002. 2002
Intdex of Economic Freedom. Washington: The Heritage Foundation
The Wall Street Journal, http://www.heritage.org/
OUTLINE FLOOD EMERGENCY LIVESTOCK SUPPORT PROJECT – Gaza
Province, Mozambique (draft proposal submtitted to ECHO – FE.2000)
– VETAID.
Paisana, Fernando Cardoso e Armando Rosinha. 1972. Inventariação dos
problemas relacionados com a protecção da fauna e o seu
aproveitamento racional - (Anais dos Serviços de Veterinária de
Moçambique, n.20/21,1972 ( 1975) pp.15-121)
Sir M. MacDonald & Partners (1982). Projecto do Rio dos Elefantes, Margem
Direita.
Sir M. MacDonald & Partners (1983). Projecto do Rio dos Elefantes, Margem
Esquerda.
__________________________________________________
Main Report
___________________________________________________________ 85
__
Sogreah and Hidrogest (1993). National Irrigation Development Master Plan.
Umbeluzi, Incomati, Limpopo, Buzi, and Pungoe Basins. SEHA, Maputo.
Sogreah and Hidrogest (1996). Plano Director do Chokwé -anexos. SEHA,
Maputo.
Southern Mining Corporation Limited. 2001. Annual Report 2001. Randburg:
Southern Mining Corporation Limited.
UNCTAD (United Nations Conference on Trade and Development). 2001. An
Investment Guide to Mozambique: Oportunities and Conditions.
Internet Edition. New York: United Nations.
UNCTAD (United Nations Conference on Trade and Development). 2002. The
Last Developed Countries Report 2002: Escaping the Poverty Trap.
Geneva: United Nations.
UNDP (United Nations Development Programme). 1996. Human Development
Report 1996. New York: UNDP.
UNDP (United Nations Development Programme). 1999. Human Development
Report 1999. New York: UNDP.
UNDP (United Nations Development Programme). 2000. Mozambique National
Human Development Report 1999. Maputo: UNDP.
UNDP (United Nations Development Programme). 2002. Human Development
Report 2002. New York: UNDP.
UNDP (United Nations Development Programme). 2002. Mozambique National
Human Development Report 2001. Maputo: UNDP.
Wethli, Edward. 1995. Estudo do Desenvolvimento Avicola. Maputo: Austral
Consultoria e Projectos, Lda.
World Economic Forum (WEC). 2002. The Africa Competitiveness Report 2000
2001:
Strengths
and
Challenges
facing
the
Continent.
http://www.weforum.org/pressreleases.nsf/.
__________________________________________________
Main Report
___________________________________________________________ 86
__
APPENCIES
__________________________________________________
Main Report
___________________________________________________________ 87
__
__________________________________________________
Main Report
___________________________________________________________ 88
__
APPENDIX 1: TERMS OF REFERENCE
LIMPOPO CORRIDOR SPATIAL DEVELOPMENT INITIATIVE
PROMOTING AGRO-INDUSTRIAL PROCESSING
THE BRIEF, THE SERVICES AND TIME SCHEDULE
1. THE BRIEF
Located north of Maputo, the Limpopo Valley is constituted by the Limpopo
River Basin and the Limpopo Railway linking Zimbabwe and the Maputo Port. This area
was once considered the bread-basket of Mozambique in terms of its agricultural
potential. A huge irrigation scheme was established by the portugueses in mid 50's
with a goal of settling the Portuguese farmers as a way of effective occupation of the
country. Down and upstream the irrigation scheme other developments took place
such as raising livestock and medium-scale agro-processing industries. Rice from
Limpopo as well as dairy products were being exported to European markets as well as
some of the neighbouring countries.
With independence of Mozambique in 1975 most of, if not all, Portuguese farmers left
the country and with them all the management institutions for the irrigation scheme.
This has created management difficulties to the new Mozambican authorities. The
centrally planed economy, that constituted the development strategy of the country,
and the two consecutive wars that followed damaged all the production capacity of the
Limpopo Valley. Two years ago floods never seen before devastated the whole
Limpopo Valley transforming the first highly productive area in place of vulnerable
people highly dependent on foreign assistance. The Government of Mozambique with
assistance of the Donnor Community has been putting efforts to rehabilitate the Valley
and put it back on track of exploring its productive capacity and potential. In a jointeffort with the Government of South Africa, the Government of Mozambique has
launched a Spatial Development Initiative for the Limpopo Valley. The objective of this
initiative is to assist in unlocking the existing potential in the Valley in order to
promote development of the area and induce activities aimed at reducing poverty.
In the area covered by the Limpopo Valley Spatial Development Initiative (L
VSDI) there are already some investment initiatives in need of recovery that will
largely contribute to the development of the area, as well as there is also potential for
new initiatives in agro-processing sector. Some of these initiatives among others are:
In stoppage status
Rice peeling
Dairy products
Grinding
Tomato sauce
Cashew nuts factories
__________________________________________________
Main Report
___________________________________________________________ 89
__
Cotton-mill
b) Recovered or in labour
Incomati Valley sugar factories
Sausage factory (transformed into industrial butchery)
Processing seeds
c) Other Initiatives
Coco nut processing
Tangerine and others citrus processing
Other agro-industry products
The Limpopo Valley area has high agricultural potential characterized by good soils,
agricultural good practices, availability of water, market, etc.
Under this situation, the central thrust of this study is to design the advisable strategy
for re- launching the sector activity, as well as identify and formulate projects that can
act as drivers of agricultural development of the area.
2.
OBJECTIVES
Therefore the main objectives of this study are:
To assess the role that agricultural Valley plays and can play in the
economy of area as well as at country level.
To review in detail the agricultural production capacity;
To review the existing and potential irrigation and associate
infrastructure as well as the management capacity;
To review the agricultural products processing capacity and production
technology;
To develop the possible scenarios and policies that would lead to
unleash the agricultural and agro-processing potential;
To formulate a development concept strategy that will take into
account local subsistence farmers and large scale business initiatives;
and
To identify agricultural and agro-processing investment projects to be
considered by the private sector and the needs for further public
investment to create a favorable investment environment.
3. METHODOLOGY
Considering that there are several studies related to the development of the Limpopo
Valley, it is proposed that this study be carried out in three phases, namely: (i) a desk
study review; (ii) field assessment and data collection; and (iii) analysis of the
information and reporting.
During the process the study team shall contact Governmental entities and individuals,
members of the business community investing or interested in investing, especially the
ones interested in agricultural and agro-processing production.
__________________________________________________
Main Report
___________________________________________________________ 90
__
4. SCOPE
This study is part of different initiatives and efforts for the development of an
investment portfolio for the Limpopo Valley. Therefore, the study shall cross-check
other sectoral studies, in order to make sense in a package of investment portfolio to
attract investors to an Investment Conference, scheduled for 2002. The study should
cover the existing agro-industries in stoppage status and new initiatives in need of relaunching/recovering in Limpopo valley SDI as well as in selected areas covered by
Incomati Valley. The focus should be based on priorities defined under the Government
of Mozambique Programme, in particular for the
Provinces of Gaza and Maputo taking into consideration the strong need for the
development of a private sector in Mozambique.
5. OUTPUTS
As part of a SDI program, the study should attempt to identify the constraints to
wealth creation and to put in place processes to remove or alleviate them, thereby
unleashing the inherent agricultural and agro-processing potential of the area. The
expected three main outputs of the study are: (i) an overall agricultural and agroprocessing appraisal report; (ii) a project identification report; and (iii) at least three
detailed investment projects at pre-feasibility level.
__________________________________________________
Main Report
___________________________________________________________ 91
__
APPENDIX 2: PRE-VIABILITY STUDY FOR THE CONHANE RICE FACTORY
APPENDIX 3: PRE-VIABILITY STUDY FOR THE CHILEMBENE TOMATO
FACTORY
APPENDIX 4: PRE-VIABILITY STUDY FOR THE COCONUT PRODUCTS
FACTORY IN INHAMBANE/MAXIXE
__________________________________________________
Main Report
___________________________________________________________
APPENDIX 2: PRE-VIABILITY STUDY FOR THE CONHANE RICE FACTORY
LVSDI
AGRI-PROCESSING SECTORIAL STUDIES
PROJECTO 1:
REHABILITATION,
MODERNISATION AND PRODUCT
DIVERSIFICATION OF THE CONHANE RICE
DEHUSKING FCTORY
(PRE-FISIBILITY STUDY – Final Report)
SUMMARY
I. SHORT PRESENTATION
II SUMM ARY OF THE PRE-VIABILITY INDICATORS
Project Context
1. Agricultural sector
2. Agro-industrial sector
3. Commercial/Marketing sector
III ANALYSIS OF THE FINANCIAL AND ECONOMIC VIABILITY
1. Assumptions
2. Investment
3. Financing Plan
4. Income
5. Costs
SCENARIOS (CAUTIOUS; REALISTIC)
1.
2.
3.
4.
5.
6.
Provisional demonstration of results
Profitability indicators
Sensibility Analysis
Economic Indicators
Provisional Balance-sheet
Financial Indicators
APPENDICES
1. Formation of agricultural prices and agro-industry in
Chokwe: Their evolution.
2. Statistics on prices, production, income, imports, exports.
3. Diagnosis and Strategy for the Agricultural Sector
4. Diagnosis and Strategy for Agro-Industry
___________________________________________________________
Appendix 2
1
___________________________________________________________
I.
2
BRIEF PRESENTATION
The main reasons for choosing the Conhane rice project as one of the anchor
projects for CL agro-industry are the following:
Optimal location, since this is a zone of intensive rice production, it is easily
accessible, and possesses infrastructures such as good roads, and water and
electricity supplies;
Availability of a shareholding structure that brings together a range of
stakeholders in the rice chain: Members of the producers' association
(AGRIGAZA), Producers and Traders;
It can play an important role in encouraging rice production, serving as a
bridge between the funding agencies and the producers, and absorbing their
production;
With its previously installed capacity of 12,000 tonnes/year, the Conhane
factory was already the largest unit of the kind in Chokwe district; once
rehabilitated and modernised, it could play a crucial role in processing the
rice produced in the region;
There are already advanced studies for its rehabilitation, including a
complete rehabilitation/modernisation project (to 13,550 tonnes/year),
including a study on the use of by-products;
It is one of the productive units that most needs support in terms of access
to funding, because of its long paralysis, worsened by the floods of 2000;
It possesses a complex of silos with a capacity of 10,000 tonnes. These are
the only ones in the area, and there is the possibility of storing food reserves
there.
The basic pre-viability factors presented should be looked
more deeply through subsequent market studies and technical
economic viability studies.
___________________________________________________________
Appendix 2
into
and
___________________________________________________________
3
PROJECT DESCRIPTION
Products/
Sector
Rice
industry
Description
Rehabilitation of the
“Conhane Factory”
By-products
1st Phase
Top grade Indian
rice
1ª phase
Top grade
Promotion
Aromatic rice
Extension
Broken rice
Processing and storing
the rice
Rice bran
2nd Phase
Plasterboards of
2nd phase
rice straw for the
Production of
plasterboards of rice
straw
Use of the silos for
the country's food
reserve
"Placas
the rice bran
husks
"Basmati")
High yields per hectare achieved
with the strategy proposed
Installation of modern Thai
technology with a high
industrial yield
already done
to recover the
Conhane
Factory, and
in a 2nd
phase
recovery of
the Silos for
-
Commercial sector: with the
capacity to obtain in the short
term average yields of 4-6 tonnes per
hectare; essentially Indian
varieties (more than 4
tonnes/hectare each), reliance on
food reserve,
introduction
of the sector
making rice
straw
plasterboards.
mechanisation and adequate use of
agro-chemicals;
Other
potential
order
to
Silos in
diversify
and
para reserva alimentar
value
national
do país
Utilização
international market (similar to
with studies
and
Oil removed from
prenssadas" da palha
do arroz
varieties highly valued on the
interested
products
made from rice
de
Introduction of new aromatic
Investors
the
Boards and blocks
Produção
Valuing traditional aromatic
varieties
construction sector The agricultural strategy is viable
Possible use of by- since it is centred on 2 areas:
Livestock feed
2ª Fase
Strong points
Other
important
data
dos
raw
material:
Rice oil is
highly prized on
the market
- Family sector and other
businesses: producing
essentially
aromatic varieties (with
extension; with promotion, with
branding; with less need to
obtain price competitiveness,
since
this is a niche market, and less
sensitive to the price factor)
Rice straw
plasterboards are
Competitiveness in relation to
highly ecological
imported rice and other Mozambican
products
rice, achieved with a reasonable
safety margin (although starting
from the principle that in terms of
agricultural production, the
businessmen will have agricultural
equipment and agro-chemicals
___________________________________________________________
Appendix 2
___________________________________________________________
available at more competitive prices,
apart from the
indispensable extension and
promotion, the assumption for the
pre-viability study was that it would
take five years to obtain
yields of 5.3 tonnes per hectare in
the commercial sector, and
2.6 tonnes per hectare in the family
sector and small
businesses).
___________________________________________________________
Appendix 2
4
___________________________________________________________
II.
5
SUMMARY OF PRE-VIABILITY INDICATORS
I
N
D
I
C
A
T
O
R
S
SCENARIO 1 – Cautious
Investment needed
1 322 102$00 USD
Break-even year
Year 3
"Break-Even"
2 001 321$00 USD
Sales in Break-even year
1 718 140$00 USD
Pay back period
59 months
IRR
14,84 %
NPV
53 045$00 USD
SCENARIO 2 – Realistic
I
N
D
I
C
A
T
O
R
S
Investment needed
1 333 125$00 USD
Break-even year
"Break-Even"
Sales in Break-even year
Pay back period
Year 3
1 646752 983$00 USD
1 797 277$00 USD
54 months
IRR
22,97 %
NPV
267 775$00 USD
CONCLUSIONS ON PROJECT 1
From analysing the economic and financial indicators of profitability, one notes
that the "project for the recovery, modernisation and project diversification of
the Conhane rice dehusking factory" is technically, economically and financially
viable (in terms of pre-viability).
The precautions taken in the assumptions used, and sensibility analysis made of
the project's critical parameters, give it a very reasonable safety margin, and
significantly reduce the project risk. For purposes of pre-viability, the net
benefits arising from processing of the products in the 2nd phase, which will
bring much greater value added to the project, were not taken into account.
These conclusions will be real to the extent that the constraints identified in
general terms on the agricultural sector and on agro-industry are overcome. In
the Draft Report on the "Diagnosis and Strategy Advocated", suggestions are
made for solving a significant part of these constraints in terms of private
initiative.
In the investment and costs forecast, measures and the respective resources for
ensuring the supply of raw material, which has been one of the main constraints
on the factories already established, are safeguarded.
___________________________________________________________
Appendix 2
___________________________________________________________
6
III CONTEXT
As already mentioned in the Draft Report on the Diagnosis and
Development Strategy for the Agricultural Sector and for AgroIndustry, the viability of the rice harvest in the Limpopo Valley
depends, summarily, on the following factors:
1.
Improving
initiative)
Availability
irrigation
the
and
existing
stability
in
infrastructures
the
supply
of
(public
water
for
Rehabilitation of the irrigation systems
Improving access: road and rail systems
Stability in the supply
telecommunications
of
energy,
and
of
fixed
and
mobile
Improvement in the education and health services
Reducing red tape in the public sector and increasing its
efficiency. Create mechanisms for decentralising state decisions
and control over all actors, in order to reduce the conditions
that lead to the proliferation of vices that divert their
behaviour away from the national interest.
Ensure that public and private economic agents comply with
the law as regards tax and customs evasion, and the licensing of
activities.
2.
Investment in professional training, for farmers, workers,
administrative
professionals.
staff,
salespersons
and
other
relevant
3.
Investment in research and in extension services
4.
Availability of services: accountancy, legal services, the
treatment and availability of data concerning markets (for
productive factors, and for primary and manufactured products
nationally and internationally), transport of goods, storage,
training, recruitment, financial services, etc.
5.
Overcome the reluctance of the financial sector to finance
agriculture and reduce the interest rates currently charged,
which on their own make non-viable any business in this sector
(suggestions have been made, notably for the creation by the
___________________________________________________________
Appendix 2
___________________________________________________________
7
state of a guarantee fund, which would cover part of the risks of
the financial and insurance sectors).
IN SHORT, CREATE THE SO FAR NON-EXISTENT ''BUSINESS
ENVIRONMENT'' WHICH IS INDISPENSABLE FOR THE SUCCESS OF
ANY PROJECT.
Agricultural sector
Currently,
rice
is
already
produced
in
the
Limpopo
Valley,
although in small amounts. There are farmers in the business
sector, who have good business know-how, with farms of a size
where mechanisation would be appropriate, and with interesting
yields (from 3 to 6 tonnes per hectare). The water supply is
being rehabilitated, the national and regional market is huge,
and the Limpopo Valley has excellent natural, infrastructural and
historical
conditions
for
developing
the
production
of
large
quantities of high quality rice, in a competitive way.
As the
following
viable:
Draft Report notes, within the
conditions
are
indispensable
to
agricultural sector, the
make
rice
production
Guarantee the availability and stability of water supplies;
Encourage the creation of companies that provide services of
hiring agricultural machinery and of extension (farmers must be
informed and trained to use the machinery correctly), mainly for
the business sector, which has to adopt highly mechanised
production processes.
Encourage
the
creation
of
companies
that
purchase
agricultural chemicals in large amounts so as to reduce the final
unit price, and that undertake the respective extension (farmers
must be informed and trained in the proper use of chemicals,
since part of the lack of competitiveness results from their
incorrect use).
Gradual alteration of the landholding structure, encouraging
the effective use of land, bringing together small holdings, and
producing crops appropriate to their characteristics and to the
know-how of their owners.
Encourage introduction into the family sector of aromatic
varieties of rice, where the production process is more
appropriate to its characteristics, and where lower efficiency in
production is not so heavily penalised in the market (the
___________________________________________________________
Appendix 2
___________________________________________________________
8
aromatic varieties are aimed at the medium-high income segment,
where it is not the price, but the quality of the product and its
image that are the most important factors).
To encourage the business sector,
the weight of the informal economy.
it
is
necessary
to
reduce
Encourage
agro-industry
to
promote
rice
planting,
and
establish private methods, following market laws, of financing
farmers on time, and with interest rates that their activity will
bear.
Encourage the insurance
at tolerable prices.
sector
to
launch
"harvest
insurance"
Agro-industrial sector
As the Draft Report notes, within the agro-industrial sector, the
following
conditions
are
indispensable
to
make
rice
processing
units viable:
Availability and stability in the supply of raw material
Quality of the raw material
Undertake extension,
specialised agents
complementary
to
the
state
or
other
Undertake promotion,
specialised agents
complementary
to
the
state
or
other
Availability
of
skilled
labour
read; sense of responsibility as
organisation; no vices)
Creation
rice.
of
"Limpopo
Valley"
(essentially,
regards their
brands
of
Indian
Adding value to the harvest, by obtaining more
such as rice straw (for plasterboards), husks, bran (oil)
ability
role in
and
to
the
aromatic
by-products,
Existence of services for certifying origin
Investment
in
marketing:
focus
on
quality
and
on
certification of origin (these market segments are still niches,
they have exponential growth rates, and are highly profitable,
appropriate for new brands that are entering).
___________________________________________________________
Appendix 2
___________________________________________________________
9
Commercial sector/marketing
This sector is not a block on the development of the rice
harvest. There are already agents that supply these services, or
if more agents are necessary, the market will ensure that they
appear:
Suppliers of goods transport services;
Warehouses;
"Tradings"
Distributors and retailers;
Communications, marketing and advertising companies etc.
Companies which design, develop and produce packaging.
At this level it is important to set up the regulations and
create the body that will manage and inspect the Limpopo Valley
certificate of origin, to be used as a brand.
___________________________________________________________
Appendix 2
___________________________________________________________ 10
III ANALYSIS OF ECONOMIC AND FINANCIAL VIABILITY
1.
Assumptions
SCENARIOS
Two scenarios were developed, which are different
assumptions concerning the sales price of the final product.
only
in
the
Scenario 1 - Cautious
The sales price adopted was not the price permitted by the costs
of production of the rice harvest in Mozambique, but sales prices
fixed
by
taking
as
the
reference
point
international
market
prices, for a brand of rice with intermediary valuation on the
market (VIETNAM), but not top quality (as a safeguard, it was
considered that 25% of the rice would be broken, which is
currently the quality level mostly sought after in Mozambique).
As from FOB prices obtained on 25/10/2002 (and these prices have
been rather stable in recent months), it was considered that the
national industry would manage to place its product at 20% below
those prices in Year 1, and at 10% below in the following years,
on the national market, or for export to neighbouring countries.
These prices were regarded as fixed over 5 years, and the
competitive advantage of Mozambique would be sustained by the
difference
in
transport,
customs
and
other
costs
inherent
to
importing from a non-SADC country located in East Asia.
Scenario 2 - Realistic
The requirement of the differential in Scenario 1 is not very
realistic,
since
as
soon
as
rice
processed
from
national
production is competitive, there is no reason why this rice, of
better quality than imported rice (which is mostly 25% broken),
should still have such a high price differential.
Thus, as from FOB prices obtained on 25/10/2002 (and these prices
have been rather stable in recent months), it was considered that
___________________________________________________________
Appendix 2
___________________________________________________________ 11
the national industry would manage to place its product at 10%
below those prices in Year 1, and at 5% below in the following
years, on the national market, or for export to neighbouring
countries.
These prices were regarded as fixed over 5 years, and the
competitive advantage of Mozambique would be sustained by the
difference
in
transport,
customs
and
other
costs
inherent
to
importing from a non-SADC country located in East Asia.
Rice sale price, October 2002
SALES PRICE
VARIETY
Indian
Fragrant/
Aromatic
1ST grade "Limpopo Valley" Rice
Scenario 1 - Cautious
“FOB VIETNAM 25%”
25-10-2002
168 USD(1)
Year 1: 212 USD/Tonne(3)
Year 2/3/4/5: 239 USD/Tonne (3)
Scenario 2 – Realistic
“FOB VIETNAM 25%”
25-10-2002
168 USD (1)
Year 1: 239 USD/Tonne (4)
Year 2: 2/3/4/5: 252 USD/Tonne (3)
“FOB BASMATI INDIA”
25-10-2002
680 USD(2)
Year 1: 708 USD/Tonne
Year 2: 626 USD/Tonne
Year 3/4/5: 529 USD/Tonne
“FOB BASMATI INDIA” (4)
25-10-2002
680 USD (2)
Year 1: 708 USD/Tonne
Year 2: 626 USD/Tonne
Year 3/4/5: 529 USD/Tonne
Notes:
1.
2.
3.
4.
5.
Added cost to the FOB price until reaching the importing wholesaler: 97.5 in the Indian variety
Added cost to the FOB price until reaching the importing wholesaler: 149.6 in the aromatic variety
In year 1, the product enters the market at 20% below the cost of imported rice, in Year 2 and the following years it is
always placed at 10% below.
In year 1, the product enters the market at 10% below the cost of imported rice, in Year 2 and the following years it is
always placed at 5% below.
It has been assumed that international prices will remain stable over the five years of the study (they fall in real terms).
___________________________________________________________
Appendix 2
___________________________________________________________ 12
Paddy rice – Estimated price paid to the farmer
PRICE PAID TO THE FARMER (1)
VARIETY
"Limpopo Valley" paddy rice
Scenario 1
Scenario 2
Indian
ESTIMATED HARVEST PRICE
Year 1: 72 USD/Tonne
Year 2: 69 USD/Tonne
Year 3/4/5: 63 USD/Tonne
ESTIMATED HARVEST PRICE
Year 1: 72 USD/Tonne
Year 2: 69 USD/Tonne
Year 3/4/5: 63 USD/Tonne
Fragrant/Aromatic
ESTIMATED HARVEST PRICE
Year 1: 201 USD/Tonne
Year 2: 183 USD/Tonne
Year 3/4/5: 152 USD/Tonne
ESTIMATED HARVEST PRICE
Year 1: 201 USD/Tonne
Year 2: 193 USD/Tonne
Year 3/4/5: 152 USD/Tonne
Note: These prices allow the farmer to obtain the income adequate for sustaining his business (paying market interest rates), after implementation
of the measures proposed in the agricultural sector Draft Report, the effects of which in reducing the costs of production will make it possible to
increase the profitability, competitiveness and sustainability of the entire harvest.
___________________________________________________________
Appendix 2
___________________________________________________________ 13
OTHER GENERAL ASSUMPTIONS
The investments
needed,
from
buildings/building
work,
to
industrial,
transport
and
administrative equipment,
training,
marketing,
studies,
formation,
licences
and
permits,
are
quantified in detail.
The technology acquired (Thai)
maximise yields from the factory.
will
make
it
possible
to
The factory is autonomous in terms of transport.
The complete payment of all tax obligations (VAT, income
tax, corporation tax, social security) has been considered,
without any fiscal benefit (this ought to be granted by the
state,
ensuring
that
it
reverts
to
the
suggested
rural
development company).
A "2% surprise factor" on total income is considered,
the heading "other expenses and costs" in the balance sheet.
under
A 13% rate of updating Cash flows was used.
A
1%
dollar
inflation
rate
throughout the period of the study.
was
used
as
an
estimate
Investment, income and costs are not quantified for the 2nd
phase of the project: manufacture of plasterboard from rice
straw; boards from rice husks; making profitable use of the
silos.
NOTE: Part of the data used was gathered from the Limpopo Valley
stakeholders,
namely
farmers
from
the
business
sector,
agroindustries (Orly; Sorgaza; Inacio de Sousa), commercial sector,
technicians
and
other
staff
from
public
bodies,
one
of
the
representatives of the current owners of the Conhane Factory,
Hicep,
among
others,
apart
from
studies
and
the
available
secondary information (COMPETIR, the Oryza Site, others).
___________________________________________________________
Appendix 2
___________________________________________________________ 14
2.
Investment
OVERALL INVESTMENT PLAN
Unit: dollars
ITEM
FIXED TANGIBLE ASSETS
1
1 140 000$00
Facility Recovery, Bascule, Compressed Air, Electrical Installation
275 000$00
Productive Equipment (12.000 Ton./year)
600 000$00
Racks, Pallet Carrier, Pallet Truck
55 000$00
1 Heavy Truck (8 Ton.), 2 Vans (3,5 Ton.)
150 000$00
Administrative Equipment
60 000$00
FIXED INTANGIBLE ASSETS
47 500$00
Licences, Charters
2 500$00
Company Constitution
2 500$00
Professional Training Plan Implementation
20 000$00
Feasibility Study
10 000$00
Marketing Plan Implementation
12 500$00
FIXED ASSETS INVESTMENT
1 187 500$00
INVESTMENT IN WORKING CAPITAL
145 625$00
TOTAL
1 333 125$00
___________________________________________________________
Appendix 2
___________________________________________________________ 15
INVESTMENT IN WORKING CAPITAL
DAYS
30
1
39 226$00
2
39 618$00
3
39 843$00
4
40 242$00
Unit:dollars
5
45 403$00
2. Clients
30
118 692$00
142 685$00
149 773$00
152 025$00
152 834$00
3. Stocks
30
58 567$00
63 709$00
61 944$00
63 398$00
63 920$00
4. Stocks' Suppliers
30
63 447$00
64 138$00
61 797$00
63 519$00
63 964$00
5. State
- Paid VAT
- Settled VAT
- Credited VAT
- Outstanding VAT
- Income Tax
4 570$00
4 616$00
4 629$00
4 675$00
5 637$00
6. Social Security
2 842$00
2 870$00
2 876$00
2 905$00
3 575$00
145 625$00
145 625$00
174 388$00
28 763$00
182 258$00
7 870$00
184 565$00
2 307$00
188 982$00
4 417$00
ITEMS
1. Current Assets
7. Net Current Assets Needs
8. Net Current Assets Investment
1
Initial Stocks
Final Stocks
Purchases
Purchases of Goods for Resale
2
58 567$00
58 567$00 63 709$00
761 367$00 769 655$00
702 800$00 764 512$00
3
4
Unit:dollars
5
63 709$00
61 944$00
741 564$00
743 329$00
61 944$00
63 398$00
762 226$00
760 773$00
63 398$00
63 920$00
767 567$00
767 045$00
___________________________________________________________
Appendix 2
___________________________________________________________ 16
2. Financial Plan
PROJECT'S FINANCING PLAN
ITEMS
1
1. SOURCES
Capital and Reserves
333 281$00
Equity
333 281$00
Supplementary Instalments
Debt Capital
999 844$00
Bank Loans
933 188$00
Partners' Loans
66 656$00
Subsidies
Forfeited Funds for Investment
Forfeited Funds for PTs
TOTAL
1 333 125$00
Fixed Assets Investment
1 187 500$00
2. APPLICATIONS
Net Current Assets Investment
145 625$00
Bank Loans Reimbursement
Partners' Loans Reimbursement
TOTAL
1 333 125$00
___________________________________________________________
Appendix 2
___________________________________________________________ 17
Loan Term
Interest Rate
5
10,00% Deferred Period
Period
Year 1, 1st semester
Year 1, 2nd semester
Year 2, 1st semester
Year 2, 2nd semester
Year 3, 1st semester
Year 3, 2nd semester
Year 4, 1st semester
Year 4, 2nd semester
Year 5, 1st semester
Year 5, 2nd semester
Initial
Amortisation
Outstanding Capital
933 188$00
933 188$00
933 188$00
933 188$00
933 188$00 155 531$00
777 656$00 155 531$00
622 125$00 155 531$00
466 594$00 155 531$00
311 063$00 155 531$00
155 531$00 155 531$00
2
Interest
Amortisation
46 659$00
46 659$00
46 659$00
46 659$00
46 659$00
38 883$00
31 106$00
23 330$00
15 553$00
7 777$00
46 659$00
46 659$00
46 659$00
46 659$00
202 191$00
194 414$00
186 638$00
178 861$00
171 084$00
163 308$00
Unit:dollars
Final
Oustanding Capital
933 188$00
933 188$00
933 188$00
933 188$00
777 656$00
622 125$00
466 594$00
311 063$00
155 531$00
___________________________________________________________
Appendix 2
___________________________________________________________ 18
3. Benefits
Although the long term strategy should follow a line of differentiating the
final product (brand, quality and aromatic variety), with much better
margins, it was only considered that the aromatic varieties would start
with a weight of 2.5% of the company's sales, and would reach 7.6% in
year 5;
Although all the factors necessary to obtain a quality product were
considered in the investment and the costs, sales prices were considered
that are competitive with lesser quality imported rice (25% broken)
The capacity of the market to absorb the production of this unit
(quantity) is not a problem, if we take the following indicators into
account:
-
Mozambique imports more than 180,000 tonnes a year of
dehusked rice;
-
South Africa imports more than 530,000 tonnes/year (mostly
whitened);
-
The neighbouring
tonnes/year;
-
The current productive capacity of Mozambique is no higher than
100,000 tonnes/year.
countries
import
more
than
650,000
The by-products of broken rice and bran are quantified at Mozambican
market prices, with a descending evolution deriving from the ever
greater competitiveness of agricultural production. Broken rice is a
particularly prized by-product on the national market. Bran is a byproduct that may be increasingly valued with the development of the
livestock sector.
4. Costs
The raw material is acquired from the producer at prices resulting from
implementing measures laid down in the "Draft Report" of the Agricultural
Sector Diagnosis and Strategy (see appendix). The assumptions used are
perfectly feasible, and in the simulation presented, full achievement of the
productivity of the family sector and the small businesses forecast there (4.5
tonnes/hectare) was not taken into consideration, but only 2.6
tonnes/hectare, and only in year five of the project (that is, 6/7 years from
now).
Since new equipment with current technology will be acquired, obtaining
industrial yields at the level of the best world producers (67%) was
considered. It was also projected that the factory will start with an 80%
efficiency in year one, advancing to 90% in year 2, and 95% in the following
years.
The provision of services, third party suppliers, staff costs, depreciation of
equipment have been exhaustively quantified at market prices (including
multi-risk insurance, work accidents, stock, 2% maintenance and
___________________________________________________________
Appendix 2
___________________________________________________________ 19
conservation on the initial value of the investment, advertising and
others), as can be noted in the respective tables.
The staff costs envisage wages of 150 USD a month for workers and
administrative staff, which shows a concern to value this profession, and
to obtain motivation, productivity and efficiency - that is it does not try to
obtain competitiveness at the cost of factors that are not sustainable in
the medium to long term. Also envisaged are contracting 1 General
Manager, 1 Financial Manager, 1 Commercial Manager, and 1 Production
Manager, with monthly wages of 1,200 to 1,500 USD, and 2 extensionists
(1 senior paid 800 USD/month, and 1 junior at 450 USD/month).
Under the heading of financial costs of operations are envisaged costs
derived from the integral promotion of the rice production necessary for the
factory (at a rate of 15% on the value of the purchases).
ALL THE REMAINING ASSUMPTIONS AND RESPECTIVE TABLES ARE PRESENTED
BELOW IN RELATION TO THE 2 SCENARIOS USED
___________________________________________________________
Appendix 2
___________________________________________________________ 20
SCENARIO 1 - CAUTIOUS
1.
Profit
INSTALLED AND USED PRODUCTIVE CAPACITY
SERVICES/PRODUCTS
Installed Productive Capacity (Ton.Hour)
Efficiency Rate
Shifts:
I
II
III
Daily total of Hours/Machinery (H/M)
No. of working days/ Year
TOTAL
1
6
80%
2
6
90%
3
6
95%
4
6
95%
5
6
95%
8
8
8
8
8
8
242
8
242
8
242
8
242
8
242
9293
10454 11035 11035 11035
PROCESSED VARIETIES STRUCTURE
SERVICES/PRODUCTS
1st "Indica" Whitened Rice
1st "Fragrant" Whitened Rice
TOTAL
1
2
3
4
5
97,5% 96,3% 94,8% 93,0% 92,4%
2,5% 3,7% 5,2% 7,0% 7,6%
100%
100%
100%
100%
___________________________________________________________
Appendix 2
100%
___________________________________________________________ 21
MONTHLY QUANTITIES (Ton. / whitened)
SERVICES/PRODUCTS
1st "Indica" Whitened Rice
1st "Fragrant" Whitened Rice
"Indica" Broken rice
"Fragrant" Broken rice
Bran
TOTAL
1
415
10
91
3
39
2
478
17
84
5
44
3
497
25
87
8
46
4
488
33
86
11
46
5
484
36
85
12
46
558
628
663
663
664
1
212$00
708$00
120$00
120$00
35$00
2
239$00
626$00
114$00
114$00
33$00
3
239$00
529$00
104$00
104$00
30$00
4
239$00
529$00
104$00
104$00
30$00
Unit:dollars
5
239$00
529$00
104$00
104$00
30$00
1
88 188$00
6 858$00
10 873$00
395$00
1 355$00
2
114 295$00
10 376$00
9 592$00
620$00
1 452$00
3
118 706$00
13 177$00
9 057$00
846$00
1 393$00
4
116 494$00
17 645$00
8 888$00
1 133$00
1 393$00
Unit:dollars
5
115 698$00
19 252$00
8 827$00
1 236$00
1 393$00
107 669$00
136 335$00
143 178$00
145 553$00
146 407$00
1
1 058 256$00
82 297$00
130 471$00
4 739$00
16 262$00
2
1 371 543$00
124 517$00
115 106$00
7 434$00
17 424$00
3
1 424 467$00
158 121$00
108 679$00
10 152$00
16 720$00
4
1 397 923$00
211 742$00
106 654$00
13 595$00
16 720$00
Unit:dollars
5
1 388 378$00
231 022$00
105 926$00
14 833$00
16 720$00
1 292 026$00
1 636 024$00
1 718 140$00
1 746 634$00
1 756 879$00
UNIT PRICE (USD/TON)
SERVICES/PRODUCTS
1st "Indica" Whitened Rice
1st "Fragrant" Whitened Rice
"Indica" Broken rice
"Fragrant" Broken rice
Bran
TOTAL
MONTHLY PROVISIONAL PROFITS
SERVICES/PRODUCTS
1st "Indica" Whitened Rice
1st "Fragrant" Whitened Rice
"Indica" Broken rice
"Fragrant" Broken rice
Bran
TOTAL
ANNUAL PROVISIONAL PROFITS
SERVICES/PRODUCTS
1st "Indica" Whitened Rice
1st "Fragrant" Whitened Rice
"Indica" Broken rice
"Fragrant" Broken rice
Bran
TOTAL
___________________________________________________________
Appendix 2
___________________________________________________________ 22
2. Costs
PURCHASES: QUANTITIES (Ton.)
1
755
19
2
839
32
3
872
48
4
855
64
Unit: Ton.
5
850
70
774
871
920
920
920
1
72$00
201$00
2
69$00
183$00
3
63$00
152$00
4
63$00
152$00
Unit:dollars
5
63$00
152$00
273$00
252$00
215$00
215$00
1
54 677$00
3 889$00
2
57 886$00
5 823$00
3
54 654$00
7 290$00
4
53 636$00
9 762$00
Unit:dollars
5
53 270$00
10 651$00
58 567$00
63 709$00
61 944$00
63 398$00
63 920$00
1
656 130$00
46 671$00
2
694 631$00
69 881$00
3
655 850$00
87 479$00
4
643 629$00
117 144$00
Unit:dollars
5
639 235$00
127 810$00
702 800$00
764 512$00
743 329$00
760 773$00
767 045$00
SERVICES/PRODUCTS
"Indica" Paddy Rice
"Fragrant" Paddy Rice
TOTAL
UNIT COST ($/Ton.)
SERVICES/PRODUCTS
"Indica" Paddy Rice
"Fragrant" Paddy Rice
TOTAL
215$00
MONTHLY PURCHASES OF GOODS FOR RESALE
SERVICES/PRODUCTS
"Indica" Paddy Rice
"Fragrant" Paddy Rice
TOTAL
ANNUAL PURCHASES OF GOODS FOR RESALE
SERVICES/PRODUCTS
"Indica" Paddy Rice
"Fragrant" Paddy Rice
TOTAL
___________________________________________________________
Appendix 2
___________________________________________________________ 23
MONTHLY EXTERNAL CHARGES FOR SERVICES
1
2
3
4
Unit:dollars
5
1 105$00
585$00
176$00
117$00
7 464$00
117$00
1 116$00
591$00
177$00
118$00
7 538$00
118$00
1 128$00
597$00
179$00
119$00
7 614$00
119$00
1 139$00
603$00
181$00
121$00
7 690$00
121$00
1 150$00
609$00
183$00
122$00
7 767$00
122$00
234$00
351$00
1 453$00
150$00
200$00
2 223$00
585$00
117$00
585$00
15 462$00
236$00
355$00
1 467$00
152$00
202$00
2 245$00
591$00
118$00
591$00
15 616$00
239$00
358$00
1 482$00
153$00
204$00
2 268$00
597$00
119$00
597$00
15 772$00
241$00
362$00
1 497$00
155$00
206$00
2 290$00
603$00
121$00
603$00
15 930$00
244$00
365$00
1 512$00
156$00
208$00
2 313$00
609$00
122$00
609$00
16 089$00
ECS
Subcontracts
Electricity
Fuels
Water
Fast weathering tools and utensiles
Packages (1 and 50 kg sacks)
Office Supplies
Rents and hirings
Communication
Accountancy postage
Insurance
Dislocations and stays
Fees and commissions
Maintenance and Repair
Publicity and propaganda
Cleaning, hygene and comfort
Other ECSs
TOTAL
ANNUAL ECS
ECS
Subcontracts
Electricity
Fuels
Water
Fast weathering tools and utensiles
Packages (1 and 50 kg sacks)
Office Supplies
Rents and hirings
Communication
Accountancy postage
Insurance
Dislocations and stays
Fees and commissions
Maintenance and Repair
Publicity and propaganda
Cleaning, hygene and comfort
Other ECSs
TOTAL
1
2
3
4
Unit:dollars
5
13 265$00
7 020$00
2 106$00
1 404$00
89 565$00
1 404$00
13 397$00
7 090$00
2 127$00
1 418$00
90 461$00
1 418$00
13 531$00
7 161$00
2 148$00
1 432$00
91 365$00
1 432$00
13 667$00
7 233$00
2 170$00
1 447$00
92 279$00
1 447$00
13 803$00
7 305$00
2 192$00
1 461$00
93 202$00
1 461$00
2 808$00
4 212$00
17 435$00
1 800$00
2 400$00
26 676$00
7 020$00
1 404$00
7 020$00
185 538$00
2 836$00
4 254$00
17 609$00
1 818$00
2 424$00
26 943$00
7 090$00
1 418$00
7 090$00
187 394$00
2 864$00
4 297$00
17 785$00
1 836$00
2 448$00
27 212$00
7 161$00
1 432$00
7 161$00
189 268$00
2 893$00
4 340$00
17 963$00
1 855$00
2 473$00
27 484$00
7 233$00
1 447$00
7 233$00
191 160$00
2 922$00
4 383$00
18 142$00
1 873$00
2 497$00
27 759$00
7 305$00
1 461$00
7 305$00
193 072$00
___________________________________________________________
Appendix 2
___________________________________________________________ 24
MONTHLY COSTS WITH STAFF
1
2
3
4
Unit:dollars
5
GM+CM+FM+PM
- Fees
- Chargers
5 304$00
5 100$00
204$00
5 357$00
5 151$00
206$00
5 411$00
5 203$00
208$00
5 465$00
5 255$00
210$00
5 519$00
5 307$00
212$00
100 Workers+2Extens.
- Fees
- Expenses
16 900$00
16 250$00
650$00
17 069$00
16 413$00
657$00
17 069$00
16 413$00
657$00
17 240$00
16 577$00
663$00
21 765$00
20 928$00
837$00
Adminitrative Staff(10)
- Fees
- Expenses
1 560$00
1 500$00
60$00
1 576$00
1 515$00
61$00
1 591$00
1 530$00
61$00
1 607$00
1 545$00
62$00
2 029$00
1 951$00
78$00
23 764$00
24 002$00
24 071$00
24 312$00
29 314$00
1
2
3
4
Unit:dollars
5
GM+CM+FM+PM
- Fees
- Chargers
63 648$00
61 200$00
2 448$00
64 284$00
61 812$00
2 472$00
64 927$00
62 430$00
2 497$00
65 577$00
63 054$00
2 522$00
66 232$00
63 685$00
2 547$00
100 Workers+2Extens.
- Fees
- Expenses
202 800$00
195 000$00
7 800$00
204 828$00
196 950$00
7 878$00
204 828$00
196 950$00
7 878$00
206 876$00
198 920$00
7 957$00
261 181$00
251 136$00
10 045$00
Adminitrative Staff(10)
- Fees
- Expenses
18 720$00
18 000$00
720$00
18 907$00
18 180$00
727$00
19 096$00
18 362$00
734$00
19 287$00
18 545$00
742$00
24 350$00
23 414$00
937$00
285 168$00
288 020$00
288 852$00
291 740$00
351 764$00
1
1 020$00
1 625$00
150$00
2 795$00
2
1 030$00
1 641$00
152$00
2 823$00
3
1 041$00
1 641$00
153$00
2 835$00
4
1 051$00
1 658$00
155$00
2 863$00
Unit:dollars
5
1 061$00
2 093$00
195$00
3 349$00
3
156$00
492$00
46$00
694$00
4
158$00
497$00
46$00
701$00
Unit:dollars
5
159$00
628$00
59$00
846$00
STAFF
TOTAL
ANNUAL COSTS WITH STAFF
STAFF
TOTAL
MONTHLY Income Tax
Rate
20,00%
10,00%
10,00%
STAFF
GM+CM+FM+PM
100 Workers+2Extens.
Adminitrative Staff(10)
Total
INSTITUTO NACIONAL SEGURANÇA SOCIAL
Rate
3,00%
3,00%
3,00%
STAFF
GM+CM+FM+PM
100 Workers+2Extens.
Adminitrative Staff(10)
Total
1
153$00
488$00
45$00
686$00
2
155$00
492$00
45$00
692$00
___________________________________________________________
Appendix 2
___________________________________________________________ 25
DEPRECIATION TABLE
DESIGNATION
VALUE
DEPRECIATION
RATE
1
2
3
4
5
I - FIXED PHYSICAL ASSETS
Facility Recovery, Bascule, Compressed Air,
Electrical Installation
Productive Equipment (12.000 Ton./year)
Racks, Pallet Carrier, Pallet Truck
1 Heavy Truck (8 Ton.), 2 Vans (3,5 Ton.)
Administrative Equipment
275 000$00
600 000$00
55 000$00
150 000$00
60 000$00
4,00%
12,50%
12,50%
25,00%
20,00%
11 000$00
75 000$00
6 875$00
37 500$00
12 000$00
11 000$00
75 000$00
6 875$00
37 500$00
12 000$00
11 000$00
75 000$00
6 875$00
37 500$00
12 000$00
11 000$00
75 000$00
6 875$00
37 500$00
12 000$00
11 000$00
75 000$00
6 875$00
II - FIXED NON PHYSICAL ASSETS
Licences, Charters
Company Constitution
Professional Training Plan Implementation
Feasibility Study
Marketing Plan Implementation
2 500$00
2 500$00
20 000$00
10 000$00
12 500$00
33,33%
33,33%
33,33%
33,33%
33,33%
833$00
833$00
6 667$00
3 333$00
4 167$00
833$00
833$00
6 667$00
3 333$00
4 167$00
833$00
833$00
6 667$00
3 333$00
4 167$00
158 208$00
158 208$00
158 208$00
142 375$00
104 875$00
TOTAL ( I+II )
1 187 500$00
___________________________________________________________
Appendix 2
12 000$00
___________________________________________________________ 26
3. Provisional Operational Account of the projected company
PREVISIONAL OPERATIONAL ACCOUNT OF THE PROJECT
Unit:dollars
ITEMS
1
2
3
4
5
1.Net Sales
1.1.Internal Market
1.2.External Market
2.Other Profits
2.1.Services Rendered
2.2.Other
3.Output Variation
1 292 026$00
1 292 026$00
1 636 024$00
1 636 024$00
1 718 140$00
1 718 140$00
1 746 634$00
1 746 634$00
1 756 879$00
1 756 879$00
4.Total
1 292 026$00
1 636 024$00
1 718 140$00
1 746 634$00
1 756 879$00
702 800$00
764 512$00
743 329$00
760 773$00
767 045$00
185 538$00
22 391$00
187 394$00
22 615$00
189 268$00
22 841$00
191 160$00
23 069$00
193 072$00
23 300$00
2 808$00
17 435$00
2 400$00
7 020$00
133 485$00
129$00
2 836$00
17 609$00
2 424$00
7 090$00
134 820$00
164$00
2 864$00
17 785$00
2 448$00
7 161$00
136 168$00
172$00
2 893$00
17 963$00
2 473$00
7 233$00
137 530$00
175$00
2 922$00
18 142$00
2 497$00
7 305$00
138 905$00
176$00
129$00
285 168$00
25 841$00
158 208$00
164$00
288 020$00
32 720$00
158 208$00
172$00
288 852$00
34 363$00
158 208$00
175$00
291 740$00
34 933$00
142 375$00
176$00
351 764$00
35 138$00
104 875$00
1 357 685$00
1 431 018$00
1 414 191$00
1 421 155$00
1 452 069$00
15.Operational Profit of the Exercise
- 65 659$00
205 006$00
303 948$00
325 478$00
304 810$00
16.Financial Costs
16.1.of Operational Nature
16.2.of Financing Nature
17.Extraordinary Costs and Losses
18.Profit Previous to Taxes
19.Provisions for Taxes on Profits
146 757$00
54 210$00
92 547$00
149 886$00
57 338$00
92 547$00
140 585$00
55 750$00
84 835$00
111 044$00
57 058$00
53 986$00
80 665$00
57 528$00
23 137$00
- 212 416$00
55 120$00
163 364$00
2 124$00
214 435$00
75 052$00
224 145$00
78 451$00
- 212 416$00
55 120$00
161 240$00
139 382$00
145 694$00
5.Cost of the Consumed National Stocks
6.Cost of the Consumed Imported Stocks
7.Subcontracts
8.Other External Charges for Services
8.1.Electricity/Water/Fuels
8.2.Rent
8.3.Communications
8.4.Insurance
8.5.Commissions
8.6.Publicity and Propaganda
8.5. Various External Charges for Services
9.Taxes
9.1.Direct
9.2.Indirect
10.Costs with Staff
11.Others Cost and Expenses
12.Depreciation and Reinsertion
13.Provisions
14.Total
20.Net Profit
___________________________________________________________
Appendix 2
___________________________________________________________ 27
4.
Indicators of profitability
PROJECT CASH-FLOWS
Unit:dollars
ITEMS
1
Total Annual Investment (1)
1 322 102$00
2
33 437$00
3
4
7 625$00
Investment Residual Value (2)
Operational Cash-Flow (3)
5
641 289$00
38 339$00
305 876$00
404 283$00
335 743$00
273 706$00
-1 283 763$00
272 439$00
396 658$00
335 743$00
914 995$00
33 929$00
305 876$00
404 283$00
335 743$00
273 706$00
-1 136 073$00
54 731$00
-1 136 073$00
12
213 360$00
274 904$00
205 918$00
496 623$00
- 922 713$00
12
- 647 809$00
12
- 441 892$00
12
54 731$00
11
Cash-Flow Previous to the Project (4)
Project's Cash-Flow (3+2-1-4)
Present Value of Operational CF
Present Value of CF
NPV
Accumulated CF
IRP
PROJECT FINANCIAL INDICATORS
Net Present Value of the Project (NPV)
54 731$00
Internal Rentability Rate (IRR)
14,90%
Profitability Index (PI)
113,98%
Investment Recovery Period (IRP) - Months
59
___________________________________________________________
Appendix 2
___________________________________________________________ 28
5. Sensitivity analysis
SENSITIVITY ANALYSIS
Variation
-10%
-5%
10%
5%
Calculated
Indicator
V.A.L.
T.I.R.
V.A.L.
T.I.R.
V.A.L.
T.I.R.
V.A.L.
T.I.R.
Sale
Price
- 484 298$00
-0,9%
- 215 315$00
6,6%
486 732$00
29,0%
276 606$00
21,8%
Unit:dollars
CRITICAL PARAMETERS CONSIDERED
Cost
Investment
Sales
Level
Cost
Level
413 258$00
123 925$00
- 161 907$00
26,6%
17,2%
8,1%
239 256$00
92 789$00
- 49 296$00
20,6%
16,0%
11,5%
- 387 585$00
- 19 366$00
236 589$00
1,9%
12,5%
20,4%
- 167 678$00
21 975$00
149 120$00
8,0%
13,6%
17,6%
___________________________________________________________
Appendix 2
___________________________________________________________ 29
6. Economic Indicators
COMPANY COSTS' STRUCTURE
ITEMS
Total Profits
Consumed Stocks
Subcontracts
ECSs
Taxes
Costs with Staff
Other Costs and Expenses
Depreciation and Reinsertion Provisions
Provisions
Financial Costs of Operational Nature
Financial Costs of Financing Nature
Net Profit
1
2
3
4
5
1 292 026$00
54,40%
1 636 024$00
46,73%
1 718 140$00
43,26%
1 746 634$00
43,56%
1 756 879$00
43,66%
14,36%
0,01%
22,07%
2,00%
12,24%
11,45%
0,01%
17,60%
2,00%
9,67%
11,02%
0,01%
16,81%
2,00%
9,21%
10,94%
0,01%
16,70%
2,00%
8,15%
10,99%
0,01%
20,02%
2,00%
5,97%
4,20%
7,16%
-16,44%
3,50%
5,66%
3,37%
3,24%
4,94%
9,38%
3,27%
3,09%
7,98%
3,27%
1,32%
8,29%
Financial Costs of Financing
ESTRUTURA DE CUSTOS Nature
Financial Costs of
Operational Nature
140,00%
Provisions
120,00%
Depreciation and Reinsertion
Provisions
100,00%
Other Costs and Expenses
80,00%
Costs with Staff
60,00%
Taxes
40,00%
ECSs
20,00%
Subcontracts
0,00%
1
2
3
4
5
Consumed Stocks
COMPANY'S GROSS SALES MARGIN
ITEMS
Sales
Purchases of Goods for Resale
Gross Margin
Unit:dollars
1
2
3
4
5
1 292 026$00
702 800$00
45,60%
1 636 024$00
764 512$00
53,27%
1 718 140$00
743 329$00
56,74%
1 746 634$00
760 773$00
56,44%
1 756 879$00
767 045$00
56,34%
___________________________________________________________
Appendix 2
___________________________________________________________ 30
COMPANY'S BREAK EVEN POINT
ITEM
Sales Volume
Variable Costs
Margin
Margin (%)
Fixed Costs
Break Even point
Safety Margin
1
2
3
4
5
1 292 026$00
897 690$00
394 336$00
30,52%
606 752$00
1 987 999$00
-53,87%
1 636 024$00
970 592$00
665 432$00
40,67%
610 312$00
1 500 506$00
8,28%
1 718 140$00
950 629$00
767 511$00
44,67%
604 147$00
1 352 435$00
21,28%
1 746 634$00
971 124$00
775 510$00
44,40%
561 076$00
1 263 676$00
27,65%
1 756 879$00
979 254$00
777 625$00
44,26%
553 480$00
1 250 470$00
28,82%
CRITICAL POINT
2 500 000$00
2
2 500
000 000$00
000$00
2 000 000$00
1 500 000$00
1 500 000$00
1 000 000$00
1 000 000$00
500 000$00
500 000$00
$00
1
2
3
4
5
GROSS VALUE ADDED (GVA) AND COMPANY'S PRODUCTIVITY
Unit:dollars
ITEM
Costs with Staff
Financial Costs
Depreciation
Net Profit
GVA
No. of workers
Employees Total Productivity
Assets Total Productivity
1
2
3
4
5
285 168$00
146 757$00
158 208$00
- 212 416$00
377 717$00
116
3 256$00
31,46%
288 020$00
149 886$00
158 208$00
55 120$00
651 234$00
116
5 614$00
52,67%
288 852$00
140 585$00
158 208$00
161 240$00
748 885$00
116
6 456$00
68,77%
291 740$00
111 044$00
142 375$00
139 382$00
684 541$00
116
5 901$00
68,83%
351 764$00
80 665$00
104 875$00
145 694$00
682 998$00
116
5 888$00
81,57%
1
2
3
4
5
38 339$00
-179,85%
45,60%
-16,44%
2,97%
3,19%
-5,47%
305 876$00
31,82%
53,27%
3,37%
18,70%
24,74%
16,58%
404 283$00
48,21%
56,74%
9,51%
23,53%
37,12%
27,91%
335 743$00
29,41%
56,44%
12,28%
19,22%
33,76%
32,72%
273 706$00
23,52%
56,34%
12,76%
15,58%
32,69%
36,40%
COMPANY'S ECONOMIC RATIOS
ITEM
Operational Released Resources
Equity Profitability
Sales Gross Profitability
Sales Net Profitability
Sales Operational Profitability
Assets Economic Profitability
Assets Profitability
___________________________________________________________
Appendix 2
___________________________________________________________ 31
7. Forecast balance sheet
FORECAST BALANCE SHEET
Unit:dollars
ITEMS
1
2
3
4
5
1 187 500$00
47 500$00
1 140 000$00
1 187 500$00
47 500$00
1 140 000$00
1 187 500$00
47 500$00
1 140 000$00
1 187 500$00
47 500$00
1 140 000$00
1 187 500$00
47 500$00
1 140 000$00
158 208$00
316 417$00
474 625$00
617 000$00
721 875$00
58 567$00
107 669$00
107 669$00
63 709$00
136 335$00
136 335$00
61 944$00
143 178$00
143 178$00
63 398$00
145 553$00
145 553$00
63 920$00
146 407$00
146 407$00
5 018$00
165 302$00
170 984$00
215 148$00
161 326$00
1 200 545$00
1 236 430$00
1 088 981$00
994 599$00
837 278$00
330 525$00
330 525$00
330 525$00
330 525$00
330 525$00
- 212 416$00
- 212 416$00
55 120$00
- 157 296$00
161 240$00
3 944$00
139 382$00
143 327$00
145 694$00
118 109$00
173 229$00
334 470$00
473 852$00
619 547$00
991 576$00
925 471$00
66 105$00
991 576$00
925 471$00
66 105$00
683 086$00
616 981$00
66 105$00
374 596$00
308 490$00
66 105$00
66 105$00
90 859$00
20 000$00
63 447$00
7 412$00
71 624$00
71 426$00
146 151$00
151 627$00
64 138$00
7 486$00
61 797$00
9 629$00
63 519$00
82 632$00
63 964$00
87 663$00
19.Total Liabilities
1 082 436$00
1 063 200$00
754 512$00
520 747$00
217 732$00
20.Total Liabilities+ Equity
1 200 545$00
1 236 430$00
1 088 981$00
994 599$00
837 278$00
ASSETS
1.Gross Fixed Assets
1.1.Non - Physical
1.2.Physical
1.3.Financial
2.Depreciation and Reinsertion
3.Mid and Long Term Current Assets
4.Stocks
5.Short Term Current Assets
5.1.Clients
5.2.Other Debtors
6.Bank Deposits/Cash/Negotionable Assets
7.Prepayments and Deferred Income
8.Total Assets
EQUITY
9.Capital
10.Suplementary Instalments
11.Reserves / Unappropriated Earned Surplus
12.Net Profit
13.Interim Dividends
14.Total Equity
LIABILITIES
15.Provisions for Risks and Costs
16.Mid and Long Term Debts
16.1.Bank Loans
16.2.Partners' Loans
16.3.Other Debts
17.Short Term Debt
17.1.Bank Loans
17.2.Suppliers
17.3.Public Statal Sector
17.4.Other Debts
18.Prepayments and Deferred Income
___________________________________________________________
Appendix 2
66 105$00
___________________________________________________________ 32
8. Financial Indicators
COMPANY'S FINANCIAL RATIOS
ITEMS
Debt
Debt Recovery Period
Liability Average Cost
Financial Autonomy
Solvency
1
2
3
4
5
10,91%
-18,66
13,56%
9,84%
10,91%
16,29%
4,65
14,10%
14,01%
16,29%
44,33%
2,14
18,63%
30,71%
44,33%
90,99%
1,33
21,32%
47,64%
90,99%
284,55%
0,26
37,05%
74,00%
284,55%
SOLVENCY
FINANCIAL AUTONOMY
300,00%
80,00%
250,00%
60,00%
200,00%
150,00%
40,00%
100,00%
20,00%
50,00%
0,00%
0,00%
1
2
3
4
5
1
2
3
4
COMPANY'S LIQUIDITY RATIOS
RÚBRICA
General Liquidity
Reduced Liquidity
Immediate Liquidity
1
2
3
4
5
1,88
1,24
0,06
5,10
4,21
2,31
5,27
4,40
2,39
2,90
2,47
1,47
2,45
2,03
1,06
LIQUIDITY
6,00
5,00
4,00
General Liquidity
Reduced Liquidity
Immediate Liquidity
3,00
2,00
1,00
0,00
1
2
3
4
5
OTHER COMPANY INDICATORS
ITEMS
Average Receiving Period (days)
Average Payment Period (days)
Assets Rotation
Stocks Rotation (days)
Costs with Staff/ Sales
Wage Productivity
Share of Fixed Assets Covered by Equity
1
30
33
107,62%
30
22,07%
132,45%
9,95%
2
30
31
132,32%
30
17,60%
226,11%
14,59%
3
30
30
157,77%
30
16,81%
259,26%
28,17%
4
30
30
175,61%
30
16,70%
234,64%
39,90%
5
30
30
209,83%
30
20,02%
194,16%
52,17%
___________________________________________________________
Appendix 2
5
___________________________________________________________ 33
COMPANY SCHEMATIC BALANCE
Unit:dollars
RÚBRICA
Permanent Capital
Net Fixed Assets
Net Current Assets
Cyclical Needs
Cyclical Resources
Net Current Assets Needs
Active Treasury
Passive Treasury
Treasury
1
2
3
4
5
1 109 686$00
1 029 292$00
80 394$00
166 235$00
70 859$00
95 376$00
5 018$00
20 000$00
- 14 982$00
1 164 806$00
871 083$00
293 722$00
200 045$00
71 624$00
128 421$00
165 302$00
1 017 555$00
712 875$00
304 680$00
205 122$00
71 426$00
133 696$00
170 984$00
848 448$00
570 500$00
277 948$00
208 951$00
146 151$00
62 799$00
215 148$00
685 652$00
465 625$00
220 027$00
210 327$00
151 627$00
58 700$00
161 326$00
165 302$00
170 984$00
215 148$00
161 326$00
$00
$00
Treasury Control
TREASURY
350 000$00
300 000$00
250 000$00
200 000$00
150 000$00
100 000$00
50 000$00
$00
- 50 000$00
FM
NFM
TESOURARIA
1
2
3
4
5
___________________________________________________________
Appendix 2
___________________________________________________________ 34
SCENARIO 2 - REALISTISC
NOTE: Only the altered tables are shown
1. Benefits
MONTHLY QUANTITIES (Ton. / whitened)
SERVICES/PRODUCTS
1st "Indica" Whitened Rice
1st "Fragrant" Whitened Rice
"Indica" Broken rice
"Fragrant" Broken rice
Bran
TOTAL
1
415
10
91
3
39
2
478
17
84
5
44
3
497
25
87
8
46
4
488
33
86
11
46
5
484
36
85
12
46
558
628
663
663
664
1
239$00
708$00
120$00
120$00
35$00
2
252$00
626$00
114$00
114$00
33$00
3
252$00
529$00
104$00
104$00
30$00
4
252$00
529$00
104$00
104$00
30$00
Unit:dollars
5
252$00
529$00
104$00
104$00
30$00
1
99 211$00
6 858$00
10 873$00
395$00
1 355$00
118 692$00
2
120 645$00
10 376$00
9 592$00
620$00
1 452$00
142 685$00
3
125 300$00
13 177$00
9 057$00
846$00
1 393$00
149 773$00
4
122 965$00
17 645$00
8 888$00
1 133$00
1 393$00
152 025$00
Unit:dollars
5
122 126$00
19 252$00
8 827$00
1 236$00
1 393$00
152 834$00
1
1 190 538$00
82 297$00
130 471$00
4 739$00
16 262$00
2
1 447 740$00
124 517$00
115 106$00
7 434$00
17 424$00
3
1 503 604$00
158 121$00
108 679$00
10 152$00
16 720$00
4
1 475 585$00
211 742$00
106 654$00
13 595$00
16 720$00
Unit:dollars
5
1 465 511$00
231 022$00
105 926$00
14 833$00
16 720$00
1 424 308$00
1 712 221$00
1 797 277$00
1 824 296$00
1 834 011$00
UNIT PRICE (USD/TON)
SERVICES/PRODUCTS
1st "Indica" Whitened Rice
1st "Fragrant" Whitened Rice
"Indica" Broken rice
"Fragrant" Broken rice
Bran
TOTAL
MONTHLY PROVISIONAL PROFITS
SERVICES/PRODUCTS
1st "Indica" Whitened Rice
1st "Fragrant" Whitened Rice
"Indica" Broken rice
"Fragrant" Broken rice
Bran
TOTAL
ANNUAL PROVISIONAL PROFITS
SERVICES/PRODUCTS
1st "Indica" Whitened Rice
1st "Fragrant" Whitened Rice
"Indica" Broken rice
"Fragrant" Broken rice
Bran
TOTAL PROFITS
___________________________________________________________
Appendix 2
___________________________________________________________ 35
2. Costs
Note: There are no significant alterations, since only the assumptions
about the sales price of the final product have been changed.
3. Provisional operational account of the projected company
PREVISIONAL OPERATIONAL ACCOUNT OF THE PROJECT
Unit:dollars
ITEMS
1
2
3
4
5
1.Net Sales
1.1.Internal Market
1.2.External Market
2.Other Profits
2.1.Services Rendered
2.2.Other
3.Output Variation
1 424 308$00
1 424 308$00
1 712 221$00
1 712 221$00
1 797 277$00
1 797 277$00
1 824 296$00
1 824 296$00
1 834 011$00
1 834 011$00
4.Total
1 424 308$00
1 712 221$00
1 797 277$00
1 824 296$00
1 834 011$00
702 800$00
764 512$00
743 329$00
760 773$00
767 045$00
185 538$00
22 391$00
187 394$00
22 615$00
189 268$00
22 841$00
191 160$00
23 069$00
193 072$00
23 300$00
2 808$00
17 435$00
2 400$00
7 020$00
133 485$00
142$00
2 836$00
17 609$00
2 424$00
7 090$00
134 820$00
171$00
2 864$00
17 785$00
2 448$00
7 161$00
136 168$00
180$00
2 893$00
17 963$00
2 473$00
7 233$00
137 530$00
182$00
2 922$00
18 142$00
2 497$00
7 305$00
138 905$00
183$00
142$00
285 168$00
28 486$00
158 208$00
171$00
288 020$00
34 244$00
158 208$00
180$00
288 852$00
35 946$00
158 208$00
182$00
291 740$00
36 486$00
142 375$00
183$00
351 764$00
36 680$00
104 875$00
1 360 344$00
1 432 550$00
1 415 782$00
1 422 716$00
1 453 619$00
15.Operational Profit of the Exercise
63 964$00
279 671$00
381 495$00
401 580$00
380 392$00
16.Financial Costs
16.1.of Operational Nature
16.2.of Financing Nature
17.Extraordinary Costs and Losses
18.Profit Previous to Taxes
19.Provisions for Taxes on Profits
146 029$00
52 710$00
93 319$00
150 657$00
57 338$00
93 319$00
141 292$00
55 750$00
85 542$00
111 494$00
57 058$00
54 436$00
80 858$00
57 528$00
23 330$00
- 82 065$00
129 014$00
16 432$00
240 203$00
84 071$00
290 086$00
101 530$00
299 534$00
104 837$00
- 82 065$00
112 582$00
156 132$00
188 556$00
194 697$00
5.Cost of the Consumed National Stocks
6.Cost of the Consumed Imported Stocks
7.Subcontracts
8.Other External Charges for Services
8.1.Electricity/Water/Fuels
8.2.Rent
8.3.Communications
8.4.Insurance
8.5.Commissions
8.6.Publicity and Propaganda
8.5. Various External Charges for Services
9.Taxes
9.1.Direct
9.2.Indirect
10.Costs with Staff
11.Others Cost and Expenses
12.Depreciation and Reinsertion
14.Total
20.Net Profit
___________________________________________________________
Appendix 2
___________________________________________________________ 36
4. Indicators of Profitability
PROJECT CASH-FLOWS
Unit:dollars
ITEMS
Total Annual Investment (1)
1
2
1 333 125$00
3
28 763$00
4
Investment Residual Value (2)
Operational Cash-Flow (3)
5
7 870$00
647 883$00
169 462$00
364 109$00
399 882$00
385 367$00
322 902$00
-1 163 663$00
335 346$00
392 012$00
385 367$00
970 785$00
149 967$00
364 109$00
399 882$00
385 367$00
322 902$00
-1 029 790$00
267 775$00
-1 029 790$00
12
262 625$00
271 684$00
236 353$00
526 903$00
- 767 165$00
12
- 495 481$00
12
- 259 128$00
12
267 775$00
6
Cash-Flow Previous to the Project (4)
Project's Cash-Flow (3+2-1-4)
Present Value of Operational CF
Present Value of CF
NPV
Accumulated CF
IRP
PROJECT FINANCIAL INDICATORS
Net Present Value of the Project (NPV)
267 775$00
Internal Rentability Rate (IRR)
22,97%
Profitability Index (PI)
136,61%
Investment Recovery Period (IRP) - Mon
54
___________________________________________________________
Appendix 2
___________________________________________________________ 37
5. Sensitivity Analysis
SENSITIVITY ANALYSIS
Variation
-10%
-5%
10%
5%
Calculated
Indicator
NPV
IRR
NPV
IRR
NPV
IRR
NPV
IRR
Unit:dollars
CRITICAL PARAMETERS CONSIDERED
Sale
Cost
Investment
Sales
Price
Level
Cost
Level
- 207 220$00 647 036$00 362 806$00 104 670$00
6,7%
35,6%
26,1%
16,4%
76 691$00
475 593$00 332 604$00 204 372$00
15,4%
29,2%
24,5%
19,7%
743 562$00 - 79 711$00 241 878$00 497 280$00
39,1%
10,6%
20,3%
29,7%
524 197$00
126 275$00 272 200$00 399 841$00
30,9%
17,0%
21,6%
26,3%
6. Economic Indicators
COMPANY COSTS' STRUCTURE
ITEMS
Total Profits
Consumed Stocks
Subcontracts
ECSs
Taxes
Costs with Staff
Other Costs and Expenses
Depreciation and Reinsertion Provisions
Provisions
Financial Costs of Operational Nature
Financial Costs of Financing Nature
Net Profit
1
1 424 308$00
49,34%
2
1 712 221$00
44,65%
3
1 797 277$00
41,36%
4
1 824 296$00
41,70%
5
1 834 011$00
41,82%
13,03%
0,01%
20,02%
2,00%
11,11%
10,94%
0,01%
16,82%
2,00%
9,24%
10,53%
0,01%
16,07%
2,00%
8,80%
10,48%
0,01%
15,99%
2,00%
7,80%
10,53%
0,01%
19,18%
2,00%
5,72%
3,70%
6,55%
-5,76%
3,35%
5,45%
6,58%
3,10%
4,76%
8,69%
3,13%
2,98%
10,34%
3,14%
1,27%
10,62%
COST SRUCTURE
Financial Costs of
Financing Nature
Financial Costs of
Operational Nature
120,00%
Provisions
100,00%
80,00%
Depreciation and
Reinsertion Provisions
60,00%
Other Costs and
Expenses
Costs with Staff
40,00%
Taxes
20,00%
ECSs
0,00%
1
2
3
4
5
Subcontracts
COMPANY'S GROSS SALES MARGIN
ITEMS
Sales
Purchases of Goods for Resale
Gross Margin
1
1 424 308$00
702 800$00
50,66%
2
1 712 221$00
764 512$00
55,35%
3
1 797 277$00
743 329$00
58,64%
4
1 824 296$00
760 773$00
58,30%
___________________________________________________________
Appendix 2
Unit:dollars
5
1 834 011$00
767 045$00
58,18%
___________________________________________________________ 38
COMPANY'S BREAK EVEN POINT
ITEM
Sales Volume
Variable Costs
Margin
Margin (%)
Fixed Costs
Break Even point
Safety Margin
1
2
3
4
5
1 424 308$00
898 849$00
525 459$00
36,89%
607 524$00
1 646 752$00
-15,62%
1 712 221$00
972 123$00
740 097$00
43,22%
611 084$00
1 413 746$00
17,43%
1 797 277$00
952 219$00
845 057$00
47,02%
604 854$00
1 286 411$00
28,42%
1 824 296$00
972 685$00
851 612$00
46,68%
561 526$00
1 202 883$00
34,06%
1 834 011$00
980 804$00
853 207$00
46,52%
553 673$00
1 190 148$00
35,11%
CRITICAL POINT
1 800 000$00
1 600 000$00
1 400 000$00
1 200 000$00
1 000 000$00
800 000$00
600 000$00
400 000$00
200 000$00
$00
1
2
3
4
5
GROSS VALUE ADDED (GVA) AND COMPANY'S PRODUCTIVITY
ITEM
Costs with Staff
Financial Costs
Depreciation
Net Profit
GVA
No. of workers
Employees Total Productivity
Assets Total Productivity
Unit:dollars
1
2
3
4
5
285 168$00
146 029$00
158 208$00
- 82 065$00
507 340$00
116
4 374$00
38,38%
288 020$00
150 657$00
158 208$00
112 582$00
709 467$00
116
6 116$00
51,22%
288 852$00
141 292$00
158 208$00
156 132$00
744 484$00
116
6 418$00
57,47%
291 740$00
111 494$00
142 375$00
188 556$00
734 165$00
116
6 329$00
61,58%
351 764$00
80 858$00
104 875$00
194 697$00
732 194$00
116
6 312$00
67,72%
COMPANY'S ECONOMIC RATIOS
ITEM
Operational Released Resources
Equity Profitability
Sales Gross Profitability
Sales Net Profitability
Sales Operational Profitability
Assets Economic Profitability
Assets Profitability
1
2
3
4
5
169 462$00
-32,67%
50,66%
-5,76%
11,90%
12,82%
4,84%
364 109$00
30,95%
55,35%
7,53%
21,27%
26,29%
20,19%
399 882$00
30,03%
58,64%
13,36%
22,25%
30,87%
29,45%
385 367$00
26,61%
58,30%
15,90%
21,12%
32,32%
33,68%
322 902$00
21,56%
58,18%
16,33%
17,61%
29,87%
35,18%
___________________________________________________________
Appendix 2
___________________________________________________________ 39
6. Forecast Balance Sheet
FORECAST BALANCE SHEET
Unit:dollars
ITEMS
1
2
3
4
5
1 187 500$00
47 500$00
1 140 000$00
1 187 500$00
47 500$00
1 140 000$00
1 187 500$00
47 500$00
1 140 000$00
1 187 500$00
47 500$00
1 140 000$00
1 187 500$00
47 500$00
1 140 000$00
158 208$00
316 417$00
474 625$00
617 000$00
721 875$00
58 567$00
118 692$00
118 692$00
63 709$00
142 685$00
142 685$00
61 944$00
149 773$00
149 773$00
63 398$00
152 025$00
152 025$00
63 920$00
152 834$00
152 834$00
115 369$00
307 564$00
370 836$00
406 255$00
398 816$00
1 321 920$00
1 385 042$00
1 295 428$00
1 192 178$00
1 081 196$00
333 281$00
333 281$00
333 281$00
333 281$00
333 281$00
- 82 065$00
- 82 065$00
112 582$00
30 517$00
156 132$00
186 649$00
188 556$00
375 205$00
194 697$00
251 217$00
363 798$00
519 930$00
708 486$00
903 183$00
999 844$00
933 188$00
66 656$00
933 188$00
933 188$00
622 125$00
622 125$00
311 063$00
311 063$00
70 859$00
88 056$00
153 373$00
172 629$00
178 013$00
63 447$00
7 412$00
64 138$00
23 918$00
61 797$00
91 576$00
63 519$00
109 110$00
63 964$00
114 049$00
19.Total Liabilities
1 070 703$00
1 021 244$00
775 498$00
483 692$00
178 013$00
20.Total Liabilities+ Equity
1 321 920$00
1 385 042$00
1 295 428$00
1 192 178$00
1 081 196$00
ASSETS
1.Gross Fixed Assets
1.1.Non - Physical
1.2.Physical
1.3.Financial
2.Depreciation and Reinsertion
3.Mid and Long Term Current Assets
4.Stocks
5.Short Term Current Assets
5.1.Clients
5.2.Other Debtors
6.Bank Deposits/Cash/Negotionable Assets
7.Prepayments and Deferred Income
8.Total Assets
EQUITY
9.Capital
10.Suplementary Instalments
11.Reserves / Unappropriated Earned Surplus
12.Net Profit
13.Interim Dividends
14.Total Equity
LIABILITIES
15.Provisions for Risks and Costs
16.Mid and Long Term Debts
16.1.Bank Loans
16.2.Partners' Loans
16.3.Other Debts
17.Short Term Debt
17.1.Bank Loans
17.2.Suppliers
17.3.Public Statal Sector
17.4.Other Debts
18.Prepayments and Deferred Income
___________________________________________________________
Appendix 2
___________________________________________________________ 40
7. Financial Indicators
COMPANY'S FINANCIAL RATIOS
ITEMS
Debt
Debt Recovery Period
Liability Average Cost
Financial Autonomy
Solvency
1
81,00%
13,13
13,64%
19,00%
23,46%
2
73,73%
3,45
14,75%
26,27%
35,62%
3
59,86%
1,98
18,22%
40,14%
67,04%
4
40,57%
0,94
23,05%
59,43%
146,47%
5
16,46%
45,42%
83,54%
507,37%
SOLVENCY
FINANCIAL AUTONOMY
600,00%
100,00%
500,00%
80,00%
400,00%
60,00%
300,00%
40,00%
200,00%
20,00%
100,00%
0,00%
0,00%
1
2
3
4
5
1
2
3
4
COMPANY'S LIQUIDITY RATIOS
RÚBRICA
General Liquidity
Reduced Liquidity
Immediate Liquidity
1
2
3
4
5
4,13
3,30
1,63
5,84
5,11
3,49
3,80
3,39
2,42
3,60
3,23
2,35
3,46
3,10
2,24
LIQUIDITY
7,00
6,00
5,00
4,00
3,00
2,00
1,00
0,00
General Liquidity
Reduced Liquidity
Immediate Liquidity
1
2
3
4
5
OTHER COMPANY INDICATORS
ITEMS
Average Receiving Period (days)
Average Payment Period (days)
Assets Rotation
Stocks Rotation (days)
Costs with Staff/ Sales
Wage Productivity
Share of Fixed Assets Covered by Equity
1
2
3
4
5
30
33
107,75%
30
20,02%
177,91%
21,16%
30
31
123,62%
30
16,82%
246,33%
30,64%
30
30
138,74%
30
16,07%
257,74%
43,78%
30
30
153,02%
30
15,99%
251,65%
59,66%
30
30
169,63%
30
19,18%
208,15%
76,06%
___________________________________________________________
Appendix 2
5
___________________________________________________________ 41
COMPANY SCHEMATIC BALANCE
Unit:dollars
RÚBRICA
Permanent Capital
Net Fixed Assets
Net Current Assets
Cyclical Needs
Cyclical Resources
Net Current Assets Needs
Active Treasury
Passive Treasury
Treasury
1
2
3
4
5
1 251 061$00
1 029 292$00
221 769$00
177 259$00
70 859$00
106 400$00
115 369$00
1 296 986$00
871 083$00
425 903$00
206 394$00
88 056$00
118 338$00
307 564$00
1 142 055$00
712 875$00
429 180$00
211 717$00
153 373$00
58 344$00
370 836$00
1 019 548$00
570 500$00
449 048$00
215 422$00
172 629$00
42 793$00
406 255$00
903 183$00
465 625$00
437 558$00
216 755$00
178 013$00
38 742$00
398 816$00
115 369$00
307 564$00
370 836$00
406 255$00
398 816$00
Treasury Control
TREASURY
450 000$00
400 000$00
350 000$00
300 000$00
250 000$00
200 000$00
150 000$00
100 000$00
50 000$00
$00
FM
NFM
TESOURARIA
1
2
3
4
5
___________________________________________________________
Appendix 2
___________________________________________________________ 42
Appendices
1.
Formation of agricultural and agro-industrial prices (with
implementation of the strategy defined for the agricultural
sector). Their evolution.
Year 1
RICE CHAIN VALUE, MOZAMBIQUE - VIETNAM
MOZAMBIQUE
Unit Costs
Obs.
Production
1. Mechanical Ploughing
2. Seed
3. Fertilizer (urea+NPK )
4. Herbicides
5. Water (irrigation)
6. Packaging materials
7. Mechanical Harvest
8. Labour
9. Transportation
10. Financial Costs
11. Taxes
12. Profit (1)
Paddy Rice Sale Price
Transformation
1. Transformation Cost
2. Transformation Losses (income)
3. Packaging materials
4. Bran Sales Revenue
5. Broken Rice Sales Revenue
6. Transportation
7. Financial Costs (USD fee for net current assets)
8. Taxes
9. Other Costs and Losses (2)
10. Profit
Final Sale Price (to the wholesaler) (PrMoc)
FOB Price Vietnam: 25%
Cif Maputo
Harbour Costs
Import Fees
Financial Costs (usd)
Transportation Harbour-Warehouse
Warehouse Entrance Price (PrInt)
SAFETY MARGIN (PrInt - PrMoc)
(competitiviness)
Entrepreneurial Sector
Household Sector
Ton/HA =
4
Ton/HA =
1,5
(usd/Ha)
(Ton. paddy)
(usd/Ha)
(Ton. paddy)
51
12,7
18,0
12,0
25
6,3
12,5
8,3
98
24,6
113,2
75,5
13
3,1
12,5
8,3
10
2,5
10,0
6,7
2
0,5
2,0
1,3
7
1,8
0,0
0,0
30
7,5
58,0
38,7
25
6,3
45,0
30,0
0,0%
0
0,0
0
0,0
0
0,0
0
0,0
10,0%
29
7,2
30
20,1
290
72,4
200,9
(Ton. Milled)
18,0
18,0
55,0%
59,3
50,0%
200,9
4,0
4,0
5,0%
35
0,0
5,0%
0,0
12,0%
120
0,0
17,0%
0,0
5,0
5,0
15,0%
7,1
15,0%
16,7
35,0%
64,5
35,0%
173,2
5,0%
7,5
5,0%
21,0
10,0%
25,6
10,0%
68,7
263,3
708,5
25-10-2002
60
168,0
228,0
7,50%
9,0
17,1
15% 60 dias
NORMAL
USD
USD
%
6,4
5
265,5
2,2
0,8%
VIETNAM
Unit
(usd/Ha)
Obs.
Unit Cost
(usd/Ton.)
Cost Differential
(Vietnam/ Mz.Ent.Sector)
(usd/Ton.) (% s/ Moç.)
3,5
(Ton. paddy)
37
41
11
14
20
129
0,0%
10,0%
21
0
42
315
(Ton. Milled)
50,0%
5,0%
17,0%
35
120
15,0%
0,0%
5,0%
10,0%
-20,0%
FOB Price India:
"Basmati"
25-10-2002
Cif Maputo
60
Harbour Costs
aromatic
Import Fees
7,50%
Financial Costs
(usd)
15% 60 dias
Transportation
HarbourWarehouse
Warehouse Entrance Price (PrInt - PrMoc)
USD
%
AROMATIC
0,0
10,6
11,7
3,1
4,0
0,0
5,7
36,9
30,0
6,0
0,0
12,0
120,0
-12,7
4,3
-12,9
0,0
1,5
-0,5
3,9
29,4
23,8
6,0
0,0
4,8
47,6
-100,0%
69,1%
-52,4%
0,6%
60,0%
-100,0%
217,5%
391,4%
380,0%
-
8,0
120,0
4,0
0,0
0,0
7,0
7,9
0,0
12,4
29,7
309,0
-10,0
60,8
0,0
0,0
0,0
2,0
0,8
-64,5
4,9
4,1
45,7
-55,6%
102,5%
0,0%
0,0%
0,0%
40,0%
11,8%
-100,0%
65,7%
15,9%
17,4%
680,0
740,0
9,0
55,5
20,1
5
829,6
121,1
17,1%
OBSERVAÇÕES:
1 - Source: Study Competir, Agrimo w/ my own and Mr. Castro's adjustments www.oryza.com
2 - Check Unit Costs with the Team
3 - Measures have been introduced in order to reduce: agrochemical costs, sements; Machinery Cost; Labour Cost; income taxes.
4 - The 66% factory income is the one obtained in the Asian countries, assuming that similar modern technology is adopted by the Conhane Factory, and it may reach 70%.
5 - The following are not contemplated: 2nd Rice Harvest; transplant; effects of the "chemical" project of quantity acquisition; Madagascar technology (reaching 8/10 Ton./Ha).
6 - The following are not contemplated yet: effects from the State compensations for the use of the Silos as Food Stock; State interest bonus; proteccionist customs measures.
7 - The Household Sector should bet on the aromatic varieties, which tecnologies - resourcing less to herbice and machinery and with less income/Ha - are, in this case, compatible
with the market Valorisation, which can even triple.
8 - The gains from sub-products - food oil from the husk; boards produced from the rice straws - exploitation are not contemplated.
(1) - Assuming that the household farmers obtain their "profit" through their labour remuneration, this one already contemplated.
(2) - This item includes administrative, management and commercial costs, as well as "unexplainable" product losses.
___________________________________________________________
Appendix 2
65,7%
65,7%
___________________________________________________________ 43
YEAR 5
RICE CHAIN VALUE, MOZAMBIQUE - VIETNAM
MOZAMBIQUE
Unit Costs
Obs.
Production
1. Mechanical Ploughing
2. Seed
3. Fertilizer (urea+NPK )
4. Herbicides
5. Water (irrigation)
6. Packaging materials
7. Mechanical Harvest
8. Labour
9. Transportation
10. Financial Costs
11. Taxes
12. Profit (1)
Paddy Rice Sale Price
Transformation
1. Transformation Cost
2. Transformation Losses (income)
3. Packaging materials
4. Bran Sales Revenue
5. Broken Rice Sales Revenue
6. Transportation
7. Financial Costs (USD fee for net current assets)
8. Taxes
9. Other Costs and Losses (2)
10. Profit
Entrepreneurial Sector
Household Sector
Ton/HA =
5,3
Ton/HA =
2,6
(usd/Ha)
(Ton. paddy)
(usd/Ha)
(Ton. paddy)
51
9,5
18,0
6,9
25
4,7
12,5
4,8
98
18,4
113,2
43,3
13
2,3
12,5
4,8
10
1,9
10,0
3,8
2
0,4
2,0
0,8
7
1,3
0,0
0,0
30
5,6
58,0
22,2
25
4,7
45,0
17,2
0,0%
0
0,0
0
0,0
0
0,0
0
0,0
10,0%
29
5,4
30
11,5
290
54,3
115,3
5,0%
10,0%
26
90
15,0%
35,0%
5,0%
10,0%
203,1
25-10-2002
60
168,0
228,0
7,50%
17,1
Harbour Costs
Import Fees
Financial Costs (usd)
Transportation Harbour-Warehouse
Warehouse Entrance Price (PrInt)
SAFETY MARGIN (PrInt - PrMoc)
(competitiviness)
18,0
41,0
4,0
0,0
0,0
5,0
5,7
49,8
5,7
19,7
9,0
15% 60 dias
NORMAL
USD
USD
%
6,4
5
265,5
62,3
30,7%
52,0%
5,0%
17,0%
15,0%
35,0%
5,0%
10,0%
Unit Cost
(usd/Ton.)
Diferença de Custos
(Vietname p/ Moç.S.Emp.)
(usd/Ton.) (% s/ Moç.)
3,5
(Ton. paddy)
37
41
11
14
20
129
0,0%
10,0%
(Ton. Milled)
57,0%
Final Sale Price (to the wholesaler) (PrMoc)
FOB Price Vietnam: 25%
Cif Maputo
VIETNAM
Unit
(usd/Ha)
Obs.
21
0
37
310
0,0
10,6
11,7
3,1
4,0
0,0
5,7
36,9
17,2
6,0
0,0
10,6
105,8
-9,5
5,9
-6,7
0,8
2,1
-0,4
4,4
31,2
12,5
6,0
0,0
5,2
51,5
-100,0%
125,6%
-36,5%
34,2%
113,4%
-100,0%
323,5%
555,6%
267,5%
#DIV/0!
#DIV/0!
94,9%
94,9%
8,0
54,5
4,0
0,0
0,0
7,0
7,1
0,0
8,4
20,7
-10,0
13,6
0,0
0,0
0,0
2,0
1,3
-49,8
2,8
1,0
-55,6%
33,1%
0,0%
0,0%
0,0%
40,0%
23,5%
-100,0%
48,6%
4,9%
215,5
12,4
6,1%
(Ton. Milled)
18,0
106,4
4,0
0,0
0,0
5,0
10,3
100,7
12,0
40,0
66,0%
5,0%
17,0%
26,23638987
89,95333671
15,0%
0,0%
5,0%
10,0%
-20,0%
411,7
Preço FOB
Índia: "Basmati" 25-10-2002
Cif Maputo
60
Encargos
aromático
Portuários
Taxas de
Importação
7,50%
Encargos
Financeiros(usd)
15% 60 dias
Transporte PortoArmazém
Preço à entrada no Armazém (PrInt - PrMoc)
USD
%
AROMÁTICO
680,0
740,0
9,0
55,5
20,1
5
829,6
417,9
101,5%
Notes:
1 - Source: Study Competir, Agrimo w/ my own and Mr. Castro's adjustments www.oryza.com
2 - Check Unit Costs with the Team
3 - Measures have been introduced in order to reduce: agrochemical costs, sements; Machinery Cost; Labour Cost; income taxes.
4 - The 66% factory income is the one obtained in the Asian countries, assuming that similar modern technology is adopted by the Conhane Factory, and it may reach 70%.
5 - The following are not contemplated: 2nd Rice Harvest; transplant; effects of the "chemical" project of quantity acquisition; Madagascar technology (reaching 8/10 Ton./Ha).
6 - The following are not contemplated yet: effects from the State compensations for the use of the Silos as Food Stock; State interest bonus; proteccionist customs measures.
7 - The Household Sector should bet on the aromatic varieties, which tecnologies - resourcing less to herbice and machinery and with less income/Ha - are, in this case, compatible with the market Valorisation,
which can even triple.
8 - The gains from sub-products - food oil from the husk; boards produced from the rice straws - exploitation are not contemplated.
(1) - Assuming that the household farmers obtain their "profit" through their labour remuneration, this one already contemplated.
(2) - This item includes administrative, management and commercial costs, as well as "unexplainable" product losses.
___________________________________________________________
Appendix 2
___________________________________________________________ 44
2. Price, Production, Yields, Import and Export Statistics
Calculation of the Paddy Rice Produced Quantities in the Limpopo Valley"Arroz Paddy"
District
Massingir
Chókwè
Chókwè
Chókwè
Chókwè
Chókwè
Chókwè
Chókwè
Chókwè
Chókwè
Guijá
Guijá
Guijá
Chibuto
Chibuto
Chibuto
Chibuto
Chibuto
Chibuto
Manjacaze
Manjacaze
Bilene
Xai-Xai
CURRENT SITUATION YEAR 2001/02
Area
Area
Name of the Field
Built
Explored
3º Congresso
100
10
25 de Setembro
400
0
Gandlaze
90
45
Estação
Agrária
Chókwè
60
35
Kotamo
350
0
Marrambadjane
300
120
Chalacuane
300
0
Eduardo Mondlane
30000
7500
Matuba
Macarretane
2834
300
Izac Maluleque
538
69
Manuel
Borges
Medeiros
19
0
Victor
Manuel
pereira
260
0
7 de Abril
100
0
Malehice
25
25
Eduardo
Dias
Capela
90
0
Ex-Mineiros
250
0
Maniquenique
60
35
Mondiane
350
0
Int.
Proj.
Macalawane
1400
0
Vale
do
Manguenhane
350
211
Baixa do Banze
500
75
Macia
8000
300
Ponela,
Chimbonhanine e
Magula
2970
0
TOTAL
50323
8825
River
Elefantes
Limpopo
Limpopo
EXPLORED AREA INCREASE FORECAST
Unit: Hectares
1
2
3
4
15
22
30
37
80
119
159
198
67
90
90
90
Exploring
Rate
5
44
237
90
44%
59%
100%
Limpopo
Limpopo
Limpopo
Limpopo
Limpopo
52
70
179
60
11184
60
104
267
89
16678
60
139
300
119
22171
60
173
300
148
27665
60
208
300
178
30000
100%
59%
100%
59%
100%
Limpopo
Limpopo
447
103
667
153
887
204
1107
255
1326
305
47%
57%
Limpopo
4
6
8
9
11
59%
Limpopo
Limpopo
Limpopo
52
20
25
78
30
25
103
40
25
129
49
25
154
59
25
59%
59%
100%
Limpopo
Limpopo
Limpopo
Limpopo
18
50
52
70
27
75
60
104
36
99
60
139
45
124
60
173
53
148
60
208
59%
59%
100%
59%
Limpopo
280
418
555
693
830
59%
Inharrime
Inharrime
Incomati
315
112
447
350
167
667
350
222
887
350
277
1107
350
332
1326
100%
66%
17%
594
14297
886
21143
1178
27861
1469
34545
1761
38071
59%
76%
Limpopo
___________________________________________________________
Appendix 2
___________________________________________________________ 45
Total Land Structure (Ha)
1
2
Household Sector (%)
95,0%
85,5%
No. of HA Explored
13.582
18.078
Entrepreneurial Sector (%)
5,0%
14,5%
No. of HA Explored
715
3.066
Total 14.297
21.143
Private Sector: > 5 hectares; Household Sector: < 5 hectares
3
77,0%
21.439
23,1%
6.422
27.861
4
69,3%
23.924
30,7%
10.621
34.545
5
62,3%
23.730
37,7%
14.342
38.071
3
50,0%
10.719
50,0%
3.211
13.930
4
50,0%
11.962
50,0%
5.310
17.273
5
50,0%
11.865
50,0%
7.171
19.036
3
20,0%
2,0
10,0%
4,6
4
20,0%
2,4
10,0%
5,1
5
10,0%
2,6
5,0%
5,3
3
21.224
58,9%
14.835
41,1%
36.059
4
28.422
51,3%
26.988
48,7%
55.410
5
31.010
44,8%
38.264
55,2%
69.274
Land Structure of the Rice Production (Ha)
1
Household Sector (%)
No. of HA Explored
Entrepreneurial Sector (%)
No. of HA Explored
Total -
2
50,0%
6.791
50,0%
357
7.149
50,0%
9.039
50,0%
1.533
10.572
Rice Income per Unit (Ton./Ha)
1
Household Sector (var.%)
N.º Ton./Ha
Entrepreneurial Sector (var.%)
N.º Ton./Ha
2
1,5
4
10,0%
1,7
5,0%
4,2
Private Sector: > 5 ha; Household Sector: < 5 ha
Total Rice Income (Ton.)
1
Household Sector (%)
10.187
(% no total)
87,7%
Entrepreneurial Sector (%)
1.430
(% no total)
12,3%
Total 11.616
Private Sector: > 5 ha; Household Sector: < 5 ha
2
14.914
69,8%
6.438
30,2%
21.352
___________________________________________________________
Appendix 2
___________________________________________________________ 46
$VLD
Thailand
Vietnam
100%B
$ 193
5%DP
$ 187
5%
$ 187
5%
$ 185
10%
$ 183
10%
$ 180
15%
$ 180
15%
$ 174
25%
$ 175
25%
$ 170
35%
$ 168
India
Jasmine
$ 328
Basmati
$ 680-705
PB 100% Sortexed
$ 202
PR 106 PB 5%
$ 178
A1 Super
$ 157
PR 106 5%
$ 178
PR 106 25%
$ 138
Pakistan
15%
$ 167
Pant 4 25%
$ N/A
20%
$ 164
1001 25%
$ N/A
25%
$ 161
___________________________________________________________
Appendix 2
___________________________________________________________ 47
(XURSHDQ3ULFHV
Basis - C+F Rotterdam
Thailand
Broken A1 Super
$ 190
US$ PMT in Bulk
Loonzain 100% Grade B
$ 232
US$ PMT in Bulk
Pb Loonzain 100% sortex
$ 250
US$ PMT in Bulk
White Rice 100% Grade B
$ 263
US$ PMT in 25Kg PP bags Containerized
Fragrant Brokens A1 extra super
$ 280
US$ PMT in 25Kg PP bags, Containerized
Fragrant Loozain
$ 380
US$ PMT in bulk, containerized
Basis - C+F Rotterdam
USA
Regular Brown
2/4/75
$ 8.50
US$ per 100lbs
Pb Brown
1/4/88
$ 9.50
US$ per 100lbs
Basis - FCA Vercelli Area
Italy
Indica 5%
Eur 434
Euro PMT in bulk
Round Grain 5%
Eur 430
Euro PMT in bulk
Arborio 5%
Eur 610
Euro PMT in bulk
Indica Pb 5% Sortex
Eur 490
Euro PMT in bulk
Surcharge for 25Kg PP bags
Euro 15/ Ton
6RXWK$PHULFD
Uruguay
Basis
Price US$
Milled Rice 5%
PMT, Bagged - FOB Montevideo
$ 250-255
Milled Rice10%
PMT, Bagged - FOB Montevideo
$ 243-248
Milled Rice15%
PMT, Bagged - FOB Montevideo
$ 235-240
Rough Rice
PMT, Bulk
- FOB Montevideo
$ NQ
Brown Rice
PMT, Bulk
- FOB Montevideo
$ NQ
Parboiled
PMT, Bulk
- FOB Montevideo
$ 245-250
Argentina
Basis
Price US$
Milled Rice 5%
PMT, Bagged - FOB CDU
$ 255-260
Milled Rice 10%
PMT, Bagged - FOB CDU
$ 249-254
Milled Rice 15%
PMT, Bagged - FOB CDU
$ 240-245
Rough Rice
PMT, Bulk
$ 140-145
- FOB CDU
___________________________________________________________
Appendix 2
___________________________________________________________ 48
Brown Rice
PMT, Bulk
- FOB CDU
$ NQ
Parboiled
PMT, Bulk
- FOB CDU
$ NQ
Guyana
Milled Rice 10%
Surinam
Milled Rice 10%
Basis
PMT, Bagged - FOB
Basis
PMT, Bagged - FOB
Price US$
$
Price US$
$
___________________________________________________________
Appendix 2
___________________________________________________________ 49
0HUFRVXU
Uruguay
Basis
Price US$
Milled Rice 10%
PMT, Bagged
- C+F Jaguarao
$ 225-230
Brown Rice
PMT, Bulk
- C+F Jaguarao
$ 170-175
Argentina
Basis
Price US$
Milled Rice 10%
PMT, Bagged
- C+F Uruguaiana
$ 222-227
Rough Rice
PMT, Bulk
- C+F Uruguaiana
$ 125-130
Polished Rice 15%
PMT, Bagged
- C+F Santiago
$ 258-263
USA Southern
Rough Long Grain
Milled Long Grain
CIF NOLA
$ 4.30-4.50
Fas Lake Charles
$ 8.65-8.75
Arkansas
$ 3.55-3.85
Arkansas
$ 8.20-8.30
Louisiana
$ 3.55-3.85
Louisiana
$ 8.20-8.30
Texas
$ 3.55-3.85
Texas
$ 8.20-8.30
Mississippi
$ 3.55-3.85
Mississippi
$ 8.20-8.30
Missouri
$ 3.55-3.85
Missouri
$ 8.20-8.30
Laredo
$ 110-120
Brewers
Dlvd barge terml
$ 3.90-4.10
Arkansas
$ 6.00-6.25
Louisiana
$ 6.00-6.25
Rough Medium Grain
Arkansas
$ 5.10-5.30
Texas
$ 6.00-6.25
Louisiana
$ 5.10-5.30
Mississippi
$ 6.00-6.25
CIF NOLA
$ 5.75-5.95
Missouri
$ 6.00-6.25
Dlvd barge terml
$ 5.35-5.55
Brown Long Grain
Parboiled Milled
CIF NOLA
$ 7.60-7.80
CIF NOLA
$ 10.60
CIF Rotterdam
$ 8.30-8.70
FOB Mill
$ 9.85
USA California
Rough Calrose
Milled Calrose
___________________________________________________________
Appendix 2
___________________________________________________________ 50
California
$ 7.40-7.60
California
$ 12.35-12.55
exspout SAC
$ 7.40-7.60
exspout SAC
$ 12.35-12.55
All prices in 100 lbs, FOB basis. Except CIF
Global Cash Prices
IMPORTAÇÕS DE ARROZ NA SADC- 1996 / 2000
Rice
Angola
Botswana
Congo, Dem Republic of
Lesotho
Malawi
Mauritius
Mozambique
Namibia
Seychelles
South Africa
Swaziland
Tanzania, United Rep of
Zambia
Zimbabwe
SADC
Taxa de Crescimento Anual(%)
Imports - Qty (Mt)
1996
1997
1998
1999
2000
42,5
24
39,6
31
57,5
13,087 11,823 11,225 11,043 19,239
39,142 56,535 55,762 54,923
9,108
3
3
3
3
3
700
980
855
856
861
88,558 65,445 62,392 83,236
75,66
53,3
44,8
48,7
34
70
184,264 192,78 243,223 330,772
250
5,639
5,801
4,851
4,1
6,406
482,333 580,18 519,636 515,234 523,356
10
8,818
9,651 11,586 13,087
52 98,213
108,5
46,7
103,5
13,153
7,074
6,3
6,6
3,35
16,948 32,988 34,097 22,194 16,464
1703,92 2111,46 2001,94 2010,39 2011,67
23,9% -5,2%
0,4%
0,1%
1996
15
18,483
22,06
1,2
344
37,389
21
72,6
4,823
163,754
4
19
3,16
8,983
735,452
Imports - Val (1000$)
1997
1998
1999
7,2
15
6,6
16,585
18,058
17,734
22,737
23,807
23,197
1,2
1,2
1,2
365
222
223
24,813
21,239
30,559
13,2
16,5
10,3
74,5
84,7
89,37
4,738
4,202
3,5
170,445 150,805 140,052
4,419
5,206
6,546
24,605
30,4
12
4,282
2,57
2,08
11,714
15,791
8,741
745,438 611,478 574,879
1,4%
-18,0%
-6,0%
2000
8,5
28,426
3,197
1,2
229
25,181
21,2
86
5,664
135,799
6,141
18
1,14
7,282
576,73
0,3%
1996
353
1.412
564
400
491
422
394
394
855
340
400
365
240
530
376
Price (USD/TON)
1997
1998
1999
300
379
213
1.403
1.609
1.606
402
427
422
400
400
400
372
260
261
379
340
367
295
339
303
386
348
270
817
866
854
294
290
272
501
539
565
251
280
257
605
408
315
355
463
394
349
344
311
-7,2%
-1,5%
-9,7%
___________________________________________________________
Appendix 2
2000
148
1.478
351
400
266
333
303
344
884
259
469
174
340
442
295
-5,2%
___________________________________________________________ 51
___________________________________________________________
Appendix 2
___________________________________________________________ 52
Year
Rice, Paddy
Production (Mt)
1996
1997
1998
1999
2000
2001
World
568,850,119 577,117,513 579,089,706 609,914,541 600,638,089 592,831,326
20,00
20,50
21,00
16,00
16,00
16,00
Angola
965,63 1,254,610 1,390,000 1,101,000 1,753,000 1,239,000
Australia
28,184,000 28,152,000 29,709,000 34,427,000 37,442,000 39,112,000
Bangladesh
8,643,803 8,351,665 7,716,090 11,709,700 11,089,800 10,207,200
Brazil
3,458,000 3,414,917 3,509,871 4,040,900 4,026,092 4,099,016
Cambodia
China
197,032,897 202,771,843 200,571,557 200,403,308 189,814,060 181,514,992
347,95
322,10
362,66
350,00
337,80
326,03
Congo, Dem Republic
1,14
980,00
979,00
1,27
1,30
1,35
Congo, Republic of
4,895,388 5,480,010 4,474,110 5,816,960 6,000,490 5,700,000
Egypt
120,21
99,94
87,20
80,30
104,10
100,00
Guinea-Bissau
India
122,500,000 123,700,000 129,115,104 134,212,704 129,444,000 131,900,000
51,101,504 49,377,056 49,236,700 50,866,388 51,898,000 50,096,000
Indonesia
12,930,000 12,531,000 11,200,000 11,468,800 11,863,000 11,320,000
Japan
Korea, Dem People's R 1,426,000 1,527,000 2,307,000 2,343,000 1,690,000 2,060,200
7,121,421 7,312,096 6,779,290 7,032,757 7,124,773 7,316,216
Korea, Republic of
2,500,000 2,558,000 2,447,000 2,637,000 2,300,000 2,300,000
Madagascar
72,63
65,69
68,68
92,11
98,68
98,00
Malawi
2,228,489 2,119,615 1,944,240 2,036,641 2,195,000 2,215,000
Malaysia
66,75
80,94
101,90
51,88
76,20
80,00
Mauritania
139,00
180,22
191,00
186,19
151,39
166,95
Mozambique
3,122,000 3,268,000 3,275,000 3,277,000 3,298,000 3,298,000
Nigeria
6,457,200 6,499,500 7,011,400 7,733,417 7,204,620 6,750,000
Pakistan
1,203,168 1,459,830 1,548,780 1,955,030 1,892,100 2,018,500
Peru
11,283,570 11,268,000 8,554,000 11,786,600 12,389,400 12,954,900
Philippines
3,00
3,00
3,00
2,90
3,00
3,00
South Africa
2,061,520 2,239,370 2,692,340 2,868,000 2,859,000 2,868,000
Sri Lanka
265,00
411,00
105,00
100,00
170,00
170,00
Swaziland
733,80
550,80
810,80
506,20
508,00
514,00
Tanzania, United Rep o
22,331,600 23,580,100 22,999,000 24,172,000 25,608,000 25,200,000
Thailand
82,00
80,00
90,00
95,00
109,00
114,00
Uganda
United States of Ameri 7,783,604 8,300,697 8,364,200 9,343,954 8,657,810 9,663,560
973,50 1,023,800
949,80 1,328,200 1,209,100 1,030,200
Uruguay
26,396,700 27,523,900 29,145,500 31,393,800 32,529,500 31,925,400
Viet Nam
13,30
12,47
6,40
14,70
8,84
10,00
Zambia
400,00
400,00
400,00
400,00
400,00
400,00
Zimbabwe
___________________________________________________________
Appendix 2
___________________________________________________________ 53
Rice, Paddy
Yield (Hg/Ha)
World
Angola
Argentina
Australia
Azerbaijan, Republic o
Brazil
China
Chile
Colombia
Egypt
Greece
Guinea-Bissau
India
Indonesia
Japan
Korea, Republic of
Madagascar
Mozambique
Pakistan
Peru
Philippines
Portugal
South Africa
Spain
Sri Lanka
Swaziland
Tanzania, United Rep o
Thailand
Uganda
United States of Ameri
Uruguay
Viet Nam
Zambia
Zimbabwe
1996
3,79
0,87
5,10
7,07
3,69
2,66
6,21
4,77
4,08
8,29
7,49
1,84
2,82
4,42
6,54
6,79
2,19
0,97
2,87
5,72
2,86
6,09
2,31
6,98
3,12
4,65
1,53
2,41
1,41
6,86
6,47
3,77
1,34
2,00
1997
3,82
0,89
5,37
7,65
4,61
2,73
6,31
3,63
4,64
8,42
7,21
1,67
2,85
4,43
6,42
6,95
2,17
1,09
2,80
6,12
2,93
5,75
2,31
6,83
3,25
5,14
1,25
2,38
1,33
6,61
6,58
3,88
1,00
2,00
Year
1998
1999
3,82
3,89
0,88
0,80
4,78
5,73
9,93
9,18
4,80
4,44
2,52
3,07
6,35
6,33
3,91
4,15
4,71
4,80
8,64
8,88
8,05
7,22
1,45
1,18
2,88
2,98
4,20
4,25
6,22
6,41
6,42
6,60
2,03
2,15
1,06
1,00
2,89
3,07
5,76
6,27
2,70
2,95
5,99
5,99
2,31
2,23
7,07
7,54
3,51
3,28
7,00
6,67
1,65
1,07
2,42
2,42
1,41
1,40
6,35
6,57
5,27
6,38
3,96
4,10
0,71
0,91
2,00
2,00
2000
3,90
0,80
4,78
12,09
5,00
3,03
6,26
5,24
4,80
9,10
7,41
1,49
2,89
4,40
6,70
6,75
1,91
0,96
3,03
6,59
3,07
5,99
2,31
6,93
3,44
3,40
1,03
2,62
1,51
7,04
6,38
4,24
0,84
2,00
___________________________________________________________
Appendix 2
2001
3,91
0,80
5,68
9,53
5,66
3,24
6,35
5,02
4,91
8,77
7,74
1,82
2,96
4,25
6,66
6,93
1,91
0,96
3,00
6,73
3,19
6,29
2,31
7,84
3,37
3,40
1,28
2,57
1,50
7,21
6,70
4,26
0,91
2,00
1
Appendix 3: Pre-viability Study for the
Chilembene Tomato Factory
LVSDI
AGRI-PROCESSING SECTORIAL STUDIES
PROJECTO 1:
REHABILITATION,
MODERNISATION AND DIVERSIFICATION OF THE
CHILEMBENE TOMATO PROCESSING FACTORY
(PRE-VIABILITY STUDY – Final Report)
SUMMARY
I. SHORT PRESENTATION
II
SUMMARY OF THE PRE-VIABILITY INDICATORS
III PROJECT CONTEXT
1. Agricultural sector
2. Agro-Industrial sector
3. Commercial/Marketing Sector
IV
ANALYSIS OF ECONOMIC AND FINANCIAL VIABILITY
1. Assumptions
2. Investment
3. Financing Plan
4. Income
5. Costs
SCENARIOS (2)
1. Provisional demonstration of results
2. Profitability indicators
3. Sensibility Analysis
4. Economic Indicators
5. Provisional Balance-sheet
6. Financial Indicators
APPENDICES
1. Technology, technical equipment, technical coefficients, and
others.
2. Statistics on prices, production, income, imports, exports.
3. Diagnosis and Strategy for the Agricultural Sector
4. Diagnosis and Strategy for Agro-Industry
______________________________________________________________
Appendix 3
2
I.
SHORT PRESENTATION
The following, among others, are the reasons that justify the choice of this
project as one of the anchor projects for agro-industry in the context of the
Limpopo Valley study:
There is real availability of raw materials in the area of the factory;
There is potential for diversifying production into: tomato, mango, paw-paw,
orange, passion fruit and particularly pineapple juices/concentrates; tinned
peas, beans, canned fruit in syrup, etc. This diversification is subject to
deeper technical, economic and market studies, not considered in this study;
The factory may act as a factor stimulating the production of tomatoes and
other crops to be processed. It would immediately reduce the vulnerability
of the tomato produced in Chokwe to the market for fresh tomatoes, and
would guarantee its purchase at competitive prices. The factory can also use
the tomatoes rejected by the market for fresh tomatoes as raw material for
its production;
Judging from the visit made to the site, the factory infrastructure seems
intact;
A well-designed investment strategy, linked to a solid market study, would
have to ensure the technological appropriateness of the factory product,
placing it on the national and international market. This may involve strong
marketing of its own brand name - "Limpopo Valley", for example - or the
adoption of a stronger brand name on the market, in a partnership regime
to be defined.
The relaunching of the factory could re-create about 80 jobs, the maximum
number reached in the past.
The general lines of this project are:
Regardless of the brand name option adopted - own brand, or other - it
seems to us reasonable to include in the project a laboratory for certification
of quality and origin. The question of the tutelage, ownership and
management of this type of laboratory is a matter to be gone into more
deeply, but it would not be restricted to the control and certification of
tomatoes, but would extend to other crops and produce processed/produced
in the valley.
Based on the pre-assessment of the viability of the Chilembene factory,
guaranteed with the tomato paste, a product already tested and available,
______________________________________________________________
Appendix 3
3
advance with attracting potential investors who may be prepared to consider
the subsequent stages.
Based on a market study (funding envisaged in the calculations presented
here) on the products of greatest yield that will be processed, either from
tomatoes or from other crops defines the optimal products to be processed
and those to be extracted and the ideal size of the additional production
lines.
Design of an agricultural component which, using the factory's 600 hectares
and other irrigated areas, ensures the interested involvement of the local
producers in producing raw material and supplying the factory. This is
important to free the factory managers from agricultural management,
without putting at risk the flow and the quality of the raw material. The
acquisition of the machinery needed to serve all 600 hectares (whether
those that are currently the property of the factory, or others), the hiring of
3 extensionists and the financial costs of promotion, are envisaged in the
simulations presented.
Design of the mechanisms for a partnership (shareholding or simply
commercial) and for financing the rehabilitation/modernisation of the factory
and marketing its produce.
The project can be rapidly implemented, it has a guaranteed market
(Mozambique currently imports more tomato paste than is necessary to
be sold to make the factory viable), it will have a great impact on the
economy of the region and of the country (the country needs to create
more value added from its own natural riches), and it will generate jobs
directly and indirectly (making people stay in the area and improving their
standard of living).
The basic pre-viability factors presented should be looked into more deeply
through
subsequent
market
studies
and
technical
and
economic
viability
studies.
This
investment
is
considered
in
the
Overall Investment Plan.
______________________________________________________________
Appendix 3
4
PROJECT DESCRIPTION
Sector
Description
Products/by-products
Strong points
Tomato paste, peeled
tomatoes, tomato juice
Potatoes and mixed
vegetables (frozen)
Tinned pre-cooked
vegetables (dried or
green beans; peas,
maize)
Juices, concentrates
and jams (pineapple,
paw-paw, mango,
grapefruit, guava,
passion fruit, orange)
Pre-cooked meals
(bean stew, tripe, peas
with eggs and
sausages etc)
Absorbs surplus
Adds value to lesser
quality products
Encourages farmers
because it
guarantees a market
for their
agricultural produce
Activity is not
totally dependent on
the tomato harvest,
because it relies on
diversification
It relies on its own
"Limpopo Valley"
brand
Food reserve
Industry of
1st phase
juices,
Agricultural
concentrates,
production in
jams, preserves partnership with the
and frozen
farmers
fruit and
Production of
vegetables
tomato paste
Production of
concentrates, juices,
tinned foods, fruit and
vegetable jams
2nd phase
Frozen potatoes
and mixed vegetables
Pre-cooked meals
and tinned vegetables
and meat
II.
Other
Important
Data
Total
recovery of
the existing
unit (e.g.
"Lomaco
Factory")
Young
work force
with knowhow is still
available at
the
site (chiefs)
SUMMARY OF PRE-VIABILITY INDICATORS
Summary of pre-viability indicators for Project 2: Chilembene
processing factory
SCENARIO 1 – Cautious
I
N
D
I
C
A
T
O
R
S
Investment needed
3,119, 043 USD
Break-even year
Year 3
"Break-Even"
1,323, 422 USD
Sales in Break-even year
1,784, 767 USD
Pay back time
58 months
IRR
15,82 %
NPV
156,662 USD
SCENARIO 2 – Realistic
I
N
D
I
C
A
T
O
R
S
Investment needed
3,110,442 USD
Break-even year
Year 3
"Break-Even"
1,221,052 USD
Sales in Break-even year
1,850,869 USD
Pay back time
55 months
IRR
21,01 %
NPV
437,035 USD
______________________________________________________________
Appendix 3
5
CONCLUSIONS:
From analysing the economic and financial indicators of profitability, one
notes that the "project for the recovery modernisation and diversification of
the activity of the - (name) tomato processing factory at Chilembene" is
technically, economically and financially viable (in terms of pre-viability).
The precautions taken in the assumptions used, and sensibility analysis
made of the project's critical parameters, give it a very reasonable safety
margin, and significantly reduce the project risk.
For purposes of pre-viability, the net benefits arising from the processing of
other products, apart from the tomato paste, where viability is already
assured, were not considered: these other products will bring much greater
value added to the project (the products have much better commercial
margins, and the investment and marginal costs are not very significant).
These conclusions will be real to the extent that the constraints identified in
general terms on the agricultural sector and on agro-industry are overcome.
In the Draft Report on the "Diagnosis and Strategy Advocated", suggestions
are made for solving a significant part of these constraints in terms of
private initiative.
In the investment and costs forecast, measures and the respective
resources for ensuring the supply of raw material, which has been one of the
main constraints on the factories already established in other sectors, are
safeguarded.
______________________________________________________________
Appendix 3
6
III CONTEXT
As already mentioned in the Draft Report on the Diagnosis and Development
Strategy for the Agricultural Sector and for Agro-Industry, the viability of the
tomato harvest in the Limpopo Valley depends, summarily, on the following
factors:
1.
Improving the existing infrastructures (public initiative)
Availability and stability in the supply of water for irrigation
Rehabilitation of the irrigation systems
Improving access: road and rail systems
Stability in the supply of energy, and of fixed and mobile telecommunications
Improvement in the education and health services
Reducing red tape in the public sector and increasing its efficiency. Create
mechanisms
for
decentralising
state
decisions
and control over all actors, in order to reduce the conditions
that
lead
to
the
proliferation
of
vices
that
divert
their
behaviour away from the national interest.
Ensure that
public and
private economic
agents
comply
with
the law as regards tax and customs evasion, and the licensing of
activities.
2.
Investment in professional training, for
administrative
staff,
salespersons
and
professionals.
farmers,
other
workers,
relevant
3.
Investment in research and in extension services
4.
Availability
of
services:
accountancy,
legal
services,
the
treatment
and
availability
of
data
concerning
markets
(for
productive factors, and for primary and manufactured products
nationally
and
internationally),
transport
of
goods,
storage,
training, recruitment, financial services, etc.
5.
Overcome the reluctance of the financial sector to finance
agriculture and reduce the interest rates currently charged,
which on their own make non-viable any business in this sector
(suggestions have been made, notably for the creation by the
state of a guarantee fund, which would cover part of the risks of
the financial and insurance sectors).
IN SHORT, CREATE THE SO FAR NON-EXISTENT ''BUSINESS
ENVIRONMENT'' WHICH IS INDISPENSABLE FOR THE SUCCESS OF ANY
PROJECT.
______________________________________________________________
Appendix 3
7
6.
Agricultural sector
Currently a large quantity of tomatoes are produced in the Limpopo Valley (of a
variety appropriate for industrial processing - intensely coloured tomatoes, with a
high concentration of solids, and which ripen uniformly so as to
require one, or at most two, harvests). These tomatoes are not
fully absorbed by the Gaza and Maputo market. There are farmers
in the commercial sector with good know-how of the business,
whose farms are of an appropriate size for mechanisation, and
with interesting yields per hectare (from 20 tonnes per hectare).
Water supply is being restored, the national and regional market
is
huge,
and
the
Limpopo
Valley
has
excellent
natural,
infrastructural
and
historical
conditions
for
developing
the
production of tomatoes, in large quantities, and in a competitive
manner.
In addition to tomatoes, some other vegetables and fruits with a good potential
for
processing
are
produced
in
the
Limpopo
Valley,
albeit in smaller amounts
- namely beans, mangoes, paw-paws,
passion
fruit
and
pineapples,
among
others.
As
the
Draft
Report
notes,
within
the
agricultural
sector,
the
following
conditions
are
indispensable
to
make
viable
the
production of tomatoes and of other crops mentioned above, or
which could easily be produced if there was guaranteed absorption
(through industrial processing):
Guarantee the availability and stability of water supplies;
Encourage the creation of companies that provide services of hiring
agricultural
machinery
and
of
extension
(farmers
must
be
informed and trained to use the machinery correctly), mainly for
the
business
sector,
which
has
to
adopt
highly
mechanised
production processes.
Encourage
the
creation
of
companies
that
purchase
agricultural chemicals in large amounts so as to reduce the final
unit price, and that undertake the respective extension (farmers
must be informed and trained in the proper use of chemicals,
since
part
of
the
lack
of
competitiveness
results
from
their
incorrect use).
Gradual
alteration
of
the
landholding
structure,
encouraging
the
effective
use
of
land,
bringing
together
smallholdings,
and
producing
crops
appropriate
to
their
characteristics
and
to
the
know-how of their owners.
Encourage
introduction
into
the
commercial
and
family
sector
of
varieties
appropriate
to
their
final
destination
(normal
or
high quality fresh tomatoes, or industrial tomatoes).
To encourage the business
the weight of the informal economy.
sector,
it
is
necessary
to
______________________________________________________________
Appendix 3
reduce
8
Encourage
agro-industry
to
promote
planting,
and
establish
private methods, following market laws, of financing farmers on
time, and with interest rates that their activity will bear.
Encourage
the
at tolerable prices.
insurance
sector
to
launch
"harvest
insurance"
Ensure the marketing of excess production of tomatoes
other
vegetables
and
fruits,
as
well
as
of
lesser
produce, for consumption fresh.
7.
and of
quality
Agro-industrial sector
As the Draft Report notes, within the agro-industrial sector, the following
conditions are indispensable to make viable the processing of tomatoes, and of
other
vegetables
and
fruits
to
be
studied:
Availability and stability in the supply of raw material
Quality of the raw material
Undertake extension, complementary to the state or other specialised agents
Undertake promotion, complementary to the state or other specialised
agents
Availability of skilled labour (essentially, ability to read; sense
responsibility as regards their role in the organisation; no vices)
of
Creation of "Limpopo Valley" brands of fresh tomato, tomato paste, tomato
juice, and the other vegetables and fruits to be processed.
Existence of services for certifying origin
Investment
in
marketing:
focus
on
quality
and
on
certification of origin (these market segments are still niches,
they have exponential growth rates, and are highly profitable,
appropriate for new brands that are entering).
8.
Commercial sector/marketing
This sector is not a block on the development of the tomato harvest. There are
already
agents
that
supply
these
services,
or
if more agents are necessary, the market will ensure that they
appear:
Suppliers of goods transport services;
Warehouses;
"Tradings"
Distributors and retailers;
Communications, marketing and advertising companies etc.
______________________________________________________________
Appendix 3
9
Companies which design, develop and produce packaging.
At this level it is IMPORTANT to set up the regulations and create the body that
will manage and inspect the LIMPOPO VALLEY CERTIFICATE OF ORIGIN, to be
used as a BRAND.
III ANALYSIS OF ECONOMIC AND FINANCIAL VIABILITY
1.
Assumptions
SCENARIOS
Two scenarios were developed, which are different as to the assumptions
concerning the sales price of tomato paste, and the purchase price of fresh
tomatoes.
Tomato price, August 2002
Product
Canned tomato paste
(3 and 5 kilo tins, 210
kilo drums)
Fresh Tomato
SALES and AQUISITION PRICES
"Limpopo Valley" Tomato
Scenario 1 – Cautious
Scenario 2 - Realistic
(1)
(1)
Year 1: 810 USD/Tonne
Year 1: 840 USD/Tonne
Year 2 to 5: 818 to 843
Year 2 to 5: 848 to 874
USD/Tonne, depending on
USD/Tonne depending on
inflation
inflation.
(2)
(2)
Year 1: 50 USD/Tonne
Year 1: 45 USD/Tonne
Year 2 to 5: 51 to 52
Year 2 to 5: 45 to 47
USD/Tonne depending on
USD/Tonne depending on
inflation.
inflation.
Notes:
1.
Prices obtained by reference to the prices in the study "Competir", which are in turn based on the
2.
3.
publication "Tomato News", prices of the USA and Italy (prices CIF Maputo oscillate between 832 and
900 USD/tonne). The prices from China (a major world producer) and Turkey (www.tomatopaste.cc and
www.algy.com/...) were also obtained.
Prices obtained by reference to the prices in the study "Competir" and the average prices in the two
seasons at the "Malanga" market for the sale of fresh tomatoes. In the sales price to the industry, one
should take into account savings in the cost of transport and boxing, the savings in terms of the farmer's
time, who can thus devote himself to production, price stability, and the purchase of all the produce
(only the rotten tomatoes are not accepted).
It was considered that international prices will remain stable over the five years of the study, evolving
only in accordance with dollar inflation.
______________________________________________________________
Appendix 3
10
OTHER GENERAL ASSUMPTIONS
The investments needed, from buildings/building work, to industrial
equipment,
agricultural
equipment
to
produce
the
necessary
amounts
of
fresh
tomatoes
(own
equipment
and/or
providing
services
to
farmers),
transport
and
administrative
equipment,
training,
marketing,
studies,
formation,
licences
and
permits, are quantified in detail.
The
technology
acquired
(Italian)
maximise yields from the factory.
will
make
it
possible
to
The
investment
in
buildings,
infrastructures,
transport
and
other areas, already envisage an increase in specific lines of
production
(for
other
vegetables
or
fruits),
depending
on
the
market,
viability
and
technical
studies
to
be
undertaken
(for
example, for about 35,000 USD, the factory could also produce
tomato juice).
The factory is autonomous in terms of transport.
The
following
financial
structure
was
considered:
30%
own
capital
or the equivalent, and 70% bank funding. A market
interest rate (10%) was considered, without any improvement.
The
complete
payment
of
all
tax
obligations
(VAT,
income
tax,
corporation
tax,
social
security)
has
been
considered,
without any fiscal benefit (this ought to be granted by the
state,
ensuring
that
it
reverts
to
the
suggested
rural
development company).
A "2% surprise factor" on total income is considered,
the heading "other expenses and costs" in the balance sheet.
under
A 13% rate of updating Cash flows was used.
A
1%
dollar
inflation
rate
throughout the period of the study.
was
used
as
an
estimate
Investment,
income
and
costs
are
not
quantified
for
the
potential
diversification
of
the factory,
which
should
really
be
verified, since there is not such a great vulnerability nor so
competitive a market as for tomato paste.
NOTE: Part of the data used was gathered from the Limpopo Valley
stakeholders,
namely
farmers
from
the
business
sector,
agroindustry
(in
the
Chilembene
factory
itself),
commercial
sector,
technicians
and
other
staff
from
public
bodies,
Hicep,
among
others,
apart
from
studies
and
the
available
secondary
information (COMPETIR, Tomato News, others).
______________________________________________________________
Appendix 3
11
2. Investment
OVERALL INVESTMENT PLAN
(Unit: USD)
ITEM
1
PHYSICAL FIXED ASSETS (see annexe 1)
PHYSICAL FIXED ASSETS
Buildings and Annexes
Industrial equipment (2,500 Kg/hour)
Transport equipment
Agricultural Extension equipment
NON-PHYSICAL FIXED ASSETS
2 675 000$00
580 000$00
1 500 000$00
295 000$00
300 000$00
Viability study
37 500$00
2 500$00
2 500$00
15 000$00
7 500$00
Implementation of the marketing plan
10 000$00
Licences, permits
Constitution of the company
Implementation of the professional training plan
INVESTMENT IN FIXED ASSETS
INVESTMENT IN WORKING CAPITAL
TOTAL
2 712 500$00
397 942$00
3 110 442$00
______________________________________________________________
Appendix 3
12
WORKING CAPITAL REQUIREMENTS
Unit.: USD
ITEMS
DAYS
1
1. Cash in hand
30
30 690$00
2. Clients
30
136 080$00
3. Stocks
30
36 450$00
4.
30
78 975$00
Suppliers of stocks
5. Estado5.
-
State
VAT supported
VAT liquidated
VAT on credit
VAT to pay
Income tax
6.
555 046$00
277 603$00
277 443$00
2 414$00
Social security
1 332$00
7. Working capital requirements
397 942$00
8. Investment in working capital
1
Initial stocks
Final Stocks
Purchases
CMV
2
36 450$00
36 450$00 77 720$00
397 942$00
3
4
Unit: dollars
5
77 720$00
82 628$00
82 628$00
83 454$00
83 454$00
84 289$00
473 850$00 507 587$00 500 677$00 501 553$00 506 568$00
437 400$00 466 317$00 495 769$00 500 726$00 505 734$00
______________________________________________________________
Appendix 3
13
3.
Financial plan
PROJECT FINANCING PLAN
Unit: USD
ITEM
1
1. ORIGINS
Equity
777 610$00
Capital
777 610$00
Supplementary provisions
Other capital
2 332 831$00
Bank loans
2 177 309$00
Shareholder loans
155 522$00
Subsidy
(Not considered in this study, but it’s important to
ensure the quickly implementation)
TOTAL
3 110 442$00
2. APLICATIONS
Investment in fixed capital
Investment in working capital
requirements
TOTAL
2 712 500$00
397 942$00
3 110 442$00
______________________________________________________________
Appendix 3
14
Loan Term
Interest Rate
5
10,00% Deferred Period
Period
Year 1, 1st semester
Year 1, 2nd semester
Year 2, 1st semester
Year 2, 2nd semester
Year 3, 1st semester
Year 3, 2nd semester
Year 4, 1st semester
Year 4, 2nd semester
Year 5, 1st semester
Year 5, 2nd semester
Initial
Outstanding Capital
2 177 309$00
2 177 309$00
2 177 309$00
2 177 309$00
2 177 309$00
1 814 424$00
1 451 539$00
1 088 655$00
725 770$00
362 885$00
2
Amortisation
Interest
362 885$00
362 885$00
362 885$00
362 885$00
362 885$00
362 885$00
108 865$00
108 865$00
108 865$00
108 865$00
108 865$00
90 721$00
72 577$00
54 433$00
36 288$00
18 144$00
Amortisation
+ Interest
108 865$00
108 865$00
108 865$00
108 865$00
471 750$00
453 606$00
435 462$00
417 318$00
399 173$00
381 029$00
______________________________________________________________
Appendix 3
Unit:dollars
Final
Oustanding Capital
2 177 309$00
2 177 309$00
2 177 309$00
2 177 309$00
1 814 424$00
1 451 539$00
1 088 655$00
725 770$00
362 885$00
15
3. Benefits
Although the long term strategy should follow a line of differentiating the
final product (processing other vegetables and fruits, brand, quality), with
much better margins, only the tomato paste product was taken into
account, since it is believed that this the product that must guarantee the
viability of the factory, since there already exists abundant raw material.
There is no problem with the capacity of the market to absorb the tomato
paste produced by this unit (quantity), if we take the following indicators
into account:
-
Mozambique imports more than 10,750 tonnes/year of tomato
paste;
-
South Africa imports more than 1,560 tonnes/year of tomato
paste;
-
Angola imports more than 5,900 tonnes/year of tomato paste,
with a trend for this figure to increase;
-
The SADC countries import more than 11,000 tonnes/year of
tomato paste;
-
Currently over 30,000 tonnes/year of fresh tomatoes is produced
in Gaza, but with average productivity levels of less than 15
tonnes/hectare (the medium and large business sector achieves
yields of between 25 and 35 tonnes/hectare, and the most
efficient producers in South Africa manage to obtain 60
tonnes/hectare);
-
The trend towards improved standards of living leads to an
increase in per capita consumption of tomato paste (in
Mozambique this is currently estimated at around 0.6 kilos/year
per capita; in the USA the figure is 3.3 kilos/year per capita);
-
And the processing capacity in the country is currently "zero".
4. Costs
Since new equipment with current technology will be acquired, obtaining
industrial yields at the level of the best world producers (20% paste for each
kilo of fresh tomato) was considered. It was also projected that the factory
will start with a 90% efficiency in year one, advancing to 95% in year 2, and
100% in the following years, since there are skilled workers who are still in
the area who are able to produce efficiently.
The costs of staff (see appended production file), fuel, maintenance and
conservation, insurance, depreciation etc include the extensionists necessary
for the production on the factory's own land, or other land, of the tomatoes
needed.
The provision of services, third party suppliers, staff costs, depreciation of
equipment have been exhaustively quantified at market prices (including
multi-risk insurance, work accidents, stock, 2% maintenance and
______________________________________________________________
Appendix 3
16
conservation on the initial value of the investment, advertising and others),
as can be noted in the respective tables.
The staff costs envisage wages of 150 USD a month for workers and
administrative staff, which shows a concern to value this profession, and to
obtain motivation, productivity and efficiency - that is, it does not try to
obtain competitiveness at the cost of factors that are not sustainable in the
medium to long term. Also envisaged are contracting 1 General Manager, 1
Financial Manager, 1 Commercial Manager, and 1 Production Manager, with
monthly wages of 1,200 to 1,500 USD, and 5 extensionists (1 senior paid
1.200 USD/month, and 4 juniors at 800 USD/month).
Under the heading of financial costs of operations are envisaged costs
derived from the integral promotion of the production of fresh tomatoes
needed for the factory (at a rate of 15% on the value of the purchases).
ALL THE REMAINING ASSUMPTIONS AND RESPECTIVE TABLES ARE PRESENTED
BELOW IN RELATION TO THE 2 SCENARIOS USED.
______________________________________________________________
Appendix 3
17
SCENARIO 1 - CAUTIOUS
1.
Income
INSTALLED AND USED PRODUCTIVE CAPACITY
SERVICES/PRODUCTS
Installed Productive Capacity (Ton.Hour/fresh
tomato)
Efficiency Rate
1
2
3
4
5
2,5
90%
2,5
95%
2,5
100%
2,5
100%
2,5
100%
Shifts:
I
II
III
Daily total of Hours/Machinery (H/M)
No. of working days/ Year
8
8
8
24
180
8
8
8
24
180
8
8
8
24
180
8
8
8
24
180
8
8
8
24
180
TOTAL (Ton. / processed fresh tomato) TOTAL (Ton./processed tomato paste) -
9720 10260 10800 10800 10800
1944 2052 2160 2160 2160
UNIT PRICE (USD/TON)
SERVICES/PRODUCTS
Packaged tomato paste
1
810$00
2
818$00
3
826$00
4
835$00
Unit:dollars
5
843$00
1
262 440$00
2
279 790$00
3
297 461$00
4
300 436$00
Unit:dollars
5
303 440$00
262 440$00
279 790$00
297 461$00
300 436$00
303 440$00
1
1 574 640$00
2
1 678 741$00
3
1 784 767$00
4
1 802 615$00
Unit:dollars
5
1 820 641$00
1 574 640$00
1 678 741$00
1 784 767$00
1 802 615$00
1 820 641$00
TOTAL
MONTHLY PROVISIONAL PROFITS
SERVICES/PRODUCTS
Packaged tomato paste
TOTAL
ANNUAL PROVISIONAL PROFITS
SERVICES/PRODUCTS
Packaged tomato paste
TOTAL
______________________________________________________________
Appendix 3
18
2. Costs
PURCHASES: QUANTITIES
RAW MATERIALS
Fresh tomato
TOTAL
1
1620
2
1710
3
1800
4
1800
Unid.: Ton.
5
1800
1.620
1.710
1.800
1.800
1.800
1
50$00
2
51$00
3
51$00
4
52$00
Unit:dollars
5
52$00
50$00
51$00
51$00
52$00
1
81 000$00
2
86 355$00
3
91 809$00
4
92 727$00
Unit:dollars
5
93 654$00
81 000$00
86 355$00
91 809$00
92 727$00
93 654$00
1
486 000$00
2
518 130$00
3
550 854$00
4
556 363$00
Unit:dollars
5
561 926$00
486 000$00
518 130$00
550 854$00
556 363$00
561 926$00
UNIT COST ($/Ton.)
RAW MATERIALS
Fresh tomato
TOTAL
52$00
MONTHLY PURCHASES OF RAW MATERIALS
RAW MATERIALS
Fresh tomato
TOTAL
ANNUAL PURCHASES OF RAW MATERIALS
RAW MATERIALS
Fresh tomato
TOTAL
MONTHLY EXTERNAL CHARGES FOR SERVICES
ECS
Sub-contracts
Electricity
Fuels
Water
Fast weathering tools and utensiles
Pakages (latas de 3 kg e 5kg)
Office Supplies
Chemical products and others
Communication
Accountancy postage
Insurance
Travel and accommodation
Fees and commissions
Maintenance and Repair
Advertising and publicity
Cleaning, hygiene and comfort
Other ECSs
TOTAL
1
2
3
4
Unit:dollars
5
1 500$00
2 567$00
1 000$00
250$00
8 100$00
375$00
1 408$00
200$00
300$00
2 544$00
1 000$00
200$00
4 458$00
250$00
100$00
500$00
24 753$00
1 500$00
2 592$00
1 010$00
253$00
8 181$00
379$00
1 422$00
202$00
303$00
2 570$00
1 010$00
202$00
4 503$00
253$00
101$00
505$00
24 985$00
1 500$00
2 618$00
1 020$00
255$00
8 263$00
383$00
1 437$00
204$00
306$00
2 595$00
1 020$00
204$00
4 548$00
255$00
102$00
510$00
25 220$00
1 500$00
2 644$00
1 030$00
258$00
8 345$00
386$00
1 451$00
206$00
309$00
2 621$00
1 030$00
206$00
4 593$00
258$00
103$00
515$00
25 457$00
1 500$00
2 671$00
1 041$00
260$00
8 429$00
390$00
1 466$00
208$00
312$00
2 648$00
1 041$00
208$00
4 639$00
260$00
104$00
520$00
25 697$00
______________________________________________________________
Appendix 3
19
ANNUAL ECS
Sub-contracts
Electricity
Fuels
Water
Fast weathering tools and utensiles
Pakages (latas de 3 kg e 5kg)
Office Supplies
Chemical products and others
Communication
Accountancy postage
Insurance
Travel and accommodation
Fees and commissions
Maintenance and Repair
Advertising and publicity
Cleaning, hygiene and comfort
Other ECSs
TOTAL
1
2
3
4
Unit:dollars
5
11 700$00
20 020$00
7 800$00
1 950$00
48 600$00
2 925$00
10 985$00
2 400$00
3 600$00
30 531$00
12 000$00
2 400$00
34 775$00
3 000$00
780$00
3 900$00
197 366$00
11 700$00
20 220$00
7 878$00
1 970$00
49 086$00
2 954$00
11 095$00
2 424$00
3 636$00
30 836$00
12 120$00
2 424$00
35 123$00
3 030$00
788$00
3 939$00
199 222$00
11 700$00
20 422$00
7 957$00
1 989$00
49 577$00
2 984$00
11 206$00
2 448$00
3 672$00
31 144$00
12 241$00
2 448$00
35 474$00
3 060$00
796$00
3 978$00
201 097$00
11 700$00
20 627$00
8 036$00
2 009$00
50 073$00
3 014$00
11 318$00
2 473$00
3 709$00
31 456$00
12 364$00
2 473$00
35 829$00
3 091$00
804$00
4 018$00
202 991$00
11 700$00
20 833$00
8 117$00
2 029$00
50 573$00
3 044$00
11 431$00
2 497$00
3 746$00
31 770$00
12 487$00
2 497$00
36 187$00
3 122$00
812$00
4 058$00
204 904$00
MONTHLY COSTS WITH STAFF
1
2
3
4
Unit:dollars
5
GM+CM+FM+PM
- Fees
- Chargers
- Meal Allowance
5 304$00
5 100$00
204$00
5 357$00
5 151$00
206$00
5 411$00
5 203$00
208$00
5 465$00
5 255$00
210$00
5 519$00
5 307$00
212$00
Workers
- Fees
- Expenses
- Meal Allowance
6 848$00
6 585$00
263$00
6 917$00
6 651$00
266$00
6 986$00
6 717$00
269$00
7 056$00
6 785$00
271$00
7 126$00
6 852$00
274$00
Adminitrative Staff
- Fees
- Expenses
- Meal Allowance
2 813$00
2 705$00
108$00
2 841$00
2 732$00
109$00
2 870$00
2 759$00
110$00
2 898$00
2 787$00
111$00
2 927$00
2 815$00
113$00
14 966$00
15 115$00
15 266$00
15 419$00
15 573$00
STAFF
TOTAL
______________________________________________________________
Appendix 3
20
ANNUAL COSTS WITH STAFF
1
2
3
4
Unit:dollars
5
GM+CM+FM+PM
- Fees
- Chargers
- Meal Allowance
63 648$00
61 200$00
2 448$00
64 284$00
61 812$00
2 472$00
64 927$00
62 430$00
2 497$00
65 577$00
63 054$00
2 522$00
66 232$00
63 685$00
2 547$00
Workers
- Fees
- Expenses
- Meal Allowance
73 631$00
70 470$00
3 161$00
74 453$00
71 260$00
3 192$00
75 283$00
72 058$00
3 224$00
76 121$00
72 864$00
3 257$00
76 968$00
73 679$00
3 289$00
Adminitrative Staff
- Fees
- Expenses
- Meal Allowance
33 758$00
32 460$00
1 298$00
34 096$00
32 785$00
1 311$00
34 437$00
33 112$00
1 324$00
34 781$00
33 444$00
1 338$00
35 129$00
33 778$00
1 351$00
171 037$00
172 833$00
174 647$00
176 479$00
178 329$00
1
1 020$00
659$00
271$00
1 949$00
2
1 030$00
665$00
273$00
1 968$00
3
1 041$00
672$00
276$00
1 988$00
4
1 051$00
678$00
279$00
2 008$00
Unit:dollars
5
1 061$00
685$00
281$00
2 028$00
1
153$00
198$00
81$00
432$00
2
155$00
200$00
82$00
436$00
3
156$00
202$00
83$00
440$00
4
158$00
204$00
84$00
445$00
Unit:dollars
5
159$00
206$00
84$00
449$00
STAFF
TOTAL
MONTHLY Income Tax
Rate
STAFF
20,00% GM+CM+FM+PM
10,00% Workers
10,00% Adminitrative Staff
Total
SOCIAL SECURITY
Rate
STAFF
3,00% GM+CM+FM+PM
3,00% Workers
3,00% Adminitrative Staff
Total
INVESTEMENT DEPRECIATION TABLE
DESIGNATION
I - FIXED PHYSICAL ASSETS
Buildings and Annexes
Industrial equipment (2,500 Kg/hour)
Transport equipment
Agricultural Extension equipment
II - FIXED NON PHYSICAL ASSETS
Licences, Charters
Company Constitution
Professional Training Plan Implementation
Feasibility Study
Marketing Plan Implementation
TOTAL ( I+II )
VALUE
DEPRECIATION
RATE
1
2
3
4
5
580 000$00
1 500 000$00
295 000$00
300 000$00
4,00%
12,50%
20,00%
12,50%
23 200$00
187 500$00
59 000$00
37 500$00
23 200$00
187 500$00
59 000$00
37 500$00
23 200$00
187 500$00
59 000$00
37 500$00
23 200$00
187 500$00
59 000$00
37 500$00
23 200$00
187 500$00
59 000$00
2 500$00
2 500$00
15 000$00
7 500$00
10 000$00
33,33%
33,33%
33,33%
33,33%
33,33%
833$00
833$00
5 000$00
2 500$00
3 333$00
833$00
833$00
5 000$00
2 500$00
3 333$00
833$00
833$00
5 000$00
2 500$00
3 333$00
319 700$00
319 700$00
319 700$00
307 200$00
269 700$00
2 712 500$00
______________________________________________________________
Appendix 3
21
INVESTMENT IN WORKING CAPITAL
DAYS
30
1
30 700$00
2
62 009$00
3
62 624$00
4
63 245$00
Unit:dollars
5
63 872$00
2. Clients
30
131 220$00
139 895$00
148 731$00
150 218$00
151 720$00
3. Stocks
30
40 500$00
43 178$00
45 905$00
46 364$00
46 827$00
4. Stocks' Suppliers
30
87 750$00
93 998$00
92 718$00
92 880$00
93 809$00
563 308$00
267 689$00
295 619$00
108 693$00
285 386$00
118 926$00
114 457$00
303 410$00
115 595$00
306 444$00
116 745$00
309 509$00
2 414$00
2 438$00
70 028$00
2 462$00
190 849$00
2 487$00
192 764$00
2 511$00
1 332$00
1 346$00
1 359$00
1 373$00
1 387$00
406 543$00
406 543$00
266 227$00
- 140 316$00
90 692$00
- 175 535$00
- 27 762$00
- 90 692$00
- 28 051$00
ITEMS
1. Current Assets
5. State
- Paid VAT
- Settled VAT
- Credited VAT
- Outstanding VAT
- Income Tax
6. Social Security
7. Net Current Assets Needs
8. Net Current Assets Investment
1
Initial Stocks
Final Stocks
Purchases
Purchases of Goods for Resale
Loan Term
Interest Rate
40 500$00
526 500$00
486 000$00
2
3
4
5
40 500$00
86 355$00
563 985$00
518 130$00
86 355$00
91 809$00
556 308$00
550 854$00
91 809$00
92 727$00
557 281$00
556 363$00
92 727$00
93 654$00
562 853$00
561 926$00
5
10,00% Deferred Period
Period
Year 1, 1st semester
Year 1, 2nd semester
Year 2, 1st semester
Year 2, 2nd semester
Year 3, 1st semester
Year 3, 2nd semester
Year 4, 1st semester
Year 4, 2nd semester
Year 5, 1st semester
Year 5, 2nd semester
Initial
Amortisation
Outstanding Capital
2 183 330$00
2 183 330$00
2 183 330$00
2 183 330$00
2 183 330$00 363 888$00
1 819 442$00 363 888$00
1 455 554$00 363 888$00
1 091 665$00 363 888$00
727 777$00 363 888$00
363 888$00 363 888$00
2
Interest
109 167$00
109 167$00
109 167$00
109 167$00
109 167$00
90 972$00
72 778$00
54 583$00
36 389$00
18 194$00
Unit:dollars
Amortisation
Final
+ Interest
Oustanding Capital
109 167$00
2 183 330$00
109 167$00
2 183 330$00
109 167$00
2 183 330$00
109 167$00
2 183 330$00
473 055$00
1 819 442$00
454 860$00
1 455 554$00
436 666$00
1 091 665$00
418 472$00
727 777$00
400 277$00
363 888$00
382 083$00
______________________________________________________________
Appendix 3
22
3.
Forecast operational accounts of the project
Unit:dollars
ITEMS
1
2
3
4
5
1.Net Sales
1.1.Internal Market
1.2.External Market
2.Other Profits
2.1.Services Rendered
2.2.Other
3.Output Variation
1 574 640$00
1 574 640$00
1 678 741$00
1 678 741$00
1 784 767$00
1 784 767$00
1 802 615$00
1 802 615$00
1 820 641$00
1 820 641$00
4.Total
1 574 640$00
1 678 741$00
1 784 767$00
1 802 615$00
1 820 641$00
486 000$00
518 130$00
550 854$00
556 363$00
561 926$00
197 366$00
39 520$00
10 985$00
48 600$00
30 531$00
37 505$00
3 000$00
27 225$00
157$00
199 222$00
39 798$00
11 095$00
49 086$00
30 836$00
37 880$00
3 030$00
27 497$00
168$00
201 097$00
40 079$00
11 206$00
49 577$00
31 144$00
38 259$00
3 060$00
27 772$00
178$00
202 991$00
40 363$00
11 318$00
50 073$00
31 456$00
38 641$00
3 091$00
28 050$00
180$00
204 904$00
40 650$00
11 431$00
50 573$00
31 770$00
39 028$00
3 122$00
28 330$00
182$00
157$00
171 037$00
31 493$00
319 700$00
168$00
172 833$00
33 575$00
319 700$00
178$00
174 647$00
35 695$00
319 700$00
180$00
176 479$00
36 052$00
307 200$00
182$00
178 329$00
36 413$00
269 700$00
1 205 753$00
1 243 628$00
1 282 172$00
1 279 265$00
1 251 455$00
15.Operational Profit of the Exercise
368 887$00
435 113$00
502 595$00
523 349$00
569 186$00
16.Financial Costs
16.1.of Operational Nature
16.2.of Financing Nature
17.Extraordinary Costs and Losses
18.Profit Previous to Taxes
19.Provisions for Taxes on Profits
257 821$00
39 488$00
218 333$00
260 632$00
42 299$00
218 333$00
241 862$00
41 723$00
200 139$00
169 157$00
41 796$00
127 361$00
96 797$00
42 214$00
54 583$00
111 066$00
38 873$00
174 481$00
61 068$00
260 733$00
91 257$00
354 192$00
123 967$00
472 389$00
165 336$00
20.Net Profit
72 193$00
113 413$00
169 477$00
230 225$00
307 053$00
5.Cost of the Consumed National Stocks
6.Cost of the Consumed Imported Stocks
7.Subcontracts
8.Other External Charges for Services
8.1.Electricity/Water/Fuels
8.2.Rent
8.3.Communications
8.4.Insurance
8.5.Commissions
8.6.Publicity and Propaganda
8.5. Various External Charges for Services
9.Taxes
9.1.Direct
9.2.Indirect
10.Costs with Staff
11.Others Cost and Expenses
12.Depreciation and Reinsertion
14.Total
______________________________________________________________
Appendix 3
23
4.
Indicators of profitability
PROJECT PROFITABILITY INDICATORS
Net Present Value (NPV)
156 662$00
Internal Rate of Return (IRR)
15,82%
Profitability Index (PI)
117,12%
Pay back period - Months
58
PROJECT CASH-FLOWS
Unit:dollars
ITEMS
Total Annual Investment (1)
1
2
3
4
3 119 043$00
Investment Residual Value (2)
Operational Cash-Flow (3)
5
1 176 500$00
610 226$00
651 446$00
689 315$00
664 786$00
631 336$00
-2 508 817$00
651 446$00
689 315$00
664 786$00
1 807 836$00
540 023$00
651 446$00
689 315$00
664 786$00
631 336$00
-2 220 192$00
156 662$00
-2 220 192$00
510 178$00
477 730$00
407 726$00
981 221$00
-1 710 014$00
-1 232 284$00
- 824 559$00
156 662$00
Cash-Flow Previous to the Project (4)
Project's Cash-Flow (3+2-1-4)
Present Value of Operational CF
Present Value of CF
NPV
Accumulated CF
______________________________________________________________
Appendix 3
24
5.
Sensitivity analysis
SENSITIVITY ANALYSIS
Variation
-10%
-5%
10%
5%
Calculated
Indicator
V.A.L.
T.I.R.
V.A.L.
T.I.R.
V.A.L.
T.I.R.
V.A.L.
T.I.R.
Unit:dollars
CRITICAL PARAMETERS CONSIDERED
Sale
Cost
Investment
Sales
Price
Level
Cost
Level
54 685$00
754 877$00 633 372$00 242 674$00
13,9%
25,4%
24,3%
16,9%
279 748$00
628 202$00 567 449$00 372 100$00
17,5%
23,2%
22,6%
19,0%
945 081$00
248 174$00 369 680$00 760 377$00
28,6%
17,0%
18,5%
25,5%
723 303$00
374 850$00 435 603$00 630 952$00
24,8%
19,0%
19,7%
23,3%
______________________________________________________________
Appendix 3
25
5. Economic indicators
COMPANY COSTS' STRUCTURE
ITEMS
1
Total Profits
1 574 640$00
Consumed Stocks
30,86%
Subcontracts
ECSs
12,53%
Taxes
0,01%
Costs with Staff
10,86%
Other Costs and Expenses
2,00%
Depreciation and Reinsertion Provisio
20,30%
Provisions
Financial Costs of Operational Nature
2,51%
Financial Costs of Financing Nature
13,87%
Net Profit
4,58%
2
3
4
5
1 678 741$00
30,86%
1 784 767$00
30,86%
1 802 615$00
30,86%
1 820 641$00
30,86%
11,87%
0,01%
10,30%
2,00%
19,04%
11,27%
0,01%
9,79%
2,00%
17,91%
11,26%
0,01%
9,79%
2,00%
17,04%
11,25%
0,01%
9,79%
2,00%
14,81%
2,52%
13,01%
6,76%
2,34%
11,21%
9,50%
2,32%
7,07%
12,77%
2,32%
3,00%
16,87%
COSTS STRUCTURE
Financial Costs of Financing
Nature
Financial Costs of Operational
Nature
100,00%
Provisions
90,00%
Depreciation and Reinsertion
Provisions
80,00%
70,00%
Other Costs and Expenses
60,00%
Costs with Staff
50,00%
40,00%
Taxes
30,00%
ECSs
20,00%
10,00%
Subcontracts
0,00%
1
2
3
4
5
Consumed Stocks
COMPANY'S GROSS SALES MARGIN
ITEMS
Sales
Purchases of Goods for Resale
Gross Margin
Unit:dollars
1
2
3
4
5
1 574 640$00
486 000$00
1 088 640$00
1 678 741$00
518 130$00
1 160 611$00
1 784 767$00
550 854$00
1 233 913$00
1 802 615$00
556 363$00
1 246 252$00
1 820 641$00
561 926$00
1 258 715$00
______________________________________________________________
Appendix 3
26
COMPANY'S BREAK EVEN POINT
ITEM
Sales Volume
Margin (%)
Variable Costs
Net contribution margin
Net contribution margin (%)
Fixed Costs
Break Even point
Safety Margin
1
2
3
4
5
1 574 640$00
69,1%
687 582$00
887 058$00
56,33%
818 254$00
1 452 505$00
7,76%
1 678 741$00
69,1%
725 806$00
952 935$00
56,76%
821 081$00
1 446 460$00
13,84%
1 784 767$00
69,1%
761 288$00
1 023 479$00
57,35%
805 741$00
1 405 070$00
21,27%
1 802 615$00
69,1%
768 451$00
1 034 163$00
57,37%
723 338$00
1 260 825$00
30,06%
1 820 641$00
69,1%
776 030$00
1 044 610$00
57,38%
615 963$00
1 073 555$00
41,03%
BREAK EVEN POINT
1 600 000$00
1 400 000$00
1 200 000$00
1 000 000$00
800 000$00
600 000$00
400 000$00
200 000$00
$00
1
2
3
4
5
GROSS VALUE ADDED (GVA) AND COMPANY'S PRODUCTIVITY
Unit:dollars
ITEM
Costs with Staff
Financial Costs
Depreciation
Net Profit
GVA
No. of workers
Employees Total Productivity
Assets Total Productivity
1
2
3
4
5
171 037$00
257 821$00
319 700$00
72 193$00
820 751$00
67
12 250$00
24,71%
172 833$00
260 632$00
319 700$00
113 413$00
866 578$00
67
12 934$00
26,20%
174 647$00
241 862$00
319 700$00
169 477$00
905 685$00
67
13 518$00
32,40%
176 479$00
169 157$00
307 200$00
230 225$00
883 061$00
67
13 180$00
37,40%
178 329$00
96 797$00
269 700$00
307 053$00
851 879$00
67
12 715$00
42,95%
GROSS VALU ADDED AND PRODUCTIVITY
1 000 000$00
800 000$00
Employees Total
Productivity
GVA
600 000$00
400 000$00
200 000$00
$00
1
2
3
4
5
COMPANY'S ECONOMIC RATIOS
ITEM
Operational Released Resources
Equity Profitability
Sales Gross Profitability
Sales Net Profitability
Sales Operational Profitability
Assets Economic Profitability
Assets Profitability
1
610 226$00
8,47%
69,14%
7,05%
38,75%
18,37%
11,11%
2
651 446$00
11,75%
69,14%
10,39%
38,81%
19,70%
13,16%
3
689 315$00
14,93%
69,14%
14,61%
38,62%
24,66%
17,98%
4
664 786$00
16,87%
69,14%
19,65%
36,88%
28,15%
22,16%
______________________________________________________________
Appendix 3
5
631 336$00
18,36%
69,14%
25,95%
34,68%
31,83%
28,70%
27
7.
Forecast balance sheet
Unit:dollars
ITEMS
1
2
3
4
5
2 712 500$00
37 500$00
2 675 000$00
2 712 500$00
37 500$00
2 675 000$00
2 712 500$00
37 500$00
2 675 000$00
2 712 500$00
37 500$00
2 675 000$00
2 712 500$00
37 500$00
2 675 000$00
319 700$00
639 400$00
959 100$00
1 266 300$00
1 536 000$00
40 500$00
426 839$00
131 220$00
295 619$00
461 467$00
43 178$00
258 821$00
139 895$00
118 926$00
932 448$00
45 905$00
148 731$00
148 731$00
46 364$00
150 218$00
150 218$00
46 827$00
151 720$00
151 720$00
847 665$00
718 483$00
608 308$00
3 321 606$00
3 307 547$00
2 795 700$00
2 361 264$00
1 983 355$00
779 761$00
779 761$00
779 761$00
779 761$00
779 761$00
72 193$00
72 193$00
113 413$00
185 606$00
169 477$00
355 083$00
230 225$00
585 308$00
307 053$00
851 954$00
965 367$00
1 134 843$00
1 365 068$00
1 672 121$00
2 339 282$00
2 183 330$00
155 952$00
2 183 330$00
2 183 330$00
1 455 554$00
1 455 554$00
727 777$00
727 777$00
130 369$00
158 849$00
205 303$00
268 419$00
311 234$00
87 750$00
42 619$00
93 998$00
64 852$00
92 718$00
112 585$00
92 880$00
175 539$00
93 809$00
217 425$00
19.Total Liabilities
2 469 652$00
2 342 180$00
1 660 856$00
996 196$00
311 234$00
20.Total Liabilities+ Equity
3 321 606$00
3 307 547$00
2 795 700$00
2 361 264$00
1 983 355$00
ASSETS
1.Gross Fixed Assets
1.1.Non - Physical
1.2.Physical
1.3.Financial
2.Depreciation and Reinsertion
3.Mid and Long Term Current Assets
4.Stocks
5.Short Term Current Assets
5.1.Clients
5.2.Other Debtors
6.Bank Deposits/Cash/Negotionable Assets
7.Prepayments and Deferred Income
8.Total Assets
EQUITY
9.Capital
10.Suplementary Instalments
11.Reserves / Unappropriated Earned Surplus
12.Net Profit
13.Interim Dividends
14.Total Equity
LIABILITIES
15.Provisions for Risks and Costs
16.Mid and Long Term Debts
16.1.Bank Loans
16.2.Partners' Loans
16.3.Other Debts
17.Short Term Debt
17.1.Bank Loans
17.2.Suppliers
17.3.Public Statal Sector
17.4.Other Debts
18.Prepayments and Deferred Income
______________________________________________________________
Appendix 3
28
8.
Financial Indicators
COMPANY'S BALANCE STRUCTURE
Unit:dollars
ITEMS
Fixed Assets
Circulating Capital
Equity
Long Term Liabilities
Short Term Liabilities
1
2
3
4
5
2 433 300$00
888 306$00
851 954$00
2 339 282$00
130 369$00
2 116 278$00
1 191 269$00
965 367$00
2 183 330$00
158 849$00
1 799 305$00
996 395$00
1 134 843$00
1 455 554$00
205 303$00
1 492 564$00
868 701$00
1 365 068$00
727 777$00
268 419$00
1 223 327$00
760 028$00
1 672 121$00
ASSETS STRUCTURE
311 234$00
LIABILITIES AND EQUITY STRUCTURE
3 500 000$00
3 500 000$00
3 000 000$00
3 000 000$00
2 500 000$00
2 500 000$00
2 000 000$00
Circulating Capital
2 000 000$00
1 500 000$00
Fixed Assets
1 500 000$00
Passivo Circ.
Exígivel LP
1 000 000$00
1 000 000$00
500 000$00
500 000$00
$00
Capitais Próp.
$00
1
2
3
4
5
1
2
3
4
5
COMPANY'S FINANCIAL RATIOS
ITEMS
Debt
Debt Recovery Period
Debt payment with released
operational resources
Liability Average Cost
Financial Autonomy
Solvency
1
74,35%
5,97
2
70,81%
5,04
3
59,41%
2,98
4
42,19%
1,35
5
15,69%
279%
10,44%
25,65%
34,50%
298%
11,13%
29,19%
41,22%
74%
14,56%
40,59%
68,33%
78%
16,98%
57,81%
137,03%
81%
31,10%
84,31%
537,26%
SOLVENCY
FINANCIAL AUTONOMY
600,00%
90,00%
80,00%
70,00%
60,00%
50,00%
40,00%
30,00%
20,00%
10,00%
0,00%
500,00%
400,00%
300,00%
200,00%
100,00%
0,00%
1
2
3
4
1
5
2
3
4
5
COMPANY'S LIQUIDITY RATIOS
ITEMS
General Liquidity
Reduced Liquidity
Immediate Liquidity
1
2
3
4
5
7,12
6,81
3,54
7,77
7,50
5,87
5,08
4,85
4,13
3,41
3,24
2,68
2,59
2,44
1,95
______________________________________________________________
Appendix 3
29
OTHER COMPANY INDICATORS
ITEMS
1
2
3
4
5
Average Receiving Period (days)
Average Payment Period (days)
Assets Rotation
Stocks Rotation (days)
Wage Productivity
Share of Fixed Assets Covered by Equi
30
65
47,41%
30
479,87%
31,41%
30
65
50,75%
30
501,40%
35,59%
30
61
63,84%
30
518,58%
41,84%
30
60
76,34%
30
500,38%
50,33%
30
60
91,80%
30
477,70%
61,65%
COMPANY SCHEMATIC BALANCE
Unit:dollars
ITEM
Permanent Capital
Net Fixed Assets
Net Current Assets
Cyclical Needs
Cyclical Resources
Net Current Assets Needs
Active Treasury
Passive Treasury
Treasury
1
2
3
4
5
3 191 236$00
2 392 800$00
798 436$00
467 339$00
130 369$00
336 970$00
461 467$00
3 148 697$00
2 073 100$00
1 075 597$00
301 999$00
158 849$00
143 149$00
932 448$00
2 590 397$00
1 753 400$00
836 997$00
194 635$00
205 303$00
- 10 668$00
847 665$00
2 092 845$00
1 446 200$00
646 645$00
196 581$00
268 419$00
- 71 838$00
718 483$00
1 672 121$00
1 176 500$00
495 621$00
198 547$00
311 234$00
- 112 687$00
608 308$00
461 467$00
932 448$00
847 665$00
718 483$00
608 308$00
Treasury Control
TREASURY
1 200 000$00
1 000 000$00
800 000$00
600 000$00
FM
NFM
TESOURARIA
400 000$00
200 000$00
$00
- 200 000$00
1
2
3
4
5
______________________________________________________________
Appendix 3
30
SCENARIO 2 - REALISTIC
NOTE: Only the changed tables are shown
1.
Income
MONTHLY QUANTITIES (Ton.)
SERVICES/PRODUCTS
Packaged tomato paste
TOTAL
1
324
2
342
3
360
4
360
5
360
324
342
360
360
360
1
840$00
2
848$00
3
857$00
4
865$00
Unit:dollars
5
874$00
1
272 160$00
2
290 153$00
3
308 478$00
4
311 563$00
Unit:dollars
5
314 679$00
272 160$00
290 153$00
308 478$00
311 563$00
314 679$00
1
1 632 960$00
2
1 740 917$00
3
1 850 869$00
4
1 869 378$00
Unit:dollars
5
1 888 072$00
1 632 960$00
1 740 917$00
1 850 869$00
1 869 378$00
1 888 072$00
UNIT PRICE (USD/TON)
SERVICES/PRODUCTS
Packaged tomato paste
TOTAL
MONTHLY PROVISIONAL PROFITS
SERVICES/PRODUCTS
Packaged tomato paste
TOTAL
ANNUAL PROVISIONAL PROFITS
SERVICES/PRODUCTS
Packaged tomato paste
TOTAL
______________________________________________________________
Appendix 3
31
2.
Costs
PURCHASES: QUANTITIES
RAW MATERIALS
Fresh tomato
TOTAL
1
1620
2
1710
3
1800
4
1800
Unid.: Ton.
5
1800
1.620
1.710
1.800
1.800
1.800
1
45$00
2
45$00
3
46$00
4
46$00
Unit:dollars
5
47$00
45$00
45$00
46$00
46$00
UNIT COST ($/Ton.)
RAW MATERIALS
Fresh tomato
TOTAL
47$00
MONTHLY PURCHASES OF RAW MATERIALS
RAW MATERIALS
Fresh tomato
TOTAL
1
72 900$00
2
77 720$00
3
82 628$00
4
83 454$00
Unit:dollars
5
84 289$00
72 900$00
77 720$00
82 628$00
83 454$00
84 289$00
ANNUAL PURCHASES OF RAW MATERIALS
RAW MATERIALS
Fresh tomato
TOTAL
1
437 400$00
2
466 317$00
3
495 769$00
4
500 726$00
Unit:dollars
5
505 734$00
437 400$00
466 317$00
495 769$00
500 726$00
505 734$00
ANNUAL ECS
FSE
Sub-contracts
Electricity
Fuels
Water
Fast weathering tools and utensiles
Pakages (latas de 3 kg e 5kg)
Office Supplies
Chemical products and others
Communication
Accountancy postage
Insurance
Travel and accommodation
Fees and commissions
Maintenance and Repair
Advertising and publicity
Cleaning, hygiene and comfort
Other ECSs
TOTAL
1
2
3
4
Unit:dollars
5
11 700$00
20 020$00
7 800$00
1 950$00
48 600$00
2 925$00
10 985$00
2 400$00
3 600$00
30 409$00
12 000$00
2 400$00
34 775$00
3 000$00
780$00
3 900$00
197 244$00
11 700$00
20 220$00
7 878$00
1 970$00
49 086$00
2 954$00
11 095$00
2 424$00
3 636$00
30 713$00
12 120$00
2 424$00
35 123$00
3 030$00
788$00
3 939$00
199 099$00
11 700$00
20 422$00
7 957$00
1 989$00
49 577$00
2 984$00
11 206$00
2 448$00
3 672$00
31 020$00
12 241$00
2 448$00
35 474$00
3 060$00
796$00
3 978$00
200 973$00
11 700$00
20 627$00
8 036$00
2 009$00
50 073$00
3 014$00
11 318$00
2 473$00
3 709$00
31 330$00
12 364$00
2 473$00
35 829$00
3 091$00
804$00
4 018$00
202 866$00
11 700$00
20 833$00
8 117$00
2 029$00
50 573$00
3 044$00
11 431$00
2 497$00
3 746$00
31 644$00
12 487$00
2 497$00
36 187$00
3 122$00
812$00
4 058$00
204 778$00
______________________________________________________________
Appendix 3
32
INVESTMENT IN WORKING CAPITAL
DIAS
30
1
30 690$00
2
61 989$00
3
62 603$00
4
63 224$00
Unit:dollars
5
63 851$00
2. Clients
30
136 080$00
145 076$00
154 239$00
155 782$00
157 339$00
3. Stocks
30
36 450$00
38 860$00
41 314$00
41 727$00
42 144$00
4. Stocks' Suppliers
30
78 975$00
84 598$00
83 446$00
83 592$00
84 428$00
555 046$00
277 603$00
277 443$00
99 885$00
295 956$00
81 372$00
105 092$00
314 648$00
106 137$00
317 794$00
107 193$00
320 972$00
2 414$00
2 438$00
128 184$00
2 462$00
211 657$00
2 487$00
213 780$00
2 511$00
1 332$00
1 346$00
1 359$00
1 373$00
1 387$00
397 942$00
397 942$00
238 915$00
- 159 026$00
42 705$00
- 196 210$00
- 38 376$00
- 42 705$00
- 38 771$00
Unit:dollars
ITEMS
1. Current Assets
5. State
- Paid VAT
- Settled VAT
- Credited VAT
- Outstanding VAT
- Income Tax
6. Social Security
7. Net Current Assets Needs
8. Net Current Assets Investment
1
Initial Stocks
Final Stocks
Purchases
Purchases of Goods for Resale
Loan Term
Interest Rate
36 450$00
473 850$00
437 400$00
2
3
4
Unit:dollars
5
36 450$00
77 720$00
507 587$00
466 317$00
77 720$00
82 628$00
500 677$00
495 769$00
82 628$00
83 454$00
501 553$00
500 726$00
83 454$00
84 289$00
506 568$00
505 734$00
5
10,00% Deferred Period
Period
Year 1, 1st semester
Year 1, 2nd semester
Year 2, 1st semester
Year 2, 2nd semester
Year 3, 1st semester
Year 3, 2nd semester
Year 4, 1st semester
Year 4, 2nd semester
Year 5, 1st semester
Year 5, 2nd semester
Initial
Amortisation
Outstanding Capital
2 177 309$00
2 177 309$00
2 177 309$00
2 177 309$00
2 177 309$00 362 885$00
1 814 424$00 362 885$00
1 451 539$00 362 885$00
1 088 655$00 362 885$00
725 770$00 362 885$00
362 885$00 362 885$00
Interest
108 865$00
108 865$00
108 865$00
108 865$00
108 865$00
90 721$00
72 577$00
54 433$00
36 288$00
18 144$00
2
Unit:dollars
Amortisation
Final
+ Interest
Oustanding Capital
108 865$00
2 177 309$00
108 865$00
2 177 309$00
108 865$00
2 177 309$00
108 865$00
2 177 309$00
471 750$00
1 814 424$00
453 606$00
1 451 539$00
435 462$00
1 088 655$00
417 318$00
725 770$00
399 173$00
362 885$00
381 029$00
______________________________________________________________
Appendix 3
33
3.
Forecast Operational accounts of the project
Unit:dollars
ITEMS
1
2
3
4
5
1.Net Sales
1.1.Internal Market
1.2.External Market
2.Other Profits
2.1.Services Rendered
2.2.Other
3.Output Variation
1 632 960$00
1 632 960$00
1 740 917$00
1 740 917$00
1 850 869$00
1 850 869$00
1 869 378$00
1 869 378$00
1 888 072$00
1 888 072$00
4.Total
1 632 960$00
1 740 917$00
1 850 869$00
1 869 378$00
1 888 072$00
437 400$00
466 317$00
495 769$00
500 726$00
505 734$00
197 244$00
39 520$00
10 985$00
48 600$00
30 409$00
37 505$00
3 000$00
27 225$00
163$00
199 099$00
39 798$00
11 095$00
49 086$00
30 713$00
37 880$00
3 030$00
27 497$00
174$00
200 973$00
40 079$00
11 206$00
49 577$00
31 020$00
38 259$00
3 060$00
27 772$00
185$00
202 866$00
40 363$00
11 318$00
50 073$00
31 330$00
38 641$00
3 091$00
28 050$00
187$00
204 778$00
40 650$00
11 431$00
50 573$00
31 644$00
39 028$00
3 122$00
28 330$00
189$00
163$00
171 037$00
32 659$00
319 700$00
174$00
172 833$00
34 818$00
319 700$00
185$00
174 647$00
37 017$00
319 700$00
187$00
176 479$00
37 388$00
307 200$00
189$00
178 329$00
37 761$00
269 700$00
1 158 204$00
1 192 942$00
1 228 291$00
1 224 846$00
1 196 491$00
15.Operational Profit of the Exercise
474 756$00
547 975$00
622 578$00
644 532$00
691 581$00
16.Financial Costs
16.1.of Operational Nature
16.2.of Financing Nature
17.Extraordinary Costs and Losses
18.Profit Previous to Taxes
19.Provisions for Taxes on Profits
253 270$00
35 539$00
217 731$00
255 800$00
38 069$00
217 731$00
237 137$00
37 551$00
199 587$00
164 626$00
37 616$00
127 010$00
92 425$00
37 993$00
54 433$00
221 487$00
77 520$00
292 175$00
102 261$00
385 441$00
134 904$00
479 906$00
167 967$00
599 156$00
209 705$00
20.Net Profit
143 966$00
189 914$00
250 536$00
311 939$00
389 451$00
5.Cost of the Consumed National Stocks
6.Cost of the Consumed Imported Stocks
7.Subcontracts
8.Other External Charges for Services
8.1.Electricity/Water/Fuels
8.2.Rent
8.3.Communications
8.4.Insurance
8.5.Commissions
8.6.Publicity and Propaganda
8.5. Various External Charges for Services
9.Taxes
9.1.Direct
9.2.Indirect
10.Costs with Staff
11.Others Cost and Expenses
12.Depreciation and Reinsertion
14.Total
______________________________________________________________
Appendix 3
34
4.
Indicators of profitability
INDICADORES FINANCEIROS DO PROJECTO
Valor Actual Líquido do Projecto (VAL)
437 035$00
Taxa Interna de Rentabilidade (TIR)
21,01%
Índice de Lucratividade (IL)
131,24%
Período Rec. Investimento (PRI) - Meses
55
PROJECT CASH-FLOWS
Unit:dollars
ITEMS
Total Annual Investment (1)
1
3 110 442$00
2
3
4
Investment Residual Value (2)
Operational Cash-Flow (3)
5
1 176 500$00
681 397$00
727 345$00
769 823$00
746 149$00
713 584$00
-2 429 045$00
727 345$00
769 823$00
746 149$00
1 890 084$00
603 006$00
727 345$00
769 823$00
746 149$00
713 584$00
-2 149 597$00
437 035$00
-2 149 597$00
569 618$00
533 526$00
457 627$00
1 025 862$00
-1 579 979$00
-1 046 453$00
- 588 827$00
437 035$00
Cash-Flow Previous to the Project (4)
Project's Cash-Flow (3+2-1-4)
Present Value of Operational CF
Present Value of CF
NPV
Accumulated CF
______________________________________________________________
Appendix 3
35
5.
Sensitivity analysis
SENSITIVITY ANALYSIS
Unid.:dollars
Variation
Indicators
Made
Calculated
-10%
-5%
10%
5%
CRITICAL PARAMETERS CONSIDERED
Level of
Sales
Level of
Investment
sales
Price
Costs
Cost
N.P.V.
357 857$00
1 056 730$00
949 752$00
528 131$00
I.R.R.
18,8%
30,8%
30,5%
21,6%
N.P.V.
587 848$00
937 285$00
883 796$00
672 985$00
I.R.R.
22,6%
28,7%
28,4%
24,1%
N.P.V.
1 277 822$00
578 948$00
685 927$00
1 107 548$00
I.R.R.
34,7%
22,5%
23,3%
31,7%
N.P.V.
1 047 831$00
698 394$00
751 883$00
962 694$00
I.R.R.
30,6%
24,5%
24,9%
29,1%
______________________________________________________________
Appendix 3
36
6. Economic indicators
COMPANY COSTS' STRUCTURE
ITEMS
1
Total Profits
1 632 960$00
Consumed Stocks
26,79%
Subcontracts
ECSs
12,08%
Taxes
0,01%
Costs with Staff
10,47%
Other Costs and Expenses
2,00%
Depreciation and Reinsertion Provision
19,58%
Provisions
Financial Costs of Operational Nature
2,18%
Financial Costs of Financing Nature
13,33%
Net Profit
8,82%
2
3
4
5
1 740 917$00
26,79%
1 850 869$00
26,79%
1 869 378$00
26,79%
1 888 072$00
26,79%
11,44%
0,01%
9,93%
2,00%
18,36%
10,86%
0,01%
9,44%
2,00%
17,27%
10,85%
0,01%
9,44%
2,00%
16,43%
10,85%
0,01%
9,45%
2,00%
14,28%
2,19%
12,51%
10,91%
2,03%
10,78%
13,54%
2,01%
6,79%
16,69%
2,01%
2,88%
20,63%
COSTS STRUCTURE
Financial Costs of Financing
Nature
Financial Costs of Operational
Nature
100,00%
90,00%
80,00%
70,00%
60,00%
50,00%
40,00%
30,00%
20,00%
10,00%
0,00%
Provisions
Depreciation and Reinsertion
Provisions
Other Costs and Expenses
Costs with Staff
Taxes
ECSs
Subcontracts
1
2
3
4
5
Consumed Stocks
COMPANY'S GROSS SALES MARGIN
ITEMS
Sales
Purchases of Goods for Resale
Gross Margin
1
1 632 960$00
437 400$00
1 195 560$00
2
1 740 917$00
466 317$00
1 274 600$00
3
1 850 869$00
495 769$00
1 355 101$00
4
1 869 378$00
500 726$00
1 368 652$00
______________________________________________________________
Appendix 3
5
1 888 072$00
505 734$00
1 382 338$00
37
COMPANY'S BREAK EVEN POINT
ITEM
Sales Volume
Margin (%)
Variable Costs
Net contribution margin
Net contribution margin (%)
Fixed Costs
Break Even point
Safety Margin
1
2
3
4
5
1 632 960$00
73,2%
636 200$00
996 760$00
61,04%
817 536$00
1 339 344$00
17,98%
1 740 917$00
73,2%
671 007$00
1 069 910$00
61,46%
820 362$00
1 334 862$00
23,32%
1 850 869$00
73,2%
703 352$00
1 147 517$00
62,00%
805 072$00
1 298 527$00
29,84%
1 869 378$00
73,2%
709 971$00
1 159 408$00
62,02%
722 868$00
1 165 520$00
37,65%
1 888 072$00
73,2%
716 965$00
1 171 107$00
62,03%
615 693$00
992 627$00
47,43%
BREAK EVEN POINT
1 600 000$00
1 400 000$00
1 200 000$00
1 000 000$00
800 000$00
600 000$00
400 000$00
200 000$00
$00
1
2
3
4
5
GROSS VALUE ADDED (GVA) AND COMPANY'S PRODUCTIVITY
ITEM
Costs with Staff
Financial Costs
Depreciation
Net Profit
GVA
No. of workers
Employees Total Productivity
Assets Total Productivity
1
2
3
4
5
171 037$00
253 270$00
319 700$00
143 966$00
887 973$00
67
13 253$00
26,00%
172 833$00
255 800$00
319 700$00
189 914$00
938 247$00
67
14 004$00
26,97%
174 647$00
237 137$00
319 700$00
250 536$00
982 021$00
67
14 657$00
32,01%
176 479$00
164 626$00
307 200$00
311 939$00
960 244$00
67
14 332$00
35,46%
178 329$00
92 425$00
269 700$00
389 451$00
929 906$00
67
13 879$00
38,51%
GVA AND PRODUCTIVITY
1 200 000$00
1 000 000$00
Employees Total
Productivity
GVA
800 000$00
600 000$00
400 000$00
200 000$00
$00
1
2
3
4
5
COMPANY'S ECONOMIC RATIOS
ITEM
Operational Released Resources
Equity Profitability
Sales Gross Profitability
Sales Net Profitability
Sales Operational Profitability
Assets Economic Profitability
Assets Profitability
1
2
3
4
5
681 397$00
15,62%
73,21%
13,56%
41,73%
19,96%
13,90%
727 345$00
17,09%
73,21%
16,78%
41,78%
20,90%
15,75%
769 823$00
18,39%
73,21%
20,82%
41,59%
25,09%
20,29%
746 149$00
18,63%
73,21%
25,67%
39,91%
27,55%
23,80%
713 584$00
18,87%
73,21%
31,73%
37,79%
29,55%
28,64%
______________________________________________________________
Appendix 3
38
7.
Forecast balance sheet
Unit:dollars
ITEMS
1
2
3
4
5
2 712 500$00
37 500$00
2 675 000$00
2 712 500$00
37 500$00
2 675 000$00
2 712 500$00
37 500$00
2 675 000$00
2 712 500$00
37 500$00
2 675 000$00
2 712 500$00
37 500$00
2 675 000$00
319 700$00
639 400$00
959 100$00
1 266 300$00
1 536 000$00
36 450$00
413 523$00
136 080$00
277 443$00
571 877$00
38 860$00
226 448$00
145 076$00
81 372$00
1 141 034$00
41 314$00
154 239$00
154 239$00
41 727$00
155 782$00
155 782$00
42 144$00
157 339$00
157 339$00
1 118 832$00
1 064 360$00
1 038 909$00
3 414 649$00
3 479 442$00
3 067 785$00
2 708 068$00
2 414 892$00
777 610$00
777 610$00
777 610$00
777 610$00
777 610$00
143 966$00
143 966$00
189 914$00
333 880$00
250 536$00
584 416$00
311 939$00
896 355$00
389 451$00
921 577$00
1 111 490$00
1 362 027$00
1 673 966$00
2 063 417$00
2 332 831$00
2 177 309$00
155 522$00
2 177 309$00
2 177 309$00
1 451 540$00
1 451 539$00
TRUE
725 770$00
725 770$00
160 241$00
190 642$00
254 218$00
308 333$00
351 475$00
78 975$00
81 266$00
84 598$00
106 045$00
83 446$00
170 771$00
83 592$00
224 741$00
84 428$00
267 047$00
19.Total Liabilities
2 493 073$00
2 367 952$00
1 705 758$00
1 034 103$00
351 475$00
20.Total Liabilities+ Equity
3 414 649$00
3 479 442$00
3 067 785$00
2 708 068$00
2 414 892$00
ASSETS
1.Gross Fixed Assets
1.1.Non - Physical
1.2.Physical
1.3.Financial
2.Depreciation and Reinsertion
3.Mid and Long Term Current Assets
4.Stocks
5.Short Term Current Assets
5.1.Clients
5.2.Other Debtors
6.Bank Deposits/Cash/Negotionable Assets
7.Prepayments and Deferred Income
8.Total Assets
EQUITY
9.Capital
10.Suplementary Instalments
11.Reserves / Unappropriated Earned Surplus
12.Net Profit
13.Interim Dividends
14.Total Equity
LIABILITIES
15.Provisions for Risks and Costs
16.Mid and Long Term Debts
16.1.Bank Loans
16.2.Partners' Loans
16.3.Other Debts
17.Short Term Debt
17.1.Bank Loans
17.2.Suppliers
17.3.Public Statal Sector
17.4.Other Debts
18.Prepayments and Deferred Income
______________________________________________________________
Appendix 3
39
8.
Financial Indicators
COMPANY'S BALANCE STRUCTURE
ITEMS
Unit:dollars
1
2 429 250$00
985 399$00
921 577$00
2 332 831$00
160 241$00
Fixed Assets
Circulating Capital
Equity
Long Term Liabilities
Short Term Liabilities
2
2 111 960$00
1 367 482$00
1 111 490$00
2 177 309$00
190 642$00
3
4
5
1 794 714$00 1 487 927$00 1 218 644$00
1 273 071$00 1 220 141$00 1 196 248$00
1 362 027$00 1 673 966$00 2 063 417$00
1 451 540$00 725 770$00
254 218$00
308 333$00
351 475$00
ASSETS STRUCTURE
LIABILITIES AND EQUITY STRUCTURE
4 000 000$00
3 500 000$00
3 000 000$00
2 500 000$00
2 000 000$00
1 500 000$00
1 000 000$00
500 000$00
$00
Circulating Capital
Fixed Assets
1
2
3
4
4 000 000$00
3 500 000$00
3 000 000$00
2 500 000$00
2 000 000$00
1 500 000$00
1 000 000$00
500 000$00
$00
Passivo Circ.
Exígivel LP
Capitais Próp.
5
1
2
3
4
5
COMPANY'S FINANCIAL RATIOS
ITEMS
Debt
Debt Recovery Period
Debt payment with released
operational resources
Liability Average Cost
Financial Autonomy
Solvency
1
2
3
4
5
73,01%
5,03
68,06%
4,27
55,60%
2,55
38,19%
1,17
14,55%
313%
10,16%
26,99%
36,97%
334%
10,80%
31,94%
46,94%
83%
13,90%
44,40%
79,85%
87%
15,92%
61,81%
161,88%
91%
26,30%
85,45%
587,07%
SOLVENCY
FINANCIAL AUTONOMY
600,00%
100,00%
500,00%
80,00%
400,00%
60,00%
300,00%
40,00%
200,00%
20,00%
100,00%
0,00%
0,00%
1
2
3
4
1
5
2
3
4
COMPANY'S LIQUIDITY RATIOS
ITEMS
General Liquidity
Reduced Liquidity
Immediate Liquidity
1
2
3
4
5
6,38
6,15
3,57
7,38
7,17
5,99
5,17
5,01
4,40
4,09
3,96
3,45
3,52
3,40
2,96
______________________________________________________________
Appendix 3
5
40
______________________________________________________________
Appendix 3
41
ANNEXES
1.
Technology, technical equipment, technical coefficients and
others
Working period: 6 months/year, 24
hours/day, 7 days/week
Packaging: tins of 3 or 5 kilos and drums of
210 kilos
FINAL PRODUCT: TOMATO PASTE
INSTALLED CAPACITY (Tonnes of fresh tomato/hour)
INSTALLED CAPACITY (Tones of finished product/day)
Processing coefficient
ITEM
DESCRIPTION
1
INDUSTRIAL EQUIPEMENT (2,500 Kg/hour)
1,1 Equipment for processing paste
1,2
Packaging equipment
1,3 Auxiliary equipment (boiler, compressed air,
500KW generator)
2
BUILDINGS AND ANNEXES
2,1 Rehabilitation of the roof of the buildings
2,2 New weighing machine
2,3 Water treatment station
3
TRANSPORT EQUIPMENT
3,1 10 tonne trucks
3,2 4 tonne trucks
3,3 1 tonne trucks
3,4 Light vehicles
3,5 Fork lifts
3,6
AGRICULTURAL EXTENSION EQUIPMENT
FACTORY AND AGRICULTURAL
4
PRODUCTION STAFF
STAFF FOR AGRICULTURAL EXTENSION
Senior agricultural engineer
Agricultural technical engineers
TOTAL FACTORY STAFF
4,1 Factory foreman
4,2 Warehouse heads
4,3 Chemical engineer
4,4 Machine operators
4,5 Maintenance technicians
4,6 Head of laboratory and quality control
4,7 Laboratory and quality control staff
4,8 Professional training
5
5,1
5,2
5,3
5,4
5,5
5,6
5,7
5,8
5,9
5.1O
5,11
ADMINISTRATIVE STAFF
General manager
Financial manager
Production manager
Commercial manager
Chief accountant
Supplies staff
Sales staff
Drivers
Secretarial staff
Cleaning Staff
Security staff
2,5
0,5
0,2
QUANTITY
UNIT COST OF
AQUISITION
(USD)
CYCLES
PER YEAR
1
1
1
1
700.000,00
550.000,00
250.000,00
1/15
1/15
1/15
1/15
1
1
1
250.000,00
80.000,00
250.000,00
1/6
1/15
1/15
1
2
1
3
1
60.000,00
35.000,00
20.000,00
30.000,00
55.000,00
300.000,00
MONTHLY COST
(USD)
2.000,00
1.200,00
800,00
4.585,00
1.200,00
450,00
800,00
1.425,00
400,00
150,00
160,00
NUMBER
1
4
2
3
1
15
5
1
2
NUMBER
1
1
1
1
1
3
3
5
2
5
10
MONTHLY COST
(USD)
7.805,00
1.500,00
1.200,00
1.200,00
1.200,00
600,00
240,00
240,00
325,00
200,00
250,00
850,00
1/5
1/5
1/5
1/5
1/5
CYCLES
PER YEAR
12
12
12
12
12
12
12
12
12
CYCLES
PER YEAR
12
12
12
12
12
12
12
12
12
12
12
______________________________________________________________
Appendix 3
TOTAL
COST
(USD)
1.500.000,00
700.000,00
550.000,00
250.000,00
580.000,00
250.000,00
80.000,00
250.000,00
295.000,00
60.000,00
70.000,00
20.000,00
90.000,00
55.000,00
300.000,00
ANNUAL
COST (USD)
24.000,00
14.400,00
9.600,00
58.220,00
14.400,00
5.400,00
9.600,00
17.100,00
4.800,00
1.800,00
1.920,00
3.200,00
ANNUAL
COST (USD)
95.460,00
18.000,00
14.400,00
14.400,00
14.400,00
7.200,00
2.880,00
2.880,00
3.900,00
2.400,00
3.000,00
10.200,00
42
2.
Price, Production, Yield, Import and Export Statistics
China Xinjiang Tomato paste is very famous in the world because its pure natural
taste and its top quality. we, Xinjiang Green-leaf Foodstuff Group Co., Beijing Br.,
export tomato paste from our Xinjiang plant directly, so, our quality and price is very
competitive.
This website obtain the detail information about tomato paste, including price,
specification, processing technique, inspection data, etc. If you need the information
which is not contained in this website, please do not hesitate to ask us At present, we have catalogues and samples available, and we'll send it to you upon
the receipt of your intent, and the samples' transmit cost will be charged by the your
sides. OUR QUALITY CERTIFICATE
______________________________________________________________
Appendix 3
43
BRIX
PRICE LIST FOR 2002 CROP
Price US$/MT
FOB Xingang
PACKING
TINS/CARTON
Tianjin
28-30% 850GM
12TINS
720
1KG
12TINS
670
3KG
6TINS
560
4.5KG
6TINS
550
220KG/DRUM 80DRUM/20"FCL 450
36-38%
220KG/DRUM 80DRUM/20"FCL 500
PRICE LIST FOR 2001 CROP BRIX
PACKING
TINS/CARTON
Price
US$/MT
FOB Tianjin
28-30% 850GM
12TINS
820
1KG
12TINS
770
3KG
6TINS
660
4.5KG
6TINS
650
220KG/DRUM 80DRUM/20"FCL 600
______________________________________________________________
Appendix 3
44
36-38%
220KG/DRUM 80DRUM/20"FCL 660
Tomatoes
Area Harv (Ha)
World
Total de SADC
Angola
Congo, Dem Republic of
Malawi
Mauritius
Mozambique
Seychelles
South Africa
Swaziland
Tanzania, United Rep of
Zambia
Zimbabwe
Tomatoes
Production (Mt)
World
Total de SADC
Angola
Congo, Dem Republic of
Malawi
Mauritius
Mozambique
Seychelles
South Africa
Swaziland
Tanzania, United Rep of
Zambia
Zimbabwe
Tomatoes
Yield (Hg/Ha)
World
Total de SADC
Angola
Congo, Dem Republic of
Malawi
Mauritius
Mozambique
Seychelles
South Africa
Swaziland
Tanzania, United Rep of
Zambia
Zimbabwe
1995
3.197.774
1.072.732
3.700
7.000
85.000
125.218
85.714
60.714
334.892
126.667
77.160
100.000
66.667
1996
3.319.955
1.069.095
4.000
6.149
87.500
109.097
86.364
60.345
334.535
126.667
78.049
104.167
72.222
1995
1996
86.734.151 92.932.114
726.816
746.300
14.000
15.000
48.000
44.826
34.000
35.000
13.486
10.877
18.000
19.000
170
175
435.360
451.622
3.800
3.800
125.000
128.000
23.000
25.000
12.000
13.000
1995
271.233
1.168.441
37.838
68.571
85.000
125.218
85.714
60.714
334.892
126.667
77.160
100.000
66.667
1996
279.920
1.169.346
37.500
72.900
87.500
109.097
86.364
60.345
334.535
126.667
78.049
104.167
72.222
1997
3.326.390
1.067.856
3.800
5.876
86.842
115.231
86.957
60.000
342.182
125.000
75.301
100.000
66.667
Year
1998
3.566.252
1.041.142
4.000
5.614
87.500
103.163
87.500
61.667
323.981
128.571
78.035
100.000
61.111
1999
3.763.183
1.038.314
3.000
5.400
87.805
103.436
88.000
61.290
319.146
125.000
78.570
100.000
66.667
2000
3.750.176
982.257
3.500
5.400
87.500
113.882
73.220
61.290
272.650
125.926
77.778
100.000
61.111
2001
3.745.229
982.493
3.500
5.400
87.500
114.118
73.220
61.290
272.650
125.926
77.778
100.000
61.111
Year
1997
1998
1999
2000
2001
89.313.832 94.338.747 104.366.671 101.975.637 100.259.346
730.577
715.618
724.933
650.465
650.485
14.000
15.000
11.000
13.000
13.000
42.834
40.929
38.000
38.000
38.000
33.000
35.000
36.000
35.000
35.000
12.226
10.729
8.037
9.680
9.700
20.000
21.000
22.000
7.117
7.117
180
185
190
190
190
444.837
421.175
430.847
368.078
368.078
3.500
3.600
3.500
3.400
3.400
125.000
135.000
139.359
140.000
140.000
23.000
22.000
24.000
25.000
25.000
12.000
11.000
12.000
11.000
11.000
1997
268.501
1.167.919
36.842
72.897
86.842
115.231
86.957
60.000
342.182
125.000
75.301
100.000
66.667
Year
1998
264.532
1.141.933
37.500
72.905
87.500
103.163
87.500
61.667
323.981
128.571
78.035
100.000
61.111
1999
277.336
1.136.951
36.667
70.370
87.805
103.436
88.000
61.290
319.146
125.000
78.570
100.000
66.667
2000
271.922
1.080.870
37.143
70.370
87.500
113.882
73.220
61.290
272.650
125.926
77.778
100.000
61.111
______________________________________________________________
Appendix 3
2001
267.699
1.081.106
37.143
70.370
87.500
114.118
73.220
61.290
272.650
125.926
77.778
100.000
61.111
45
Tomatoes
Imports - Qty (Mt)
World
Total de SADC
Botswana
Congo, Dem Republic of
Lesotho
Malawi
Seychelles
South Africa
Swaziland
Tanzania, United Rep of
Zambia
Zimbabwe
1995
3.100.793
10.240
4.494
0
4.000
0
455
261
1.000
0
0
30
1996
3.443.747
10.115
4.723
0
4.000
0
269
16
1.000
0
20
87
Year
1997
1998
3.628.554 3.692.751
12.473
13.589
5.541
5.742
53
10
4.000
4.000
18
22
292
297
19
399
1.664
1.182
2
2
29
60
855
1.875
1999
3.584.924
12.190
5.742
10
4.000
22
297
251
1.361
2
60
445
2000
3.574.312
11.519
5.541
10
4.000
22
167
23
1.308
2
60
386
Tomatoes
Imports - Val (1000$)
World
Total de SADC
Botswana
Congo, Dem Republic of
Lesotho
Malawi
Seychelles
South Africa
Swaziland
Tanzania, United Rep of
Zambia
Zimbabwe
1995
2.672.901
4.952
2.569
0
1.600
0
437
199
130
0
0
17
1996
3.226.942
4.713
2.506
0
1.600
0
402
3
130
0
25
47
Year
1997
1998
3.031.479 3.209.848
5.554
5.746
2.604
2.777
33
6
1.600
1.600
7
18
598
641
14
149
344
206
9
9
32
50
313
290
1999
2.984.996
5.577
2.777
6
1.600
18
641
92
328
9
50
56
2000
3.076.620
5.250
2.604
6
1.600
18
361
4
501
9
50
97
Tomatoes
Exports - Qty (Mt)
World
Total de SADC
Botswana
Malawi
Mauritius
Seychelles
South Africa
Swaziland
Zambia
Zimbabwe
1995
3.452.170
763
15
0
0
0
699
0
0
49
1996
3.356.339
4.175
13
0
0
0
4.149
0
0
13
Year
1997
1998
3.750.999 3.971.869
5.178
9.287
2
6
0
220
0
0
4
6
5.097
8.580
34
34
3
3
38
438
1999
3.968.802
8.207
6
220
6
0
7.504
47
3
421
2000
3.738.030
7.475
2
220
1
0
7.097
122
3
30
Tomatoes
Exports - Val (1000$)
World
Total de SADC
Botswana
Malawi
Mauritius
Seychelles
South Africa
Swaziland
Zambia
Zimbabwe
1995
2.799.317
461
10
0
0
0
437
0
0
14
1996
2.935.039
1.579
10
0
0
0
1.565
0
0
4
Year
1997
1998
2.832.208 3.054.792
1.198
2.248
1
3
0
40
0
0
10
13
1.153
1.955
12
12
8
8
14
217
1999
2.926.437
1.928
3
40
3
1
1.637
7
8
229
2000
3.049.958
1.562
1
40
1
0
1.444
51
8
17
______________________________________________________________
Appendix 3
46
Tomato Paste
Imports - Qty (Mt)
World
Total de SADC
Angola
Botswana
Congo, Dem Republic of
Malawi
Mauritius
Seychelles
South Africa
Swaziland
Tanzania, United Rep of
Zambia
Zimbabwe
1995
1.158.937
15.401
2.900
99
5.800
11
516
75
5.269
0
570
60
101
1996
1.154.808
13.170
5.200
77
5.700
10
393
98
1.065
0
500
10
117
Year
1997
1998
1.239.336
1.274.661
11.551
9.812
5.100
4.700
102
73
4.839
2.200
10
5
246
324
98
160
803
996
11
20
189
1.100
0
20
153
214
1999
1.429.603
11.854
5.900
73
1.900
5
225
70
1.502
10
2.100
20
49
2000
1.410.444
15.085
10.200
102
1.600
5
537
207
1.075
112
1.200
20
27
Tomato Paste
Imports - Val (1000$)
World
Total de SADC
Botswana
Congo, Dem Republic of
Malawi
Mauritius
Seychelles
South Africa
Swaziland
Tanzania, United Rep of
Zambia
Zimbabwe
1995
1.150.764
15.725
313
9.000
11
487
187
4.772
0
760
60
135
1996
1.098.416
11.045
219
8.300
10
457
179
1.035
0
700
10
135
Year
1997
1998
1.034.477
1.081.540
7.044
5.964
258
150
5.527
2.900
10
4
192
225
161
267
536
866
23
29
176
1.350
0
20
161
153
1999
1.174.941
6.797
150
2.700
4
183
131
1.144
29
2.400
15
41
2000
930.394
4.200
258
1.500
4
380
255
607
54
1.100
15
27
Tomato Paste
Exports - Qty (Mt)
World
Total de SADC
Botswana
Malawi
Mauritius
South Africa
Swaziland
Zimbabwe
1995
1.218.498
266
3
0
0
187
0
76
1996
1.266.066
441
0
0
0
259
0
182
Year
1997
1998
1.504.886
1.515.840
521
604
1
0
11
15
0
0
379
544
80
9
50
36
1999
1.579.182
311
0
15
0
241
0
55
2000
1.621.741
215
1
15
1
194
0
4
Tomato Paste
Exports - Val (1000$)
World
Total de SADC
Botswana
Malawi
Mauritius
Seychelles
South Africa
Swaziland
Zimbabwe
1995
1.197.307
340
6
0
0
0
242
0
92
1996
1.202.512
552
2
0
0
1
335
0
214
Year
1997
1998
1.223.961
1.277.103
536
761
2
0
4
5
0
1
0
1
434
722
40
6
56
26
1999
1.261.547
420
0
5
1
1
368
0
45
2000
1.057.079
247
2
5
2
0
234
0
4
______________________________________________________________
Appendix 3
47
Tomatojuice Concentrated
Imports - Qty (Mt)
World
1995
50.700
1996
49.887
Year
1997
60.495
1998
58.009
1999
18.090
2000
20.679
Tomatojuice Concentrated
Imports - Val (1000$)
World
1995
22.020
1996
23.181
Year
1997
26.394
1998
27.579
1999
7.392
2000
7.936
Tomatojuice Concentrated
Exports - Qty (Mt)
World
1995
1996
1997
1998
1999
2000
Tomatojuice Concentrated
Exports - Val (1000$)
World
1995
Year
558
454
445
227
890
972
Year
1996
370
1997
245
1998
194
1999
126
______________________________________________________________
Appendix 3
2000
554
624
1
APPENDIX 4: PRE-VIABILITY STUDY FOR THE COCONUT
PRODUCTS FACTORY
IN INHAMBANE/MAXIXE
LVSDI
AGRI-PROCESSING SECTORIAL STUDIES
PROJECT 3: CONSTRUCTION OF AN INTEGRATED
COCONUT PRODUCTS FACTORY
IN INHAMBANE/MAXIXE
(FINAL REPORT)
SUMMARY
I. SHORT PRESENTATION
II
SUMMARY OF THE PRE-VIABILITY INDICATORS
III
1.
2.
3.
PROJECT CONTEXT
Agricultural sector
Agro-Industrial sector
Commercial/Marketing Sector
IV ANALYSIS OF ECONOMIC AND FINANCIAL VIABILITY
1. Assumptions
2. Investment
3. Financing Plan
4. Income
5. Costs
SCENARIOS (2)
1.
2.
3.
4.
5.
6.
Provisional demonstration of results
Profitability indicators
Sensitivity Analysis
Economic Indicators
Provisional Balance-sheet
Financial Indicators
APPENDICES
1. Technology, technical equipment, technical coefficients, and
others.
2. Statistics on prices, production, income, imports, exports.
3. Diagnosis and Strategy for the Agricultural Sector
4. Diagnosis and Strategy for Agro-Industry
______________________________________________________________
Appendix 3
2
SHORT PRESENTATION
Among the various processing units visited and studied, we recommend the
construction of an integrated factory of coconut derivatives, to be set up in the
Inhambane or Maxixe area, for the following reasons:
This location seems optimal to use since it is in an area thick with coconut palms
(there are no signs of the presence of the lethal yellowing disease present in the
Zambezia coconut plantations), and of easy access; a series of infrastructures,
such as electricity, are available;
A shareholding structure that brings together a range of stakeholders in the
coconut and copra chain: members of the association of producers, producers
and traders;
It can play an important role in encouraging the planting of coconut palms (new
varieties; dwarf palms), serving as a bridge between funding agencies and the
producers, and absorbing their production;
It can play a decisive role as a pilot project (demonstration effect), guaranteeing
the creation of more national value added, starting from one of the greatest
natural riches of this region, and diversifying the processed products, which have
guaranteed markets;
The production is mostly for export;
It can be rapidly implemented, it has markets guaranteed, it will have a major
impact on the economy of the region and of the country (the country needs to
create more added value from its natural riches), it will generate jobs, directly
and indirectly (encouraging people to stay in the area, and improving their
standard of living).
The
basic
pre-viability
factors
presented
should
be
more
deeply
through
subsequent
market
studies
and
economic viability studies.
looked
technical
______________________________________________________________
Appendix 3
into
and
3
PROJECT DESCRIPTION
Sector
Coconut
products
factory
Description
Two integrated
units (production
and processing,
with mutual
participation in
the capital).
Promotion,
extension,
processing
of coconuts and
derivatives
Products/byproducts
*
*
oil
*
*
*
*
*
*
*
*
Crude copra oil
Refined copra
Margarine
Bagasse
Laundry soap
Toilet soap
Grated coconut
Coconut milk
Charcoal
Fibre
Strong Points
Other
important
Data
Allows
This may
renewal of trees encourage
Plant hybrid
the existing
varieties where
company
the coconuts can "Copromol"
be more easily
which is
harvested (dwarf operating,
palms)
but only
Stabilises the extracting
market
crude oil
Encourages
and
farmers
bagasses,
Allows
100% for
industry to pay
export, to
the farmers more which
Large amount should be
of value added
suggested
Less
adjustments
vulnerability to a to guarantee
single market
success:
create more
value added,
and
integrate
the
agricultural
component
in
partnership
with the
family
sector.
______________________________________________________________
Appendix 3
4
I.
SUMMARY OF PRE-FEASIBILITY INDICATORS
T
Summary of pre-viability indicators for Project 3 -Integrated
Coconut derivatives processing factory in Inhambane/Maxixe
SCENARIO 1 – Cautious
I
N
D
I
C
A
T
O
R
S
I
N
D
I
C
A
T
O
R
S
Investment needed
3,327,668 USD
Break-even year
Year 3
"Break-Even"
1,758,383 USD
Sales in Break-even year
2,321,758 USD
Pay back period
57 months
IRR
17.03 %
NPV
245,398 USD
SCENARIO 2 – Realistic
Investment needed
3,317,469 USD
Break-even year
Year 3
"Break-Even"
1,637,010 USD
Sales in Break-even year
2,356,473 USD
Pay back period
55 months
IRR
21.67 %
NPV
517,617 USD
CONCLUSIONS
From analysing the economic and financial indicators of profitability, presented in the
following chapters, one notes that the "project to build an integrated factory of coconut
derivatives" is technically, economically and financially viable (in terms of pre-viability).
The precautions taken in the assumptions used, and sensibility analysis made of the
project's critical parameters, give it a very reasonable safety margin, and significantly
reduce the project risk.
For purposes of pre-viability, the net benefits arising from the coconut derivatives
which constitute the diversification of this unit, and the great value added in
comparison with those already established (better margins, less dependence on the
clients for oil, greater stability, greater national value added) were not considered.
______________________________________________________________
Appendix 3
5
These conclusions will be real to the extent that the constraints identified in general
terms on the agricultural sector and on agro-industry are overcome. In the Draft Report
on the "Diagnosis and Strategy Advocated", suggestions are made for solving a
significant part of these constraints in terms of private initiative.
In the investment and costs forecast, measures and the respective resources for
ensuring the supply of raw material, which has been one of the main constraints on the
factories already established, are safeguarded.
______________________________________________________________
Appendix 3
6
III
CONTEXT
As mentioned in the draft report concerning the diagnosis and the
development
strategy
of
the
agricultural
sector
and
of
agroindustry,
the
viability
of
the
coconut
harvest
in
the
Limpopo
Valley depends, summarily, on the following factors:
1.
Improving the existing infrastructures (public initiative)
Improving access: road and rail networks
Stability
in
the
supply
telecommunications
of
energy,
and
of
fixed
and
mobile
Improvement in the education and health services
Reducing
red
tape
in
the
public
sector
and
increasing
its
efficiency.
Create
mechanisms
for
decentralising
state
decisions
and control over all actors, in order to reduce the conditions
that
lead
to
the
proliferation
of
vices
that
divert
their
behaviour away from the national interest.
Ensure
that
the law as
activities.
public
regards
2.
Investment
in
administrative
staff,
professionals.
3.
and
private
economic
agents
comply
with
tax and customs evasion, and the licensing of
professional
training,
for
salespersons
and
farmers,
other
workers,
relevant
Investment in research and in extension services
4.
Availability
of
services:
accountancy,
legal
services,
the
treatment
and
availability
of
data
concerning
markets
(for
productive
factors,
and
for
primary
and
manufactured
products
nationally
and
internationally),
transport
of
goods,
storage,
training, recruitment, financial services, etc.
5.
Overcome the reluctance of the financial sector to finance
agriculture
and
reduce
the
interest
rates
currently
charged,
which on their own make non-viable any business in this sector
(suggestions
have
been
made,
notably
for
the
creation
by
the
state of a guarantee fund, which would cover part of the risks of
the financial and insurance sectors).
IN SHORT, CREATE THE SO FAR NON-EXISTENT ''BUSINESS ENVIRONMENT''
WHICH IS INDISPENSABLE FOR THE SUCCESS OF ANY PROJECT.
______________________________________________________________
Appendix 3
7
6.
Agricultural sector
Currently there is a large number of trees in the Limpopo Valley,
and
it
is
estimated
that
annual
production
is
in
excess
of
100,000 tonnes of coconuts (mainly of the tall variety, and with
a use rate not higher than 80% of production). The palm groves
are
mainly
owned
by
the
family
sector
(unlike
the
situation
in
Zambezia.
Mostly
the
farmers
merely
collect
the
fruit,
and
do
little management. The national and regional market is huge, and
the
Limpopo
Valley
has
excellent
natural,
infrastructural
and
historical
conditions
for
developing
the
production
of
coconut
products,
in
large
quantities,
and
in
a
competitive
manner.
As
the
Draft
Report
notes,
within
the
agricultural
following
conditions
are
indispensable
to
make
production of coconuts:
sector,
viable
the
the
Encourage
the
introduction
into
the
family
sector
of
dwarf
varieties, and carry out extension work for managing the coconut
plantations (although the coconut disease present in Zambezia has
not yet reached Inhambane, preventive measures must be taken).
To
encourage
the
business
sector,
the weight of the informal economy.
it
is
necessary
to
reduce
Encourage
agro-industry
to
promote
planting,
and
establish
private methods, following market laws, of financing farmers on
time, and with interest rates that their activity will bear.
Encourage
the
insurance
at tolerable prices.
7.
sector
to
launch
"harvest
insurance"
Agro-industrial sector
As
the
Draft
Report
notes,
within
the
agro-industrial
sector,
the
following
conditions
are
indispensable
to
make
viable
coconut
processing units:
Availability and stability in the supply of raw material
Quality of the raw material
Undertake
extension,
specialised agents
complementary
to
the
state
or
other
Undertake
promotion,
specialised agents
complementary
to
the
state
or
other
Availability
of
skilled
labour
read;
sense
of
responsibility
as
organisation; no vices)
(essentially,
regards
their
ability
role
in
Creation of "Limpopo Valley" brands of coconut products.
Existence of services for certifying origin
______________________________________________________________
Appendix 3
to
the
8
Investment
in
marketing:
focus
certification
of
origin
(these
market
they
have
exponential
growth
rates,
appropriate for new brands that are entering).
8.
on
quality
and
on
segments
are
still
niches,
and
are
highly
profitable,
Commercial sector/marketing
This
sector
is
not
a
block
on
the
development
of
the
coconut
harvest.
There
are
already
agents
that
supply
these
services,
or
if
more
agents
are
necessary,
the
market
will
ensure
that
they
appear:
Suppliers of goods transport services;
Warehouses;
"Tradings"
Distributors and retailers;
Communications, marketing and advertising companies etc.
Companies which design, develop and produce packaging.
At
this
level
it
is
IMPORTANT
to
set
up
create the body that will manage and inspect
CERTIFICATE OF ORIGIN, to be used as a BRAND.
the
the
regulations
and
LIMPOPO VALLEY
______________________________________________________________
Appendix 3
9
IV
1.
ANALYSIS OF ECONOMIC AND FINANCIAL VIABILITY
Assumptions
SCENARIOS
Two scenarios were developed, which are
assumptions
concerning
the
sales
price
refined oil, and the purchase price of copra.
different only as
of
the
final
to the
product,
Coconut Derivatives Sales Price, August 2002
Product
Crude oil
Refined oil
Copra
SALES PRICE
"Limpopo Valley" coconut derivatives
Scenario 1 - Cautious
Scenario 2 - Realistic
(1)
(1)
Year 1: 350 USD/Tonne
Year 1: 350 USD/Tonne
Year 2 to 5: 354 to 364 USD/Tonne
Year 2 to 5: 354 to 364 USD/Tonne
depending on inflation.
depending on inflation.
(1)
Year 1: 550 USD/Tonne
Year 2 to 5: 556 to 572 USD/Tonne
depending on inflation.
(1)
Year 1: 575 USD/Tonne
Year 2 to 5: 581 to 598 USD/Tonne
depending on inflation.
(2)
Year 1: 100 USD/Tonne
Year 2 to 5: 101 to 104 USD/Tonne
depending on inflation.
(2)
Year 1: 95 USD/Tonne
Year 2 to 5: 96 to 99 USD/Tonne
depending on inflation.
Notes:
1.
2.
3.
Prices obtained by reference to the market prices of the industries already operating (100% exports to
South Africa), in the case of crude oil, and international market prices for this and for refined oil (June
2002): Crude oil, CIF - duty paid Liverpool, 322 USD/tonne; Refined oil, Ex-Works UK 442 USD/tonne.
Prices obtained by reference to the prices currently paid by the industry. These prices of around 85
USD/tonne are low, and in our understanding do not encourage the farmer to sell fresh coconuts, or
even to harvest them (shortage of labour to climb the high varieties of trees). Price of copra from the
Philippines in June 2002: CIF-Rotterdam, 266.5 USD/tonne.
It was considered that international prices will remain stable over the five years of the study, evolving
only in accordance with dollar inflation.
______________________________________________________________
Appendix 3
10
OTHER GENERAL ASSUMPTIONS
The
investments
needed,
from
buildings/building
work,
to
industrial,
transport
and
administrative
equipment,
training,
marketing,
studies,
formation,
licences
and
permits,
are
quantified in detail.
The
technology
acquired
(German)
maximise yields from the factory.
will
make
it
possible
to
The factory is autonomous in terms of transport.
The
following
financial
structure
was
considered:
capital
or
the
equivalent,
and
70%
bank
funding.
interest rate (10%) was considered, without any improvement.
30%
own
A
market
The
complete
payment
of
all
tax
obligations
(VAT,
income
tax,
corporation
tax,
social
security)
has
been
considered,
without
any
fiscal
benefit
(this
ought
to
be
granted
by
the
state,
ensuring
that
it
reverts
to
the
suggested
rural
development company).
A
"2%
surprise
factor"
on
total
income
is
considered,
the heading "other expenses and costs" in the balance sheet.
under
A 13% rate of updating Cash flows was used.
A
1%
dollar
inflation
rate
throughout the period of the study.
Investment,
income
and
costs
other than crude oil and refined oil.
was
are
used
not
as
quantified
an
estimate
for
products
NOTE: Part of the data used was gathered from the Limpopo Valley
stakeholders,
namely
farmers
from
the
business
sector,
agroindustry
(Copromol
and
Somoil),
commercial
sector,
technicians
and
other
staff
from
public
bodies,
among
others,
apart
from
studies and the available secondary information.
______________________________________________________________
Appendix 3
11
2.
Investment
OVERALL INVESTMENT PLAN
ITEM
Unit:dollars
1
FIXED TANGIBLE ASSETS
Buildings and Annexes
INDUSTRIAL EQUIPMENT(45 tonnes/day)
Transport equipment
Agricultural Extension equipment
2 777 475$00
1 055 000$00
1 187 475$00
485 000$00
50 000$00
FIXED INTANGIBLE ASSETS
Licences, Charters
Company Constitution
Professional Training Plan Implementation
Feasibility Study
Marketing Plan Implementation
52 500$00
2 500$00
2 500$00
15 000$00
7 500$00
25 000$00
FIXED ASSETS INVESTMENT
INVESTMENT IN WORKING CAPITAL
TOTAL
2 829 975$00
497 593$00
3 327 568$00
______________________________________________________________
Appendix 3
12
INVESTMENT IN WORKING CAPITAL
ITEMS
1. Current Assets
2. Clients
DAYS
30
1
30 353$00
2
33 443$00
3
33 729$00
4
34 066$00
Unit:dollars
5
34 407$00
30
170 701$00
181 986$00
193 480$00
195 415$00
197 369$00
3. Stocks
30
81 675$00
87 075$00
92 574$00
93 500$00
94 435$00
4. Stocks' Suppliers
30
96 525$00
96 201$00
101 535$00
102 092$00
103 113$00
663 344$00
348 230$00
315 114$00
194 278$00
371 251$00
138 141$00
205 663$00
394 699$00
207 720$00
398 646$00
209 797$00
402 632$00
2 401$00
2 425$00
50 895$00
2 441$00
190 926$00
2 465$00
192 835$00
2 490$00
1 324$00
1 337$00
1 345$00
1 358$00
1 372$00
497 593$00
497 593$00
340 682$00
- 156 911$00
163 567$00
- 177 115$00
26 140$00
- 137 427$00
26 401$00
261$00
2
3
4
Unit:dollars
5
81 675$00
94 991$00
1 058 211$00
1 044 896$00
94 991$00
100 990$00
1 116 888$00
1 110 889$00
100 990$00
102 000$00
1 123 008$00
1 121 998$00
102 000$00
103 020$00
1 134 238$00
1 133 218$00
5. State
- Paid VAT
- Settled VAT
- Credited VAT
- Outstanding VAT
- Income Tax
6. Social Security
7. Net Current Assets Needs
8. Net Current Assets Investment
1
Initial Stocks
Final Stocks
Purchases
Purchases of Goods for Resale
81 675$00
1 061 775$00
980 100$00
______________________________________________________________
Appendix 3
13
2. Plano de Financiamento
PROJECT'S FINANCING PLAN
Unit:dollars
ITEMS
1
1. SOURCES
Capital and Reserves
Equity
Suplementary Instalments
Debt Capital
Bank Loans
Partners' Loans
831 892$00
831 892$00
2 495 676$00
2 329 298$00
166 378$00
Subsidies
Forfeited Funds for Investment
Forfeited Funds for PTs
TOTAL
3 327 568$00
2. APPLICATIONS
Fixed Assets Investiment
Net Current Assets Investment
TOTAL
2 829 975$00
497 593$00
3 327 568$00
______________________________________________________________
Appendix 3
14
3. Benefits
Although the long term strategy should follow a line of differentiating the final
product (brand, quality, and all the derivatives already mentioned which are
found to be profitable), with much better margins, only the processing of copra
into crude oil, refined oil and the use of the bagasse by-product were
considered.
There is no problem with the capacity of the market to absorb the production of
this unit (quantity), if we take the following indicators into account:
-
Mozambique imports much of the refined oil that it consumes;
-
South Africa already imports 100% of the crude oil produced, over
20,000 tonnes/year;
-
The current units producing copra oil in the Limpopo Valley (five) are
unable to meet external demand, for lack of raw material;
-
The productive capacity of Limpopo Valley copra is higher than 600,000
tonnes/year (at an average of 275 grams of copra per coconut), of which
less than 10% goes to the industry;
The bagasse by-product is quantified at national market prices. It should be
mentioned that with the development of the livestock sector, copra bagasse will
certainly find a large market to be supplied, given its excellent characteristics as
animal feed.
4. Costs
The raw material is acquired from the producers at prices that result from the
implementation of the measures defined in the "Draft Report" of the Diagnosis
and Strategy for the Agricultural Sector (appendix). The assumptions used are
attainable, through a greater valuing of copra, generating further national added
value, with the production of some of the derivatives mentioned.
Although new equipment with current technology will be acquired, industrial
yields 50% below the level of the best world producers (66%) were considered.
It was also projected that the factory will start with a 90% efficiency in year
one, advancing to 95% in year 2, and 100% in the following years
The provision of services, third party suppliers, staff costs, depreciation of
equipment have been exhaustively quantified at market prices (including multirisk insurance, work accidents, stock, 2% maintenance and conservation on the
initial value of the investment, advertising and others), as can be noted in the
respective tables.
Under the heading of financial costs of operations are envisaged costs derived
from promoting the plantation of new coconut palms (equivalent to 2% on the
value of the annual purchases).
ALL THE REMAINING ASSUMPTIONS AND RESPECTIVE TABLES ARE PRESENTED
BELOW IN RELATION TO THE 2 SCENARIOS USED.
______________________________________________________________
Appendix 3
15
SCENARIO 1 - Cautious
1. Benefits
INSTALLED AND USED PRODUCTIVE CAPACITY
SERVICES/PRODUCTS
Installed Productive Capacity (Ton.Hour/copra)
Efficiency Rate
1
1,9
90%
2
1,9
95%
3
1,9
100%
4
1,9
100%
5
1,9
100%
Shifts:
I
II
III
Daily total of Hours/Machinery (H/M)
No. of working days/ Year
8
8
8
24
242
8
8
8
24
242
8
8
8
24
242
8
8
8
24
242
8
8
8
24
242
9801
4901
10346
5173
10890
5445
10890
5445
10890
5445
1
111
334
267
2
118
353
282
3
124
371
297
4
124
371
297
5
124
371
297
713
752
792
792
792
1
550$00
350$00
30$00
2
556$00
354$00
30$00
3
561$00
357$00
31$00
4
567$00
361$00
31$00
Unit:dollars
5
572$00
364$00
31$00
1
61 256$00
116 944$00
8 019$00
2
65 306$00
124 675$00
8 549$00
3
69 431$00
132 549$00
9 089$00
4
70 125$00
133 875$00
9 180$00
Unit:dollars
5
70 826$00
135 213$00
9 272$00
186 219$00
198 530$00
211 069$00
213 180$00
215 311$00
1
673 819$00
1 286 381$00
88 209$00
2
718 366$00
1 371 425$00
94 041$00
3
763 736$00
1 458 042$00
99 980$00
4
771 373$00
1 472 622$00
100 980$00
Unit:dollars
5
779 087$00
1 487 348$00
101 990$00
2 048 409$00
2 183 832$00
2 321 758$00
2 344 975$00
2 368 425$00
TOTAL (Ton. Copra processed/ year) TOTAL (Ton. crude oil processed) -
MONTHLY QUANTITIES (Ton.)
SERVICES/PRODUCTS
Refined copra oil (25% of total)
Crude copra oil (75% of total)
Bagasse
TOTAL
UNIT PRICE (USD/TON)
SERVICES/PRODUCTS
Refined copra oil (25% of total)
Crude copra oil (75% of total)
Bagasse
TOTAL
MONTHLY PROVISIONAL PROFITS
SERVICES/PRODUCTS
Refined copra oil (25% of total)
Crude copra oil (75% of total)
Bagasse
TOTAL
ANNUAL PROVISIONAL PROFITS
SERVICES/PRODUCTS
Refined copra oil (25% of total)
Crude copra oil (75% of total)
Bagasse
TOTAL
______________________________________________________________
Appendix 3
16
2.
Costs
PURCHASES: QUANTITIES (per month)
RAW MATERIALS
1
891
2
941
3
990
4
990
Unid.: Ton.
5
990
TOTAL
891
941
990
990
990
RAW MATERIALS
1
100$00
2
101$00
3
102$00
4
103$00
Unit:dollars
5
104$00
TOTAL
100$00
101$00
102$00
103$00
104$00
RAW MATERIALS
1
89 100$00
2
94 991$00
3
100 990$00
4
102 000$00
Unit:dollars
5
103 020$00
TOTAL
89 100$00
94 991$00
100 990$00
102 000$00
103 020$00
RAW MATERIALS
1
980 100$00
2
1 044 896$00
3
1 110 889$00
4
1 121 998$00
Unit:dollars
5
1 133 218$00
TOTAL
980 100$00
1 044 896$00
1 110 889$00
1 121 998$00
1 133 218$00
1
2
3
4
Unit:dollars
5
3 000$00
1 400$00
1 000$00
250$00
1 114$00
200$00
1 718$00
200$00
300$00
2 711$00
1 000$00
200$00
2 315$00
500$00
100$00
500$00
16 507$00
3 030$00
1 414$00
1 010$00
253$00
1 125$00
202$00
1 735$00
202$00
303$00
2 738$00
1 010$00
202$00
2 338$00
505$00
101$00
505$00
16 672$00
3 060$00
1 428$00
1 020$00
255$00
1 136$00
204$00
1 753$00
204$00
306$00
2 765$00
1 020$00
204$00
2 361$00
510$00
102$00
510$00
16 839$00
3 091$00
1 442$00
1 030$00
258$00
1 147$00
206$00
1 770$00
206$00
309$00
2 793$00
1 030$00
206$00
2 385$00
515$00
103$00
515$00
17 007$00
3 122$00
1 457$00
1 041$00
260$00
1 159$00
208$00
1 788$00
208$00
312$00
2 821$00
1 041$00
208$00
2 409$00
520$00
104$00
520$00
17 177$00
Copra
UNIT COST ($/Ton.)
Copra
MONTHLY PURCHASES OF RAW MATERIALS
Copra
ANNUAL PURCHASES OF RAW MATERIALS
Copra
MONTHLY EXTERNAL CHARGES FOR SERV
ECS
Sub-contracts
Electricity
Fuels
Water
Fast weathering tools and utensiles
Pakages
Office Supplies
Chemical products and others
Communication
Accountancy postage
Insurance
Travel and accommodation
Fees and commissions
Maintenance and Repair
Advertising and publicity
Cleaning, hygiene and comfort
Other ECSs
TOTAL
______________________________________________________________
Appendix 3
17
ANNUAL ECS
1
2
3
4
Unit:dollars
5
39 600$00
18 480$00
13 200$00
3 300$00
13 365$00
2 640$00
22 680$00
2 400$00
3 600$00
32 528$00
12 000$00
2 400$00
30 552$00
6 000$00
1 320$00
6 600$00
210 666$00
39 996$00
18 665$00
13 332$00
3 333$00
13 499$00
2 666$00
22 907$00
2 424$00
3 636$00
32 854$00
12 120$00
2 424$00
30 858$00
6 060$00
1 333$00
6 666$00
212 772$00
40 396$00
18 851$00
13 465$00
3 366$00
13 634$00
2 693$00
23 136$00
2 448$00
3 672$00
33 182$00
12 241$00
2 448$00
31 166$00
6 121$00
1 347$00
6 733$00
214 900$00
40 800$00
19 040$00
13 600$00
3 400$00
13 770$00
2 720$00
23 367$00
2 473$00
3 709$00
33 514$00
12 364$00
2 473$00
31 478$00
6 182$00
1 360$00
6 800$00
217 049$00
41 208$00
19 230$00
13 736$00
3 434$00
13 908$00
2 747$00
23 601$00
2 497$00
3 746$00
33 849$00
12 487$00
2 497$00
31 793$00
6 244$00
1 374$00
6 868$00
219 220$00
FSE
Sub-contracts
Electricity
Fuels
Water
Fast weathering tools and utensiles
Pakages
Office Supplies
Chemical products and others
Communication
Accountancy postage
Insurance
Travel and accommodation
Fees and commissions
Maintenance and Repair
Advertising and publicity
Cleaning, hygiene and comfort
Other ECSs
TOTAL
MONTHLY COSTS WITH STAFF
1
2
3
4
Unit:dollars
5
GM+CM+FM+PM
- Fees
- Chargers
- Meal Allowance
5 304$00
5 100$00
204$00
5 357$00
5 151$00
206$00
5 411$00
5 203$00
208$00
5 465$00
5 255$00
210$00
5 519$00
5 307$00
212$00
Workers
- Fees
- Expenses
- Meal Allowance
4 430$00
4 260$00
170$00
4 475$00
4 303$00
172$00
4 475$00
4 303$00
172$00
4 519$00
4 346$00
174$00
4 565$00
4 389$00
176$00
Adminitrative Staff
- Fees
- Expenses
- Meal Allowance
3 063$00
2 945$00
118$00
3 093$00
2 974$00
119$00
3 124$00
3 004$00
120$00
3 156$00
3 034$00
121$00
3 187$00
3 065$00
123$00
12 797$00
12 925$00
13 010$00
13 140$00
13 271$00
STAFF
TOTAL
______________________________________________________________
Appendix 3
18
ANNUAL COSTS WITH STAFF
1
2
3
4
Unit:dollars
5
GM+CM+FM+PM
- Fees
- Chargers
- Meal Allowance
63 648$00
61 200$00
2 448$00
64 284$00
61 812$00
2 472$00
64 927$00
62 430$00
2 497$00
65 577$00
63 054$00
2 522$00
66 232$00
63 685$00
2 547$00
Workers
- Fees
- Expenses
- Meal Allowance
53 165$00
51 120$00
2 045$00
53 696$00
51 631$00
2 065$00
53 696$00
51 631$00
2 065$00
54 233$00
52 148$00
2 086$00
54 776$00
52 669$00
2 107$00
Adminitrative Staff
- Fees
- Expenses
- Meal Allowance
36 754$00
35 340$00
1 414$00
37 121$00
35 693$00
1 428$00
37 492$00
36 050$00
1 442$00
37 867$00
36 411$00
1 456$00
38 246$00
36 775$00
1 471$00
153 566$00
155 102$00
156 116$00
157 677$00
159 254$00
1
1 020$00
426$00
295$00
1 741$00
2
1 030$00
430$00
297$00
1 758$00
3
1 041$00
430$00
300$00
1 771$00
4
1 051$00
435$00
303$00
1 789$00
Unit:dollars
5
1 061$00
439$00
306$00
1 807$00
1
153$00
128$00
88$00
369$00
2
155$00
129$00
89$00
373$00
3
156$00
129$00
90$00
375$00
4
158$00
130$00
91$00
379$00
Unit:dollars
5
159$00
132$00
92$00
383$00
STAFF
TOTAL
MONTHLY Income Tax
Rate
20,00%
10,00%
10,00%
STAFF
GM+CM+FM+PM
Workers
Adminitrative Staff
Total
SOCIAL SECURITY
Rate
3,00%
3,00%
3,00%
STAFF
GM+CM+FM+PM
Workers
Adminitrative Staff
Total
______________________________________________________________
Appendix 3
19
DEPRECIATION TABLE
DESIGNATION
VALUE
DEPRECIATION
RATE
1
2
3
4
5
I - FIXED PHYSICAL ASSETS
Buildings and Annexes
INDUSTRIAL EQUIPMENT(45 tonnes/day)
Transport equipment
Agricultural Extension equipment
1 055 000$00
1 187 475$00
485 000$00
50 000$00
4,00%
12,50%
20,00%
20,00%
42 200$00
148 434$00
97 000$00
10 000$00
42 200$00
148 434$00
97 000$00
10 000$00
42 200$00
148 434$00
97 000$00
10 000$00
42 200$00
148 434$00
97 000$00
10 000$00
42 200$00
148 434$00
97 000$00
10 000$00
II - FIXED NON PHYSICAL ASSETS
Licences, Charters
Company Constitution
Professional Training Plan Implementation
Feasibility Study
Marketing Plan Implementation
2 500$00
2 500$00
15 000$00
7 500$00
25 000$00
33,33%
33,33%
33,33%
33,33%
33,33%
833$00
833$00
5 000$00
2 500$00
8 333$00
833$00
833$00
5 000$00
2 500$00
8 333$00
833$00
833$00
5 000$00
2 500$00
8 333$00
315 134$00
315 134$00
315 134$00
297 634$00
297 634$00
TOTAL ( I+II )
2 829 975$00
Loan Term
Interest Rate
5
10,00% Deferred Period
Period
Year 1, 1st semester
Year 1, 2nd semester
Year 2, 1st semester
Year 2, 2nd semester
Year 3, 1st semester
Year 3, 2nd semester
Year 4, 1st semester
Year 4, 2nd semester
Year 5, 1st semester
Year 5, 2nd semester
Initial
Outstanding Capital
2 329 298$00
2 329 298$00
2 329 298$00
2 329 298$00
2 329 298$00
1 941 081$00
1 552 865$00
1 164 649$00
776 433$00
388 216$00
2
Amortisation
Interest
388 216$00
388 216$00
388 216$00
388 216$00
388 216$00
388 216$00
116 465$00
116 465$00
116 465$00
116 465$00
116 465$00
97 054$00
77 643$00
58 232$00
38 822$00
19 411$00
Amortisation
+ Interest
116 465$00
116 465$00
116 465$00
116 465$00
504 681$00
485 270$00
465 860$00
446 449$00
427 038$00
407 627$00
______________________________________________________________
Appendix 3
Unit:dollars
Final
Oustanding Capital
2 329 298$00
2 329 298$00
2 329 298$00
2 329 298$00
1 941 081$00
1 552 865$00
1 164 649$00
776 433$00
388 216$00
20
3.
Forecast operational accounts of the project
PREVISIONAL OPERATIONAL ACCOUNT OF THE PROJECT
Unit:dollars
ITEMS
1
2
3
4
5
1.Net Sales
1.1.Internal Market
1.2.External Market
2.Other Profits
2.1.Services Rendered
2.2.Other
3.Output Variation
2 048 409$00
2 048 409$00
2 183 832$00
2 183 832$00
2 321 758$00
2 321 758$00
2 344 975$00
2 344 975$00
2 368 425$00
2 368 425$00
4.Total
2 048 409$00
2 183 832$00
2 321 758$00
2 344 975$00
2 368 425$00
980 100$00
1 044 896$00
1 110 889$00
1 121 998$00
1 133 218$00
210 666$00
71 280$00
22 680$00
13 365$00
32 528$00
35 172$00
6 000$00
29 640$00
205$00
212 772$00
71 993$00
22 907$00
13 499$00
32 854$00
35 524$00
6 060$00
29 936$00
218$00
214 900$00
72 713$00
23 136$00
13 634$00
33 182$00
35 879$00
6 121$00
30 236$00
232$00
217 049$00
73 440$00
23 367$00
13 770$00
33 514$00
36 238$00
6 182$00
30 538$00
234$00
219 220$00
74 174$00
23 601$00
13 908$00
33 849$00
36 600$00
6 244$00
30 844$00
237$00
205$00
153 566$00
20 484$00
315 134$00
218$00
155 102$00
21 838$00
315 134$00
232$00
156 116$00
23 218$00
315 134$00
234$00
157 677$00
23 450$00
297 634$00
237$00
159 254$00
23 684$00
297 634$00
1 680 155$00
1 749 961$00
1 820 489$00
1 818 043$00
1 833 247$00
15.Operational Profit of the Exercise
368 254$00
433 871$00
501 269$00
526 933$00
535 178$00
16.Financial Costs
16.1.of Operational Nature
16.2.of Financing Nature
17.Extraordinary Costs and Losses
18.Profit Previous to Taxes
19.Provisions for Taxes on Profits
273 898$00
40 968$00
232 930$00
276 606$00
43 677$00
232 930$00
259 954$00
46 435$00
213 519$00
182 775$00
46 900$00
135 876$00
105 601$00
47 369$00
58 232$00
94 356$00
9 436$00
157 264$00
15 726$00
241 314$00
24 131$00
344 157$00
34 416$00
429 577$00
42 958$00
20.Net Profit
84 920$00
141 538$00
217 183$00
309 742$00
386 620$00
5.Cost of the Consumed National Stocks
6.Cost of the Consumed Imported Stocks
7.Subcontracts
8.Other External Charges for Services
8.1.Electricity/Water/Fuels
8.2.Rent
8.3.Communications
8.4.Insurance
8.5.Commissions
8.6.Publicity and Propaganda
8.5. Various External Charges for Services
9.Taxes
9.1.Direct
9.2.Indirect
10.Costs with Staff
11.Others Cost and Expenses
12.Depreciation and Reinsertion
13.Provisions
14.Total
______________________________________________________________
Appendix 3
21
4.
Indicators of profitability
PROJECT FINANCIAL INDICATORS
Net Present Value of the Project (NPV)
245 328$00
Internal Rentability Rate (IRR)
17,03%
Profitability Index (PI)
123,02%
Investment Recovery Period (IRP) - Months
57
PROJECT CASH-FLOWS
Unit:dollars
ITEMS
Total Annual Investment (1)
1
2
3
4
3 327 568$00
Investment Residual Value (2)
Operational Cash-Flow (3)
5
1 315 704$00
632 984$00
689 602$00
745 836$00
743 252$00
742 486$00
-2 694 584$00
689 602$00
745 836$00
743 252$00
2 058 191$00
560 163$00
689 602$00
745 836$00
743 252$00
742 486$00
-2 384 587$00
245 328$00
-2 384 587$00
540 059$00
516 902$00
455 850$00
1 117 103$00
-1 844 528$00
-1 327 626$00
- 871 776$00
245 328$00
Cash-Flow Previous to the Project (4)
Project's Cash-Flow (3+2-1-4)
Present Value of Operational CF
Present Value of CF
NPV
Accumulated CF
______________________________________________________________
Appendix 3
22
5.
Sensitivity analysis
SENSITIVITY ANALYSIS
Variation
-10%
-5%
10%
5%
Calculated
Indicator
NPV
IRR
NPV
IRR
NPV
IRR
NPV
IRR
Sale
Price
- 161 205$00
10,7%
250 310$00
16,6%
1 448 806$00
35,2%
1 049 338$00
28,8%
Unit:dollars
CRITICAL PARAMETERS CONSIDERED
Cost
Investment
Sales
Level
Cost
Level
1 188 680$00
834 134$00
296 722$00
31,0%
26,6%
17,3%
919 275$00
742 002$00
473 296$00
26,7%
24,5%
19,9%
110 154$00
465 606$00
1 003 019$00
14,6%
19,3%
28,0%
380 465$00
557 738$00
826 445$00
18,5%
20,8%
25,3%
______________________________________________________________
Appendix 3
23
6. Economic indicators
COMPANY COSTS' STRUCTURE
ITEMS
Total Profits
Consumed Stocks
Subcontracts
ECSs
Taxes
Costs with Staff
Other Costs and Expenses
Depreciation and Reinsertion Provisions
Provisions
Financial Costs of Operational Nature
Financial Costs of Financing Nature
Net Profit
1
2
3
4
5
2 048 409$00
47,85%
2 183 832$00
47,85%
2 321 758$00
47,85%
2 344 975$00
47,85%
2 368 425$00
47,85%
10,28%
0,01%
7,50%
1,00%
15,38%
9,74%
0,01%
7,10%
1,00%
14,43%
9,26%
0,01%
6,72%
1,00%
13,57%
9,26%
0,01%
6,72%
1,00%
12,69%
9,26%
0,01%
6,72%
1,00%
12,57%
2,00%
11,37%
4,15%
2,00%
10,67%
6,48%
2,00%
9,20%
9,35%
2,00%
5,79%
13,21%
2,00%
2,46%
16,32%
COST'S STRUCTURE
Financial Costs of Financing Nature
Financial Costs of Operational
Nature
120,00%
Provisions
100,00%
Depreciation and Reinsertion
Provisions
80,00%
Other Costs and Expenses
60,00%
Costs with Staff
40,00%
Taxes
20,00%
ECSs
Subcontracts
0,00%
1
2
3
4
5
Consumed Stocks
COMPANY'S GROSS SALES MARGIN
Unit:dollars
ITEMS
Sales
Purchases of Goods for Resale
Gross Margin
1
2
3
4
5
2 048 409$00
980 100$00
1 068 309$00
2 183 832$00
1 044 896$00
1 138 936$00
2 321 758$00
1 110 889$00
1 210 869$00
2 344 975$00
1 121 998$00
1 222 978$00
2 368 425$00
1 133 218$00
1 235 207$00
______________________________________________________________
Appendix 3
24
COMPANY'S BREAK EVEN POINT
ITEM
Sales Volume
Margin (%)
Variable Costs
Net contribution margin
Net contribution margin (%)
Fixed Costs
Break Even point
Safety Margin
1
2
3
4
5
2 048 409$00
52,2%
1 175 815$00
872 594$00
42,60%
834 982$00
1 960 114$00
4,31%
2 183 832$00
52,2%
1 246 016$00
937 816$00
42,94%
837 862$00
1 951 076$00
10,66%
2 321 758$00
52,2%
1 317 503$00
1 004 255$00
43,25%
820 824$00
1 897 681$00
18,27%
2 344 975$00
52,2%
1 330 678$00
1 014 297$00
43,25%
728 603$00
1 684 472$00
28,17%
2 368 425$00
52,2%
1 343 985$00
1 024 440$00
43,25%
653 910$00
1 511 789$00
36,17%
BREAK EVEN POINT
2 500 000$00
2 000 000$00
1 500 000$00
1 000 000$00
500 000$00
$00
1
2
3
4
5
GROSS VALUE ADDED (GVA) AND COMPANY'S PRODUCTIVITY
Unit:dollars
ITEM
Costs with Staff
Financial Costs
Depreciation
Net Profit
GVA
No. of workers
Employees Total Productivity
Assets Total Productivity
1
153 566$00
273 898$00
315 134$00
84 920$00
827 519$00
75
11 034$00
23,49%
2
155 102$00
276 606$00
315 134$00
141 538$00
888 381$00
75
11 845$00
25,36%
3
156 116$00
259 954$00
315 134$00
217 183$00
948 388$00
75
12 645$00
31,93%
4
157 677$00
182 775$00
297 634$00
309 742$00
947 828$00
75
12 638$00
37,17%
5
159 254$00
105 601$00
297 634$00
386 620$00
949 109$00
75
12 655$00
43,74%
GVA AND PRODUCTIVITY
1 000 000$00
800 000$00
Employees Total
Productivity
GVA
600 000$00
400 000$00
200 000$00
$00
1
2
3
4
5
COMPANY'S ECONOMIC RATIOS
ITEM
Operational Released Resources
Equity Profitability
Sales Gross Profitability
Sales Net Profitability
Sales Operational Profitability
Assets Economic Profitability
Assets Profitability
1
2
3
4
5
632 984$00
9,26%
52,15%
4,61%
30,90%
17,97%
10,46%
689 602$00
13,37%
52,15%
7,20%
31,58%
19,68%
12,38%
745 836$00
17,03%
52,15%
10,39%
32,12%
25,11%
16,87%
743 252$00
19,54%
52,15%
14,68%
31,70%
29,15%
20,67%
742 486$00
19,61%
52,15%
18,14%
31,35%
34,22%
24,66%
______________________________________________________________
Appendix 3
25
7.
Forecast balance sheet
Unit:dollars
ITEMS
1
2
3
4
5
2 829 975$00
52 500$00
2 777 475$00
2 829 975$00
52 500$00
2 777 475$00
2 829 975$00
52 500$00
2 777 475$00
2 829 975$00
52 500$00
2 777 475$00
2 829 975$00
52 500$00
2 777 475$00
315 134$00
630 269$00
945 403$00
1 243 037$00
1 540 672$00
81 675$00
485 815$00
170 701$00
315 114$00
439 843$00
87 075$00
320 127$00
181 986$00
138 141$00
896 429$00
92 574$00
193 480$00
193 480$00
93 500$00
195 415$00
195 415$00
94 435$00
197 369$00
197 369$00
799 948$00
673 917$00
588 928$00
3 522 173$00
3 503 337$00
2 970 574$00
2 549 769$00
2 170 035$00
831 892$00
831 892$00
831 892$00
831 892$00
831 892$00
84 920$00
84 920$00
141 538$00
226 458$00
217 183$00
443 641$00
309 742$00
753 383$00
386 620$00
916 812$00
1 058 350$00
1 275 533$00
1 585 275$00
1 971 894$00
2 495 676$00
2 329 298$00
166 378$00
2 329 298$00
2 329 298$00
1 552 865$00
1 552 865$00
776 433$00
776 433$00
109 685$00
115 689$00
142 176$00
188 062$00
198 141$00
96 525$00
13 160$00
96 201$00
19 488$00
101 535$00
40 641$00
102 092$00
85 971$00
103 113$00
95 028$00
19.Total Liabilities
2 605 361$00
2 444 987$00
1 695 041$00
964 495$00
198 141$00
20.Total Liabilities+ Equity
3 522 173$00
3 503 337$00
2 970 574$00
2 549 769$00
2 170 035$00
ASSETS
1.Gross Fixed Assets
1.1.Non - Physical
1.2.Physical
1.3.Financial
2.Depreciation and Reinsertion
3.Mid and Long Term Current Assets
4.Stocks
5.Short Term Current Assets
5.1.Clients
5.2.Other Debtors
6.Bank Deposits/Cash/Negotionable Assets
7.Prepayments and Deferred Income
8.Total Assets
EQUITY
9.Capital
10.Suplementary Instalments
11.Reserves / Unappropriated Earned Surplus
12.Net Profit
13.Interim Dividends
14.Total Equity
LIABILITIES
15.Provisions for Risks and Costs
16.Mid and Long Term Debts
16.1.Bank Loans
16.2.Partners' Loans
16.3.Other Debts
17.Short Term Debt
17.1.Bank Loans
17.2.Suppliers
17.3.Public Statal Sector
17.4.Other Debts
18.Prepayments and Deferred Income
______________________________________________________________
Appendix 3
26
8.
Financial Indicators
COMPANY'S BALANCE STRUCTURE
Unit:dollars
ITEMS
Fixed Assets
Circulating Capital
Equity
Long Term Liabilities
Short Term Liabilities
1
2
3
4
5
2 596 516$00
925 658$00
916 812$00
2 495 676$00
109 685$00
2 286 781$00
1 216 556$00
1 058 350$00
2 329 298$00
115 689$00
1 977 146$00
993 428$00
1 275 533$00
1 552 865$00
142 176$00
1 680 437$00
869 332$00
1 585 275$00
776 433$00
188 062$00
1 383 738$00
786 297$00
1 971 894$00
ASSET'S STRUCTURE
198 141$00
LIABILITIES AND EQUITY STRUCTURE
4 000 000$00
4 000 000$00
3 500 000$00
3 000 000$00
2 500 000$00
2 000 000$00
1 500 000$00
1 000 000$00
500 000$00
$00
3 500 000$00
3 000 000$00
Circulating Capital
Fixed Assets
2 500 000$00
Passivo Circ.
Exígivel LP
Capitais Próp.
2 000 000$00
1 500 000$00
1 000 000$00
500 000$00
$00
1
2
3
4
5
1
2
3
4
5
COMPANY'S FINANCIAL RATIOS
ITEM
Debt
Debt Recovery Period
Liability Average Cost
Financial Autonomy
Solvency
1
2
3
4
5
35,19%
6,24
10,51%
26,03%
35,19%
43,29%
5,10
11,31%
30,21%
43,29%
75,25%
2,92
15,34%
42,94%
75,25%
164,36%
1,28
18,95%
62,17%
164,36%
995,20%
53,30%
90,87%
995,20%
SOLVABILIDADE
AUTONOMIA FINANCEIRA
100,00%
1000,00%
80,00%
800,00%
60,00%
600,00%
40,00%
400,00%
20,00%
200,00%
0,00%
0,00%
1
2
3
4
5
1
2
3
4
______________________________________________________________
Appendix 3
5
27
COMPANY'S LIQUIDITY RATIOS
ITEMS
General Liquidity
Reduced Liquidity
Immediate Liquidity
1
2
3
4
5
9,18
8,44
4,01
11,27
10,52
7,75
7,64
6,99
5,63
5,12
4,62
3,58
4,44
3,97
2,97
LIQUIDITY
15,00
General Liquidity
Reduced Liquidity
Immediate Liquidity
10,00
5,00
0,00
1
2
3
4
5
OTHER COMPANY INDICATORS
ITEMS
Average Receiving Period (days)
Average Payment Period (days)
Assets Rotation
Stocks Rotation (days)
Costs with Staff/ Sales
Wage Productivity
Share of Fixed Assets Covered by Equity
1
30
36
58,16%
30
7,50%
538,87%
32,40%
2
30
34
62,34%
30
7,10%
572,77%
37,40%
3
30
33
78,16%
30
6,72%
607,49%
45,07%
4
30
33
91,97%
30
6,72%
601,12%
56,02%
5
30
33
109,14%
30
6,72%
595,97%
69,68%
1
2
3
4
5
3 412 488$00
2 514 841$00
897 647$00
567 490$00
109 685$00
457 805$00
439 843$00
3 387 647$00
2 199 706$00
1 187 941$00
407 201$00
115 689$00
291 512$00
896 429$00
2 828 398$00
1 884 572$00
943 826$00
286 054$00
142 176$00
143 878$00
799 948$00
2 361 707$00
1 586 938$00
774 769$00
288 914$00
188 062$00
100 852$00
673 917$00
1 971 894$00
1 289 303$00
682 591$00
291 804$00
198 141$00
93 663$00
588 928$00
439 843$00
896 429$00
799 948$00
673 917$00
588 928$00
COMPANY SCHEMATIC BALANCE
Unit:dollars
ITEM
Permanent Capital
Net Fixed Assets
WORKING CAPITAL (WC)
Cyclical Needs
Cyclical Resources
Net Current Assets Needs(WCI)
Active Treasury
Passive Treasury
Treasury
Treasury Control
TREASURY
1 200 000$00
1 000 000$00
800 000$00
WC
WCI
TREASURY
600 000$00
400 000$00
200 000$00
$00
1
2
3
4
5
______________________________________________________________
Appendix 3
28
SCENARIO 2 - REALISTIC
NOTE: Only the altered tables are shown
1.
Benefits
No alterations have been made.
2. Cost’s
PURCHASES: QUANTITIES (per month)
RAW MATERIALS
1
891
2
941
3
990
4
990
5
990
TOTAL
891
941
990
990
990
RAW MATERIALS
1
95$00
2
96$00
3
97$00
4
98$00
Unit:dollars
5
99$00
TOTAL
95$00
96$00
97$00
98$00
RAW MATERIALS
1
84 645$00
2
90 241$00
3
95 940$00
4
96 900$00
Unit:dollars
5
97 869$00
TOTAL
84 645$00
90 241$00
95 940$00
96 900$00
97 869$00
RAW MATERIALS
1
931 095$00
2
992 651$00
3
1 055 344$00
4
1 065 898$00
Unit:dollars
5
1 076 557$00
TOTAL
931 095$00
992 651$00
1 055 344$00
1 065 898$00
1 076 557$00
Copra
UNIT COST ($/Ton.)
Copra
99$00
MONTHLY PURCHASES OF RAW MATERIALS
Copra
ANNUAL PURCHASES OF RAW MATERIALS
Copra
______________________________________________________________
Appendix 3
29
MONTHLY EXTERNAL CHARGES FOR SERVICES
ECS
Sub-contracts
Electricity
Fuels
Water
Fast weathering tools and utensiles
Pakages
Office Supplies
Chemical products and others
Communication
Accountancy postage
Insurance
Travel and accommodation
Fees and commissions
Maintenance and Repair
Advertising and publicity
Cleaning, hygiene and comfort
Other ECSs
TOTAL
1
2
3
4
Unit:dollars
5
3 000$00
1 400$00
1 000$00
250$00
1 164$00
200$00
1 718$00
200$00
300$00
2 700$00
1 000$00
200$00
2 315$00
500$00
100$00
500$00
16 548$00
3 030$00
1 414$00
1 010$00
253$00
1 176$00
202$00
1 735$00
202$00
303$00
2 728$00
1 010$00
202$00
2 338$00
505$00
101$00
505$00
16 713$00
3 060$00
1 428$00
1 020$00
255$00
1 188$00
204$00
1 753$00
204$00
306$00
2 755$00
1 020$00
204$00
2 361$00
510$00
102$00
510$00
16 880$00
3 091$00
1 442$00
1 030$00
258$00
1 200$00
206$00
1 770$00
206$00
309$00
2 782$00
1 030$00
206$00
2 385$00
515$00
103$00
515$00
17 049$00
3 122$00
1 457$00
1 041$00
260$00
1 212$00
208$00
1 788$00
208$00
312$00
2 810$00
1 041$00
208$00
2 409$00
520$00
104$00
520$00
17 220$00
1
2
3
4
Unit:dollars
5
39 600$00
18 480$00
13 200$00
3 300$00
13 973$00
2 640$00
22 680$00
2 400$00
3 600$00
32 406$00
12 000$00
2 400$00
30 552$00
6 000$00
1 320$00
6 600$00
211 151$00
39 996$00
18 665$00
13 332$00
3 333$00
14 112$00
2 666$00
22 907$00
2 424$00
3 636$00
32 730$00
12 120$00
2 424$00
30 858$00
6 060$00
1 333$00
6 666$00
213 262$00
40 396$00
18 851$00
13 465$00
3 366$00
14 253$00
2 693$00
23 136$00
2 448$00
3 672$00
33 057$00
12 241$00
2 448$00
31 166$00
6 121$00
1 347$00
6 733$00
215 395$00
40 800$00
19 040$00
13 600$00
3 400$00
14 396$00
2 720$00
23 367$00
2 473$00
3 709$00
33 388$00
12 364$00
2 473$00
31 478$00
6 182$00
1 360$00
6 800$00
217 549$00
41 208$00
19 230$00
13 736$00
3 434$00
14 540$00
2 747$00
23 601$00
2 497$00
3 746$00
33 722$00
12 487$00
2 497$00
31 793$00
6 244$00
1 374$00
6 868$00
219 724$00
ANNUAL ECS
FSE
Sub-contracts
Electricity
Fuels
Water
Fast weathering tools and utensiles
Pakages
Office Supplies
Chemical products and others
Communication
Accountancy postage
Insurance
Travel and accommodation
Fees and commissions
Maintenance and Repair
Advertising and publicity
Cleaning, hygiene and comfort
Other ECSs
TOTAL
______________________________________________________________
Appendix 3
30
INVESTMENT IN WORKING CAPITAL
DAYS
30
1
30 393$00
2
33 488$00
3
33 774$00
4
34 111$00
Unit:dollars
5
34 453$00
2. Clients
30
173 253$00
184 707$00
196 373$00
198 336$00
200 320$00
3. Stocks
30
77 591$00
82 721$00
87 945$00
88 825$00
89 713$00
4. Stocks' Suppliers
30
91 699$00
91 391$00
96 459$00
96 987$00
97 957$00
655 116$00
353 436$00
301 680$00
185 501$00
376 802$00
110 378$00
196 326$00
400 600$00
198 289$00
404 606$00
200 272$00
408 652$00
2 401$00
2 425$00
93 896$00
2 441$00
206 317$00
2 465$00
208 380$00
2 490$00
1 324$00
1 337$00
1 345$00
1 358$00
1 372$00
487 494$00
487 494$00
316 141$00
- 171 353$00
123 952$00
- 192 189$00
14 145$00
- 109 806$00
14 287$00
141$00
2
3
4
Unit:dollars
5
77 591$00
90 241$00
1 005 300$00
992 651$00
90 241$00
95 940$00
1 061 044$00
1 055 344$00
95 940$00
96 900$00
1 066 857$00
1 065 898$00
96 900$00
97 869$00
1 077 526$00
1 076 557$00
ITEMS
1. Current Assets
5. State
- Paid VAT
- Settled VAT
- Credited VAT
- Outstanding VAT
- Income Tax
6. Social Security
7. Net Current Assets Needs
8. Net Current Assets Investment
1
Initial Stocks
Final Stocks
Purchases
Purchases of Goods for Resale
Loan Term
Interest Rate
77 591$00
1 008 686$00
931 095$00
5
10,00% Deferred period
Period
Year 1, 1st semester
Year 1, 2nd semester
Year 2, 1st semester
Year 2, 2nd semester
Year 3, 1st semester
Year 3, 2nd semester
Year 4, 1st semester
Year 4, 2nd semester
Year 5, 1st semester
Year 5, 2nd semester
Initial
Outstanding Capital
2 322 228$00
2 322 228$00
2 322 228$00
2 322 228$00
2 322 228$00
1 935 190$00
1 548 152$00
1 161 114$00
774 076$00
387 038$00
2
Amortisation
Interest
387 038$00
387 038$00
387 038$00
387 038$00
387 038$00
387 038$00
116 111$00
116 111$00
116 111$00
116 111$00
116 111$00
96 760$00
77 408$00
58 056$00
38 704$00
19 352$00
Amortisation
+ Interest
116 111$00
116 111$00
116 111$00
116 111$00
503 149$00
483 798$00
464 446$00
445 094$00
425 742$00
406 390$00
Unit:dollars
Final
Oustanding Capital
2 322 228$00
2 322 228$00
2 322 228$00
2 322 228$00
1 935 190$00
1 548 152$00
1 161 114$00
774 076$00
387 038$00
______________________________________________________________
Appendix 3
31
3.
Forecast operational accounts
Unit:dollars
ITEMS
1
2
3
4
5
1.Net Sales
1.1.Internal Market
1.2.External Market
2.Other Profits
2.1.Services Rendered
2.2.Other
3.Output Variation
2 079 037$00
2 079 037$00
2 216 485$00
2 216 485$00
2 356 473$00
2 356 473$00
2 380 038$00
2 380 038$00
2 403 838$00
2 403 838$00
4.Total
2 079 037$00
2 216 485$00
2 356 473$00
2 380 038$00
2 403 838$00
931 095$00
992 651$00
1 055 344$00
1 065 898$00
1 076 557$00
211 151$00
71 280$00
22 680$00
13 973$00
32 406$00
35 172$00
6 000$00
29 640$00
208$00
213 262$00
71 993$00
22 907$00
14 112$00
32 730$00
35 524$00
6 060$00
29 936$00
222$00
215 395$00
72 713$00
23 136$00
14 253$00
33 057$00
35 879$00
6 121$00
30 236$00
236$00
217 549$00
73 440$00
23 367$00
14 396$00
33 388$00
36 238$00
6 182$00
30 538$00
238$00
219 724$00
74 174$00
23 601$00
14 540$00
33 722$00
36 600$00
6 244$00
30 844$00
240$00
208$00
153 566$00
20 790$00
315 134$00
222$00
155 102$00
22 165$00
315 134$00
236$00
156 116$00
23 565$00
315 134$00
238$00
157 677$00
23 800$00
297 634$00
240$00
159 254$00
24 038$00
297 634$00
1 631 945$00
1 698 536$00
1 765 790$00
1 762 797$00
1 777 448$00
15.Operational Profit of the Exercise
447 092$00
517 949$00
590 683$00
617 241$00
626 390$00
16.Financial Costs
16.1.of Operational Nature
16.2.of Financing Nature
17.Extraordinary Costs and Losses
18.Profit Previous to Taxes
19.Provisions for Taxes on Profits
273 804$00
41 581$00
232 223$00
276 553$00
44 330$00
232 223$00
260 000$00
47 129$00
212 871$00
183 064$00
47 601$00
135 463$00
106 132$00
48 077$00
58 056$00
173 289$00
17 329$00
241 396$00
24 140$00
330 683$00
33 068$00
434 177$00
43 418$00
520 257$00
52 026$00
20.Net Profit
155 960$00
217 257$00
297 614$00
390 759$00
468 232$00
5.Cost of the Consumed National Stocks
6.Cost of the Consumed Imported Stocks
7.Subcontracts
8.Other External Charges for Services
8.1.Electricity/Water/Fuels
8.2.Rent
8.3.Communications
8.4.Insurance
8.5.Commissions
8.6.Publicity and Propaganda
8.5. Various External Charges for Services
9.Taxes
9.1.Direct
9.2.Indirect
10.Costs with Staff
11.Others Cost and Expenses
12.Depreciation and Reinsertion
13.Provisions
14.Total
______________________________________________________________
Appendix 3
32
4.
Indicators of profitability
PROJECT FINANCIAL INDICATORS
Net Present Value of the Project (NPV)
517 607$00
Internal Rentability Rate (IRR)
21,67%
Profitability Index (PI)
136,41%
Investment Recovery Period (IRP) - Months
55
PROJECT CASH-FLOWS
Unit:dollars
ITEMS
Total Annual Investment (1)
1
2
3
4
3 317 469$00
Investment Residual Value (2)
Operational Cash-Flow (3)
5
1 303 590$00
703 317$00
764 614$00
825 620$00
823 857$00
823 922$00
-2 614 152$00
764 614$00
825 620$00
823 857$00
2 127 512$00
622 405$00
764 614$00
825 620$00
823 857$00
823 922$00
-2 313 409$00
517 607$00
-2 313 409$00
598 805$00
572 196$00
505 287$00
1 154 728$00
-1 714 604$00
-1 142 408$00
- 637 121$00
517 607$00
Cash-Flow Previous to the Project (4)
Project's Cash-Flow (3+2-1-4)
Present Value of Operational CF
Present Value of CF
NPV
Accumulated CF
______________________________________________________________
Appendix 3
33
5.
Sensitivity analysis
SENSITIVITY ANALYSIS
Variation
-10%
-5%
10%
5%
Calculated
Indicator
NPV
IRR
NPV
IRR
NPV
IRR
NPV
IRR
Sale
Price
151 631$00
15,2%
557 622$00
21,3%
1 773 944$00
41,0%
1 368 503$00
34,1%
Unit:dollars
CRITICAL PARAMETERS CONSIDERED
Cost
Investment
Sales
Level
Cost
Level
1 483 295$00
1 147 349$00
579 435$00
36,0%
32,2%
21,6%
1 223 179$00
1 055 206$00
771 249$00
31,7%
29,8%
24,5%
442 830$00
778 776$00
1 346 690$00
19,5%
23,7%
33,7%
702 946$00
870 919$00
1 154 876$00
23,5%
25,5%
30,6%
______________________________________________________________
Appendix 3
34
6. Economic indicators
COMPANY COSTS' STRUCTURE
ITEMS
Total Profits
Consumed Stocks
Subcontracts
ECSs
Taxes
Costs with Staff
Other Costs and Expenses
Depreciation and Reinsertion Provisions
Provisions
Financial Costs of Operational Nature
Financial Costs of Financing Nature
Net Profit
1
2
3
4
5
2 079 037$00
44,78%
2 216 485$00
44,78%
2 356 473$00
44,78%
2 380 038$00
44,78%
2 403 838$00
44,78%
10,16%
0,01%
7,39%
1,00%
15,16%
9,62%
0,01%
7,00%
1,00%
14,22%
9,14%
0,01%
6,62%
1,00%
13,37%
9,14%
0,01%
6,62%
1,00%
12,51%
9,14%
0,01%
6,62%
1,00%
12,38%
2,00%
11,17%
7,50%
2,00%
10,48%
9,80%
2,00%
9,03%
12,63%
2,00%
5,69%
16,42%
2,00%
2,42%
19,48%
COST'S STRUCTURE
Financial Costs of Financing Nature
Financial Costs of Operational
Nature
100,00%
90,00%
80,00%
70,00%
60,00%
50,00%
40,00%
30,00%
20,00%
10,00%
0,00%
Provisions
Depreciation and Reinsertion
Provisions
Other Costs and Expenses
Costs with Staff
Taxes
ECSs
Subcontracts
1
2
3
4
5
Consumed Stocks
COMPANY'S GROSS SALES MARGIN
Unit:dollars
ITEMS
Sales
Purchases of Goods for Resale
Gross Margin
1
2
3
4
5
2 079 037$00
931 095$00
1 147 942$00
2 216 485$00
992 651$00
1 223 834$00
2 356 473$00
1 055 344$00
1 301 129$00
2 380 038$00
1 065 898$00
1 314 140$00
2 403 838$00
1 076 557$00
1 327 281$00
______________________________________________________________
Appendix 3
35
COMPANY'S BREAK EVEN POINT
ITEM
Sales Volume
Margin (%)
Variable Costs
Net contribution margin
Net contribution margin (%)
Fixed Costs
Break Even point
Safety Margin
1
2
3
4
5
2 079 037$00
55,2%
1 128 336$00
950 701$00
45,73%
834 155$00
1 824 170$00
12,26%
2 216 485$00
55,2%
1 195 364$00
1 021 120$00
46,07%
837 035$00
1 816 901$00
18,03%
2 356 473$00
55,2%
1 263 620$00
1 092 853$00
46,38%
820 055$00
1 768 249$00
24,96%
2 380 038$00
55,2%
1 276 256$00
1 103 782$00
46,38%
728 067$00
1 569 901$00
34,04%
2 403 838$00
55,2%
1 289 019$00
1 114 820$00
46,38%
653 610$00
1 409 351$00
41,37%
BREAK EVEN POINT
2 000 000$00
1 500 000$00
1 000 000$00
500 000$00
$00
1
2
3
4
5
GROSS VALUE ADDED (GVA) AND COMPANY'S PRODUCTIVITY
Unit:dollars
ITEM
Costs with Staff
Financial Costs
Depreciation
Net Profit
GVA
No. of workers
Employees Total Productivity
Assets Total Productivity
1
2
3
4
5
153 566$00
273 804$00
315 134$00
155 960$00
898 464$00
75
11 980$00
25,05%
155 102$00
276 553$00
315 134$00
217 257$00
964 046$00
75
12 854$00
26,45%
156 116$00
260 000$00
315 134$00
297 614$00
1 028 865$00
75
13 718$00
32,10%
157 677$00
183 064$00
297 634$00
390 759$00
1 029 135$00
75
13 722$00
35,97%
159 254$00
106 132$00
297 634$00
468 232$00
1 031 253$00
75
13 750$00
40,20%
GVA AND PRODUXTIVITY
1 200 000$00
1 000 000$00
800 000$00
600 000$00
400 000$00
200 000$00
$00
Employees Total
Productivity
GVA
1
2
3
4
5
COMPANY'S ECONOMIC RATIOS
ITEM
Operational Released Resources
Equity Profitability
Sales Gross Profitability
Sales Net Profitability
Sales Operational Profitability
Assets Economic Profitability
Assets Profitability
1
2
3
4
5
703 317$00
15,83%
55,22%
8,34%
33,83%
19,61%
12,47%
764 614$00
18,07%
55,22%
10,89%
34,50%
20,98%
14,21%
825 620$00
19,84%
55,22%
14,03%
35,04%
25,76%
18,43%
823 857$00
20,66%
55,22%
18,24%
34,62%
28,80%
21,58%
823 922$00
19,85%
55,22%
21,64%
34,28%
32,12%
24,42%
______________________________________________________________
Appendix 3
36
7.
Forecast balance sheet
Unit:dollars
ITEMS
1
2
3
4
5
2 829 975$00
52 500$00
2 777 475$00
2 829 975$00
52 500$00
2 777 475$00
2 829 975$00
52 500$00
2 777 475$00
2 829 975$00
52 500$00
2 777 475$00
2 829 975$00
52 500$00
2 777 475$00
315 134$00
630 269$00
945 403$00
1 243 037$00
1 540 672$00
77 591$00
474 933$00
173 253$00
301 680$00
518 816$00
82 721$00
295 085$00
184 707$00
110 378$00
1 066 592$00
87 945$00
196 373$00
196 373$00
88 825$00
198 336$00
198 336$00
89 713$00
200 320$00
200 320$00
1 036 246$00
986 742$00
985 792$00
3 586 181$00
3 644 104$00
3 205 136$00
2 860 841$00
2 565 128$00
829 367$00
829 367$00
829 367$00
829 367$00
829 367$00
155 960$00
155 960$00
217 257$00
373 217$00
297 614$00
670 831$00
390 759$00
1 061 590$00
468 232$00
985 327$00
1 202 584$00
1 500 198$00
1 890 957$00
2 359 189$00
2 488 102$00
2 322 228$00
165 873$00
2 322 228$00
2 322 228$00
1 548 152$00
1 548 152$00
774 076$00
774 076$00
112 752$00
119 292$00
156 786$00
195 807$00
205 939$00
91 699$00
21 054$00
91 391$00
27 901$00
96 459$00
60 328$00
96 987$00
98 820$00
97 957$00
107 982$00
19.Total Liabilities
2 600 854$00
2 441 521$00
1 704 938$00
969 883$00
205 939$00
20.Total Liabilities+ Equity
3 586 181$00
3 644 104$00
3 205 136$00
2 860 841$00
2 565 128$00
ASSETS
1.Gross Fixed Assets
1.1.Non - Physical
1.2.Physical
1.3.Financial
2.Depreciation and Reinsertion
3.Mid and Long Term Current Assets
4.Stocks
5.Short Term Current Assets
5.1.Clients
5.2.Other Debtors
6.Bank Deposits/Cash/Negotionable Assets
7.Prepayments and Deferred Income
8.Total Assets
EQUITY
9.Capital
10.Suplementary Instalments
11.Reserves / Unappropriated Earned Surplus
12.Net Profit
13.Interim Dividends
14.Total Equity
LIABILITIES
15.Provisions for Risks and Costs
16.Mid and Long Term Debts
16.1.Bank Loans
16.2.Partners' Loans
16.3.Other Debts
17.Short Term Debt
17.1.Bank Loans
17.2.Suppliers
17.3.Public Statal Sector
17.4.Other Debts
18.Prepayments and Deferred Income
______________________________________________________________
Appendix 3
37
8.
Financial Indicators
COMPANY'S BALANCE STRUCTURE
Unit:dollars
ITEMS
Fixed Assets
Circulating Capital
Equity
Long Term Liabilities
Short Term Liabilities
1
2
3
4
5
2 592 432$00
993 749$00
985 327$00
2 488 102$00
112 752$00
2 282 427$00
1 361 677$00
1 202 584$00
2 322 228$00
119 292$00
1 972 517$00
1 232 619$00
1 500 198$00
1 548 152$00
156 786$00
1 675 762$00
1 185 078$00
1 890 957$00
774 076$00
195 807$00
1 379 016$00
1 186 112$00
2 359 189$00
ASSET'S STRUCTURE
LIABILITIES AND EQUITY STRUCTURE
4 000 000$00
3 500 000$00
3 000 000$00
2 500 000$00
2 000 000$00
1 500 000$00
1 000 000$00
500 000$00
$00
Circulating Capital
Fixed Assets
1
2
3
205 939$00
4
4 000 000$00
3 500 000$00
3 000 000$00
2 500 000$00
2 000 000$00
1 500 000$00
1 000 000$00
500 000$00
$00
5
Short Term Liabilities
Long Term Liabilities
Equity
1
2
3
4
5
COMPANY'S FINANCIAL RATIOS
ITEM
Debt
Debt Recovery Period
Liability Average Cost
Financial Autonomy
Solvency
1
37,88%
5,28
10,53%
27,48%
37,88%
2
49,26%
4,36
11,33%
33,00%
49,26%
3
87,99%
2,53
15,25%
46,81%
87,99%
4
194,97%
1,12
18,87%
66,10%
194,97%
5
1145,58%
51,54%
91,97%
1145,58%
SOLVENCY
FINANCIAL AUTONOMY
1200,00%
100,00%
1000,00%
80,00%
800,00%
60,00%
600,00%
40,00%
400,00%
20,00%
200,00%
0,00%
0,00%
1
2
3
4
5
1
2
3
4
______________________________________________________________
Appendix 3
5
38
COMPANY'S LIQUIDITY RATIOS
ITEMS
1
9,50
8,81
4,60
General Liquidity
Reduced Liquidity
Immediate Liquidity
2
12,11
11,41
8,94
3
8,42
7,86
6,61
4
6,51
6,05
5,04
5
6,20
5,76
4,79
LIQUIDITY
15,00
General Liquidity
Reduced Liquidity
Immediate Liquidity
10,00
5,00
0,00
1
2
3
4
5
OTHER COMPANY INDICATORS
ITEMS
Average Receiving Period (days)
Average Payment Period (days)
Assets Rotation
Stocks Rotation (days)
Costs with Staff/ Sales
Wage Productivity
Share of Fixed Assets Covered by Equity
1
2
3
4
5
30
36
57,97%
30
7,39%
585,07%
34,82%
30
34
60,82%
30
7,00%
621,56%
42,49%
30
33
73,52%
30
6,62%
659,04%
53,01%
30
33
83,19%
30
6,62%
652,68%
66,82%
30
33
93,71%
30
6,62%
647,55%
83,36%
COMPANY SCHEMATIC BALANCE
ITEM
Permanent Capital
Net Fixed Assets
WORKING CAPITAL (WC)
Cyclical Needs
Cyclical Resources
Net Current Assets Needs(WCI)
Active Treasury
Passive Treasury
Treasury
1
2
3
4
5
3 473 429$00
2 514 841$00
958 588$00
552 524$00
112 752$00
439 772$00
518 816$00
3 524 812$00
2 199 706$00
1 325 106$00
377 806$00
119 292$00
258 514$00
1 066 592$00
3 048 350$00
1 884 572$00
1 163 778$00
284 318$00
156 786$00
127 532$00
1 036 246$00
2 665 033$00
1 586 938$00
1 078 096$00
287 161$00
195 807$00
91 354$00
986 742$00
2 359 189$00
1 289 303$00
1 069 886$00
290 033$00
205 939$00
84 094$00
985 792$00
518 816$00
1 066 592$00
1 036 246$00
986 742$00
985 792$00
TREASURY
1 400 000$00
1 200 000$00
1 000 000$00
WC
WCI
Treasury
800 000$00
600 000$00
400 000$00
200 000$00
$00
1
2
3
4
5
______________________________________________________________
Appendix 3
39
ANNEXES
1.
Technology, technical equipment, technical coefficients and others
PROCESSING UNIT FOR CRUDE AND REFINED COPRA OIL
FINAL PRODUCT: CRUDE AND REFINED COPRA OIL
INSTALLED CAPACITY (copra/day - 24 hours)
INSTALLED CAPACITY (crude oil/day - 24 hours)
ITEM
DESCRIPTION
1
INDUSTRIAL EQUIPMENT(45 tonnes/day)
Equipment for pressing oil
Tanks for storing crude oil and system for filling
trucks
Auxiliary equipment (boiler, compressed air,
500KW generator)
Refining unit (20 tonnes/day - 24 hours)
Filling line
BUILDINGS AND ANNEXES
1,1
1,2
1,3
1,4
1,5
2
Working period: 11 months/year, 24 hours/day, 5 days/week
Tonnes
Tonnes
45
22,5
1
1
2,2 New weighing machine
3
TRANSPORT EQUIPMENT
3,1 30 tonne tanker truck
3,2 4 tonne trucks
3,3 1 tonne trucks
3,4 Light vehicles
3,5 Fork lifts
FACTORY STAFF
4,1
4,2
4,3
4,4
4,5
4,6
4,7
5
TOTAL FACTORY STAFF
Factory foreman
Warehouse heads
Chemical engineer
Machine operators
Maintenance technicians
Head of laboratory and quality control
Laboratory and quality control staff
ADMINISTRATIVE STAFF
CYCLES
PER YEAR
167.475,00
350.000,00
1/15
1/15
1/15
1
1
150.000,00
1/15
1
1
170.000,00
350.000,00
6
General manager
Financial manager
Production manager
Commercial manager
Chief accountant
Supplies staff
Sales staff
Drivers
Secretarial staff
Cleaning Staff
Security staff
RAW MATERIALS AND OTHER MATERIALS
6,1
6,2
6,3
6,4
5,5
5,6
Copra - 100% of installed capacity
Fuel and lubricants
Laboratory consumables
Office materials
Materials
Drums ( 20 Litr ), Tins ( 0,75 Litr )
167.475,00
350.000,00
150.000,00
170.000,00
350.000,00
1
1
975.000,00
80.000,00
1/6
1/15
1
4
2
3
1
160.000,00
35.000,00
20.000,00
30.000,00
55.000,00
1/5
1/5
1/5
1/5
1/5
975.000,00
80.000,00
485.000,00
NUMBER
MONTHLY COST
(USD)
CYCLES
PER YEAR
4.260,00
2
4
1
10
5
1
2
NUMBER
1
1
1
1
1
3
6
5
2
5
10
Amount consumed
per year/tonne
10.890
30.800
160.000,00
140.000,00
40.000,00
90.000,00
55.000,00
ANNUAL COST (USD)
51.120,00
1.200,00
600,00
800,00
950,00
400,00
150,00
160,00
MONTHLY COST
(USD)
12
12
12
12
12
12
12
CYCLES
PER YEAR
8.045,00
5,1
5,2
5,3
5,4
5,5
5,6
5,7
5,8
5,9
5.1O
5,11
TOTAL COST (USD)
1.187.475,00
1.055.000,00
Construction of industrial buildings (2,000 sq. metres)
and warehouses for copra and finished product (4,500
2,1 sq. metres)
4
UNIT COST OF
AQUISITION (USD)
QUANTITY
14.400,00
7.200,00
9.600,00
11.400,00
4.800,00
1.800,00
1.920,00
ANNUAL COST (USD)
96.540,00
1.500,00
1.200,00
1.200,00
1.200,00
600,00
240,00
480,00
325,00
200,00
250,00
850,00
UNIT COST
(USD/TONNE)
12
12
12
12
12
12
12
12
12
12
12
CYCLES
PER YEAR
18.000,00
14.400,00
14.400,00
14.400,00
7.200,00
2.880,00
5.760,00
3.900,00
2.400,00
3.000,00
10.200,00
ANNUAL COST (USD)
0,50
______________________________________________________________
Appendix 3
0,00
15.400,00
6.500,00
4.500,00
12.400,00
40
2.
Price Statistics
Coconut oil (Philippines, cif Rotterdam)
Source: Oil World
1996
US$/Ton
January
711
February
738
March
723
April
756
May
778
June
816
July
775
August
742
September
721
October
722
November
760
December
777
______________________________________________________________
Appendix 3
41
1997
US$/Ton
January
768
February
768
March
737
April
710
May
654
June
637
July
597
August
567
September
615
October
627
November
616
December
586
Monthly Data
Coconut oil (Philippines, cif Rotterdam)
Source: Oil World
1998
US$/Ton
January
558
February
559
March
578
April
618
May
723
June
652
July
667
August
667
September
652
October
695
November
752
December
774
______________________________________________________________
Appendix 3
42
1999
US$/Ton
January
763
February
745
March
700
April
827
May
874
June
796
July
656
August
684
September
704
October
690
November
703
December
703
Monthly Data
Coconut oil (Philippines, cif Rotterdam)
Source: Oil World
2000
US$/Ton
January
654
February
591
March
552
April
550
May
481
June
437
July
400
August
371
September
332
October
340
November
367
December
329
______________________________________________________________
Appendix 3
43
2001
US$/Ton
January
319
February
285
March
289
April
293
May
295
June
317
July
358
August
363
September
322
October
307
November
330
December
339
Monthly Data
Coconut oil (Philippines, cif Rotterdam)
Source: Oil World
2002
US$/Ton
January
362
February
376
March
366
April
411
May
420
June
446
July
445
______________________________________________________________
Appendix 3
Download