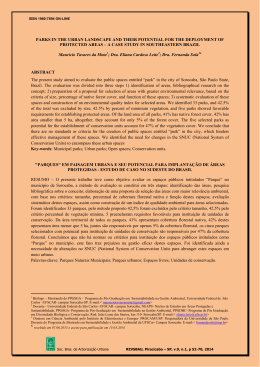
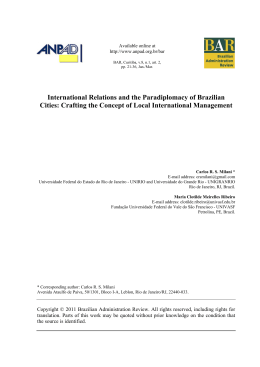
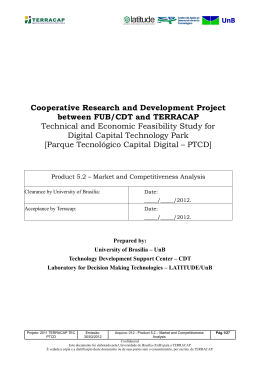
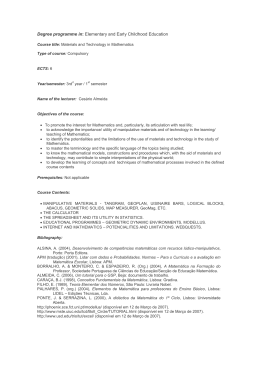
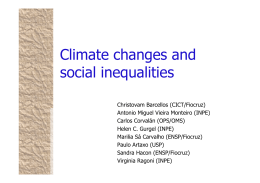
Antonio Luis Aulicino
29th IASP World Conference 2012
Implementation of Technology Parks for the Eradication of Poverty
in Emerging Countries: A Brazilian case
Executive Summary
The trend of establishing Technology Parks in developing countries is associated with the third
generation, the economic process and technological development in emerging countries, which
means to set up a Tech Park where there are already universities, industrial conglomerates and all
the support and infrastructure.
In Brazil this is how the establishment of Tech Parks occurs - in developed cities that have
universities, large enterprises, such as power plants, industrial complexes and resources. Thus, the
tendency of poor municipalities is to disappear.
The article aims to show the importance of establishing Technology Parks in poor municipalities,
using the Ribeirão Branco case, a poor region in the Southwest of the São Paulo state, identified
during the prospective process. The bureaucratic procedure to establish a technology park in a poor
municipality is the same as in rich ones. However, public policies should encourage and provide
resources for Tech Parks in poor regions.
2
‘
Antonio Luis Aulicino
29th IASP World Conference 2012
1. INTRODUCTION
The trend of establishing Technology Parks in developing countries is associated with what was
called 3rd Generation Tech Parks, i.e., the accumulated experiences of 1st and 2nd generation Tech
Parks, according to ANPROTEC (2008)1, and is associated with the process of economic and
technological development in emerging countries, and occurs where there are already universities,
development or deployment of large industrial conglomerates and all the support and infrastructure
for this deployment. This process is found in developing countries, such as: Taiwan, Singapore,
South Korea and Brazil itself.
In Brazil, the Technology Parks started from the creation of the CNPq (National Council of
Scientific and Technological Development) Program in 1984 to support such initiatives, according to
ABID and ANPROTEC (2008, p.8)2. The idea of Technology Parks regained strength from the year
2000, as an alternative to promoting technological, economic and social development, and having
currently 74 (seventy four) projects, including initiatives in the operation, implementation and
project phases, according to ANPROTEC (2008)1.
When analyzing information on HDI, from PNUD (2000)3, of GDP per capita, from IBGE (2012)4,
and the study on Technology Parks prepared by ABID and ANPROTEC (2008)2, it is perceived that the
development of Technology Parks in Brazil occurs in municipalities whose HDI is higher than 0.701,
and the GDP per capita is higher than R$ 5,000.00 (five thousand reais), and the concentration of 56
of these 74 Parks, range from R$ 10,000.00 (ten thousand reais) to R$ 30,000.00 (thirty thousand
reais), being located in more developed regions, which already have Federal Universities and
conglomerates of large companies such as hydroelectric plants, industrial plants and
implementation support. This causes poor regions to not develop and remain increasingly excluded,
both regarding education and the improvement of income generation.
The Technology Park is an organization whose goal is to contribute to the prosperity and
development of the community, promoting a culture of innovation, cooperative projects and
technical and scientific institutions which are associated, according to IASP (2002)5, and,
understanding that the prospective regional planning process is a long-term horizon, the
development of cities, regions, states and countries, or specific issues that require a reflection of
society to build a strategic vision of the future together, according to GODET (2001)6.
The objectives of this paper are to: a) demonstrate the need to develop a Technology Park
project and its implementation as a result of the prospective process diagnosis in Ribeirão Branco,
which has the third lowest HDI in the State of São Paulo and b) demonstrate the importance of the
establishment of Technology Parks in poor regions of Brazil.
The methodology used is the action research, which shows the summary of the regional
prospective process, how the involvement and appropriation society representatives of Ribeirão
Branco occurred, their contribution and the needs that were diagnosed. Among the needs identified
is the Technology Park. In addition, the article discusses the process of analyzing the strategic
situation, which was conducted in a participatory manner; and, the preparation of the Strategic Map
of the Technology Park with several steps and actions that must be performed for its
implementation.
1
ANPROTEC, Associação Nacional de Entidades Promotoras de Empreendimentos Inovadores. Portifólio de Parques
Tecnológicos no Brasil. São Paulo: ANPROTEC, 2008.
ABID, Agência Brasileira de Desenvolvimento Industrial e ANPROTEC, Associação Nacional de Entidades Promotoras de
Empreendimentos Inovadores. Parques Tecnológicos no Brasil: Estudo, Análise Proposições, 2008. Disponível em:
http://www.abdi.com.br/Estudo/Parques%20Tecnol%C3%B3gicos%20%20Estudo%20an%C3%A1lises%20e%20Proposi%C3%A7%C3%B5es.pdf. Acesso em: 20/10/2010.
3
PNUD, Programa das Nações Unidas para o Desenvolvimento, IDH – Índice de Desenvolvimento Humano dos Municípios
Brasileiros,
2000.
Disponível
em:
http://www.pnud.org.br/atlas/ranking/IDHM%2091%2000%20Ranking%20decrescente%20(pelos%20dados%20de%202000).htm. Acesso em: 20/01/2012.
4
IBGE, Instituto Brasileiro de Geografia e Estatística. Produto Interno Bruto dos Municípios: 2005 -2009. Disponível em:
http://www.ibge.gov.br/home/download/estatistica.shtm. Acesso em: 12/01/2012.
5
IASP, International Association Science Park. SCIENCE PARK (IASP Official definition), 6 February 2002. Disponível em:
http://www.iasp.ws/publico/index.jsp?enl=2. Acesso em: 20/10/2011.
6
GODET, M. Manuel de prospective stratégique, tome 2: l’art et la méthode. Dunod, Paris, 2001.
2
3
‘
Antonio Luis Aulicino
29th IASP World Conference 2012
2. THEORETICAL BACKGROUND
2.1 Technology Parks
The first Science and Technology Park was created on the campus of Stanford University in the
1950s, which transformed one of the poorest regions of the United States in the Silicon Valley - a
global center for technology, finance, education and research, according to UNESCO (2011)7.
The definition of a Technology Park, according to IASP (2002)8, and amended by the authors, is
an organization managed by specialized professionals, whose goal is to increase wealth and welfare
of their community, by promoting a culture of innovation and collaboration, of the projects and the
technical and scientific institutions to which they are associated.
To facilitate the attainment of these objectives the Technology Park manages and promotes
the flow of knowledge and technology amongst universities, R&D institutes, companies and markets,
facilitates the creation and growth of innovation-based companies through incubation and "spinoffs".
From this definition, a first and important conclusion can be inferred, according to SANZ
(2003)9: Science and Technology Parks are tools to create value and have a social proposition.
The functions of the Technology Park are described below according to ABID and ANPROTEC
(2008, p.19)10:
• environment that integrates academia and the business sector, effectively allowing an
approximation of the generating companies with the centers of knowledge;
• space with infrastructure and professional service, provided with necessary conditions to allow
the development of projects;
• environment of innovation that brings together companies capable of forming competitive and
innovative clusters;
• development that contributes to the planning and guidance of urban and regional growth
integrating other infrastructure projects;
• reference to economic, social, environmental and technological development, through initiatives
that are able to meet the challenges of regional development with relevant scale geared to meet
the demands of employment and income generation;
• therefore, the Technology Park is a great platform to promote the development of regions and
sectors, establishing differentiated opportunities for guiding the growth process.
For The Technology Park to succeed according to STEINER, CASSIM and ROBAZZI (2010)11, it
needs:
• the commitment of municipal, state and federal governments, business sector, universities and
research institutes;
• the perspective that the establishment of the park falls within the scope of programs and
strategic actions of regional and local development, and
• the need for definition technological segments in which the park can act and be competitive.
According to the study by ABID and ANPROTEC (2008, p.12-13)12, three major types of
Technology Parks featuring "generations" were identified , according to the time they were
predominant and the elements that made them unique. Here follows the description of each of the
7
UNESCO. Science Policy and Capacity-Building: Concept and Definition. Disponível em:
http://www.unesco.org/new/en/natural-sciences/science-technology/university-industry-partnerships/sciencetechnology-park-governance/concept-and-definition/, acessado em 24/11/2011.
8
IASP, International Association Science Park. SCIENCE PARK (IASP Official definition), 6 February 2002. Disponível em:
http://www.iasp.ws/publico/index.jsp?enl=2. Acesso em: 20/10/2011.
9
SANZ, Luis. Science And Technology Parks: Access Doors To The Knowledge Economy For Regions And Cities. Isfahan, May
2003. Disponível em: http://www.techpark.ir/files/pdf/150/14.pdf. Acessado em 24/11/2011
10
ABID, Agência Brasileira de Desenvolvimento Industrial e ANPROTEC, Associação Nacional de Entidades Promotoras de
Empreendimentos Inovadores. Parques Tecnológicos no Brasil: Estudo, Análise Proposições, 2008. Disponível em:
http://www.abdi.com.br/Estudo/Parques%20Tecnol%C3%B3gicos%20%20Estudo%20an%C3%A1lises%20e%20Proposi%C3%A7%C3%B5es.pdf. Acesso em: 20/10/2010.
11
STEINER, João E., CASSIM, Marisa B. e ROBAZZI, Antonio C. Parques Tecnológicos: Ambientes de Inovação. Instituto de
Estudos Avançados da Universidade São Paulo – USP, São Paulo. Disponível em:
http://www.iea.usp.br/iea/textos/steinercassimrobazziparquestec.pdf. Acesso em: 20/10/2010.
12
ABID, Agência Brasileira de Desenvolvimento Industrial e ANPROTEC, Associação Nacional de Entidades Promotoras de
Empreendimentos Inovadores. Parques Tecnológicos no Brasil: Estudo, Análise Proposições, 2008. Disponível em:
http://www.abdi.com.br/Estudo/Parques%20Tecnol%C3%B3gicos%20%20Estudo%20an%C3%A1lises%20e%20Proposi%C3%A7%C3%B5es.pdf. Acesso em: 20/10/2010.
4
‘
Antonio Luis Aulicino
29th IASP World Conference 2012
generations: a) 1st Generation Tech Parks – Pioneer Tech Parks; b) 2nd Generation Tech Parks –
Follower Parks; e c) 3rd Generation Tech Parks – Structuring Parks.
2.2. Status of Technology Parks in Brazil
The Technology Parks in Brazil began with the creation of the CNPq Program in 1984. Business
incubators in Brazil occurred in the first draft Technology Parks, due to the lack of a culture focused
on innovation and the low number of innovative enterprises existing at the time, according to ABID
and ANPROTEC (2008, p.8)12. This movement has increased rapidly and today there are more than
400 (four hundred) incubators throughout the country, with more than 6,000 (six thousand)
companies generated from business incubators, universities and research centers.
The idea of Technology Parks regained strength from the year 2000, as an alternative to
promoting technological, economic and social development, today there are currently about 74
(seventy four) parks, including initiatives in the operation, implementation and project phases.
2.2.1. Survey of Brazilian Technology Parks
The survey carried out by ANPROTEC (2008)13, showed that Brazil had seventy-four Tech
Parks scattered across its territory. Phases of Technology Parks were distributed in operation,
implementing and project, and the 74 Parks by phase, as shown in figure 1:
Distribution of Brazilian Technology Parks by Stage
Operation
34%
Project
43%
Operation
Implementation
23%
Implementation
Project
Figure 1: Distribution of Brazilian Technology Parks by Stage
Source: ANPROTEC (2008, p.6) 13
Figure 2 shows the distribution by phase of Technology Parks and Brazilian Region. It appears
that the South and Southeast regions have more Technology Parks in operation. The Central-West
and North regions do not have Technology Parks in operation. The Southeast region has the highest
number of Technology Parks in the phase of implementation and the highest number of projects for
Technology Parks. The North and Northeast regions have the lowest number of implementation of
parks.
Distribution of Brazilian Tech Parks by Stage and Region
20
18
16
14
12
10
8
6
4
2
0
SU
SE
NE
CO
NO
Operation
11
9
5
0
0
Implementation
5
8
1
2
1
Project
7
18
1
3
3
Figure 2: Distribution of Brazilian Tech Parks by Stage and Region
13
ANPROTEC, Associação Nacional de Entidades Promotoras de Empreendimentos Inovadores. Portifólio de Parques
Tecnológicos no Brasil. São Paulo: ANPROTEC, 2008.
5
‘
Antonio Luis Aulicino
29th IASP World Conference 2012
Source: ANPROTEC (2008, p.8-11)14
2.3. HDI and GDP per capita of Brazilian Municipalities
The use of the Human Development Index (HDI) and Gross Domestic Product (GDP) per capita
of the municipalities shows their stage of development in comparison with other cities. This way, it
is possible to have an idea of the needs of the municipality in planning its development.
2.3.1. HDI for Brazilian Municipalities
The Human Development Index (HDI) appears at the United Nations Development Programme
(UNDP/PNUD) and the Human Development Report (HDR). According to PNUD (2012)15, the objective
of preparing the Human Development Index is to provide a counterpoint to another widely used
indicator, the Gross Domestic Product (GDP) per capita, which considers only the economic
dimension of development. The HDI is intended as a general measure, synthetic, of human
development. It does not cover all aspects of development and it is not a representation of
"happiness" of people, nor does it indicate "the best place to live in the world."
Besides considering the GDP per capita, after correcting it by the purchasing power in the
currency of each country, according to the PNUD (2012)15, the HDI also considers two other
components: longevity and education. To assess the longevity, the indicator uses figures of life
expectancy at birth. The item is measured by education level of illiteracy and the rate of student
enrollment at all levels of education. Income is measured by GDP per capita in PPP in U.S. dollars
(purchasing power parity, which eliminates the cost of living differences between countries). These
three dimensions are equally important in the index, which ranges from zero to one. There is, at
PNUD, an electronic database with socioeconomic information of 5,507 Brazilian municipalities,
data available at PNUD in 2000. To better observe the HDI of municipalities we prepared a graph
showing the frequency distribution of municipalities by HDI.
1305
1400
5.507 Municipalities
Frequency Distribution of
Frequency Distribution of Brazilian Municipalities by HDI
PNUD 2000
1117
1200
880
1000
800
787
653
530
600
400
200
185
22
26
2
0,851 0,900
> 0,900
0
0,451 0,500
0,501 0,550
0,551 0,600
0,601 0,650
0,651 0,700
0,701 0,750
0,751 0,800
Distribution HDI of Brazilian Municipalities
0,801 0,850
Brazil PNUD 2000
Chart 1: Frequency Distribution of Brazilian Municipalities by HDI
Source: PNUD 2000 (2012) 15
2.3.2. HDI and GDP per capita of Brazilian Municipalities
The Gross Domestic Product of Municipalities, according to the Instituto Brasileiro de
Geografia e Estatística (Brazilian Institute of Geography and Statistics) IBGE (2012)16, is calculated
on a uniform methodology for all units of the Federation, and is conceptually integrated to the
procedures adopted by the systems in the National and Regional Accounts, so that their results are
consistent and comparable with each other and with national and regional results.
The Gross Domestic Product GDP is calculated considering the total of goods and services
produced by resident producer units intended for final consumption being thus the sum of the added
values- by the various economic activities plus taxes, less subsidies on products. The GDP, according
to IBGE (2012)16, is also equivalent to the sum of the final consumption of goods and services valued
at market price and it is also equivalent to the sum of primary incomes. It can therefore be
expressed by three points of view: production, expenditure and income.
14
ANPROTEC, Associação Nacional de Entidades Promotoras de Empreendimentos Inovadores. Portifólio de Parques
Tecnológicos no Brasil. São Paulo: ANPROTEC, 2008.
15
PNUD 2000, Programa das Nações Unidas para o Desenvolvimento, IDH – Índice de Desenvolvimento Humano dos Municípios
Brasileiros,
2000.
Disponível
em:
http://www.pnud.org.br/atlas/ranking/IDHM%2091%2000%20Ranking%20decrescente%20(pelos%20dados%20de%202000).htm. Acesso em: 20/01/2012.
16
IBGE, Instituto Brasileiro de Geografia e Estatística. Produto Interno Bruto dos Municípios: 2004 – 2008 e 2005 -2009.
Disponível em: http://www.ibge.gov.br/home/download/estatistica.shtm. Acesso em: 12/01/2012.
6
‘
Antonio Luis Aulicino
29th IASP World Conference 2012
Charts 2 and 3, show the evolution of the GDP per capita of Brazilian municipalities, according
to documents published by IBGE (2012)16, regarding the GDP per capita of 2006 and 2009.
It must be highlighted that the amount of municipalities considered by IBGE for 2006 when
calculating the GDP per capita of the municipalities was 5.564 and for 2009, updated edition, was of
5.565 municipalities, according to IBGE (2012)16.
Frequency Distribution of Brazilian Municipalities by GDP per capita IBEG 2006
Frequency Distribution of 5564 Municipalities
2500
2304
1943
2000
1500
1069
1000
500
137
41
44
26
0
[ < R$ 5.001]
[R$ 5.001 a R$ [R$ 10.001 a R$ [R$ 20.001 a R$ [R$ 30.001 a R$ [R$ 40.001 a R$
10.000]
20.000]
30.000]
40.000]
50.000]
Distribution of GDP per Capita
[> R$ 50.001]
Brazil IBEG 2006
Graph 2: Distribution of Frequency of Brazilian Municipalities by GDP per capita - IBGE 2006
(2012)16
Source: Authors
DFrequency Distribution of 5565 Municipalities
Frequency Distribution of Brazilian Municipalities by GDP per capita IBEG 2009
2000
1800
1600
1672
1740
1596
1400
1200
1000
800
600
355
400
200
98
65
39
0
[ < R$ 5.001] [R$ 5.001 a
R$ 10.000]
[R$ 10.001 a [R$ 20.001 a [R$ 30.001 a [R$ 40.001 a
R$ 20.000]
R$ 30.000]
R$ 40.000]
R$ 50.000]
[> R$
50.001]
Distribution of GDP per capita
Brazil IBEG 2009
Chart 3: Distribution of Frequency of Brazilian Municipalities by GDP per capita - IBGE 2009
(2012)16
Source: Authors
In examining the two charts, we observe an improvement in GDP per capita of the cities,
especially those which were below R$ 10,001.00 in 2006, representing 76.3% of municipalities, and
which decreased to 58.7% with a significant increase in the municipalities ranging from R$ 10,001.00
to R$ 20,000.00, from 19.2% in 2006 to 31.3% in 2009, which meant an improvement in the
purchasing power of their respective populations.
2.4. Frequency Distribution of Brazilian Technology Parks and Brazilian Municipalities by HDI
and GDP per capita
By analyzing the distribution of Technology Parks in Brazil there is a concentration in
developed and developing municipalities, but we do not notice the goal of creating technology
parks in poor regions to eliminate inequality in Brazil. The following charts show the distribution of
Technology Parks taking into consideration the HDI and GDP per capita of the cities.
7
‘
Antonio Luis Aulicino
29th IASP World Conference 2012
Frequency Distribution of Technology Parks and Brazilian Municipalities by
HDI
1400
1305 39
40
1200
1117
35
1000
880
30
800
25
787
653
20
14
15
600
17
530
400
10
5
185
200
4
22
26
0
0,451 0,500
0,501 0,550
0,551 0,600
0,601 0,650
0,651 0,700
0,701 0,750
0,751 0,800
0,801 0,850
0,851 0,900
Frequency Distribution of
5507 Municipalities
Frequency Distribution of
Technology Parks
45
2
0
> 0,900
HDI
Technology Parks
Brazil PNUD 2000
Chart 4: Frequency Distribution of Technology Parks and Brazilian Municipalities by HDI - PNUD
2000 (2012)17 and ANPROTEC (2008)18 data
Source: Authors
In Chart 4 it can be seen in the distribution of Technology Parks by HDI, the inexistence of
Tech Parks in municipalities that have HDI below 0.701, with 2,527 municipalities in this range. In
municipalities that show HDI above 0.900, São Caetano do Sul and Águas de São Pedro in the São
Paulo State, also lack Technology Parks. However, these municipalities are located near large
developed centers, universities and business complexes.
There are 17 Technology Parks established in municipalities whose HDI is between 0.851 and
0.900, while the number of municipalities in the same range of HDI is 26. This means that 23% of
Brazilian Technology Parks are in municipalities with an HDI of 0.851 and 0.900, which means that
these cities are developed and have resources.
Likewise, the 39 Technology Parks established in municipalities with HDI ranging between
0.801 and 0.850, represent 52.7% of Brazilian parks. Therefore, 75.7% of the parks are in the
municipalities whose HDI is above 0.800. The other parks are located in cities, whose HDI ranges
between 0.701 and 0.800.
By analyzing the information of ANPROTEC (2008)18 and PNUD 2000 (2012)17 it is perceived
that 27 of 74 Brazilians Parks - 36.5%, are established in 11 cities, showing that these municipalities
have at least 2 and a maximum of 5 Technology Parks. With the exception of Recife, capital city of
Pernambuco State, whose HDI is 0.787; the other municipalities have their HDI between 0.815 and
0.875.
The current trend in establishing Brazilian Technology Parks in cities whose HDI is greater than
0.701 and which have universities, industries and support to their development, following the model
of Technology Parks that worked worldwide, will seemingly continue to occur, forgetting the poor
municipalities, making them even poorer unless there is development regarding both education and
the development of jobs and income that the Technology Parks can provide.
This analysis shows that the distribution of technology parks in Brazil does not contribute to
the eradication of poverty, benefiting only the municipalities and regions that already have
industrial parks and universities.
17
PNUD 2000, Programa das Nações Unidas para o Desenvolvimento, IDH – Índice de Desenvolvimento Humano dos Municípios
Brasileiros, 2000. Disponível em: http://www.pnud.org.br/atlas/ranking/IDHM%2091%2000%20Ranking%20decrescente%20(pelos%20dados%20de%202000).htm. Acesso em: 20/01/2012.
18
ANPROTEC, Associação Nacional de Entidades Promotoras de Empreendimentos Inovadores. Portifólio de Parques
Tecnológicos no Brasil. São Paulo: ANPROTEC, 2008.
8
‘
Antonio Luis Aulicino
29th IASP World Conference 2012
30
2000
1672
1740
1596
30
1800
26
1600
25
1400
20
1200
1000
15
800
10
600
7
5
355
3
98
0
[ < R$ 5.001]
6
[R$ 5.001 a R$
10.000]
[R$ 10.001 a R$
20.000]
[R$ 20.001 a R$
30.000]
[R$ 30.001 a R$
40.000]
2
39
[R$ 40.001 a R$
50.000]
65
400
200
F re q u e n c y D is trib u tio n o f
5 5 6 5 M u n ic ip a litie s
F re q u e n c y D is trib u tio n o f
T e c h n o lo g y P a rk s
Distributin of Brazilian Technology Parks and Municipalities by GDPper capita
35
0
[> R$ 50.001]
GDP per capita
Technology Parks
Brazil IBEG 2009
Chart 5: Frequency Distribution of Brazilian Tech Parks and Municipalities by GDP per capita data IBGE 2009 (2012)19 and ANPROTEC (2008)20
Source: Authors
Regarding the GDP per capita, it is very similar to the analysis and conclusions reached with
the HDI - there are no Technology Parks in cities whose GDP per capita is less than R$ 5.000,00,
level where the city of Ribeirão Branco - subject of this case study, was, on the occasion of the data
from IBGE 2006 (2012)19. In the range where the GDP per capita is less than R$ 20,001.00, there are
29 Technology Parks, and 5,008 municipalities in this interval, which represents 90.0% of all
municipalities. This means that few municipalities are served by reason of their geographical
position, economic status, without industrial conglomerates without universities or research
institutions, hindering the contributions of Technology Parks in the development of these
municipalities. Therefore, there are very few municipalities served by these Parks.
From this analysis, it can be concluded that the public policies that encourages the creation
of Technology Parks is inconsistent with the Brazilian reality.
This is a noticeable fact, and a cultural trait in science, technology and innovation in Brazil,
when analyzing the National System of Brazilian Science, Technology and Innovation, in which
society is excluded, showed by Table of Selected Actors in this System, see CGEE (2011)21 and CGEE
(2011)22, where there are no representatives of Congress, meaning that there will not be so-called
Technology Assessment Activities, according to RADER (2001)23, as there are no representatives of
Professional Associations, in this case workers and entrepreneurs, and other classes, as there are in
the United States, where it started, and in Germany.
2.5. Prospective process contributing to the Regional Sustainable Development
The prospective process, according to Berger (1958)24, provides seeing far, with amplitude,
with depth, with dare, taking risks and thinking in human beings, and GODET (2001)25 complements
with seeing differently, hunting ideas, seeing together, with appropriation, using techniques and
rigorous and participatory methods.
Figure 3 consolidates the regional prospective process, which follows his account briefly,
macros in seven steps:
19
IBGE, Instituto Brasileiro de Geografia e Estatística. Produto Interno Bruto dos Municípios: 2004 – 2008 e 2005 -2009.
Disponível em: http://www.ibge.gov.br/home/download/estatistica.shtm. Acesso em: 12/01/2012.
ANPROTEC, Associação Nacional de Entidades Promotoras de Empreendimentos Inovadores. Portifólio de Parques
Tecnológicos no Brasil. São Paulo: ANPROTEC, 2008.
21
CGEE, Cento de Gestão e Estudos Estratégicos. Quadro de atores selecionados no Sistema Nacional de Ciência, Tecnologia
e Inovação, 2011. Disponível em: http://www.cgee.org.br/quadro/MapaCTI_02jun10.pdf. Acesso em: 02/06/2011.
22
CGEE, Cento de Gestão e Estudos Estratégicos. Série Documentos Técnicos: Quadro de atores selecionados no Sistema
Nacional de Ciência, Tecnologia e Inovação, 2011a. Disponível em:
http://www.cgee.org.br/publicacoes/documentos_tecnicos.php. Acesso em: 02/06/2011.
23
RADER, Michael. A Structured Longer Term Activity for ESTO: The Monitoring of EU Countries’ Technological FutureOriented Activities; Final Report on Project B: Monitoring of Technology Assessment Activities. Karlsruhe: European
Science and Technology Observatory Network – ESTO, March 2001.
24
BERGER G., , «L’attitude prospective», L’Encyclopédie française, tome XX, Société nouvelle de L’Encyclopédie française
1958.
25
GODET, M. Manuel de prospective stratégique, tome 2: l’art et la méthode », Dunod, Paris, 2001.
20
9
‘
Antonio Luis Aulicino
29th IASP World Conference 2012
VI. Actions - Public Policies
Academy,
University
Other
Social
Agents
I. PRESENT
Media
Governme
nt, three
branches
IV. Strategic Vision
of the Future
Prosecutor
Public
Ministry
VI. Actions - Public Policies
V.2. Achievable
NGOs
Union
V. Possible Futures
III. Past
II. Retrospective
L
Organization
V.1. Desirable
Community
VII. Appropriation
Knowledge and Commitment
Figure 3: Framework of the Regional Prospective Process
Source: BASSALER (2009)26, GODET (2001)25, JOUVENEL (2008)27, MARTIN (2001)28, modified and
consolidated by AULICINO (2008)29
The regional prospective process and description of Figure 3 are based on the authors:
BASSALER (2008)26, GODET (2001)25, JOUVENEL (2008)27, in brief:
I. Present: it consists of a governance, which can have up to three committees: Steering
Committee: composed of the main usurers and the representatives of important social actors in
the region; Prospective Technical Committee: composed of experts in prospective, and
representatives of stakeholders chosen by the Steering Committee and by society, one or more of
the participants of the Steering Committee should participate in this committee; and Local
Prospective Technical Committee: if the region - focus of the prospective process, is far from the
place where the experts in prospective are. This committee should be formed in the region, their
members must be from that region and should be trained in prospective. Governance will be
responsible for making the diagnosis, involving various social actors, involving the theme and the
nine dimensions: economic, social, environmental, cultural, demographic, security and defense,
political, legal and technological. To make the diagnosis it is necessary to perform the
retrospective. For this to occur, it is crucial the participation of representatives of various
stakeholders, where the process of sensitization and awareness by the Technical Committees will
take place. After the sensitization and awareness, there is the preparation of a seminar that will
hold several workshops. In the same seminar the main key variables will be identified and
analyzed in depth in the Structural Analysis, containing the Cross Impact Analysis, which will
identify the key driving variables that will contribute to the construction of the strategic vision of
the future and consequently the construction of scenarios.
II. Retrospective: it is carried out by means of a questionnaire and deepening of the key variables
that will verify the changes in the last twenty years, the ruptures and trends. This information
will form a database. The prospective process should contain or develop the geographic
information system to produce the map of the region and support the formulation of public
policies.
III. Past: will be known through the retrospective and the reasons that caused the present situation,
as far as changes, ruptures, trends, inertias and brakes that have hampered the possible changes
are concerned.
26
BASSALER, Nathalie, “La prospective dans le développement régional pour construire un avenir commun“, Présentation au
petit déjeuner offert par la ADIAL BRASIL. São Paulo : nov 2009.
JOUVENEL Hugues de. La prospective territoriale pour quoi faire ? Comment faire? Futuribles International, Séminaire de
formation. Paris : 14-15 octobre 2008.
28
MARTIN, Ben R. Technology Foresight in a Rapidly Globalizing Economy. Vienna. Proceeding of the Regional Conference,
April 2001.
29
AULICINO, Antonio L. Estudo do Futuro:O que você deve pesquisar hoje? Ciclo de Palestras sobre Inovação e
Empreendedorismo, Agência USP de Inovação- Universidade São Paulo. São Paulo, ago-2008.
27
10
‘
Antonio Luis Aulicino
29th IASP World Conference 2012
IV. Strategic Vision of the Future: After making a diagnosis in conjunction with the various
stakeholders and the identification of key driving variables, a conjoint strategic vision of the
future is built, envisaging the next 20 - 30 years, according to the desire of the participants, with
the possible scenarios, contrasting and confrontational.
The construction of the overall strategic vision of the future is necessary to anticipate the
actions and public policies in the present, so that this vision is achieved by mobilizing the
intelligence of all participants. Thus, the inner motivation and identification of threats and
opportunities contained in the strategic vision of the future are goals to be achieved at the same
time, i.e., can not be achieved separately.
V. Possible Futures: the workshops provided the definition of the choice of several key variables,
and scenarios were built by means of morphological analysis, identifying which of the key
variables are the driving forces for the development of scenarios with more criteria, based on indepth scientific insights, finding the desirable scenarios (V.1) and the achievable ones (V.2).
VI. Actions and Public Policies: After the planning process, comes the legal part which is the
drafting of the contract to implement the plan, strictly speaking, the actions and/or public
policies needed for its execution. In European countries it is a contract signed by regional
representatives, elected in a democratic manner, and by government representatives. Together
with this agreement there is the financial physical schedule.
VII. Appropriation: should determine the success of the prospective process, therefore the arrow in
Figure 3 is continuous through all the steps. Due to the transparency of the process, the
mobilization cannot concentrate excessively on the strategic choices, especially when they have
a confidential and often individual character. Given these conditions, the collective prospective
planning should be forward thinking about the threats and opportunities, mainly the external
ones, that motivate the mobilization and enable the appropriation of the strategy.
2.6. Strategic Planning and Strategic Map
The preparation of the Strategic Plan is crucial for the creation of a Technology Park. Thus,
the Technology Park must align people's behavior, organizational structure and strategy formulated
to achieve the objective set, as in MILLS (1993, p. 117-118)30 and illustrated in Figure 4.
Human
Behavior
Organization
Structure
Strategy
Figure 4: Alignment of strategy, structure and human behavior.
Source: MILLS (1993, p. 118)30
One of the alignment factors shown in Figure 4, according to MILLS (1993), is human behavior,
if there is no commitment of people who work and/or participate in the organization, in the case of
the Technology Park, from the general manager to all the people who work there, it will be difficult
to lead the organization in the desired direction. To this end, there is the need to motivate the
people involved.
According to ANSOFF and McDONNEL (1993:70)31, they represent the ends that the organization
is trying to achieve, while the strategy is the means to these ends. To formulate the strategy it is
necessary to diagnose the current situation of the Technological Park. The analysis of the current
strategic situation identifies the internal aspects, classifying them into strengths and weaknesses; it
30
31
MILLS, Daniel Quinn. O Renascimento da Empresa. Rio de Janeiro: Editora Campus, 1993.
ANSOFF, H. I.; MCDONNELL, Edward J. Implantando a Administração Estratégica. 1a edição, 3a tiragem. São Paulo: Editora
Atlas, 1993.
11
‘
Antonio Luis Aulicino
29th IASP World Conference 2012
also identifies the external aspects, categorizing them into opportunities and threats, according to
OLIVEIRA (2004)32.
When making the strategic diagnosis, the organization knows its current situation, and decides
whether it wants to keep the strategic posture or if it wants to assume new position, which will
involve the formulation of new strategies. The strategy to be formulated should always be a smart,
sustainable (economic, social and environmental) feasible and, whenever possible, original and even
astute, especially in the case of Technology Parks.
The strategy, according to KAPLAN and NORTON (2004)33, is one of the phases of the
continuous logical process that moves a whole organization, that starts in the declaration of its
mission: why the organization exists; the definition of its values: what is important; of its vision:
what the organization wants to be in the future; the formulation of a strategy: how it will achieve
the objectives; the elaboration of the strategic map up to the definition of personal objectives.
The strategic actions mean putting the formulated strategies into practice, which, to be
implemented, require that the organization have people who understand it, including its critical
processes, though complex, through which intangible assets are converted into tangible results,
creating value. The strategic map helps represent this difficult task, according to KAPLAN and
NORTON (2004)33.
The Tech Parks generate intangible assets such as knowledge and technology, providing
indirect value creation both for organizations and for the region where they are established. The
preparation of the strategic map using the four perspectives of the Balanced Scorecard - BSC
provides a model that shows how strategy links intangible assets to processes that create value,
according to KAPLAN and NORTON (2004)33.
The four perspectives defined by the BSC, according to KAPLAN and NORTON (2004)33, begin by
the perspective of learning and growth which is responsible for the organization's performance; in
this case the people, who shall be trained to contribute as best as possible so that objectives are
met by the organization. In Tech Parks, this perspective entails the information systems and
organizational structure needed to support decisions and bolster the internal processes of value
creation. The other perspective is of the internal processes, which identifies the processes required
and those causing impacts on the development of the organization, in this case, the Technological
Park. Following that, the perspective, which in this paper is called supporters, sponsors and clients,
which defines the value proposition to those who somehow will benefit from the knowledge, the
technology and the results of the Technological Park. Finally, the perspective, entitled
developmental and financial, which are the tangible results achieved by the organization - in this
case, by the Technology Park. The four perspectives are connected with each other by relations of
cause and effect.
3. METHODOLOGY
This paper considers the exploratory research and documentation, along with the review of
literature and a documental review. According to GIL (1999, p 43)34, the exploratory research aims to
develop, clarify and modify concepts and ideas in order to formulate more precise problems or
researchable hypotheses for further studies. It is the first step in a broader and more comprehensive
research.
In addition to the exploratory research, it was opted for an action research for this paper.
According to THIOLLENT (2002, p 14.)35, action research is a kind of empirically based social research
that is designed and carried out in close association with an action or to solve a collective problem
and in which researchers and participants representative of the situation or problem are involved
either cooperatively or in a participatory way.
The action research methodology was chosen here because of the direct participation of
representatives of society, citizens of Ribeirão Branco, a municipality in the State of São Paulo,
Brazil, in the drafting of the Strategic Regional Prospective of the Municipality.
The municipality of Ribeirão Branco has the following characteristics: it is located in the
Southwest region of São Paulo, situated 210 km from Curitiba and 310 km from São Paulo. Estimated
population: 18,269 inhabitants, area: 697,813 km2; Human Development Index (HDI): 0.649. It is the
32
OLIVEIRA, Djalma P. R. Planejamento Estratégico. 20a edição. São Paulo: Editora Atlas, 2004.
KAPLAN, Robert S. and NORTON, David P. Strategy Maps. Cambridge, USA: Harvard Business School Publishing Corporation,
2004.
34
GIL, Antonio Carlos. Métodos e Técnicas de PESQUISA SOCIAL. 5a. ed. São Paulo: Editora Atlas, 1999.
35
THIOLLENT, M. Metodologia da Pesquisa-ação. 12a. ed. São Paulo: Cortez Editora, 2003.
33
12
‘
Antonio Luis Aulicino
29th IASP World Conference 2012
penultimate municipality of São Paulo, and one of the poorest, the HDI Income: 0.573, the HDI
Longevity: 0.600 and HDI Education: 0.775, according to PNUD (2000)36. The GDP per capita was R$
4,681, according to IBGE 2006 (2012)37, with the recent update of IBGE 2009 (2012)37 on the GDP per
capita of the municipalities, Ribeirão Branco, has a GDP per capita of R$ 10,914.76. The
municipality of Ribeirão Branco borders the following municipalities: Apiaí, Itapeva, Nova Campina e
Guapiara.
The municipality of Ribeirão Branco and its neighbors have as vocation: agriculture, mining
and silviculture. It is close to the largest continuous patch of Atlantic Forest.
Ribeirão Branco needs a new momentum of development, i.e., a new position, a new identity
and a reconstruction with a shared long term vision, aiming to avoid: their slow evolution, the
devitalization of its rural area and shrinkage of its population. Its population has decreased from
22,674 to 18,269 inhabitants, according to IBGE (2012)37. This decline is due to young people
between 20 and 40 leaving the city in search of better opportunities.
In this context, the regional prospective process contributes to planning and building the
development of this municipality. The prospective process began in Ribeirão Branco with a meeting
in September 2010, which construed the governance process, and defined three committees:
Steering (13 people), Technical Prospective (10 people) - in which the prospective experts took
part, and Regional Technical Prospective (30 people).
The Steering Committee defined: the horizon of 20 years, and the slogan: "Our Common
Future - 2030 Ribeirão Branco" and the objective: “BUILDING A STRATEGIC VISION OF THE FUTURE
FOR RIBEIRÃO BRANCO 2030”, by means of a prospective process, and from it, devising the
Municipal Master Plan of Ribeirão Branco.
4. DATA ANALYSIS AND RESULTS
From the definitions of the Steering Committee and with the defined objective: "Building
Strategic Vision of the Future of Ribeirão Branco 2030," the prospective process began.
For the Regional Technical Prospective Committee was given a training course on Regional
Prospection action, attended by 24 people. Meetings were held with various communities
approximately thirty (30), with young people and entrepreneurs of Ribeirão Branco, to raise
awareness and consolidate the concepts of the prospective process. After this phase of awareness
was held the 1st Regional Prospective Seminar, two-day, was attended by representatives of the
various types of stakeholders, who were distributed in six different workshops. The seminar
included two days of workshops, in which about 102 people participated all together, even though
only 77 participated in the both days of workshops.
The result of these workshops of the seminar presented the diagnosis of the society in
Ribeirão Branco and its priorities. We chose 44 (forty four) variables, which were further developed.
This phase is called Structural Analysis
At the stage of structural analysis we performed a Cross Impact Analysis, with the
participation of 21 (twenty one) people belonging to the Regional Technical Prospective Committee,
where we identified the thirteen (13) key driving variables: 1- Incentive to Eco-agricultural
practices (IPRAGECO); 2- Cultural Rescue (RESCULT); 3- City Hall of Ribeirão Branco (PREFRB); 4Planning, Implementing and Running the Ribeirão Branco Technology Park (PIEPTRB); 5- Lack of
political vision of society (FVPS); 6- Lack of investment in Tourism (TURISMO); 7- Ribeirão Branco
Town Council (CAMRB); 8- Rural Mapping of Ribeirão Branco (MARB); 9- Family agriculture (AF); 10Improvement in professional quality (MQPROF); 11- Guaranteeing access to National Policy ATER
(ATER); 12- Develop the agro-industry (DESAGROIN); 13- Lack of people for project design
(AUPELPROJ).
Figure 5 contains the results of the Matrix Indirect Influences (MII) produced by the software
MICMAC LIPSOR, CNAM, GODET (2001)38, which is the multiplication of order 4 (four times multiplied
by it) of the Matrix of Direct Influence (MDI). The MII shows the key variables that are most
influential, driving, and more dependent. The driving ones are in quadrants I and II are the thirteen
(13) variables that are used to develop the municipality of Ribeirão Branco. It should be noted that
36
PNUD 2000, Programa das Nações Unidas para o Desenvolvimento, IDH – Índice de Desenvolvimento Humano dos Municípios
Brasileiros, 2000. Disponível em: http://www.pnud.org.br/atlas/ranking/IDHM%2091%2000%20Ranking%20decrescente%20(pelos%20dados%20de%202000).htm. Acesso em: 20/01/2012.
37
IBGE, Instituto Brasileiro de Geografia e Estatística. Produto Interno Bruto dos Municípios: 2004 – 2008 e 2005 -2009.
Disponível em: http://www.ibge.gov.br/home/download/estatistica.shtm. Acesso em: 12/01/2012.
38
GODET, M. Manuel de prospective stratégique, tome 2: l’art et la méthode », Dunod, Paris, 2001.
13
‘
Antonio Luis Aulicino
29th IASP World Conference 2012
the quadrant II represents the variables of innovation, which are very influential and dependent.
The variable PIEPTRB, Plan, Implement and Run Technology Park of Ribeirão Branco (PIEPTRB), is
circled with a dotted line.
I
II
Influence
Input variables
(explanatory).
Have a priority in
the exploration
of scenarios
Explains the
evolution of the
system
Variables
excluded
(autonomous).
There should be
prioritized
because it has
no significant
synergistic
effect.
IV
III
Link Variables
(unstable). They
show relevance
for being the
intermediaries in
the influences of
the factors
driving the
results or effects
end.
By nature are
unstable
Outcome
variables.
Indirectly
influenced
Dependence
Figure 4: Indirect Influences and Dependences Map or Plan of Prospective Process of Ribeirão
Branco
Source: Software MICMAC LIPSOR - GODET (2001) 38
When the prospective process is built in conjunction with representatives of society and
appropriation, we notice the identification of the needs of the Technology Park. Clearly, then, that
in regions or municipalities with low HDI and low GDP per capita, as discussed previously, the
establishment of Technology Parks is needed as a form of development of science-based knowledge
and retention of young people from emigrating to developed centers. In the case of Ribeirão
Branco, this variable was very strong and it is associated with Tourism. One of the influential
variables analyzed is the Lack of Political Vision of Society. And possibly due to this lack of political
vision of society that the Technology Parks are established in developed regions with HDI above
0.701 and GDP per capita over R$ 5,000.00.
From this result, planning the Technology Park of Ribeirão Branco began, with the
participation of 15 people, representing the various types of stakeholders.
4.1. Planning the Technological Park of Ribeirão Branco
The Technology Park of Ribeirão Branco in Sao Paulo, has as its main objective to be a
project to promote development of regions through business development, science and technology,
encouraging the creation, deployment and development of knowledge-intensive companies, of the
entrepreneurial culture, innovation, synergy between the participants of the Park and the systems
of science and technology in order to confer cooperation, market and international recognition to
the set.
The Technology Park of Ribeirão Branco's mission, values and vision are, as follows:
Mission - To promote regional sustainable development through the generation of knowledge,
products and services through science and technology and innovation to serve
society, contributing to its transformation.
Values - Ethics, Transparency, Quality, Participation, Fellowship, Commitment, Humility.
Vision – Center for generation of innovative and technological solutions aimed at building a
sustainable and just future for all of society.
The defined objectives were nine:
14
‘
Antonio Luis Aulicino
29th IASP World Conference 2012
a) be a space to develop the knowledge, science and technology, providing a favorable environment
for intellectual production, focusing on technological innovation and creative output of results
amenable to immediate use, combined with an entrepreneurial culture and available for
investment;
b) be an example in environmental matters with the creation of preservation, conservation and
recreation areas integrated with green spaces, and the implementation of recovery programs of
the Atlantic Forest and environmental education;
c) remain open to the region, having the infrastructure and public spaces for democratic practice
and promotion of citizenship;
d) receive and attract technology-based companies in various areas of knowledge, laboratories,
research centers and businesses, and dynamic structures, already existing and established
businesses and institutions;
e) promote the synergy of these entities in the park and with the other actors in local development
in the region in the State and in Brazil and internationally, particularly between teaching and
research institutions, government agencies, development agencies, community associations
companies and other relevant entities;
f) promote training in general, the various areas of scientific and technical knowledge that are
needed for regional and national development;
g) promote sustainable development organized by municipalities, states, countries and regions
taking into account the various dimensions, which are demographic, social, political,
environmental, cultural, technological, economic, and legal also considering the interaction and
integration between different social actors through the regional prospective process.
h) promote development through the prospective of subjects that are required for regional and
national development.
i) promote the improvement of quality of life.
For the creation of the Strategic Planning, a SWOT analysis was used (Strengths, Weaknesses,
Opportunities, Threats) in order to identify the internal strategic aspects, strong and weak points,
and the external aspects, opportunities and threats, as in OLIVEIRA (2004)39. The issues were
prioritized and the actions defined for each aspect. After that, the macro strategy was formulated
for the Future Technology Park.
In the Strategic Map of the Technological Park of Ribeirão Branco perspectives, according to
KAPLAN and NORTON (2004)40, were described from the learning and growth of people, thus:
a) Perspective of learning and of personal growth considers: the preparation and motivation of
people who will work in the Park. People should be empowered to develop and manage projects,
to conduct the Regional Prospective processes and Technological issues, provide tourism services
for the region. In this perspective, also consider the concern with the motivation and
commitment of generating the various partners of the Technology Park, also considering the
members of the Steering Committee of the Park.
b) Perspective of the internal process considers: the people who acquired a competence from the
learning perspective. The processes of this perspective, comprise the following areas: planning
and projects development area, the marketing and communications areas, that will prepare and
implement the Marketing Plan and Communication Plan, and catchment area of the Park sponsors
and clients; the finance and administrative areas, areas of research and development, through
the preparation of a planning, organization and evaluation, the area of training to develop
technical courses needed for regional development and Postgraduate courses in Regional
Prospective and Technology; the area of prospective development of the process for developing
regional and technological issues, the hotel management and restaurant of the Park, the area of
preparation and control of contracts and other partnerships with various entities, companies,
institutes and so on.
c) Perspective of sponsors and customers considers: the management of contacts with the various
people who are in senior management of organizations to strengthen the development of the
Park, providing technical support and training to small and medium industries and agriculture,
family, small and medium-sized; contribution to the development of companies through
technological bases of scientific knowledge in the field of complex techniques, developing
incubators, encouraging small businesses and start-ups; contributing scientifically: Regional
39
40
OLIVEIRA, Djalma P. R. Planejamento Estratégico. 20a edição. São Paulo: Editora Atlas, 2004.
KAPLAN, Robert S. and NORTON, David P. Strategy Maps. Cambridge, USA: Harvard Business School Publishing Corporation,
2004.
15
‘
Antonio Luis Aulicino
29th IASP World Conference 2012
development in the preparation of Master Plans, Regions, States and LC (Local Clusters), the
necessity of other types of investors to contribute to the development of the Technology Park.
d) Development and financial perspective: from the services provided and results obtained in the
previous perspectives, this approach seeks to obtain financial and material resources to develop
the Technology Park and contribute to regional development.
Among the actions planned, the priority for the feasibility of implementation and
establishment of the Technology Park in Ribeirão Branco are those related to legal compliance in
terms of companies. At the same time an area of 26,388 m2 is being considered to donation by the
Municipality, big enough to start the Technology Park.
After several contacts made with various scientific research institutions, some potential
research projects to be developed were identified by means of the regional prospective process: the
technological development of dynamic mapping of the territory, sustainable construction, recycling
of building materials and entrepreneurship; medicinal plants and herbal medicines; herbal products,
the plant pereskia; and a regional development center.
In the case of agricultural projects, the Technology Park of Ribeirão Branco, may mediate
knowledge of results of scientific technical projects for farming surveyed by the Brazilian
Agricultural Research Corporation - EMBRAPA, retransmitting them didactically with an foundation
of entrepreneurial basis to the family farm, also to small and medium-sized producers, improving
quality and productivity of the agricultural products of the municipality.
The other vocation that can be addressed by the Technology Park is mining. The Park may be
the intermediary to pass on the knowledge of results of technical projects of scientific
management, exploration and mining processing, allowing businesses to exploit ore established in a
sustainable manner, minimizing losses and having concern for the health and safety of workers.
In addition to contacts with government and private research organizations, there was
contact with the University that may establish a campus at a distance of approximately 90 km from
Ribeirão Branco.
At the same time meetings were conducted with the federal government for guidance on
resources to start developing the park, from the construction project to its establishment. In Brazil,
the allocation of resources for Technology Parks is for rich regions and in places where there are
already industrial complexes and universities, according to the analysis of commented graphs 4 and
5. The Technology Park of Ribeirão Branco should break this paradigm, representing a breach of
procedures in relation to seventy-four Technology Parks, as in ABID and ANPROTEC (2008)41, in
operation, implementation and project.
It is important to highlight that the difficulty of access to the city of Ribeirão Branco and its
geographic isolation, does not allow the connection with research entities and tourism development
as a consequence it does not have lodging and restaurants to receive visitors or tourists and/or
researchers, although it has several natural tourist attractions, mainly for being too close to the
largest continuous patch of Atlantic Forest. For this reason, in the prospective process and the
Technology Park, another opportunity was identified, which is to constitute a cell to develop
tourism. This opportunity was the sixth key variable identified by prospective process to develop
Ribeirão Branco. To that end, a training center in tourism services, hospitality and restaurant will
be developed, which will contribute to the training of people who will work in this sector, especially
low-income youth.
41
ABID, Agência Brasileira de Desenvolvimento Industrial e ANPROTEC, Associação Nacional de Entidades Promotoras de
Empreendimentos Inovadores. Parques Tecnológicos no Brasil: Estudo, Análise Proposições, 2008. Disponível em:
http://www.abdi.com.br/Estudo/Parques%20Tecnol%C3%B3gicos%20%20Estudo%20an%C3%A1lises%20e%20Proposi%C3%A7%C3%B5es.pdf. Acesso em: 20/10/2010.
16
‘
Antonio Luis Aulicino
29th IASP World Conference 2012
5. FINAL CONSIDERATIONS
It can be concluded that the participation of society in the prospective process for the development
of the Municipality of Ribeirão Branco was important since the community is motivated and
committed to the establishment of the Technology Park. Among the lessons learned in this work we
highlight:
1) The establishment of a Technology Park should be developed not only in structured and evolved
regions, where industrial complexes, universities and research institutions are located. The
Technology Park should contribute to the development of poor regions, accelerating this
process, as occurred in the United States with the development of the first Technology Park,
according to UNESCO (2011)42.
2) In a participatory process, as is the case of the prospective, there are difficulties in
relationships between various stakeholders. These difficulties are related to different reasons,
whether cultural, ideological, political, or various other reasons. It is perceived in the process,
for example, that representatives of the academia have difficulty in relationships with business
representatives who, in turn, have difficult relationships with representatives of the working
class, and vice versa. However, for the development of a municipality and/or of a Technology
Park to occur, representative bodies of the industry, and all stakeholders to be involved in this
process, should have their awareness raised, and should be motivated. And the prospective
process includes these phases, since it requires the anticipation for the action with
appropriation by all stakeholders involved. Because when the objective is greater than the
individual or group interest, everyone starts working together, synergies are built and the
proposals are set out in favor of the sustainable development of the Technology Park and the
Municipality.
42
UNESCO. Science Policy and Capacity-Building: Concept and Definition. Disponível em:
http://www.unesco.org/new/en/natural-sciences/science-technology/university-industry-partnerships/sciencetechnology-park-governance/concept-and-definition/, acessado em 24/11/2011.
17
‘
Download