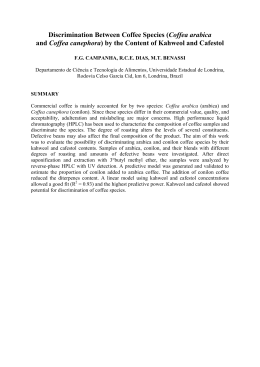
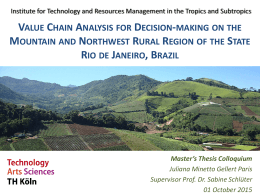
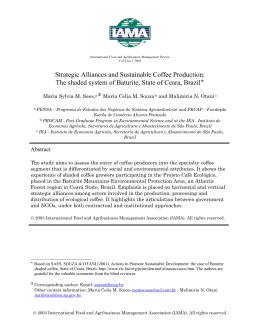
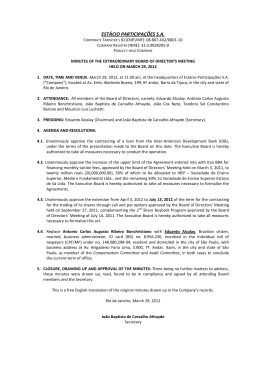
i
i
“main” — 2014/4/14 — 12:37 — page 569 — #1
i
i
Revista Brasileira de Geofı́sica (2013) 31(4): 569-578
© 2013 Sociedade Brasileira de Geofı́sica
ISSN 0102-261X
www.scielo.br/rbg
PHENOLOGICAL CHARACTERIZATION OF COFFEE CROP
(Coffea arabica L.) FROM MODIS TIME SERIES
Antônio Felipe Couto Júnior1 , Osmar Abı́lio de Carvalho Júnior2 ,
Éder de Souza Martins3 and Antônio Fernando Guerra3
ABSTRACT. Arabica Coffee (Coffea arabica L.) demonstrates a two-year phenological cycle, this knowledge is important for crop forecast in Brazil. This work
aimed to describe the coffee crop phenology from MODIS vegetation index time series. The study area is located in the western Bahia State, Brazil, due to its remarkable agribusiness development. MODIS time series data comprehended 10-year Normalized Difference Vegetation Index (NDVI) and Enhanced Vegetation Index (EVI).
However, these times series are usually contaminated by noise caused by atmospheric variations that are harmful to the surface discrimination. Median filter and the
Minimum Noise Fraction (MNF) were used together to smooth the original dataset. NDVI and EVI temporal profiles showed differences of amplitude and gradient. The
results evidenced the Arabica Coffee phenological stages, as described in previous fieldworks. These results showed potential application for large-area land cover
monitoring.
Keywords: vegetation index, remote sensing, digital image processing.
RESUMO. O Café Arábica (Coffea arabica L.) apresenta um ciclo fenológico de dois anos, sendo relevante o seu conhecimento para a previsão de safras no Brasil.
O objetivo deste trabalho foi caracterizar a fenologia da cultura de café a partir de séries temporais de ı́ndices de vegetação do sensor MODIS. A área de estudo está
localizada no oeste do estado da Bahia, Brasil, devido ao seu notável desenvolvimento do agronegócio. As séries temporais MODIS compreendem 10 anos do Normalized
Difference Vegetation Index (NDVI) e Enhanced Vegetation Index (EVI). Contudo, essas séries temporais apresentam ruı́dos ocasionados por efeitos atmosféricos que
prejudicam a discriminação dos alvos da superfı́cie. O filtro de mediana e a transformação Fração Mı́nima de Ruı́do (FMR) foram usados em conjunto para suavizar os
dados originais. Os perfis temporais NDVI e EVI apresentam diferenças de amplitude e gradiente. Os resultados evidenciaram os estágios fenológico do Café Arábica,
como descritos em prévios trabalhos de campo. Esses resultados possuem potencial de aplicação para o monitoramento do uso da terra em extensas áreas.
Palavras-chave: ı́ndices de vegetação, sensoriamento remoto, processamento digital de imagem.
1 Universidade de Brası́lia, Campus Planaltina, 73300-00 Planaltina, DF, Brazil. Phone: 3071-8002 – E-mail: [email protected]
2 Universidade de Brası́lia, Departamento de Geografia Campus Universitário Darcy Ribeiro, Asa Norte, 70910-900 Brası́lia, DF, Brazil. Phone: +55(61) 307-1859;
Fax: +55(61) 272-1909 – E-mail: [email protected]
3 Embrapa, Centro de Pesquisa Agropecuária dos Cerrados, 73301-970 Planaltina, DF, Brazil. Phone: +55(61) 3388-9803 – E-mails: [email protected];
[email protected]
i
i
i
i
i
i
“main” — 2014/4/14 — 12:37 — page 570 — #2
i
570
i
PHENOLOGICAL CHARACTERIZATION OF COFFEE CROP (Coffea arabica L.) FROM MODIS TIME SERIES
INTRODUCTION
The monitoring of agricultural crops has implications for the
economy, society, politics and environment (Ozdogan, 2010).
The biophysical characteristics and phenological stages of crops
are important for irrigation system, comprehension of seasonal
exchange of carbon dioxide, productivity model, and in the prediction of net primary production (Bouman et al., 2001; Kimball
et al., 2004; Sakamoto et al., 2010).
Spatial studies of crop phenology have been made from individual field evaluations, with high cost and without continuous spatial information (Ozdogan, 2010). In order to minimize
these limitations, remote sensing has been used as a complementary tool for the detection of seasonal variations (Sakamoto et
al., 2005; Xavier et al., 2006; Galford et al., 2008; Wardlow &
Egbert, 2008). The vegetation indices are widely used in remote
sensing images due to their correlation with biophysical changes
in plants (Huete, 1985), being associated with the seasonal life
cycles with specific duration, occurrence, synchrony and symmetry (Rathcke & Lacey, 1985). The Arabica Coffee (Coffea arabica
L.) has a phenological cycle of two years, unlike the normally
observed in other plants (Camargo & Camargo, 2001). This article aims to describe the phenology of Arabica Coffee plantation
using NDVI-MODIS time-series.
Coffea arabica L. Phenology
Arabica Coffee is a plant native to Ethiopia and South Sudan, at
altitudes between 1,600 m and 2,000 m, where the air temperature is between 18◦ C and 20◦ C and annual rainfall varies from
1,500 mm to 1,800 mm, being well-distributed, with a dry season
periods (4-5 months) (Livramento, 2010; Meireles et al., 2009).
In Brazil, all the coffee production is located at latitudes
greater than 4◦ , tropical/sub-tropical regions (Assad et al., 2001).
The Cerrado biome corresponds to about 40% of the national
production of coffee (Guerra et al., 2005a). The coffee phenology is subject the agrometeorological conditions, being affected
by photoperiodic variations, rainfall distribution and air temperature, which affect productivity and product quality (Meireles
et al., 2009). Recent studies have established the duration and
magnitude of water stress for uniform flowering of the coffee in
Central Brazil (Guerra et al., 2005b).
The complete phenological cycle of coffee is for two years,
with the development of vegetative branches in the first year
and flowering in the second year (Camargo & Camargo, 2001).
Among the various models developed, we adopt the subdivision
proposed by Camargo & Camargo (2001) with six phenological
stages: two stages in the first year and four stages in the second
year.
In the first phenological year, the first phase develops vegetative buds, usually occurring between September and March,
when the days are longer (Camargo & Franco, 1985). The second stage marks the reproductive phase with induction, differentiation, growth and dormancy of flower buds, from April to August. Over the last two months, the dormant buds produce a pair
of small leaves, marking the end of the first phonological year
(Camargo & Camargo, 2001).
In the second year phenological, the third phase (September to December) starts at blossom after water stress, achieving
the expansion of the fruits (Camargo & Franco, 1985). Fourth
stage occurs between January and March with the grain formation, when a water stress can be detrimental to the development
of these grains (Meireles et al., 2009). Fifth stage corresponds
to the fruit maturation between April and June, with a moderate
water deficit that benefits the product. In the last stage there is
the self-prunning process represented physiologically by senescence (July-August), when the productive branches wither and
die, limiting its vegetative growth (Camargo & Camargo, 2001).
Orbital Monitoring of Coffee Plantation
Few studies have been conducted with satellite images to distinguish coffee plantation until the 1990s (Tardin et al., 1992). Moreira et al. (2004) studied coffee crop (Coffea arabica L.) on two
occasions of development, with less and more than five years old.
These authors show that the spectral response in the TM-Landsat
images of the coffee crops < 5 years is similar to the pasture
in the red and mid-infrared wavelengths. In contrast, the coffee
plantation > 5 years showed spectral differences.
Techniques for monitoring and estimates of coffee production are becoming more advanced, especially in the spatialtemporal analysis (Moreira et al., 2011a), spectral analysis (Vieira
et al., 2006; Machado et al., 2010), and data integration from
different sensors such as MODIS and high spatial resolution images available on Google Earth (Bernardes et al., 2011; Moreira
et al., 2011b).
Study Area
The study area is located within the Ecoregion of the Chapadão
do São Francisco (Arruda et al., 2006) in the Cerrado biome
(Fig. 1A), between the municipalities of Luis Eduardo Magalhães
(LEM) and Barreiras (Fig. 1B) (IBGE, 2008). The climate of the
study area is divided in two well-defined seasons: a dry and
Revista Brasileira de Geofı́sica, Vol. 31(4), 2013
i
i
i
i
i
i
“main” — 2014/4/14 — 12:37 — page 571 — #3
i
COUTO JÚNIOR AF, CARVALHO JÚNIOR OA, MARTINS ES & GUERRA AF
cold season (from May to September) and a rainy and hot season (from October to April). The annual average precipitation is
around 1.500 mm and annual average maximum and minimum
temperature varies between 21.3◦ C and 27.2◦ C, respectively
(Batistella et al., 2002; Meirelles, 2009). The soils are predominantly deep, intensely weathered, well-drained, nutrient-poor and
acid, standing out Latosoil and Neosoil (Batistella et al., 2002).
This region has growth potential for coffee crop, since the production systems are improved (Guerra et al., 2007). In the study
area, the coffee plantations were started in 2000 (Fig. 1C).
MATERIALS AND METHODS
MODIS Data
Moderate resolution Imaging Spectroradiometer (MODIS) sensor
is onboard the TERRA and AQUA platforms, acquiring images
with high temporal-resolution (Justice et al., 2002). The images
are corrected for atmospheric effects and georeferenced (Wolfe
et al., 1998). MOD13 product is related to vegetation indices:
Normalized Difference Vegetation Index (NDVI) and Enhanced
Vegetation Index (EVI), generated from the daily surface reflectance (MOD09) (Vermote et al., 2002). MOD13 product is a
16-days composite. In this work, both indices were used. The
NDVI is the most widely used index, having the following formulation (Rouse et al., 1973):
N DV I =
ρNIR − ρred
ρNIR + ρred
where, ρNIR is the near-infrared reflectance value (8001100 nm) and ρred is the red reflectance value (600-700 nm).
NDVI values range from -1 to 1.
EVI index reduced the saturation problem described by the
NDVI in high biomass areas (Hobbs, 1995; Gilabert et al., 1996)
and minimizes the atmosphere influences. The EVI is expressed
by the following equation (Justice et al., 1998; Huete et al., 2002):
EV I = G
ρNIR − ρred
ρNIR + C1ρred − C2ρblue + L
where ρblue is the blue reflectance value (459-479 nm); G is a
gain factor; C1, C2 are the coefficients of the aerosol resistance
term, which uses the blue band to correct for aerosol influences
in the red band, and L functions as the soil-adjustment factor.
The coefficients used in the MODIS EVI algorithm are, G = 2.5,
C1 = 6, C2 = 7.5, and L = 1 (Justice et al., 1998; Huete et
al., 1994; 1997).
i
571
Denoising Procedures for MODIS time series
This paper used time series of MODIS vegetation indices concerning to a period of 11 years (between 2000 and 2010), totaling 224
scenes with spatial resolution of 250 meters. The images were
arranged in three dimensions, where X and Y axes represent
the geographical coordinates and the Z axis the temporal profile
(Fig. 2).
The following methods were used to noise reduction: median filter and Minimum Noise Fraction (MNF) transform (Carvalho Júnior et al., 2012). The median filter had a 7×7 window
dimension and was applied over the time series. The median is
determined by sorting all observation inside window from lowest pixel value to highest pixel value and takes the middle value,
being a non-linear method. In addition, the MNF transformation
was applied to the temporal images, which combines both the
procedures for segregation of the noise component as well as to
reduce data dimensionality (Green et al., 1988). This methodological sequence was successfully applied to MODIS time series to
characterize the Cerrado vegetation (Carvalho Júnior et al., 2008,
2009, 2012). Some previous studies adopt only MNF transformation in noise reduction of time series, but have limitations with
impulse noise (Carvalho Júnior et al., 2006; Couto Junior et al.,
2011, 2012; Santana et al., 2010).
NDVI and EVI temporal profiles for phenological
characterization of Arabica Coffee
Average time series of a coffee plantation (625,000 m2) was
calculated for each vegetation index (Fig. 1C). The phenological characterization of Arabica Coffee was performed from these
temporal signatures, considering the six stages of Campbell &
Campbell (2001).
The phenological transitions in the Arabica Coffee were
found by calculating the first derivative. The cafe plantation behavior was compared with the Cerrado Sensu Stricto, in order to
assess the ecological functioning of the irrigation system within
that environment.
RESULTS AND DISCUSSION
Results of Noise Reduction
The median filter provided a significant reduction of impulse
noise, consisting mainly by cloud cover and their respective
shadows (Fig. 3). In addition, the MNF transformation eliminated
the white-noise. The selection of first twenty MNF components
containing less noise was performed by analyzing the eigenvalues plot. Thus, the MNF inverse transform using only the signal components reversed the data to the original values without
noise (Fig. 3).
Brazilian Journal of Geophysics, Vol. 31(4), 2013
i
i
i
i
i
i
“main” — 2014/4/14 — 12:37 — page 572 — #4
i
572
i
PHENOLOGICAL CHARACTERIZATION OF COFFEE CROP (Coffea arabica L.) FROM MODIS TIME SERIES
Figure 1 – Ecoregion of the Chapadão do São Francisco inside the Cerrado Biome (A); area with coffee plantations (B); study area with MODIS
grid (250 meters spatial resolution) over the natural vegetation and coffee plantation in central pivot (C).
Results phenological analysis of Arabica coffee using
time series
The NDVI index showed higher values than the EVI (∼20%)
(Fig. 3). On the other hand, the NDVI profile had lower seasonal amplitudes than the EVI. The NDVI values between 2000
and 2002 demonstrated a constant increase in the photosynthetic
activity. In those first 24 months, the EVI values increased only
during the phenological second-year. Since September 2002,
seasonal averages were similar for each vegetation index. In mid2007, the EVI seasonal amplitude reached a value of 0.25 and
remained higher until the end of the study period (Fig. 3).
Figure 4 shows the first derivative curves for the temporal
profiles, i.e. the rate of change (slope) of vegetation index over
time. The peaks in the first derivative curves are indicative of
an intense variation of NDVI or EVI values, which correspond to
phenological changes. The highest values of first derivative occurred in the rainy season, due to an increase of photosynthetically active leaves. In contrast, the lowest vegetation indices values occurred in the dry season, during the self-pruning stages at
the end of each phenological year.
In 2008, NDVI first derivative values showed a strong decreased, followed by increase in 2009, due to the planting renewal. This increment represented the carbohydrate generation,
attending to branches, roots and fruits growth and new blossom
out leaves. The EVI first derivative profile showed higher peaks
(positive and negative) over the period 2007 to 2009.
Revista Brasileira de Geofı́sica, Vol. 31(4), 2013
i
i
i
i
i
i
“main” — 2014/4/14 — 12:37 — page 573 — #5
i
COUTO JÚNIOR AF, CARVALHO JÚNIOR OA, MARTINS ES & GUERRA AF
i
573
Figure 2 – Noise reduction scheme.
Figure 3 – Original data distribution (black dots) and the smoothed time series (black lines) for the two vegetation indices.
The coffee plantation presented vegetation indices greater
than natural vegetation (Cerrado Sensu Strictu), approximately
20% higher for NDVI and 25% higher for EVI (Fig. 5). Those
higher values indicated the influence of irrigation system on
crops.
Figure 6 shows the temporal profiles of NDVI and EVI with
the six phenological stages proposed by Camargo & Camargo
(2001). The temporal profiles of the two indices had different
shapes. The EVI curves presented a slight asymmetry, while the
NDVI curves tended to have a more symmetrical behavior. At
Brazilian Journal of Geophysics, Vol. 31(4), 2013
i
i
i
i
i
i
“main” — 2014/4/14 — 12:37 — page 574 — #6
i
574
i
PHENOLOGICAL CHARACTERIZATION OF COFFEE CROP (Coffea arabica L.) FROM MODIS TIME SERIES
Figure 4 – Comparisons of the NDVI and EVI profiles (top), first derivative of the respective profiles (bottom).
Figure 5 – Comparison between temporal signatures of Arabica Coffee and Cerrado Sensu Strictu .
the beginning of each year, the NDVI showed an increase of
their values, which remained at higher levels than EVI. Thus the
decay of NDVI values was delayed compared to the EVI. Therefore,
NDVI negative gradients were constrained to periods of fallow
and self-prunning (end of year), associated with a drop of tertiary
and quaternary branches. Those different shapes were apparently
due to saturation of the NDVI.
The first stage showed higher coefficients of variation
(CV%), standard deviation, and range for both indices (Table 1).
These values reflect the vegetative growth and formation of leaf
buds. The highest average NDVI value (0.8451) was observed
in the fifth phenological stage, while for the EVI (0.6364) in the
fourth stage, evidencing a distinct symmetry between the curves
(Table 1).
Table 1 – NDVI and EVI measures of central tendency and variability
in reference to the coffee phenological stages. Mean; Standard Deviation
(SD); Coefficient of Variation (CV %), Minimum value (Min), Maximum
value (Max), and Range (R).
N
D
V
I
E
V
I
Stage
M
SD
CV(%)
Min
Max
Ran
1
2
3
4
5
6
1
2
3
4
5
6
0.8027
0.8184
0.7651
0.8416
0.8451
0.7869
0.5874
0.5408
0.5001
0.6364
0.5756
0.4734
0.0653
0.0420
0.0389
0.0399
0.0259
0.0294
0.0881
0.0534
0.0491
0.0452
0.0571
0.0262
8.14
5.13
5.09
4.74
3.06
3.73
15.00
9.87
9.81
7.10
9.91
5.53
0.6431
0.7323
0.7148
0.7719
0.7975
0.7527
0.4463
0.4484
0.4310
0.5862
0.4826
0.4414
0.8750
0.8843
0.8349
0.9003
0.8757
0.8351
0.7416
0.6340
0.5754
0.7266
0.6694
0.5158
0.2319
0.1520
0.1201
0.1284
0.0782
0.0824
0.2953
0.1856
0.1445
0.1403
0.1868
0.0744
Revista Brasileira de Geofı́sica, Vol. 31(4), 2013
i
i
i
i
i
i
“main” — 2014/4/14 — 12:37 — page 575 — #7
i
COUTO JÚNIOR AF, CARVALHO JÚNIOR OA, MARTINS ES & GUERRA AF
i
575
Figure 6 – NDVI and EVI temporal profiles in relation to the Arabica coffee phenological cycle (24 months). The markers correspond to averages with their confidence
intervals of 95%, NDVI is represented by the black circle, and EVI by the square.
CONCLUSION
ACKNOWLEDGEMENTS
Remotely sensed time-series data offers considerable promise
as a tool for monitoring crop phenology. The combination of
median filter with the MNF transformation reduces the noise of
MODIS time series. First derivative curves are excellent qualitative indicators of phenological changes.
NDVI and EVI temporal signatures showed evident variations
of amplitude and frequency, both on the natural vegetation and
coffee plantation. The saturation of the NDVI on the coffee crop
is also evident, in which the EVI profile compared to the NDVI
shows larger amplitudes and different slopes during the transitions between the rainy and dry periods. The higher values of
coffee crop regarding to the Cerrado Sensu Strictu (natural vegetation) was due to irrigation system and consequently the canopy
structure and closure.
Results showed similarities between the MODIS temporal
profiles and the Arabica Coffee phenological stages described in
the fieldwork. Thus, this approach should be used to coffee crop
monitoring, with the development of temporal libraries for different managements and regions. Therefore, MODIS time-series
data are suitable to integrate with field experiments and biophysical variables, especially for long-term data.
The authors would like to thank Coordenação de Aperfeiçoamento de Pessoal de nı́vel Superior (CAPES) for conceding the
doctorate scholarship to the researcher Antonio Felipe Couto
Junior; and Conselho Nacional de Desenvlvimento Cientı́fico e
Tecnológico (CNPq) for financial support from fellowship to the
researchers: Osmar Abı́lio de Carvalho Júnior and Éder de Souza
Martins. Special thanks to Mr. Gabriel Bartholo for their important considerations.
REFERENCES
ARRUDA MB, PROENÇA CEB, RODRIGUES S, MARTINS ES, MARTINS
RC & CAMPOS RN. 2006. Ecorregiões, Unidades de Conservação e
Representatividade Ecológica do Bioma Cerrado. In: SANO S, ALMEIDA
SP. (Org.). Cerrado: ambiente e flora 2 ed. Brası́lia: Embrapa, v. 1, 5–35.
ASSAD ED, EVANGELISTA BA, SILVA FAM, CUNHA SAR, ALVES ER,
LOPES TSS, PINTO HS & ZULLO JUNIOR J. 2001. Zoneamento agroclimático para a cultura de café (Coffea arabica L.) no estado de Goiás e
sudoeste do estado da Bahia. Revista Brasileira de Agroclimatologia, 9:
510–518.
BATISTELLA M, GUIMARÃES M, MIRANDA, EE, VIEIRA HR, VALLADARES GS & MANGABEIRA JAC. 2002. Monitoramento da expansão
Brazilian Journal of Geophysics, Vol. 31(4), 2013
i
i
i
i
i
i
“main” — 2014/4/14 — 12:37 — page 576 — #8
i
576
i
PHENOLOGICAL CHARACTERIZATION OF COFFEE CROP (Coffea arabica L.) FROM MODIS TIME SERIES
agropecuária na Região Oeste da Bahia. Campinas: Embrapa Monitoramento por Satélite. Documentos, 20, 39 pp.
expansion and intensification of row-crop agriculture in Brazil. Remote
Sensing of Environment, 112: 576–587.
BERNARDES T, MOREIRA MA & ADAMI M. 2011. Aplicabilidade de dados MODIS no monitoramento de lavouras cafeeiras no Estado de Minas
Gerais, Brasil. 2011. In: Simp. Bras. Sens. Remoto, XV: 2011, Curitiba.
Proceedings... INPE: 2011. p. 637–637.
GILABERT M, GANDIA S & MELIA J. 1996. Analyses of spectralbiophysical relationships for a corn canopy. Remote Sensing of Environment, 55: 11–20.
BOUMAN BAM, KROPFF MJ, TUONG TP, WOPEREIS MCS, BERGE
HFM & VAN LAAR HH. 2001. ORYZA 2000: Modeling lowland rice.
Los Baños (Philippines): International Rice Research Institute, and
Wageningen: Wageningen University and Research Centre. 235 pp.
CAMARGO AP & FRANCO CF. 1985. Clima e fenologia do cafeeiro.
In: Cultura de café no Brasil: manual de recomendações. Rio de
Janeiro: Instituto Brasileiro do Café, Ministério da Indústria e Comércio,
p. 19–50.
CAMARGO AP & CAMARGO MBP. 2001. Definição e esquematização
das fases fenológicas do cafeeiro arábica nas condições tropicais do
Brasil. Bragantia, 60: 65–68.
CARVALHO JUNIOR OA, HERMUCHE PM & GUIMARÃES RF. 2006.
Identificação regional da floresta decidual na bacia do rio PARANÃ
(GO/TO) a partir da análise multitemporal de imagens MODIS. Revista
Brasileira de Geofı́sica, 24(3): 319–332.
CARVALHO JUNIOR OA, SAMPAIO CS, SILVA NC, COUTO JUNIOR
AF, GOMES RAT, CARVALHO APF & SHIMABUKURO YE. 2008.
Classificação de padrões de savana usando assinaturas temporais NDVI
do sensor MODIS no Parque Nacional da Chapada dos Veadeiros.
Revista Brasileira de Geofı́sica, 26(4): 505–517.
CARVALHO JUNIOR OA, COUTO JUNIOR AF, SILVA NC, MARTINS ES,
CARVALHO APF & GOMES RAT. 2009. Avaliação dos classificadores
espectrais de Mı́nima Distância Euclidiana e Spestral Correlation Mapper em séries temporais NDVI-MODIS no campo de instrução militar de
Formosa (GO). Revista Brasileira de Cartografia, 61: 399–412.
CARVALHO JUNIOR OA, SILVA NC, CARVALHO APF, COUTO JUNIOR
AF, SILVA CR, SHIMABUKURO YE, GUIMARÃES RF & GOMES RAT.
2012. Combining noise-adjusted principal components transform and
median filter techniques for denoising MODIS temporal signatures.
Revista Brasileira de Geofı́sica, 30(2): 147–157.
COUTO JUNIOR AF, CARVALHO JUNIOR OA, MARTINS ES, SANTANA
OA, SOUZA VV & ENCINA JI. 2011. Tratamento de ruı́dos e caracterização de fisionomias do Cerrado utilizando séries temporais do sensor
MODIS. Revista Árvore, 35: 699–705.
COUTO JUNIOR AF, CARVALHO JUNIOR OA & MARTINS ES. 2012.
Séries temporais MODIS aplicadas em sucessão de culturas de soja
(Glycine max (L.) Merrill) e milho (Zeamays L.) em sistema de plantio
direto. Revista Brasileira de Cartografia, 64 (3): 405–418.
GALFORD G, MUSTARD JF, MELILLO J, GENDRIN A, CERRI CC &
CERRI CEP. 2008. Wavelet analysis of MODIS time series to detect
GREEN AA, BERMAN M, SWITZER P & CRAIG MD. 1988. A transformation for ordering multispectral data in terms of images quality with
implications for noise removal. IEEE Transactionson Geoscience and
Remote Sensing, 26: 65–74.
GUERRA AF, ROCHA OC & RODRIGUES GC. 2005a. Manejo do cafeeiro
irrigado no Cerrado com estresse hı́drico. ITEM: Irrigação e Tecnologia
Moderna, 65/66: 42–45.
GUERRA AF, ROCHA OC, RODRIGUES GC, SANZONOWICZ C, SAMPAIO JBR, SILVA HC & ARAÚJO MC. 2005b. Irrigação do cafeeiro no
Cerrado: estratégia de manejo de água para uniformização de florada.
Planaltina: Embrapa CPAC. Comunicado Técnico, 122, 4 pp.
GUERRA AF, ROCHA OC, RODRIGUES GC, SANZONOWICZ C, MERA
AC & CORDEIRO A. 2007. Comportamento de três cultivares de café
submetidas a diferentes espaçamentos entre linhas e regimes hı́dricos
no Cerrado. Planaltina: Embrapa CPAC. Boletim de Pesquisa e Desenvolvimento, 188, 17 pp.
HOBBS T. 1995. The use of NOAA-AVHRR NDVI data to assess herbage
production in the arid rangelands of Central Australia. International Journal of Remote Sensing, 16: 1289–1302.
HUETE AR, DIDAN K, MIURA T, RODRIGUEZ P, GAO X & FERREIRA LG.
2002. Overview of the radiometric and biophysical performance of the
MODIS vegetation indices. Remote Sensing of Environment, 83: 195–
213.
HUETE AR, JACKSON RD & POST DF. 1985. Spectral response of a
plant canopy with different soil backgrounds. Remote Sensing of Environment, 17: 37–53.
HUETE AR, JUSTICE C & LIU H. 1994. Development of vegetation
and soil indices for MODIS-EOS. Remote Sensing of Environment, 49:
224–234.
HUETE AR, LIU HQ, BATCHILY K & VAN LEEUWEN W. 1997. A comparison of vegetation indices over a global set of TM images for EOSMODIS. Remote Sensing of Environment, 59: 440–451.
IBGE – Instituto Brasileiro de Geografia e Estatı́stica. 2008. Censo
Agropecuário 1990 a 2008. Available on: www.ibge.gov.br. Access on
Sept. 26, 2011.
JUSTICE CO, VERMOTE E, TOWNSHEND JRG, DEFRIES R, ROY PD,
HALL DK, SALOMONSON V, PROVETTE JL, RIGGS G, STRHALER A,
LUCHT W, MYNENI B, KNYAZIKHIN Y, RUNNING WS, NEMANI RR,
WAN Z, HUETE AR, LEEUWEN WV, WOLFE R E, GIGLIO L, MULLER
JP, LEWIS P & BARNSLEY M. 1998. The Moderate Resolution Imaging
Revista Brasileira de Geofı́sica, Vol. 31(4), 2013
i
i
i
i
i
i
“main” — 2014/4/14 — 12:37 — page 577 — #9
i
COUTO JÚNIOR AF, CARVALHO JÚNIOR OA, MARTINS ES & GUERRA AF
Spectroradiometer (MODIS): land remote sensing for global change research. IEEE Transactions on Geoscience and Remote Sensing, 36(4):
1228–1247.
JUSTICE CO, TOWNSHEND JRG, VERMOTE EF, MASUOKA E, WOLFE
RE, SALEOUS N, ROY DP & MORISETTE JT. 2002. An overview of
MODIS Land data processing and product status. Remote Sensing of
Environment, 83: 3–15.
KIMBALL JS, MCDONALD KC, RUNNING SW & FROLKING SE. 2004.
Satellite radar remote sensing of seasonal growing seasons for boreal
and subalpine evergreen forests. Remote Sensing of Environment, 90:
243–258.
LIVRAMENTO DE. 2010. Morfologia e fisiologia do cafeeiro In: REIS PR,
CUNHA RL (Ed). Café Arábica do plantio à colheita Lavras: EPAMIG,
p. 87–162.
MACHADO ML, ALVES HMR, VIEIRA TGC, FILHO EIF & LACERDA
MPC. 2010. Mapeamento de áreas cafeeiras (Coffea arabica L.) da
Zona da Mata Mineira usando sensoriamento remoto. Coffee Science, 5:
113–122.
MEIRELES EJL, CAMARGO MBP, PEZZOPANE JRM, THOMAZIELLO RA,
FAHL JI, BARDIN L, SANTOS, JAPIASSÚ LB, GARCIA AWR, MIGUEL
AE & FERREIRA RA. 2009. Fenologia do cafeeiro: condições agrometeorológicas e balanço hı́drico do ano agrı́cola 2004-2005 Embrapa
Informação Tecnológica Brası́lia, 128 pp.
MOREIRA MA, ADAMI M, BERNARDES T & RUDORFF BFT. 2011a.
Análise da dinâmica espaço-temporal da área cafeeira na região
sul/sudeste de Minas Gerais nos anos safras 2006 a 2008. 2011. In:
Simp. Bras. Sens. Remoto, XV: 2011, Curitiba. Proceedings... INPE:
2011. p. 489–496.
MOREIRA MA, ADAMI M, RUDORFF BFT & BERNARDES T. 2011b. Uso
de imagens do Google Earth capturadas através do software stichmap e
do TM/Landsat-5 para mapeamento de lavouras cafeeiras – nova abordagem metodológica. In: Simp. Bras. Sens. Remoto, XV: 2011, Curitiba.
Proceedings... INPE: 2011. p. 481–488.
MOREIRA MA, ADAMI M & RUDORFF BFT. 2004. Análise espectral e
temporal da cultura do café em imagens Landsat. Pesquisa Agropecuária
Brasileira, 39: 223–231.
OZDOGAN M. 2010. The spatial distribution of crop types from
MODIS data: temporal unmixing using independentcomponentanalysis.
Remote Sensing of Environment, 114: 1190–1204.
i
577
RATHCKE B & LACEY EP. 1985. Phenological patterns of terrestrial
plants. Annual Review of Ecology and Systematics, 16: 179–214.
ROUSE JW, HAAS RH, SCHELL JA & DEERING DW. 1973. Monitoring vegetation systems in the Great Plains with ERTS. Proceedings of
the Third Earth Resources Technology Satellite-1 Symposium Greenbelt:
NASA SP-351 301–317.
SAKAMOTO T, YOKOZAWA M, TORITANI H, SHIBAYAMA M, ISHITSUKA
N & OHNO HA. 2005. Crop detection method using time-series MODIS
data. Remote Sensing of Environment, 96: 366–374.
SAKAMOTO T, WARDLOW BD, GITELSON AA, VERMA SB, SUYKER
AE & ARKEBAUER TJ. 2010. A two-step filtering approach for detecting maize and soybean phenology with time-series MODIS data.
Remote Sensing of Environment, 114: 2146–2159.
SANTANA OA, CARVALHO JÚNIOR OA, PIMENTEL CMM, GOMES
RAT & OLIVEIRA SN. 2010. Modelagem de espectros temporais NDVIMODIS, no perı́odo de 2000 a 2008, na bacia do rio Paracatu, Brasil.
Revista Brasileira de Geofı́sica, 28(1): 47–60.
TARDIN AT, ASSUNÇÃO GV & SOARES JV. 1992. Análise preliminar de
imagens TM visando a discriminação de café, citrus e cana-de-açucar
na região de Furnas, MG. Pesquisa Agropecuária Brasileira, 27: 1355–
1361.
VERMOTE E, EL SALEOUS N & JUSTICE C. 2002. Atmospheric correction of the MODIS data in the visible to middle infrared: First results.
Remote Sensing of Environment, 83(1-2): 97–111.
VIEIRA TGC, ALVES HM, LACERDA MPC, VEIGA RD & EPIPHANIO
JCN. 2006. Crop parameters and sperctral response of coffee (Coffea
arabica L.) areas within the state of Minas Gerais, Brazil. Coffee Science,
1: 111–118.
WARDLOW BD & EGBERT SL. 2008. Large-area crop mapping using
time-series MODIS 250m NDVI data: an assessment for the US Central
Great Plains. Remote Sensing of Environment, 112: 1096–1116.
WOLFE RE, ROY DP & VERMOTE E. 1998. MODIS land data storage
gridding and compositing methodology: level 2 grid. IEEE Transactions
on Geoscience and Remote Sensing, 36: 1324–1338.
XAVIER AC, RUDORFF BFT, SHIMABUKURO YE, BERKA LMS & MOREIRA MA. 2006. Multi-temporal analysis of MODIS data to classify sugarcane crop. International Journal of Remote Sensing, 27: 755–768.
Recebido em 10 fevereiro, 2012 / Aceito em 27 dezembro, 2012
Received on February 10, 2012 / Accepted on December 27, 2012
Brazilian Journal of Geophysics, Vol. 31(4), 2013
i
i
i
i
i
i
“main” — 2014/4/14 — 12:37 — page 578 — #10
i
578
i
PHENOLOGICAL CHARACTERIZATION OF COFFEE CROP (Coffea arabica L.) FROM MODIS TIME SERIES
NOTES ABOUT THE AUTHORS
Antonio Felipe Couto Junior. Undergraduate degree in Forestry Engineering by the University of Brası́lia in 2003 and master degree in Forestry Science by the
same institution in 2007. Is studying to obtain a doctor degree in Applied Geoscience at University of Brası́lia. Presently is a professor at University of Brası́lia, campus
Planaltina. Carries out researches on temporal series analyses, cover changes, relations among relief, soil and vegetation.
Osmar Abı́lio de Carvalho Júnior. Undergraduate degree in Geology by the University of Brası́lia in 1990. Master and doctor degree in Mineral Prospecting by
the University of Brası́lia in 1995 and 2000, respectively. Worked as a researcher of National Institute for Space Research between 2002 and 2004. Presently is a professor
at University of Brası́lia and got a research productivity scholarship from CNPq. Carries out researches on digital processing of multispectral and hyperspectral
images.
Eder de Souza Martins. Undergraduate degree in Geology by the University of Brası́lia in 1987. Master (1987) and doctor (1999) degree in Geology by the same
university. Presently works at Empraba (Brazilian Agricultural Research Corporation). Carries out researches on methodologies for the cartographic mapping and
generalization of pedologic information.
Antônio Fernando Guerra. Undergraduate degree in Agricultural Engineering by the Federal University of Viçosa, in 1979. Master degree in Agricultural Engineering
by the Federal University of Viçosa, in 1981. Doctor degree in Irrigation Engineering by the University of Arizona (1990). Currently he is a researcher (A-level) of the
Empraba (Brazilian Agricultural Research Corporation). His research has emphasis on irrigation (irrigation systems, irrigation management of annual crops, irrigated
coffee production system).
Revista Brasileira de Geofı́sica, Vol. 31(4), 2013
i
i
i
i
Download