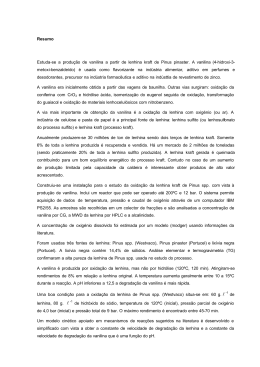
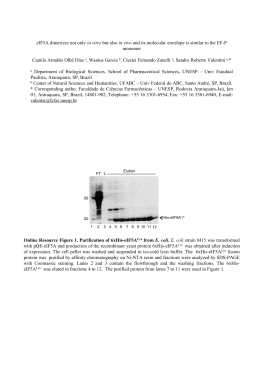
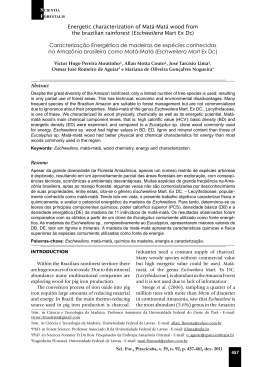
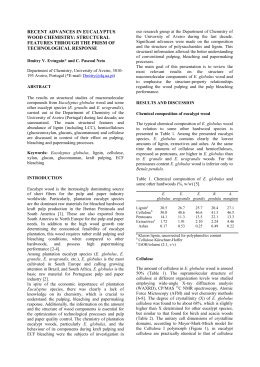
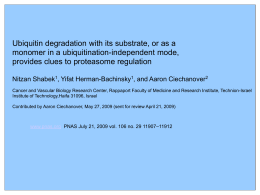
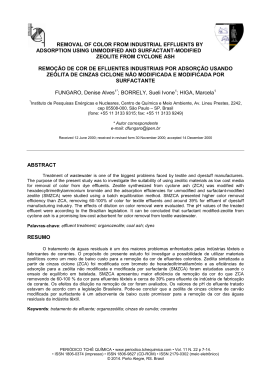
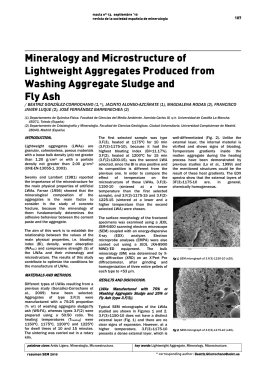
PEER-REVIEWED ARTICLE
bioresources.com
Thermal Characteristics of Lignin Residue from
Industrial Processes
Javad Sameni,a,* Sally Krigstin,a Derval dos Santos Rosa,b Alcides Leao,c and
Mohini Sain a
Many pulp mills and biorefineries today are focusing on the utilization of
their residual lignin for economic return. Although lignin can be burned to
produce energy, it also has the potential for the production of valueadded products. Technical lignins have modified structure and contain
different impurities, which depend on the original material, as well as the
extraction process. Among the various techniques for lignin extraction,
kraft and steam explosion processes are the most commonly used in the
pulping and biorefinery industries, respectively. The objective of this work
was to compare the thermal behavior of industrial lignins produced from
kraft pulping and steam explosion, with that of their chemically extracted,
purified forms. It was found that the purified lignins have very similar
thermal properties to one another, while impurities in the industrial lignins
significantly alter their thermal behavior, and hence their potential in
value-added applications. The percentage of degradation from 200 to
600 °C and glass transition temperature of original steam-exploded lignin
was 68.5% and 149.16 °C, while of original kraft lignin was 26.0% and
109.82 °C. These values were altered after purification to 61.0% and
158.99 °C for steam-exploded lignin; and to 40.0% and 129.82 °C for
kraft lignin, respectively.
Keywords: Industrial lignins; Impurities; Thermal behavior; Glass transition temperature; XRD; EDS
Contact information: a: Center for Biocomposites and Biomaterials Processing, Faculty of Forestry,
University of Toronto, Toronto, ON, Canada; b: Federal University of ABC, Santo Andre, SP, Brazil; c:
Department of Natural Resources, State University of Sao Paulo, Botucatu, SP, Brazil;
* Corresponding author: [email protected]
INTRODUCTION
Lignin is one of the most abundant natural substances in the world, and it is
produced as a by-product in pulp mills and cellulosic ethanol biorefineries. Although the
major portion of lignin is burned to produce energy in recovery boilers (Mohan et al.
2006), there is potential to utilize it in higher-value applications (Vishtal and Kraslawski
2011). The use of lignin is limited for value-added products due to its high content of
impurities, which are generated during the extraction process. Methods exist for the
purification of lignin; however, these processes add cost and complexity to the lignin
recovery process. Recently, isolated lignin has been used for conversion into value-added
products, such as phenolic resins (Alonso et al. 2004; Khan et al. 2004; Sarkar and
Adhikari 2001; Tejado et al. 2007), carbon fiber (Schmidl 1992; Kadla et al. 2002), and
polymer blends (Cazacu et al. 2004; Gosselink et al. 2004b; Kadla et al. 2002).
Therefore, it is of interest to understand the differences between various industrial lignins
as they are generated by their original extraction process as compared to their purified
form.
Sameni et al. (2014). “Impurities in industrial lignins,”
BioResources 9(1), 725-737.
725
PEER-REVIEWED ARTICLE
bioresources.com
Technical lignins are different from each other to a significant extent because they
originate from different sources and separation processes such as kraft, soda, steam
explosion, organosolv, and hydrolysis (Vishtal and Kraslawski 2011). The kraft process
is a prominent method for making pulp and produces the largest volume of lignin. In this
process, α-aryl and β-aryl ether bonds in lignin are cleaved by alkaline hydrolysis (in a
mixture of sodium hydroxide and sodium sulfide) in which 90% of the lignin is removed
before the bleaching process (Chakar and Ragauskas 2004). The generated aqueous
solution, which is called black liquor, contains ligneous material (30 to 45 wt. %),
saccharinic acids (25 to 35 wt. %), formic and acetic acid (10 wt. %), extractives (3 to 5
wt. %), sodium (17 to 20 wt. %), and sulfur (3 to 5 wt. %) (Wallberg et al. 2003). In the
steam explosion process, biomass is fractionated for producing cellulosic ethanol
(Doherty et al. 2011). In the pretreatment step of the process, biomass is exposed to
pressurized steam, followed by depressurization. This rapid change in pressure results in
the hydrolysis of the hemicelluloses and the cleavage of lignin-hemicellulose bonds (Li et
al. 2007). Therefore, the lignocellulosic structure breaks down, and as result, the lignin is
partially depolymerized while the hemicellulose can be readily hydrolyzed (Cara et al.
2006). The removal of hemicellulose increases the average pore size of the substrate and
thus enhances cellulose degradation by making more surface area accessible to enzymes
(Hendriks and Zeeman 2009; Taherzadeh and Karimi 2008).
There are a number of methods for isolating lignin from the industrial residue
stream. The LignoBoost® process is used to remove lignin from concentrated kraft black
liquor by acidifying it with carbon dioxide (Beis et al. 2010). When carbon dioxide is
absorbed into the alkaline black liquor, the pH is decreased, and the lignin becomes
hydrophobic and precipitates. The lignin is then dewatered to 65%, and after filtration,
the filter cake is re-dispersed and acidified with sulfuric acid. In another technique
(Abacherli and Doppenberg 2001), lignin is precipitated from the black liquor solution by
reducing the pH while at room temperature; subsequently, the mixture is heated to about
70 to 80 °C to turn it from a gelatinous form into a filterable form. Lignin is separated by
filtration, washed with water, and dried in an oven.
The ash content of herbaceous biomass is much higher than that of wood (which
is usually less than 1%) (Pan and Sano 2005). The major elements in wood ash are
calcium, potassium, and magnesium, while sodium and silicon are present in relatively
smaller amounts (Misra et al. 1993). Typically, herbaceous plants contain much higher Si
content. For instance, the ash of wheat straw and rice straw contain 9.6% and 16.5%
silicon, respectively, while aspen and white oak contain only 0.1% silicon in their ashes
(Misra et al. 1993; Pan and Sano 2005). However, the source and the amount of minerals
in industrial lignins depend more on the extraction process than the plant species. For
instance, alkaline pulping processes, such as kraft, produce lignin with high ash content
(43.6%), while autohydrolysis (1.2%) and organosolv (0.1%) techniques result in low ash
content (Zabaleta 2012). The sources of these minerals can be the various chemicals used
in the pulping process or metallic matter entering the process from piping and machinery
(Zabaleta 2012).
In this work, lignin was isolated from black liquor and cellulosic ethanol residues
to elucidate the differences in behavior of the industrial lignin materials compared to that
of their purified forms. The ash content was also analyzed to determine the chemical
composition of mineral impurities in the original and isolated lignin.
Sameni et al. (2014). “Impurities in industrial lignins,”
BioResources 9(1), 725-737.
726
bioresources.com
PEER-REVIEWED ARTICLE
EXPERIMENTAL
Materials
Two industrial lignins and two commercial lignins were used in this study: L1
was derived from a cellulosic ethanol biorefinery, which uses hardwood/herbaceous
biomass; L2 was kraft black liquor obtained from a pulp mill in Brazil utilizing eucalypt
species. Commercial lignins are L3 and L4. The raw material and extraction method of
the four different lignins are presented in Table 1.
Table 1. Description of Lignin Samples
Label
L1
L2
L3
L4
Lignin
Raw material
Industry
Lignocellulosic
Biorefinery
Kraft Black Liquor
Commercial
Commercial
Hardwood/
Herbaceous
Hardwood
Softwood
Herbaceous
Cellulosic
Ethanol
Pulp
Pulp
Pulp
Extraction
Method
Steam
Explosion
Kraft
Kraft
Soda
Lignin Isolation
Lignin samples were isolated using the Abacherli and Doppenberg (2001)
method. Briefly, lignin was dissolved in 0.5 M NaOH and filtered with a Büchner funnel
with a paper membrane filter (1-µm mesh). Lignin was then precipitated with sulfuric
acid to a pH of 2 to 3 and heated to 70 to 80 °C. The resulting precipitate was filtered and
subsequently washed several times with water at 50 to 60 °C, followed by washing with
water at room temperature. The material was dried at 50 °C overnight (Fig. 1). The purity
of each lignin was determined as the weight ratio of the purified lignin to the crude
lignin,
( )
( ⁄ )
(1)
where A is the mass of purified lignin (oven dried) (g) and B is the mass of crude material
(oven dried) (g).
Fig. 1. Lignin isolation process
Sameni et al. (2014). “Impurities in industrial lignins,”
BioResources 9(1), 725-737.
727
bioresources.com
PEER-REVIEWED ARTICLE
Ash Content Determination
The ash content of the samples was gravimetrically determined after incineration
at 525 °C or 900 °C (TAPPI method T 211 om-93, 1999). About 0.5 g of moisture-free
sample was weighed and placed in a muffle furnace at 525±25 °C (or 900±25 °C) for 4 h.
The temperature was increased to 250 °C slowly so that the sample was carbonized
without flaming. At the conclusion of heating, samples were placed in a desiccator and
cooled to room temperature prior to weighing. Samples were white/gray in color on
completion of the heating cycle. Samples were weighed on an analytical balance to the
nearest 0.1 mg. The ash content was determined as follows,
( )
( ⁄ )
(2)
where A is the mass of ash (g) and B is the mass of the test specimen (oven dried) (g).
Energy-Dispersive X-Ray Spectroscopy (EDS)
To elucidate the nature of the ash, a scanning electron microscope (SEM)
equipped with an energy dispersive spectrometer (EDS) was employed. A thin layer of
ash was carefully sprinkled onto double-sided carbon tape mounted on SEM aluminum
stubs. All samples were sputter-coated and imaged using a JEOL (JSM-6610LV)
scanning electron microscope equipped with a backscattered electron detector in lowvacuum mode (Johnson et al. 2010). Each ash sample was characterized by examining all
the ash particles observed within the whole image. EDS analysis detects signals from all
elements present in the material and provides a qualitative analysis.
X-ray Diffraction (XRD)
XRD patterns were collected on a Philips (PW1830) diffractometer (40 kV, 40
mA) equipped with a Ni filter, using Cu Kα radiation (λ =1.54 Å). Scans were performed
from 10° to 50° with 0.02° increments at 2 s per step. Identification of chemical
compounds was performed using X’Pert Highscore Software (ver. 2.2) and the ICDD
database.
Thermogravimetric Analysis (TGA)
About 12 to 14 mg of lignin sample was weighed into a standard ceramic crucible
and placed in a NETZSCH thermogravimetric analyser (Model STA 449F3). Heating was
performed from room temperature to 1100 °C at a rate of 10 °C min−1. The test was
carried out under an argon atmosphere with a flow rate of 20 mL min−1. A curve of
weight loss against temperature was obtained from the instrument.
Differential Scanning Calorimetry (DSC)
DSC of lignin samples was performed with a TA instrument-DSC Q200. The
results were processed using “Universal 4.2E TA” software. Each sample (2 to 5 mg) was
weighed into a standard aluminum pan (40 µL) and heated under a nitrogen atmosphere
with a flow rate of 15 mL/min. The sample was initially heated to 200 °C at a heating rate
of 10 °C/min. Next, the sample was cooled down to -10 °C with a cooling rate of 30
°C/min. Finally, the sample was reheated to 200 °C with a heating rate of 10 °C/min. The
initial heating and cooling cycle was carried out to clear the thermal history of the sample
to eliminate the endothermic enthalpy relaxation that usually affects the Tg determination
Sameni et al. (2014). “Impurities in industrial lignins,”
BioResources 9(1), 725-737.
728
bioresources.com
PEER-REVIEWED ARTICLE
(Poursorkhabi et al. 2013; Rials and Glasser 1984). The Tg value of each sample was
measured from the last heating cycle.
RESULTS AND DISCUSSION
Lignin Purity
The percentage of isolated lignin from the industrial samples (L1 and L2) can be
seen in Table 2, as well as the commercial lignins, which both had very high lignin
content (L3: 94.43% and L4: 95.25%). L1 (cellulosic ethanol residue) contained 37.95%
lignin. The black liquor (L2) had significantly lower lignin content (27.12%) compared to
steam-exploded lignins (L1). The percentage of extracted lignin from the black liquor
falls within the expected range of 20 to 40% lignin based on the dry content (Vishtal and
Kraslawski 2011).
Table 2. Percentage of Isolated Lignins from Alkaline Extraction
Lignin
L1
L2
L3
L4
Isolated lignin (%)
37.95
27.12
94.43
95.25
Ash Analysis
The ash or inorganic content of the original and isolated lignins can be seen in
Table 3. The ash content of sample L1 represented a fairly small proportion of the
material (2.31%) because the cellulosic ethanol process used steam and enzymes to
extract the carbohydrates, which left behind a relatively chemical-free residue. On
examination of the EDS spectrum (Fig. 2a), it can be seen that its ash also contained K,
Na, Al, S, and silica. Wood in general does not contain silica; therefore, the presence of
silica can be attributed to the wheat straw used in the biorefinery process (Table 1). The
ash content of wheat straw is much higher than that of wood. The ash content of wood is
usually less than 1%, while the ash content of wheat straw is about 9.6%, of which 76%
is silica (Pan and Sano 2005). The purified L1 contained 0.45% ash, which was the
lowest ash among the purified samples. It has been reported that the lignin produced from
organosolv techniques contains 0.1% ash contamination (Zabaleta 2012).
The ash content of L2 was extremely high and represented approximately 36% of
the material. This can be attributed to high amounts of sodium and sulfur used in the kraft
process (Wallberg et al. 2003). The ash content of black liquor has been reported to be as
much as 30% (Mansouri and Salvadó 2006). It has been reported that kraft lignins
contain 1.5 to 3.0% sulfur, some present as elemental sulfur and some organically bound
to the lignin (Gellerstedt and Lindfors 1984). Normally, inorganic chemicals are
recovered and re-used in the process and the lignin is burned as a fuel. If the black liquor
is not processed through the recovery system, then there will be a large proportion of
these chemicals left in the liquor, as evidenced by the high ash (inorganic) content of L2.
The elemental composition of L2 ash can be seen in Fig. 2b, showing the presence of K,
Na, Al, S, and Si in both the original and purified lignins.
In both L1 and L2, the inorganic content was reduced after the isolation process.
The ash content of L2 was reduced from 36.29% to 1.54%, whereas the ash content of the
Sameni et al. (2014). “Impurities in industrial lignins,”
BioResources 9(1), 725-737.
729
PEER-REVIEWED ARTICLE
bioresources.com
original L1 was reduced to 0.45% from 2.31%. For the L2 sample, possible contaminants,
such as sodium sulfate and sodium sulfide, would be solubilized in the sodium hydroxide
used in the Abacherli and Doppenberg (2001) method and removed from the sample
during purification. It can be seen in both the L1 and L2 samples that sulfur was present
and may be due to the sulfuric acid used in the purification process. It is important to note
that the ash content in the original L1 (steam-exploded process) was much lower than that
in the original L2 (kraft process).
L3 is commercial purified kraft lignin made from pine species isolated through an
acid hydrolysis process (Beis et al. 2010). This commercial lignin had a relatively high
ash content (4.25%) as compared to the ash content of the lignins purified by the
Abacherli and Doppenberg (2001) method. The percentage ash of the commercial L3 was
reported by Cateto et al. (2009) as 3%. The ash content may be attributed to the sodium
salts and the chemically bonded sulfur from the kraft process. L4 is also a commercial
lignin, which is derived from wheat straw through a soda process and acid precipitation
technique. The ash content of L4 (soda lignin) was 2.04%, which was lower than the ash
content of L3 (kraft lignin). The EDS spectra (Fig. 2c and 2d) showed the presence of K,
Na, Al, Si, and S in both commercial samples. The ash and silicate contents of the wheat
straw soda lignin were reported by Gosselink et al. (2004a) as 1.9% and 0.7%,
respectively.
Fig. 2. EDS analysis of lignin ash
The moisture content of all isolated lignins was less than 2.5% due to lignin’s low
affinity to moisture caused by its hydrophobic structure. The original L1 and L2 lignins
contained more moisture than their purified forms. Lignin with higher impurities
contained more moisture content, which indicated that the impurities contained
hydrophilic compounds.
Sameni et al. (2014). “Impurities in industrial lignins,”
BioResources 9(1), 725-737.
730
bioresources.com
PEER-REVIEWED ARTICLE
Table 3. Ash Content and Moisture Content of Lignin Samples
Ash content
Moisture content
L1 (original)
2.31±0.07
3.32±0.22
L2 (original)
36.29±0.29*
8.05±0.06
L1 (purified)
0.45±0.09
2.50±0.56
L2 (purified)
1.54±0.13
1.13±0.27
L3 (original)
4.25±0.08
1.67±0.32
L4 (original)
* at 900 °C
2.04±0.12
2.39±1.33
Lignin
Figure 3 shows the X-ray diffraction patterns of lignin ashes. X-ray diffraction
scans were run to identify the chemical compounds in each lignin ash. In the XRD scans,
the sharp lines matched the spectra of the compounds in the database. In our study, no
chemical compound was identified from the XRD pattern of the original L1 (Fig. 3a).
Analysis of the original L2 indicated that the ash is a mixture of inorganic compounds.
However, the XRD spectrum of the purified L2 ash clearly identified sodium sulfate and
silicate in the sample. The XRD spectra showed that the main inorganic compound in L3
lignin was sodium sulfate, while sodium sulfate and silicon dioxide were the two major
compounds in L4 specimen (Figs. 3c and 3d).
Fig. 3. XRD spectra of lignin ash
Thermogravimetric Analysis
The thermal characteristics of lignin can be determined using TGA. Figure 4
shows the mass loss of the original and purified lignins over the temperature range of 30
Sameni et al. (2014). “Impurities in industrial lignins,”
BioResources 9(1), 725-737.
731
PEER-REVIEWED ARTICLE
bioresources.com
to 1100 °C. The materials were assessed for thermal degradation (on-set temperature), %
mass loss between 200 and 600 °C, and percentage of charred residue remaining at 1000
°C (Table 4). The negligible mass loss below 100 °C was a consequence of water loss.
It can be seen in Fig. 4 that the TGA curves of all purified lignins showed very
similar thermal behavior. Their thermal degradation began at 200 to 220 °C, which
demonstrated that they were thermally stable below 200 °C. Derivative thermograms
(dTGs) of purified lignins clearly showed that the thermal activities occurred over the
temperature range of 200 to 600 °C. There was an initial rapid degradation until about
350 °C, followed by a much slower rate of degradation, which continued to about 600 °C.
L3 exhibited the lowest percentage weight loss (about 54.0%), while the weight loss of
other lignins was between 59.0 and 61.0%. The charred residue of purified lignins was in
a range of 37 to 45%. The charred residue of L3 (softwood) was the highest, and that of
L4 (herbaceous) was the lowest among the lignin samples.
The TGA curves of industrial lignins (original L1 and L2) showed different
thermal behaviors. The earlier on-set to thermal degradation for the original L1 could be
due to the presence of carbohydrates, which normally show an on-set of degradation
below 200 °C.
The larger proportion of mass loss (68.5%) or volatilization of material between
200 and 600 °C can be attributed to the inclusion of carbohydrates in the residue of the
original L1. In addition, the lower char of the original L1 (28.1%) in comparison with
purified L1 (38.1%) demonstrated that the majority of components were volatilized,
thereby indicating that materials such as cellulose and hemicelluloses were present. The
original L2 sample demonstrated a different thermal degradation pattern, starting the
degradation at a lower temperature (100 °C) than the original L1 (160 °C). The
thermogram of the original L2 showed a smaller initial degradation (26.0%) in the 200 to
600 °C range, followed by a gradual degradation from 700 to 900 °C. The second rapid
mass loss that occurred was attributed to the degradation of the inorganic impurities,
which resulted in a final residue of 24%. In the purified L2 sample, many of the
inorganics had already been removed; this can explain the lack of a two-step degradation.
The inorganic impurities in the original L2 sample substantially affected the thermal
characteristics of this lignin.
Commercial lignins L3 and L4 showed no differences in the thermal degradation
of their original and purified forms. Differences in the pyrolysis range of commercial
lignins (e.g., L3) have been observed by Beis et al. (2010). The results from their TGA
analysis showed the same thermal degradation response as was observed in our work.
Thus, it appeared that the isolation method removed impurities from the raw lignin,
which caused the observed differences in the thermal behavior. The impurities in L1 and
L2, which are removed by the purification process, resulted in lignin with the same
characteristics as the commercial lignin.
The charred residue of L3 at 1000 °C was about 45%, while for the other samples,
it was about 37 to 40%. Above 800 °C, the unvolatilized portion of lignin remains as
charred residue due to the formation of highly condensed aromatic structures (Sun et al.
2000; Tejado et al. 2007). The amount of remaining char was inversely proportional to
the amount of hydroxyl, methoxyl, and carboxyl groups (Jakab et al. 1995). In other
words, higher percentages of charred residue are generated when there are a lower
proportion of these functional groups.
Sameni et al. (2014). “Impurities in industrial lignins,”
BioResources 9(1), 725-737.
732
bioresources.com
PEER-REVIEWED ARTICLE
Fig. 4. TGA thermogram of original and purified lignin samples
Table 4. Onset Temperature, Degradation Temperature, and Percentage of
Charred Residues of Original and Purified Lignins
Original
Lignin
L1
L2
L3
L4
Onset
Temp.
(°C)
160.0
100.0
220.0
200.0
Purified
Degradation
200-600 °C (%)
Charred
residue (%)
68.5
26.0
50.0
61.0
28.1
24.0
46.0
37.1
Onset
Temp.
(°C)
200.0
200.0
220.0
200.0
Degradation
200-600 °C (%)
61.0
59.0
54.0
61.0
Charred
residue
(%)
38.1
40.0
45.0
37.0
Glass Transition
The DSC results of the original and purified lignins from the third cycle are
shown in Fig. 5. The glass transition temperature (Tg) and the on-set temperature (T0) of
purified lignin were in the range of ~130 to 190 °C and ~120 to 175 °C, respectively.
This wide range demonstrated that there were differences between the lignins in terms of
flexibility and stiffness at elevated temperatures, which is important in industrial
applications. The Tg value can be explained by various molecular factors, such as
interchain hydrogen bonding, crosslinking density, rigid phenyl groups, and molecular
mass (Heitner et al. 2010). Glass transition temperature, molecular weight, and
polydispersity correlation for a series of lignin samples was studied by Schmidl (1992).
The glass transitions of lignin samples were very broad (ranging from 130 to 170 °C),
which reflect the effect of differences in pulping conditions on the molecular weight, and
Sameni et al. (2014). “Impurities in industrial lignins,”
BioResources 9(1), 725-737.
733
PEER-REVIEWED ARTICLE
bioresources.com
it was linearly correlated with polydispersity of the molecular weight (Schmidl 1992). On
the other hand, the char residue was increased with increasing molecular weight. This
effect was explained by Sun et al. (2000) in terms of varied in structure and an increasing
degree of branching and condensation of lignin structures (Sun et al. 2000). Therefore,
based on the literature, the glass transition is directly proportional to the char residue.
One can see this behaviour with two kraft lignins (L2 and L3), where the char residue and
glass transition of L3 was higher than L2, (molecular weight of softwood lignin is greater
than hardwood lignin (Tejado et al. 2007)). However, this trend may not be consistent for
all lignins, because both Tg and char residues also depend on the plant source and
extraction conditions.
Fig. 5. DSC curves of lignin samples
Table 5 shows the Tg and T0 values of the original and purified lignin samples. Tg
and T0 were clearly lower in purified lignins than they were in the original lignins. Higher
amounts of impurities resulted in larger differences in glass transmission temperatures
(ΔTg) and on-set temperature (ΔT0). The Tg values for various lignins have been reported
in the literature in the range of 90 to 180 °C (Glasser and Jain 1993; Tejado et al. 2007),
with higher values corresponding to softwood lignins. The Tg and T0 of purified L1 were
very similar to those of the original L3. It seems that the L1 and L3 lignins behaved quite
similarly once the carbohydrate contaminants were removed through the purification
process. The low Tg of the original L2 suggested that there may be other polyphenoic
macromolecules, in addition to lignin, present in the sample (Sahoo et al. 2011). The
purified L2 remained quite different from the other samples, with lower Tg and T0.
Sameni et al. (2014). “Impurities in industrial lignins,”
BioResources 9(1), 725-737.
734
bioresources.com
PEER-REVIEWED ARTICLE
Table 5. Onset Temperature and Glass Transition Temperature for Original and
Isolated Lignin Samples
Lignin
L1
L2
L3
L4
On-set Temp. (T0) (°C)
Original
136.26
95.75
143.72
163.75
Purified
149.57
119.36
150.32
174.56
Glass Transition Temp. (Tg) (°C)
ΔT0
13.31
23.61
6.60
10.81
Original
149.16
109.82
158.15
189.34
Purified
158.99
129.82
161.89
190.05
ΔTg
9.83
20.00
3.74
0.62
CONCLUSIONS
1. The main differences between industrial and commercial lignins can be found in their
impurities. The impurities in industrial lignins depended on the extraction process and
the source of the lignocellulosic material. The inorganic elements in industrial lignin
were reduced after the isolation process. Industrial processes such as kraft generate
more impurities when compared to steam explosion. Extracted lignin from wheat
straw contained more silicon than hardwood and softwood lignins.
2. The thermal decomposition and percentage of the charred residue of isolated lignins
were slightly different from each other. However, the percentage of charred residue in
industrial lignins was much higher than that in isolated lignins.
3. The glass transition temperature of lignin samples is reduced with higher percentages
of impurities. There was a wide range of Tg (~130 to 190 °C) for isolated lignins.
4. Industrial lignins, which have lower costs, can be beneficially utilized once their
important characteristics are known. This elemental and thermal analysis of two
industrial lignins suggested that steam-exploded lignin may have higher potential for
economic return, for instance in carbon fiber production, in comparison with kraft
lignin due to its lower inorganic content.
ACKNOWLEDGMENTS
The authors are grateful for the financial support from Brazil-Canada CAPESDEFAIT and ORF-RE funding programs.
REFERENCES CITED
Abacherli, A., and Doppenberg, F. (2001). “Method for preparing alkaline solutions
containing aromatic polymers,” US Pat. 6,239,198.
Alonso, . ., liet, ., P re , . ., odr gue , ., and Echeverr a, . (2 4).
“Determination of curing kinetic parameters of lignin–phenol–formaldehyde resol
resins by several dynamic differential scanning calorimetry methods,” Thermochim.
Acta 419(1-2), 161-167.
Beis, S., Mukkamala, S., Hill, N., Joseph, J., Baker, C., Jensen, B., Stemmler, E.,
Sameni et al. (2014). “Impurities in industrial lignins,”
BioResources 9(1), 725-737.
735
PEER-REVIEWED ARTICLE
bioresources.com
Wheeler, C., Frederick, B., and van Heiningen, A. (2 1 ). “Fast pyrolysis of lignins,”
BioResources 5(3), 1408-1424.
Cara, C., Ruiz, E., Ballesteros, I., Negro, . ., and Castro, E. (2 6). “Enhanced
enzymatic hydrolysis of olive tree wood by steam explosion and alkaline peroxide
delignification,” Proc. Biochem. 41(2), 423-429.
Cateto, C. A., Barreiro, M. F., Rodrigues, A. R. E. D., and Belgacem, M. N. (2009).
“Optimization study of lignin oxypropylation in view of the preparation of
polyurethane rigid foams,” Ind. Eng. Chem. Res. 48(5), 2583-2589.
Cazacu, G., Pascu, M. C., Profire, L., Kowarski, A. I., Mihaes, M., and Vasile, C. (2004).
“Lignin role in a complex polyolefin blend,” Ind. Crops Prod. 20(2), 261-273.
Chakar, F. S., and agauskas, A. . (2 4). “Review of current and future softwood kraft
lignin process chemistry,” Ind. Crops Prod. 20(2), 131-141.
Doherty, W. O. S., Mousavioun, P., and Fellows, C. . (2 11). “Value-adding to
cellulosic ethanol: Lignin polymers,” Ind. Crops Prod. 33(2), 259-276.
Gellerstedt, G., and Lindfors, E.-L. (1984). “Structural changes in lignin during kraft
pulping,” Holzforschung 38(3), 151-158.
Glasser, W. G., and Jain, R. K. (1993). “Lignin derivatives. I. Alkanoates,”
Holzforschung 47(3), 225-233.
Gosselink, R. J. A., Abächerli, A., Semke, H., Malherbe, R., Käuper, P., Nadif, A., and
van Dam, . E. G. (2 4a). “Analytical protocols for characterisation of sulphur-free
lignin,” Ind. Crops Prod. 19(3), 271-281.
Gosselink, R. J. A., Snijder, M. H. B., Kranenbarg, A., Keijsers, E. R. P., de Jong, E., and
Stigsson, L. L. (2 4b). “Characterisation and application of NovaFiber lignin,” Ind.
Crops Prod. 20(2), 191-203.
Heitner, C., Dimmel, D., and Schmidt, J. (2010). Lignin and Lignans: Advances in
Chemistry, CRC Press/Taylor & Francis Group, Boca Raton, FL.
Hendriks, A. T., and Zeeman, G. (2 9). “Pretreatments to enhance the digestibility of
lignocellulosic biomass,” Bioresource Technol. 100(1), 10-18.
Jakab, E., Faix, O., Till, ., and S kely, T. (1995). “Thermogravimetry/mass
spectrometry study of six lignins within the scope of an international round robin
test,” J. Anal. Appl. Pyrol. 35(2), 167-179.
Johnson, A., Catalan, L. J. ., and Kinrade, S. D. (2 1 ). “Characterization and evaluation
of fly-ash from co-combustion of lignite and wood pellets for use as cement
admixture,” Fuel 89(10), 3042-3050.
Kadla, J. F., Kubo, S., Venditti, R. A., and Gilbert, . D. (2 2). “Novel hollow core
fibers prepared from lignin polypropylene blends,” J. Appl. Polym. Sci.85(6), 13531355.
Khan, M. A., Ashraf, S. M., and alhotra, . P. (2 4). “Eucalyptus bark lignin
substituted phenol formaldehyde adhesives: A study on optimization of reaction
parameters and characterization,” J. Appl. Polym. Sci. 92(6), 3514-3523.
Li, J., Henriksson, G., and Gellerstedt, G. (2 7). “Lignin
depolymerization/repolymerization and its critical role for delignification of aspen
wood by steam explosion,” Bioresource Technol. 98(16), 3061-8.
Mansouri, N.-E. E., and Salvadó, . (2 6). “Structural characterization of technical
lignins for the production of adhesives: Application to lignosulfonate, kraft, sodaanthraquinone, organosolv and ethanol process lignins,” Ind. Crops Prod. 24(1), 8-16.
Misra, M. K., Ragland, K. W., and Baker, A. . (1993). “Wood ash composition as a
function of furnace temperature,” Biomass Bioenerg. 4(2), 103-116.
Sameni et al. (2014). “Impurities in industrial lignins,”
BioResources 9(1), 725-737.
736
PEER-REVIEWED ARTICLE
bioresources.com
Mohan, D., Pittman Jr, C. U., and Steele, P. H. (2 6). “Single, binary and multicomponent adsorption of copper and cadmium from aqueous solutions on Kraft
lignin—A biosorbent,” J. Colloid Interf. Sci. 297(2), 489-504.
Pan, X., and Sano, Y. (2 5). “Fractionation of wheat straw by atmospheric acetic acid
process,” Bioresource Technol. 96(11), 1256-1263.
Poursorkhabi, V., Misra, ., and ohanty, A. K. (2 13). “Extraction of lignin from a
coproduct of the cellulosic ethanol industry and its thermal characterization,”
BioResources 8(4), 5083-5101.
Rials, T. G., and Glasser, W. G. (1984). “Engineering plastics from lignin. X. Enthalpy
relaxation of prepolymers,” J. Wood Chem.Technol. 4(3), 331-345.
Sahoo, S., Seydibeyoğlu, . Ö., ohanty, A. K., and isra, . (2 11).
“Characterization of industrial lignins for their utilization in future value added
applications,” Biomass Bioenerg. 35(10), 4230-4237.
Sarkar, S., and Adhikari, B. (2 1). “Jute felt composite from lignin modified phenolic
resin,” Polym. Comp. 22(4), 518-527.
Schmidl, G. W. (1992). “Molecular weight characterization and rheology of lignins for
carbon fibers," Ph.D. dissertation, University of Florida, USA.
Sun, R. R., Tomkinson, J. J., and Lloyd-Jones, G. (2 ). “Fractional characterization of
ash-AQ lignin by successive extraction with organic solvents from oil palm EFB
fibre,” Polym. Degrad. Stab. 68(1), 111-119.
Taherzadeh, M. J., and Karimi, K. (2008). “Pretreatment of lignocellulosic wastes to
improve ethanol and biogas production: A review,” Inter. J. Mol. Sci. 9(9), 16211651.
Tejado, A., Pena, C., Labidi, J., Echeverria, J. ., and ondragon, I. (2 7). “Physicochemical characterization of lignins from different sources for use in phenolformaldehyde resin synthesis,” Bioresource Technol. 98(8), 1655-1663.
Vishtal, A., and Kraslawski, A. (2 11). “Challenges in industrial application of technical
lignins,” BioResources 6(3), 3547-3568.
Wallberg, O., Jönsson, A.-S., and Wimmerstedt, R. (2003). “Fractionation and
concentration of kraft black liquor lignin with ultrafiltration,” Desalination 154(2),
187-199.
Zabaleta, A. T. (2012). “Lignin extraction, purification and depolymerization study,”
Ph.D. dissertation, Universidad del País Vasco/Euskal Herriko Unibertsitatea,
Donostia-San Sebastián, Spain.
Article submitted: September 25, 2013; Peer review completed: November 28, 2013;
Revised version received and accepted: December 6, 2013; Published: December 12,
2013.
Sameni et al. (2014). “Impurities in industrial lignins,”
BioResources 9(1), 725-737.
737
Download