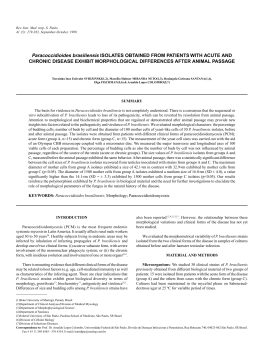
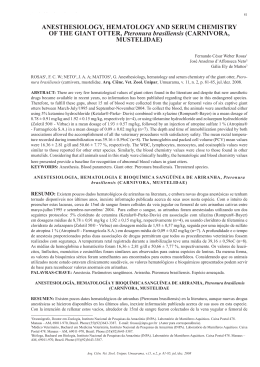
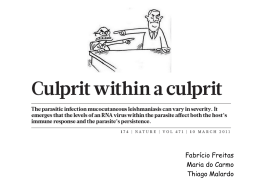
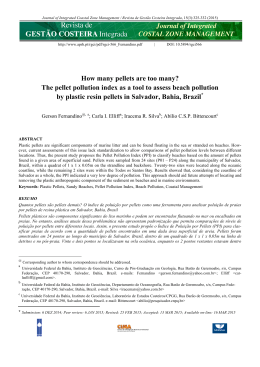
SCI. MAR., 67 (4): 393-402
SCIENTIA MARINA
2003
Composition, structure and zonation of intertidal
macroinfauna in relation to physical factors in microtidal
sandy beaches in Rio de Janeiro state, Brazil*
VALÉRIA GOMES VELOSO, CARLOS HENRIQUE SOARES CAETANO
and RICARDO SILVA CARDOSO
Laboratório de Dinâmica de Populações Marinhas, Departamento de Ciências Naturais, Universidade do Rio de Janeiro
(UNIRIO), Av. Pasteur, no 458, sala 411, Urca, Rio de Janeiro, RJ, Brasil. Cep 22.290-240.
E-mail: [email protected]
SUMMARY: The intertidal macroinfauna of fiftheen exposed sandy beaches located in Rio de Janeiro State was studied to
determine species richness, density, biomass and zonation. Morphodynamic influence on biological parameters is also evaluated in this paper. Dean’s morphodynamic index (Ω) ranged from reflective to intermediate values and mean grain size
ranged from fine to coarse sands. A total of 17 species were identified, with the crustaceans Emerita brasiliensis, Excirolana
braziliensis and Pseudorchestoidea brasiliensis being the most abundant species. Species richness had a significant positive
linear relationship with Ω values, swash period and slope, and a negative relationship with grain size. Significant positive
relationships were also observed for total density with the swash period and slope, total biomass with slope, density of
Emerita brasiliensis with swash period and slope and biomass of Emerita brasiliensis with slope. Zonation analysis showed
that two or three biological zones could be recognised, with the two-zone pattern being observed in most of the beaches.
This pattern consisted of a lower zone characterised by Emerita brasiliensis, Donax haleyanus and Hemipodus oliveri; and
an upper zone characterised by Excirolana braziliensis, Pseudorchestoidea brasiliensis and Phaleria testacea. The threezone pattern as a disruption of the general two-zone pattern and its formation was attributable to the variation in the distributions of P. brasilensis and E. braziliensis. Our results suggest that beach morphodynamics is the best predictor for the
variability of macroinfaunal community composition.
Key words: sandy beaches, macroinfauna, zonation, morphodynamics, Brazil.
RESUMEN: COMPOSICIÓN, ESTRUCTURA Y ZONACIÓN DE LA MACROINFAUNA INTERMAREAL EN RELACIÓN A FACTORES FÍSICOS EN
PLAYAS ARENOSAS MICROMAREALES EN EL ESTADO DE RIO DE JANEIRO, BRASIL. – La macroinfauna intermareal de quince playas
arenosas en el Estado de Rio de Janeiro fue estudiada con el objetivo de determinarse la riqueza de especies, la densidad, la
biomasa y la zonación. La influencia de la morfodinámica en los parámetros biológicos también fue evaluada en este trabajo.
El índice morfodinámico de Dean (Ω) fluctuó de reflectivo a valores intermediarios y el tamaño medio de los granos osciló
entre arenas finas a gruesas. Un total de 17 especies fueron identificadas, siendo los crustáceos Emerita brasiliensis, Excirolana braziliensis y Pseudorchestoidea brasiliensis las especies más abundantes. La riqueza de especies tuvo correlaciones lineales positivas con los valores de Ω, con el período y la pendiente de barrido y relación negativa con el tamaño de grano. Relaciones positivas significantes también se observaron para la densidad total con el período y la pendiente de barrido, la biomasa total con la pendiente, la densidad de Emerita brasiliensis con el período y la pendiente de barrido y la biomasa de Emerita
brasiliensis con la pendiente. Un análisis de la zonación mostró que 2 o 3 zonas biológicas pueden ser reconocidas, observándose un patrón de 2-zonas en la mayoría de las playas. Dicho patrón consistió de una zona inferior, caracterizada por Emerita brasiliensis, Donax haleyanus y Hemipodus oliveri; y una zona superior, caracterizada por Excirolana braziliensis, Pseudorchestoidea brasiliensis y Phaleria testacea. El patrón de 3-zonas fue un disturbio del patrón general de 2-zonas y su formación fue atribuida a variación en las distribuciones de P. brasilensis y E. braziliensis. Nuestros resultados sugieren que la
morfodinámica de playa es el mejor pronóstico de variabilidad en composición de la comunidad macroinfaunal.
Palabras clave: playas arenosas, macroinfauna, zonación, morfodinámica, Brasil.
*Received April 2, 2002. Accepted July 8, 2003.
MACROINFAUNA IN SANDY BEACHES AT RIO DE JANEIRO STATE 393
INTRODUCTION
Exposed sandy beaches are dynamic environments. Wave energy, tide amplitude, wind action,
grain size, slope and swash climate are the most
important factors in their physical characterization
(McLachlan, 1990; McArdle and McLachlan, 1992;
McLachlan et al., 1993). Interactions among these
factors generate morphodynamic gradients, with
reflective beaches with coarse sand, steep slope and
a narrow surf zone at one extreme, and dissipative
beaches with fine sand, a gentle slope and a wide
surf zone at the other (Short and Wright, 1983).
Because most species of beach macroinfauna show
high physiological plasticity, being able to live on
different types of beaches (Dugan et al., 1991, 1994;
Gómez and Defeo, 1999, Defeo et al. 2001), it is difficult to correlate differences between populations
and communities with environmental parameters.
Variations in macroinfaunal structure are more easily perceived between morphodynamically extreme
beaches: species richness, abundance and biomass
all tend to be highest in dissipative beaches
(McLachlan, 1990, 1996; Defeo et al., 1992;
Jaramillo and McLachlan, 1993; McLachlan et al.,
1993; Borzone et al., 1996).
Recent population studies have shown, however,
that population-level responses to variations in
beach morphodynamics may differ markedly from
community-level responses. Thus, the abundance
and biomass of a population may increase in the
more reflective beaches, that is, in the opposite
direction from the expected trend for the community, as observed for Pseudorchestoidea brasiliensis
(Gómez and Defeo, 1999). Defeo et al. (2001), testing the swash-exclusion hyphothesis in populations
of the mole crab Emerita brasiliensis, found no significant differences in most parameters of population and reproductive biology between dissipative
and reflective beaches.
Abiotic parameters also undergo remarkable
variations along the beach topographic profile, so
the interactions between these factors and the intrinsic features of each species determine biological
zonation in sandy beaches. The zonation thus
reflects the restriction of each species to a particular
section of an environmental gradient (Raffaelli et
al., 1991). Several general schemes of zonation have
been proposed. The most generally employed
schemes are that of Dahl (1952), which divides the
beach into three zones, the subterrestrial, midlittoral
and sublittoral fringes, based on the distribution of
394 V.G. VELOSO et al.
crustaceans; and that of Salvat (1964), based on
physical parameters, in which four zones of drying,
retention, resurgence and saturation are identified.
Generally, the schemes proposed so far are still the
focus of controversy.
The state of Rio de Janeiro in Brazil has an
extensive coastline, with sandy beaches that vary in
degree of wave exposure, grain size and beach slope,
but despite these differences harbour the same communities (Veloso et al., 1997; Veloso and Cardoso,
2001). This apparent similarity makes this an interesting region to test for the influence of environmental parameters on the populations and communities. In this study, 15 beaches were sampled during
winter and summer, aiming to (1) correlate the
species richness, density and biomass of their communities with the physical parameters; (2) verify
whether the most abundant species showed the same
responses to environmental variations, and (3)
analyse the patterns of macrofaunal zonation among
the beaches.
MATERIAL AND METHODS
Sampling and laboratory procedures
A total of 15 beaches located in the state of Rio
de Janeiro, Brazil, were selected for this study (Fig.
1): Restinga da Marambaia (MAR), Grumari
(GRU), Barra da Tijuca (BAT), Urca (URC), Itaipu
(ITA), Itaipuaçu (ACU), Jaconé (JAC), Restinga de
Massambaba (MAS), Foguete (FOG), Peró (PER),
Pecado (PEC), Formosa (FOR), Tucúns (TUC),
Unamar (UNA) and Carapebus (CAR).
The beaches MAR, GRU, BAT, URC, ITA, ACU,
JAC and MAS were sampled in winter 1996 and
summer 1997. The beaches FOG, PER, PEC, FOR,
TUC, UNA and CAR were sampled in winter and
summer 1998, during low spring tide. On each
beach, two transects were established from the lower
limit of the swash zone to 10 m above the drift line,
and 10 equally spaced sampling strata were marked:
the first below the swash line (N1 - 30 cm water
layer), the second last (N9) on the drift line, and the
last (N10) 10 m above the drift line. At each stratum,
2
5 samples were randomly taken with a 0.04 m (3 m
apart) quadrat to a depth of 25 cm. The collected
sediment was washed through a 0.71 mm sieve, and
the retained material was taken to the laboratory,
where the organisms were sorted by species, counted and fixed in 5% formaldehyde. In addition to the
FIG. 1. – Map showing the locations of the beaches studied. (1) - MAR, (2) - GRU, (3) - BAT, (4) - URC, (5) - ITA, (6) - ACU, (7) - JAC,
(8) - MAS, (9) - FOG, (10) - PER, (11) - PEC, (12) - FOR, (13) - TUC, (14) - UNA and (15) - CAR.
quadrats, qualitative samples were taken in the
supralittoral zone for ghost crabs, which were usually not sufficiently abundant to appear in the quantitative samples. These qualitative data were only
used to characterise the faunistic composition of the
beaches and were not included in the statistical
analysis. Biomass was determined by drying specimens at 70ºC for 24 h.
Physical characterization
Sediment samples for particle size analysis were
taken with a plastic corer of 3.5 cm diameter to a
depth of 10 cm at strata 10 (supra), 6 (middle) and 2
(waterline). Samples were oven-dried at 70°C and
passed through a series of sieves of –2.5, –2.0, –1.0,
0.0, 0.5, 1.0, 1.5, 2.0, 2.5, 3.0 and 4.0 phi (phi = – log2
mm) in order to determine mean particle size (Folk
and Ward, 1957). Results were expressed in mm.
The beach-face slope of each transect was measured by the height difference (Emery, 1961) between
the drift line and the waterline. Dean’s dimensionless
parameter (Ω) (Short and Wright, 1983) was calculated for each beach as a measure of its morphodynamic state: Ω = Hb / Ws . T, where Hb is the breaker height
in cm, Ws the sand settling velocity in cm s-1
(obtained from particle size and Gibbs et al., 1971)
and T the wave period in seconds.
Statistical analysis
Simple linear regressions were performed to
investigate the relationship between the species richness, density and biomass of the entire macroinfauna community and the most abundant species, and
the physical variables (mean grain size, intertidal
slope, wave height and period, swash period, Dean’s
parameter) (Zar, 1996). The Mann-Whitney nonparametric statistic was used to test temporal variations in density and biomass of macroinfauna and in
mean grain size for each beach (Zar, 1996).
The Kruskal-Wallis test was employed to examine for differences in the mean grain size and macrofauna density between beaches. Dunn’s multiple
comparisons test was used a posteriori to assess significant differences between beaches. Because of the
differences in season between samples, the beach
group MAR, GRU, BAT, URC, ITA, ACU, JAC and
MAS was analysed separately from the beach group
FOG, PER, PEC, FOR, TUC, UNA and CAR.
Cluster analysis was used to aid the interpretation
of zonation patterns. Abundance values were transformed to log (x+1), and similarity values were calculated between stations using the Bray-Curtis coefficient. Dendrograms were obtained from the dissimilarity matrix by Unweighted Pair-Group Matching Analysis (UPGMA). For simplicity, only repre-
MACROINFAUNA IN SANDY BEACHES AT RIO DE JANEIRO STATE 395
TABLE 1. – Kruskal-Wallis test. Relation between mean grain size of MAR, GRU, BAT, URC, ITA, ACU, JAC and MAS beaches and results
of Dunn’s test analysis undertaken as an a posteriori test of multiple comparisons to indicate statistical significance.
H = 57.36; p<0.0001
Dunn’s multiple comparisons test
MAR
Mean ranks
Non-significance
ITA
URC
MAS
GRU
BAT
JAC
ACU
7.66
25.78
29.75
48.00
49.71
49.75
66.83
78.25
______________________________
________________________________________________________
___________________________________________________________
TABLE 2. – Kruskal-Wallis test. Relation between mean grain size of de FOG, PER, PEC, FOR, TUC, UNA and CAR beaches and results of
Dunn’s test analysis undertaken as an a posteriori test of multiple comparisons to indicate statistical significance.
H = 16.19; p<0.05
PER
Mean ranks
Non-significance
Dunn’s multiple comparisons test
FOR
FOG
UNA
PEC
TUC
CAR
10.83
12.33
12.83
15.66
17.00
21.60
29.33
___________________________________________________________________________
__________________________________________________________________________
sentative dendrograms are presented. These representative dendrograms correspond to zonation patterns that are described in the following section.
RESULTS
ACU, JAC, FOG, PER, TUC, UNA and CAR to
intermediate values at BAT, MAR and MAS. The
beach of PEC showed intermediate values during
the winter and reflective ones in summer (Table 3).
The beaches did not show significant variations in
mean grain size between sampling periods (MannWhitney test; p>0.05).
Physical characterization
Biological characterisation
Significant differences were observed between
the beaches studied (Kruskal-Wallis test; Tables 1
and 2). The sediment was composed of medium
sand at URC, BAT, GRU, ITA (summer), MAS
(summer), UNA (winter), PEC, FOG (summer) and
PER; coarse sand was found at ACU, JAC, MAS
(winter), CAR, UNA (summer), TUC and FOG
(winter), and fine sand was found at MAR, ITA
(summer) and FOR (see Table 3). Dean’s parameter
ranged from reflective values at URC, GRU, ITA,
A total of 17 taxa were collected and identified
during this study, with 5 to 9 species present on each
beach. The highest species richness, density and biomass in both sampling periods were recorded at
MAR (Table 4). Crustaceans were the most abundant and frequent animals, represented by Emerita
brasiliensis, Lepidopa richmondi, Ocypode quadrata (Decapoda), Pseudorchestoidea brasiliensis
(Amphipoda), Excirolana armata, Excirolana
TABLE 3. – Physical characterisation of beaches studied. Data are expressed as mean values: ± standard deviation.
Physical variables
URC
BEACHES
JAC MAS CAR
UNA
PEC
Mean grain size (mm)
0.33 0.45 0.40 0.20 0.29 0.91 0.82 0.45 1.19
0.02 0.05 0.04 0.01 0.06 0.06 0.11 0.13 0.13
17.05 8.13 10.75 22.00 9.58 10.61 9.60 8.06 10.42
0.07 1.07 0.49 2.83 1.02 1.26 3.39 0.69 0.46
11.00 10.85 12.55 9.80 11.10 18.05 15.30 12.00 18.48
0.10 3.18 1.06 0.05 2.83 0.78 3.54 3.54 1.55
0.50 1.30 0.55 0.80 0.33 1.30 1.35 0.68 1.38
0.02 0.28 0.07 0.00 0.11 0.99 0.64 0.04 0.88
0.88 1.86 0.75 2.41 0.76 0.53 0.62 1.21 0.46
0.01 0.70 0.04 1.00 0.17 0.45 0.36 0.19 0.06
11.13 8.83 8.71 23.00 11.36 8.94 10.20 15.85 10.24
3.08 3.92 4.38 2.02 2.60 0.33 0.85 1.63 3.73
0.51
0.06
12.50
7.35
13.18
0.37
0.40
0.14
0.36
0.08
13.02
1.18
0.30 0.52 0.22 0.45 0.48
0.04 0.01 0.04 0.18 0.03
17.40 6.92 8.28 27.48 12.58
2.85 1.43 3.02 2.12 3.20
19.04 19.15 12.65 12.96 13.16
5.92 0.40 2.11 0.22 2.03
0.75 0.60 0.50 0.40 0.60
0.07 1.52 0.14 0.11 0.10
0.98 0.46 1.51 0.49 0.60
0.32 0.11 0.01 0.26 0.01
12.89 6.60 9.38 17.02 16.67
4.89 0.64 2.06 0.73 0.11
Swash period (sec.)
Wave period (sec.)
Wave height (m)
Dean's parameter
Intertidal slope (1/m)
396 V.G. VELOSO et al.
BAT GRU MAR
ITA
ACU
TUC
FOR
FOG PER
TABLE 4. – Density (individual m-2) and total biomass (dry weigth m-2) of macroinfauna at beaches studied. W – winter, S – summer.
Species
URC
Emerita brasiliensis
w
s
Lepidopa richmondi
w
s
Excirolana armata
w
s
Excirolana braziliensis
w
s
Macrochiridotea lilianea
w
s
Pseudorchestoidea brasiliensis w
s
Olivancillaria vesica vesica w
s
Hastula cinerea
w
s
Donax hanleyanus
w
s
Hemipodus olivieri
w
s
Dispio sp.
w
s
Euzonus furciferus
w
s
Scolelepis squamata
w
s
Polychaeta sp.
w
s
Phaleria testacea
w
s
Diptera larvae
w
s
Richness
w
s
Total biomass
w
s
BAT
32.5
462.2
GRU
MAR
ITA
0.5
9.3 478.8
12.8 193.0 6807.8
ACU
12.3
13.0
3.9
15.8
BEACHES
JAC MAS
2.5
55.0
41.5
737.0
CAR
UNA
760.3 327.0
11.4
0.8
PEC
563.7
34.0
TUC
FOR
FOG
PER
1.2
1.3
39.1
682.7 323.2
153.7
5.0
0.6
0.2
0.6
0.4
15.0 21.3
9.8
9.0
6.9
4.5
19.4 14.5
61.2 159.8
0.3
0.3
7.3
1.0
38.8
5.3
28.0
26.0
18.5
58.5
0.8
0.3
0.3
2.3
1.8
1.3
0.8
0.7
1.3
1.3
14.3
128.3
3.8
3.3
27.5
10.8
10.3
5.5
66.7
13.5
13.2
19.5
34.3
43.5
45.7
210.0
59.4
7.5
33.4
36.3
50.0
14.0
6.0
8.0
35.5
72.0
5.2
17.2
1.2
5.7
9.2
14.5
10.3
16.3
10.9
13.1
18.5
5.5
3.3
9.2
5.8
5.6
1.7
8.5
1.2
2.0
1.2
12.0
12.0
3.0
0.3
9.4
6.3
2.8
1.9
9.1
3.8
6.6
8.8
2.2
1.7
2.5
0.3
0.2
8.5
0.2
2.5
0.5
0.3
1.3
0.3
0.5
0.4
0.5
0.4
0.5
0.5
0.3
0.3
15.2
2.0
0.5
4.5
3.2
0.8
12.8
0.2
6.8
4.1
4.8
3.0
5.3
28.3
17.5
0.7
8
7
5
9
6
5
7
5
6
7
7
6
8
8
6
5
9
7
6
5
7
7
8
7
8
6
223.0 527.5 365.8 5409.9 1842.6 835.4 331.1 3355.1 6130.0 341.2 6715.0 239.0 134.3
793.8 1419.4 7937.5 17553.4 398.0 834.8 1745.1 13867.5 6533.6 363.6 709.6 435.9 764.7
6
9
8
8
753.8 5110.5
547.6 5105.1
braziliensis and Macrochiridotea lilianea (Isopoda).
The decapod Ocypode quadrata was only collected
by the qualitative samples and its occurrence was
registered at all beaches studied. Molluscs were represented by the gastropods Olivancillaria vesica
vesica and Hastula cinerea, and by the bivalve
Donax hanleyanus; and polychaetes by Hemipodus
olivieri, Scolelepis squamata, Euzonus furciferus
and Dispio sp. Insects were represented by the
coleopteran Phaleria testacea, and dipteran larvae.
The most abundant species were the crustaceans
Emerita brasiliensis, Pseudorchestoidea brasiliensis
and Excirolana braziliensis, contributing 97% of the
0.4
0.3
19.5
0.5
3.8
0.3
0.5
1.2
5.0
1.8
1.8
2.1
0.3
0.2
2.3
0.6
total density. In spite of their higher frequency, Phaleria testacea, Donax hanleyanus and Hemipodus
olivieri occurred in lower densities. No significant
differences in macroinfauna density and biomass
were observed between sampling periods at any of
these beaches (Mann-Whitney test; p>0.05).
The Kruskal-Wallis test for beaches MAR, GRU,
BAT, URC, ITA, ACU, JAC and MAS indicated the
existence of significant variations in macroinfauna
density between these beaches, the macroinfauna
density at ITA being significantly lower than at
MAR and MAS (Table 5). There were no significant
differences in macroinfaunal densities between
TABLE 5. – Kruskal-Wallis test. Relation between macrofauna density of beaches studied and results of Dunn’s test analysis undertaken as an
a posteriori test of multiple comparisons to indicate statistical significance.
H = 22.54; p<0.01
ITA
Mean ranks
Non-significance
ACU
JAC
Dunn’s multiple comparisons test
BAT
GRU
URC
MAS
MAR
16.25
20.12
27.00
29.75
31.75
38.87
46.87
48.50
_____________________________________________________________________
__________________________________________________________________________________
MACROINFAUNA IN SANDY BEACHES AT RIO DE JANEIRO STATE 397
TABLE 6. – Simple linear regression equations.
Characteristic
Intercept
Species richness
Grain size
Swash period
Dean’s parameter
Intertidal slope
Slope
r
n
6.89
3.94
5.27
4.25
- 1.86
0.15
0.66
0.12
- 0.37*
0.62***
0.37*
0.43*
30
30
30
30
- 832.66
- 841.75
100.17
96.39
0.42*
0.38*
30
30
Emerita brasiliensis density
Swash period
- 858.53
Intertidal slope
- 851.26
97.29
92.43
0.42*
0.37*
30
30
- 2562.20
419.58
0.46*
30
Emerita brasiliensis biomass
Intertidal slope
- 2549.50
386.77
0.46*
30
Total Density
Swash period
Intertidal slope
Total biomass
Intertidal slope
*p < 0.05, ***p < 0.001.
FOG, PER, PEC, FOR, TUC, UNA and CAR
(Kruskal-Wallis test; p>0.05).
Species richness showed a significant positive
linear relationship with Dean’s parameter, swash
period and slope, and a significant inverse linear
relationship with mean grain size. Macroinfauna
density was significantly and linearly related to
swash period and slope, while total biomass showed
a positive linear relation only with slope (Table 6).
At the population level, almost no significant
relationships were observed between the physical
parameters analysed and the density and biomass of
the three most abundant species. The exceptions
were the density of Emerita brasiliensis, which
showed a significant positive relationship with the
swash period and intertidal slope; and the biomass
of Emerita brasiliensis, which showed a significant
positive relationship with the intertidal slope.
FIG. 2. – Dendrograms illustrating the zonation patterns observed at the sandy beaches studied.
398 V.G. VELOSO et al.
FIG. 3. – Diagram illustrating the two-zone pattern of macroinfauna
zonation.
Zonation
FIG. 4. – Diagram illustrating the three-zone pattern of macroinfauna
zonation.
The analysis showed that a single pattern of
zonation could not be presented for the beaches
studied; rather, either two or three biological zones
could be recognised (see Figs. 2, 3 and 4). The twozone pattern consisted of a lower zone, characterised
by Emerita brasiliensis, Donax haleyanus and
Hemipodus oliveri; and an upper zone, characterised
by Excirolana braziliensis, Pseudorchestoidea
brasiliensis and Phaleria testacea (Fig. 3). This pattern was observed at most of the beaches (Table 7).
In the three-zone pattern, a lower zone, again characterised by Emerita brasiliensis, Donax haleyanus
and Hemipodus oliveri; a middle zone, characterised
by Excirolana braziliensis and Pseudorchestoidea
brasiliensis; and an upper zone, in which the
coleopteran Phaleria testacea was found alone or
associated with Excirolana braziliensis, were distinguished (Fig. 4). This pattern was observed at the
beaches BAT (winter and summer), MAR (winter
TABLE 7. – Number of zones formed in beaches studied in relation to grain size and intertidal slope. Beach slope – values < 1/10m are
considered steep while those > 1/10m are considered gentle. w – winter, s – summer.
Type of sediment
Coarse
Medium
Fine
Intertidal slope
Number of zones
steep
gentle
2
2
CAR (s); JAC (w); ACU (w, s); TUC (w; s)
JAC (s); UNA (s); MAS (w); CAR (w); FOG (w)
steep
2
3
2
3
GRU (w); PEC (w); URC (w)
BAT (w)
FOG (s); URC (s); ITA (s); PER (s); PER (w); UNA (w)
BAT (s); GRU (s); MAS (s); PEC (s);
2
3
ITA (w); FOR (w, s)
MAR (w, s)
gentle
steep
gentle
Beaches
MACROINFAUNA IN SANDY BEACHES AT RIO DE JANEIRO STATE 399
and summer), GRU (summer), MAS (summer) and
PEC (summer).
The beaches GRU, MAS and PEC varied in the
number of zones formed between sampling periods.
At these beaches, two zones in winter and three
zones in summer were recognisable. When we associated these variations with the variations in grain
size and intertidal slope, we observed that an
increase in the number of zones at GRU and PEC
was related to the gentler slope in summer at these
beaches; while at MAS, grain size seemed to be the
source of this variation. Also, coarse-sand beaches
always showed two zones, independently of changes
in beach slope (Table 7).
DISCUSSION
Grain size and wave/swash processes have been
widely reported as physical features controlling the
structure of macroinfauna communities (McLachlan,
1990; Defeo et al., 1992; McArdle and McLachlan,
1992; Borzone et al., 1996). Reflective beaches, typically with coarse sand and a steeper slope, have
impoverished communities dominated by crustaceans, because crustaceans bear the wave impact
better and possess greater mobility and ability to bury
themselves. On the other hand, the proportion of
polychaetes and molluscs increases towards the dissipative extreme (Eleftheriou and Nicholson, 1975;
McLachlan et al., 1981; Dexter, 1984).
In our study, species richness seemed to respond
directly to morphodynamic changes, being correlated with the majority of environmental parameters
analysed (mean grain size, swash period, Dean’s
parameter and intertidal slope). Total density was
only correlated with beach slope and swash period.
McLachlan (1990), relating spatial variation in
abundance of benthic macroinfauna to physical
parameters, found a better correlation of total abundance with Dean’s parameter. In contrast, Jaramillo
and McLachlan (1993) found that grain size was the
best predictor of variability in the abundance and
biomass of macroinfauna communities at Chilean
beaches. Borzone et al. (1996) also suggested that
sediment particle size is closely related to density.
However, in spite of the granulometric differences
observed between the beaches in our study, there
were no significant correlations between grain size
and density. The lack of a relationship between
Dean’s parameter and density may be explained by
the narrow morphodynamic spectrum of the beaches
400 V.G. VELOSO et al.
studied. On the other hand, these results (density vs.
intertidal slope and swash period) may be a consequence of the fact that Emerita brasiliensis alone
accounted for most of the macrofaunal abundance.
According to Bowman and Dolan (1985), beaches
with relatively flat slopes and longer swash periods
may provide more favourable conditions for filterfeeders. This proposal was supported by the finding
of significant correlations between density and biomass of E. brasiliensis, and these parameters. The
densities of Pseudorchestoidea brasiliensis and
Excirolana braziliensis showed no significant correlations with the parameters tested. Therefore, beach
morphodynamics seemed to influence community
composition more than the abundance and density of
the component populations.
Recently, certain investigators have pointed out
the difficulties in establishing major biological zones
of the intertidal zone (Raffaelli et al., 1991; Defeo et
al., 1992), and have suggested that the only applicable zonation scheme might be that of Brown and
McLachlan (1990). This scheme recognises two
zones: a higher shore assemblage of air-breathers,
below which all species are water-breathers. According to Gimenéz and Yannicelli (1997), two or three
zones could be distinguished on exposed microtidal
sandy beaches. Jaramillo et al. (1993) found an
increase in the number of zones on more dissipative
beaches. However, the beach MAR, characterised as
an intermediate morphodynamic type (gentle slope
and fine sand), showed three zones during both sampling periods, that is, the same pattern found on
reflective medium-sand beaches such GRU (summer) and PEC (summer) . Gimenéz and Yannicelli
(1997) also observed no increase in the number of
zones on dissipative beaches, but nevertheless suggested that beach width and slope are the most
important factors affecting the zonation pattern. The
only apparent relationship observed for the beaches
in our study was that coarse-sand beaches always
showed two zones, independently of variations in
slope (Table 7). This is probably related to the low
water-retention capacity of coarse sediments, which
limits the movements of their inhabitants to the wetter areas. The CAR beach, for example, changed in
slope from 1/7.60 m in winter to 1/12.87 m in summer, and still continued to show the formation of two
zones. Medium- and fine-sand beaches showed more
variability, with three zones being more frequent on
low-slope, medium-sand beaches. Thus, reflective
microtidal beaches appear to show a more stable pattern of two zones, one characterised by the water-
breathing animals of the swash zone, and the other
characterised by the air-breathers, as proposed by
Brown and McLachlan (1990). In the subaereal zone
there was constant dislocation of the organisms,
probably related to their search for wetter areas.
In this study, the formation of three zones was
attributable to the variation in the distributions of P.
brasilensis and E. braziliensis, which appeared
together in an intermediate zone, located between
the swash zone and the upper part of the beach, and
together with the coleopteran P. testacea. Defeo et
al. (1992) observed that P. brasiliensis and E.
braziliensis occupied not only the supralittoral zone
but also the upper part of the midlittoral zone of
Uruguayan beaches, in contrast to the observations
of Dahl (1952) and Escofet et al. (1979), in which
the talitrid amphipods dominated in the supralittoral
zone and cirolanid isopods were found just below, in
the midlittoral zone. The detritivores Excirolana
braziliensis, Pseudorchestoidea brasiliensis and
Phaleria testacea appear to migrate continually
along the entire midlittoral zone, occurring on some
beaches at the same levels (and thus only two zones
were recognised, one lower and one upper) and on
other beaches at separate levels (which resulted in
the recognition of an intermediate zone). According
to Brazeiro and Defeo (1996) and Giménez and Yannicelli (1997), species alter their distributions in
response to changes in the environment (mainly the
slope, position of the swash zone and width of the
beach), besides other factors such as competition
and availability of food, whose effects are still poorly studied. In the absence of P. brasiliensis and E.
braziliensis, the coleopteran P. testacea enlarges its
distribution along the entire midlittoral zone, as
observed by Veloso (pers. comm.) at two other
beaches of Rio de Janeiro, Ipanema and São Conrado. These results suggest that interspecies competition is occurring, and that this competition affects
the distribution pattern. Defeo et al. (1997) studied
the distribution of Excirolana armata and
Excirolana braziliensis, and observed that at beaches where these species cohabit, E. braziliensis
occurs in lower densities and in the upper part of the
midlittoral zone, above E. armata.
ACKNOWLEDGEMENTS
The authors express their deepest gratitude to
two anonymous reviewers for critical reading of and
valuable suggestions on the final manuscript.
Thanks also to Dr. J.W. Reid for English language
revision, to B.Sc. Elen Siqueira da Silva, to all participants in the field work and to Colonel Cardoso of
the CPRM (Campo de Provas da Marambaia) for
field support. This study was supported by FAPERJ
and CNPq.
REFERENCES
Borzone, C.A., J.R.B. Souza and A.G. Soares. – 1996. Morphodynamic influence on the structure of inter and subtidal macrofaunal communities of subtropical sandy beaches. Rev. Chil.
Hist. Nat., 69: 565-577.
Bowman, M.L. and R. Dolan. – 1985. The relationship of Emerita
talpoida to beach characteristics. J. Coast. Res., 1: 151-163.
Brazeiro, A. and O. Defeo. – 1996. Macroinfauna zonation in microtidal sandy beaches; is it possible to identify patterns in such variable environments? Estuar. Coast. Shelf Sci., 42: 523-536.
Brown, A.C. and A. McLachlan. – 1990. Ecology of Sandy Shores.
Elsevier, Amsterdam.
Dahl, E. – 1952. Some aspects of the ecology and zonation of the
fauna on sandy beaches. Oikos, 4: 1-27.
Defeo, O., A. Brazeiro, A. de Alava and G. Riestra. – 1997. Is sandy
beach macrofauna only physically controlled? Role of substrate
and competition in isopods. Estuar. Coast. Shelf Sci., 45: 453-462.
Defeo, O., J. Gómez and D. Lercari. – 2001. Testing the swash exclusion hypothesis in sandy beach populations: the mole crab Emerita brasiliensis in Uruguay. Mar. Ecol. Prog. Ser., 212: 159-170.
Defeo, O., E. Jaramillo and A. Lyonnet. – 1992. Community structure and intertidal zonation of the macroinfauna in the Atlantic
coast of Uruguay. J. Coast. Res., 8: 830-839.
Dexter, D. M. – 1984. Temporal and spatial variability in the community structure of the fauna for four sandy beaches in southeastern
New South Wales. Aust. J. Mar. Freshw. Res., 5: 663-672.
Dugan, J.E., D.M. Hubbard and A.M. Wenner. – 1994. Geographical variation in the life history of the sand crab Emerita analoga (Stimpson) on the California coast: relationships to environmental variables. J. Exp. Mar. Biol. Ecol., 118: 255-278.
Dugan, J.E., A. M. Wenner and D.M. Hubbard. – 1991. Geographical variation in the reprodutive biology of the sand crab Emerita analoga (Stimpson) on the California coast. J. Exp. Mar.
Biol. Ecol., 150: 63-81.
Eleftheriou, A. and M.D. Nicholson. – 1975. The effects of exposure on beaches fauna. Cah. Biol. Mar., 16: 685-710.
Emery, K.O. – 1961. A simple method of measuring beaches profiles. Limnol. Oceanogr., 6: 90-93.
Escofet, A., N. Gianuca, S. Maytia and V. Scarabino. – 1979.
Playas arenosas del Atlantico Sudoccidental entre los 29 y 43
LS: consideraciones generales y esquema biocenológico.
UNESCO Sem., Montevideo, Uruguay: 245-258.
Folk, R.L. and W.C. Ward. – 1957. Brazos River bar, a study in significance of grain size parameters. J. Sediment. Petrol., 27: 3-26.
Gibbs, R.J., M.D. Matthews and D.A. Link. – 1971. The relationship between sphere size and settling velocity. J. Sediment.
Petrol., 41: 7-18.
Giménez, L. and B. Yannicelli. – 1997. Variability of zonation patterns in temperate microtidal Uruguayan beaches with different
morphodynamic types. Mar. Ecol. Prog. Ser., 182: 209-220.
Gómez, J. and O. Defeo. – 1999. Life history of the sandhopper
Pseudorchestoidea brasiliensis (Amphipoda) in sandy beaches
with contrasting morphodynamics. Mar. Ecol. Prog. Ser., 182:
209-220.
Jaramillo, E. and A. McLachlan. – 1993. Community and population responses of the macroinfauna to physical factors over a
range of exposed sandy beaches in south-central Chile. Estuar.
Coast. Shelf Sci., 37: 615-624.
Jaramillo, E., A. McLachlan and P. Coetzee. – 1993. Intertidal zonation patterns of macrofauna over a range of exposed sandy beaches in south-central Chile. Mar. Ecol. Prog. Ser., 101: 105-118.
McArdle, S.B. and A. McLachlan. – 1992. Sand beach ecology:
swash features relevant to the macrofauna. J. Coast. Res., 8:
398-407.
MACROINFAUNA IN SANDY BEACHES AT RIO DE JANEIRO STATE 401
McLachlan, A. – 1990. Dissipative beaches and macrofauna communities on exposed intertidal sands. J. Coast. Res., 6: 57-71.
McLachlan, A. – 1996. Physical factors in benthic ecology: effects
of changing sand particle size on beach fauna. Mar. Ecol. Prog.
Ser., 131: 205-221.
McLachlan, A., T. Wooldrige, and A.H. Dye. – 1981. The ecology
of sandy beaches in southern Africa. South Afr. J. Zool., 16:
219-231.
McLachlan, A., E. Jaramillo, T.E. Donn and F. Wessels. – 1993.
Sandy beach macrofauna communities and their control by the
physical environment: a geographical comparison. J. Coast.
Res., 15 (Special Issue): 27-38.
Raffaelli, D., I. Karakassis and A. Galloway. – 1991. Zonation
schemes on sandy shores: a multivariate approach. J. Exp. Mar.
Biol. Ecol., 148: 241-253.
Salvat, B. – 1964. Les conditions hidrodynamiques intertitielles des
sédiment meubles intertidax et la repartition verticale de la
402 V.G. VELOSO et al.
jemme endogée. Academie des Sciences (Paris), Comptes Rendus, 259: 1576-1579.
Short, A.D. and L.D. Wright. – 1983. Physical variability of sandy
beaches. In: A. McLachlan and T. Erasmus (eds.), Sandy
Beaches as Ecosystems, pp. 133-144. Netherland: W. Junk Publishers.
Veloso, V.G. and R.S. Cardoso. – 2001. The effect of morphodynamics on the spatial and temporal variation of the macrofauna
of three sandy beaches on the Rio de Janeiro State, Brazil. J.
Mar. Biol. Ass. U.K., 81: 369-375.
Veloso, V.G., R.S. Cardoso and D.B. Fonseca. – 1997. Spatio-temporal characterization of intertidal macrofauna at Prainha beach
(Rio de Janeiro State). Oecologia brasiliensis, 3: 213-225.
Zar, J.H. – 1996. Bioestatistical analysis. 3rd ed. New Jersey: Prentice-Hall.
Scient. ed.: A. Palanques
Download