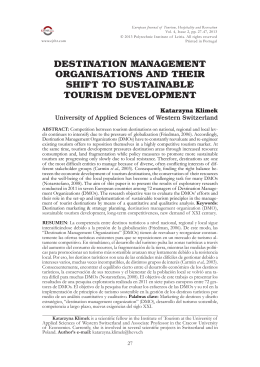
The Authority on World Travel & Tourism
Travel
& Tourism
Economic Impact 2012
WORLD
WTTC Travel & Tourism Economic Impact 2012
1
For more information please contact:
Olivia Ruggles-Brise
Director, Policy & Research
[email protected]
Eva Aimable
Manager, Policy & Research
[email protected]
© 2012 World Travel & Tourism Council
Foreword
For more than 20 years the World Travel & Tourism Council (WTTC)
has been investing in economic impact research, which assesses
the Travel & Tourism industry’s contribution to GDP and jobs. Our
ten-year forecasts are unique in the information they provide to
assist governments and private companies plan for the future.
Travel & Tourism continues to be one of the world’s largest industries. The total impact of the industry means
that, in 2011, it contributed 9% of global GDP, or a value of over US$6 trillion, and accounted for 255 million
jobs. Over the next ten years this industry is expected to grow by an average of 4% annually, taking it to
10% of global GDP, or some US$10 trillion. By 2022, it is anticipated that it will account for 328 million jobs,
or 1 in every 10 jobs on the planet.
2011 was one of the most challenging years ever experienced by the global Travel & Tourism industry. However, our latest research suggests that, despite political upheaval, economic uncertainty and natural
disasters, the industry’s direct contribution to world GDP grew by nearly 3% to US$2 trillion and directly
generated 1.2 million new jobs. This was supported by a 3% increase in visitor exports to US$1.2 trillion,
with almost 3% growth in capital investment, which rose to over US$0.7 trillion.
Moreover, while the macroeconomic environment remains very challenging, our latest projections point to
continuous growth in the contribution of Travel & Tourism to global GDP and employment. Rising household
incomes in emerging economies – not only the BRICs (Brazil, Russia, India and China) but increasingly across
the rest of Southeast Asia and Latin America – will continue to fuel increased leisure demand. Similarly,
growing international trade – particularly from emerging markets – will sustain business travel demand. In developed economies, consumers are likely to remain cautious, especially in European countries where
austerity programmes are being implemented.
This means that we expect growth in Travel & Tourism’s direct contribution to GDP to remain stable at 3% in
2012. We expect the industry to generate directly over 2 million new jobs, with a 2% increase in visitor exports
and 3.5% growth in investment over the year.
Rarely over the past 20 years have we been challenged by such economic and political uncertainty as we are
seeing now. Our ongoing research underlines the importance of Travel & Tourism as a stabilising force globally
– providing jobs, generating prosperity, and facilitating international trade and investment.
David Scowsill
President & CEO
World Travel & Tourism Council
Contents
The Economic Impact of Travel & Tourism 2012
2012 Annual Research: Key Facts........................................................................................................1
Defining the Economic Contribution of Travel & Tourism.............................2
Travel & Tourism’s Contribution to GDP......................................................................................3
Travel & Tourism’s Contribution to Employment. .........................................................4
Visitor Exports and Investment...................................................................................................................5
Different Components of Travel & Tourism.............................................................................6
Summary Tables: Estimates & Forecasts. ................................................................................7
The Economic Contribution of Travel & Tourism:
Real 2011 Prices. .................................................................................................................................................................8
The Economic Contribution of Travel & Tourism:
Nominal Prices.........................................................................................................................................................................9
The Economic Contribution of Travel & Tourism: Growth....................... 10
Glossary.......................................................................................................................................................................................... 11
Methodological Note. .............................................................................................................................................. 12
Regions, Sub-regions, Countries....................................................................................................... 13
USE OF MATERIAL IS AUTHORISED, PROVIDED SOURCE IS ACKNOWLEDGED
1-2 Queen Victoria Terrace, Sovereign Court, London E1W 3HA, UK
2 Tel: +44 (0) 20 7481 8007. Fax: +44 (0) 20 7488 1008. Email: [email protected]. www.wttc.org
World
2012 ANNUAL RESEARCH: KEY FACTS
2012
forecast
GDP: DIRECT CONTRIBUTION
The direct contribution of Travel & Tourism to GDP was USD1,972.8bn (2.8% of total GDP) in
2011, and is forecast to rise by 2.8% in 2012, and to rise by 4.2% pa, from 2012-2022, to
USD3,056.2bn in 2022 (in constant 2011 prices).
GDP: TOTAL CONTRIBUTION
The total contribution of Travel & Tourism to GDP was USD6,346.1bn (9.1% of GDP) in 2011,
and is forecast to rise by 2.8% in 2012, and to rise by 4.3% pa to USD9,939.5bn in 2022.
EMPLOYMENT: DIRECT CONTRIBUTION
In 2011 Travel & Tourism directly supported 98,031,500 jobs (3.3% of total employment). This
is expected to rise by 2.3% in 2012 and rise by 1.9% pa to 120,470,000 jobs (3.6% of total
employment) in 2022.
EMPLOYMENT: TOTAL CONTRIBUTION
In 2011, the total contribution of Travel & Tourism to employment, including jobs indirectly
supported by the industry, was 8.7% of total employment (254,941,000 jobs). This is expected
to rise by 2.0% in 2012 to 260,093,000 jobs and rise by 2.3% pa to 327,922,000 jobs in 2022
(9.8% of total).
VISITOR EXPORTS
Visitor exports generated USD1,170.6bn (5.3% of total exports) in 2011. This is forecast to
grow by 1.7% in 2012, and grow by 3.6% pa, from 2012-2022, to USD1,694.7bn in 2022 (4.3%
of total).
INVESTMENT
Travel & Tourism investment in 2011 was USD743.0bn, or 4.9% of total investment. It should
rise by 3.5% in 2012, and rise by 5.6% pa over the next ten years to USD1,320.4bn in 2022
(5.1% of total).
Total Contribution of
Travel & Tourism to GDP
Breakdown of Travel & Tourism's Total
Contribution to GDP and Employment 2011
GDP (2011 USDbn)
2011
2011USDbn
USDbn
12,000
1154
10,000
6,000
1973
98031
4,000
2,000
111020
45890
Employment
('000)
3212
8,000
Direct
Indirect
Induced
2022
2022
2012
2011
2010
2009
2008
2007
2006
2005
2004
2003
2002
0
= Total contribution of Travel & Tourism
WTTC Travel & Tourism Economic Impact 2012
1
Defining the economic
contribution of Travel & Tourism
Travel & Tourism is an important economic activity in most countries around the world. As well as its direct economic
impact, the industry has significant indirect and induced impacts. The UN Statistics Division-approved Tourism Satellite
Accounting methodology (TSA:RMF 2008) quantifies only the direct contribution of Travel & Tourism. But WTTC
recognises that Travel & Tourism's total contribution is much greater, and aims to capture its indirect and induced
impacts through its annual research.
DIRECT CONTRIBUTION
The direct contribution of Travel & Tourism to GDP reflects the ‘internal’ spending on Travel & Tourism (total spending
within a particular country on Travel & Tourism by residents and non-residents for business and leisure purposes) as
well as government 'individual' spending - spending by government on Travel & Tourism services directly linked to
visitors, such as cultural (eg museums) or recreational (eg national parks).
The direct contribution of Travel & Tourism to GDP is calculated to be consistent with the output, as expressed in
National Accounting, of tourism-characteristic sectors such as hotels, airlines, airports, travel agents and leisure
and recreation services that deal directly with tourists.The direct contribution of Travel & Tourism to GDP is calculated
from total internal spending by ‘netting out’ the purchases made by the different tourism sectors. This measure is
consistent with the definition of Tourism GDP, specified in the 2008 Tourism Satellite Account: Recommended
Methodological Framework (TSA: RMF 2008).
TOTAL CONTRIBUTION
The total contribution of Travel & Tourism includes its ‘wider impacts’ (ie the indirect and induced impacts) on the economy.
The ‘indirect’ contribution includes the GDP and jobs supported by:
● Travel & Tourism investment spending – an important aspect of both current and future activity that includes
investment activity such as the purchase of new aircraft and construction of new hotels;
● Government 'collective' spending, which helps Travel & Tourism activity in many different ways as it is made on
behalf of the ‘community at large’ – eg tourism marketing and promotion, aviation,
administration, security services, resort area security services, resort area sanitation services, etc;
● Domestic purchases of goods and services by the sectors dealing directly with tourists - including, for example,
purchases of food and cleaning services by hotels, of fuel and catering services by airlines, and IT services by
travel agents.
The ‘induced’ contribution measures the GDP and jobs supported by the spending of those who are directly or indirectly
employed by the Travel & Tourism industry.
PLEASE NOTE THAT DUE TO CHANGES IN METHODOLOGY BETWEEN 2010 AND 2011, IT IS NOT POSSIBLE TO COMPARE FIGURES
PUBLISHED BY WTTC FROM 2011 ONWARDS WITH THE SERIES PUBLISHED IN PREVIOUS YEARS.
2
WTTC Travel & Tourism Economic Impact 2012
Travel & Tourism's
1
contribution to GDP
The direct contribution of Travel & Tourism to GDP in 2011 was USD1,972.8bn (2.8% of GDP). This is forecast to
rise by 2.8% to USD2,028.2bn in 2012.This primarily reflects the economic activity generated by industries
such as hotels, travel agents, airlines and other passenger transportation services (excluding commuter
services). But it also includes, for example, the activities of the restaurant and leisure industries directly
supported by tourists.
The direct contribution of Travel & Tourism to GDP is expected to grow by 4.2% pa to USD3,056.2bn (3.0% of
GDP) by 2022.
WORLD: DIRECT CONTRIBUTION OF TRAVEL & TOURISM TO GDP
Constant 2011 USDbn
% of whole economy GDP
3.2
3,500
3.2
3,000
3.1
3.1
2,500
3.0
2,000
3.0
2.9
1,500
2.9
1,000
2.8
2.8
500
2.7
2022
2022
2012
2011
2010
2009
2008
2007
2006
2005
2004
2003
2.7
2002
2022
2022
2012
2011
2010
2009
2008
2007
2006
2005
2004
2003
2002
0
The total contribution of Travel & Tourism to GDP (including wider effects from investment, the supply chain and
induced income impacts, see page 2) was USD6,346.1bn in 2011 (9.1% of GDP) and is expected to grow by
2.8% to USD6,526.9bn (9.2% of GDP) in 2012.
It is forecast to rise by 4.3% pa to USD9,939.5bn by 2022 (9.8% of GDP).
WORLD: TOTAL CONTRIBUTION OF TRAVEL & TOURISM TO GDP
% of whole economy GDP
Constant 2011 USDbn
12,000
12.0
10,000
10.0
8,000
8.0
6,000
6.0
4,000
4.0
2,000
2.0
0
0.0
2011
Direct
1
Indirect
2012
Induced
2022
2022
2022
2011
Direct
2012
Indirect
2022
2022
Induced
All values are in constant 2011 prices & exchange rates
WTTC Travel & Tourism Economic Impact 2012
3
Travel & Tourism's
contribution to employment
Travel & Tourism generated 98,031,500 jobs directly in 2011 (3.3% of total employment) and this is forecast to
grow by 2.3% in 2012 to 100,292,000 (3.4% of total employment).
This includes employment by hotels, travel agents, airlines and other passenger transportation services
(excluding commuter services). It also includes, for example, the activities of the restaurant and leisure
industries directly supported by tourists.
By 2022, Travel & Tourism will account for 120,470,000 jobs directly, an increase of 1.9% pa over the next ten
years.
WORLD: DIRECT CONTRIBUTION OF TRAVEL & TOURISM TO EMPLOYMENT
'000 jobs
% of whole economy employment
3.7
140,000.0
3.7
120,000.0
3.6
3.6
100,000.0
3.5
80,000.0
3.5
3.4
60,000.0
3.4
40,000.0
3.3
3.3
20,000.0
3.2
0.0
The total contribution of Travel & Tourism to employment (including wider effects from investment, the supply
chain and induced income impacts, see page 2) was 254,941,000 jobs in 2011 (8.7% of total employment). This
is forecast to rise by 2.0% in 2012 to 260,093,000 jobs (8.7% of total employment).
By 2022, Travel & Tourism is forecast to support 327,922,000 jobs (9.8% of total employment), an increase of
2.3% pa over the period.
WORLD: TOTAL CONTRIBUTION OF TRAVEL & TOURISM TO EMPLOYMENT
% of whole economy employment
'000 jobs
350,000.0
12.0
300,000.0
10.0
250,000.0
8.0
200,000.0
6.0
150,000.0
4.0
100,000.0
2.0
50,000.0
0.0
0.0
2011
Direct
4
Indirect
2012
Induced
WTTC Travel & Tourism Economic Impact 2012
2022
2022
2022
2011
Direct
2012
Indirect
Induced
2022
2022
2022
2022
2012
2011
2010
2009
2008
2007
2006
2005
2004
2003
2002
2022
2022
2012
2011
2010
2009
2008
2007
2006
2005
2004
2003
2002
3.2
1
Visitor Exports and Investment
VISITOR EXPORTS
Visitor exports are a key component of the direct contribution of Travel & Tourism. In 2011,
the world generated USD1,170.6bn in visitor exports. In 2012, this is expected to grow by 1.7%, and the world is
expected to attract 997,674,000 international tourist arrivals.
By 2022, international tourist arrivals are forecast to total 1,390,790,000, generating expenditure of
USD1,694.7bn, an increase of 3.6% pa.
WORLD: VISITOR EXPORTS AND INTERNATIONAL TOURIST ARRIVALS
Constant 2011 USDbn
mn
Foreign visitor exports as % of total exports
1,800
1,600
8.0
1,600
1,400
7.0
1,400
1,200
6.0
1,200
1,000
1,000
5.0
800
600
3.0
400
400
200
200
2.0
0
1.0
2022
2022
Foreign tourist arrivals (RHS)
2022
2022
2012
2011
2010
2009
2008
2007
2006
Foreign visitor exports (LHS)
2005
0.0
2002
2012
2011
2010
2009
2008
2007
2006
2005
2004
2003
2002
0
2004
600
4.0
2003
800
INVESTMENT
Travel & Tourism is expected to have attracted capital investment of USD743.0bn in 2011. This is expected to
rise by 3.5% in 2012, and rise by 5.6% pa over the next ten years to USD1,320.4bn in 2022.
Travel & Tourism’s share of total national investment will rise from 4.8% in 2012 to 5.1% in 2022.
WORLD: CAPITAL INVESTMENT IN TRAVEL & TOURISM
% of whole economy GDP
Constant 2011 USDbn
1,400
6.0
1,200
5.0
1,000
4.0
800
3.0
600
2.0
400
1.0
1
2022
2022
2012
2011
2010
2009
2008
2007
2006
2005
2004
0.0
2003
2022
2022
2012
2011
2010
2009
2008
2007
2006
2005
2004
2003
2002
0
2002
200
All values are in constant 2011 prices & exchange rates
WTTC Travel & Tourism Economic Impact 2012
5
Different components of
Travel & Tourism1
World
Travel & Tourism's Contribution to GDP:
Leisure travel spending (inbound and domestic)
generated 76.0% of direct Travel & Tourism GDP
in 2011 (USD3,056.9bn) compared with 24.1% for
business travel spending (USD968.4bn).
Business vs Leisure, 2011
Leisure spending
76.0%
Leisure travel spending is expected to grow by
3.1% in 2012 to USD3,152.2bn, and rise by 4.4%
pa to USD4,853.8bn in 2022.
Business spending
24.1%
Business travel spending is expected to grow by
2.5% in 2012 to USD993.0bn, and rise by 4.0% pa
to USD1,476.2bn in 2022.
World
Travel & Tourism's Contribution to GDP:
Domestic vs Foreign, 2011
Domestic travel spending generated 70.5% of
direct Travel & Tourism GDP in 2011 compared
with 29.5% for visitor exports (ie foreign visitor
spending or international tourism receipts).
Foreign visitor spending
29.5%
Domestic travel spending is expected to grow by
3.5% in 2012 to USD2,889.6bn, and rise by 4.6%
pa to USD4,547.6bn in 2022.
Domestic spending
70.5%
Visitor exports are expected to grow by 1.7% in
2012 to USD1,190.8bn, and rise by 3.6% pa to
USD1,694.7bn in 2022.
World
Breakdown of Travel & Tourism's Total Contribution to GDP, 2011
Direct
31.1%
Induced
The total contribution of Travel & Tourism to
GDP is three times greater than its direct
contribution.
18.2%
Indirect
a
50.7%
Indirect is the sum of:
(a) Supply chain
33.2%
(b) Investment
c
9.8%
(c) Government collective
b
7.7%
1
6
The Travel & Tourism industry contributes to GDP
and employment in many ways as detailed on
page 2.
All values are in constant 2011 prices & exchange rates
WTTC Travel & Tourism Economic Impact 2012
Summary tables:
Estimates & Forecasts
2011
2022
2012
% of total
Growth2
USDbn
1
World
Direct contribution to GDP
1,972.8
2.8
2.8
3,056.2
3.0
4.2
Total contribution to GDP
6,346.1
9.1
2.8
9,939.5
9.8
4.3
98,031
3.3
2.3
120,470
3.6
1.9
Total contribution to employment
254,941
8.7
2.0
327,922
9.8
2.3
Visitor exports
1,170.6
5.3
1.7
1,694.7
4.3
3.6
Domestic spending
2,791.2
4.0
3.5
4,547.6
4.6
4.6
Leisure spending
3,056.9
4.4
3.1
4,853.8
4.8
4.4
Business spending
968.4
1.4
2.5
1,476.2
1.5
4.0
Capital investment
743.0
4.9
3.5
1,320.4
5.1
5.6
4
Direct contribution to employment
4
1
2011
1
USDbn
% of total
Growth
3
2011 constant prices & exchange rates; 22012 real growth adjusted for inflation (%); 32012-2022 annualised real growth adjusted for inflation (%); 4'000 jobs
WTTC Travel & Tourism Economic Impact 2012
7
The economic contribution of
Travel & Tourism: Real 2011 prices
World
(USDbn, real 2011 prices)
2006
2007
2008
2009
2010
2011
2012E
2022F
1.
Visitor exports
1,089.7
1,136.6
1,154.8
1,082.5
1,132.7
1,170.6
1,190.8
1,694.7
2.
Domestic expenditure
2,769.4
2,834.9
2,790.1
2,649.0
2,713.0
2,791.2
2,889.6
4,547.6
3,909.8
4,024.4
4,000.1
3,789.1
3,904.9
4,022.1
4,141.9
6,326.7
-1,998
-2,057
-2,079
-1,927
-1,989
-2,049
-2,114
-3,271
1,911.5
1,967.1
1,921.5
1,862.6
1,916.1
1,972.8
2,028.2
3,056.2
1,727
1,777
1,783
1,686
1,732
1,787
1,842
2,845
3.
Internal tourism consumption
(= 1 + 2 + government individual spending)
4.
Purchases by tourism providers,
including imported goods
(supply chain)
5.
Direct contribution of
Travel & Tourism to GDP
(= 3 + 4)
Other final impacts
(indirect & induced)
6.
Domestic supply chain
7.
Capital investment
690.5
753.9
803.0
729.4
722.5
743.0
769.3
1,320.4
8.
Government collective spending
348.0
362.8
378.1
395.6
405.9
413.2
421.3
576.8
9.
Imported goods from indirect spending
242
248
261
230
255
276
286
437
10. Induced
1,113
1,156
1,134
1,129
1,139
1,154
1,179
1,705
11. Total contribution of
Travel & Tourism to GDP
6,032
6,264
6,280
6,033
6,171
6,346
6,527
9,940
99,388
99,523
96,593
96,831
98,031
100,292
120,470
272,726
263,104
255,299
251,512
254,941
260,093
327,922
1,025
1,042
993
1,023
1,045
1,071
1,501
(= 5 + 6 + 7 + 8 + 9 + 10)
Employment impacts ('000)
12. Direct contribution of Travel & Tourism to 100,072
employment
13.
Total contribution of Travel & Tourism
265,479
to employment
Other indicators
14. Expenditure on outbound travel
8
WTTC Travel & Tourism Economic Impact 2012
973
The economic contribution of
Travel & Tourism: Nominal prices
World
(USDbn, nominal prices)
2006
2007
2008
2009
2010
2011
2012E
2022F
1.
Visitor exports
865
993
1,097
978
1,059
1,171
1,165
2,095
2.
Domestic expenditure
2,192
2,425
2,574
2,366
2,539
2,791
2,874
6,039
3,098
3,464
3,722
3,396
3,653
4,022
4,100
8,241
-1,579
-1,768
-1,929
-1,722
-1,859
-2,052
-2,097
-4,301
1,519
1,696
1,793
1,674
1,796
1,973
2,005
3,941
1,356
1,520
1,652
1,505
1,617
1,787
1,826
3,763
3.
Internal tourism consumption
(= 1 + 2 + government individual spending)
4.
Purchases by tourism providers,
including imported goods
(supply chain)
5.
Direct contribution of
Travel & Tourism to GDP
(= 3 + 4)
Other final impacts
(indirect & induced)
6.
Domestic supply chain
7.
Capital investment
542
638
737
647
675
743
765
1,733
8.
Government collective spending
281
315
353
359
381
413
416
728
9.
Imported goods from indirect spending
193
219
255
212
240
276
280
540
883
992
1,052
1,013
1,067
1,154
1,169
2,229
4,776
5,381
5,843
5,410
5,776
6,346
6,461
12,933
99,388
99,523
96,593
96,831
98,031
100,292
120,470
272,726
263,104
255,299
251,512
254,941
260,093
327,922
903
989
884
948
1,045
1,045
1,857
10. Induced
11. Total contribution of
Travel & Tourism to GDP
(= 5 + 6 + 7 + 8 + 9 + 10)
Employment impacts ('000)
12. Direct contribution of Travel & Tourism to 100,072
employment
13.
Total contribution of Travel & Tourism
265,479
to employment
Other indicators
785
14. Expenditure on outbound travel
*Concepts shown in this table align with the standard table totals as described in the 2008 Tourism Satellite Account: Recommended
Methodological Framework (TSA: RMF 2008) developed by the United Nations Statistical Division (UNSD), the Statistical Office
of the European Communities (EUROSTAT), the Organisation for Economic Co-operation and Development (OECD) and the World Tourism
Organization (UNWTO).
Historical data for concepts has been benchmarked to match reported TSA data where available.
WTTC Travel & Tourism Economic Impact 2012
9
The economic contribution of
Travel & Tourism: Growth
World
Growth 1 (%)
2006
2007
2008
2009
2010
2011
2012E
2022F
1.
Visitor exports
4.2
4.3
1.6
-6.3
4.6
3.3
1.7
3.6
2.
Domestic expenditure
4.3
2.4
-1.6
-5.1
2.4
2.9
3.5
4.6
4.2
2.9
-0.6
-5.3
3.1
3.0
3.0
4.3
4.6
3.0
0.9
-7.0
3.1
3.2
3.1
4.4
3.8
2.9
-2.3
-3.1
2.9
3.0
2.8
4.2
3.8
2.8
0.3
-5.4
2.7
3.1
3.1
4.4
3.
Internal tourism consumption
(= 1 + 2 + government individual spending)
4.
Purchases by tourism providers,
including imported goods
(supply chain)
5.
Direct contribution of
Travel & Tourism to GDP
(= 3 + 4)
Other final impacts
(indirect & induced)
6.
Domestic supply chain
7.
Capital investment
8.4
9.2
6.5
-9.2
-0.9
2.8
3.5
5.6
8.
Government collective spending
3.5
4.2
4.2
4.6
2.6
1.8
2.0
3.2
9.
Imported goods from indirect spending
5.6
6.0
1.8
0.4
-2.7
2.3
3.8
5.7
10. Induced
2.6
3.9
-1.9
-0.4
0.9
1.3
2.2
3.8
11. Total contribution of
Travel & Tourism to GDP
4.1
3.8
0.3
-3.9
2.3
2.8
2.8
4.3
3.9
-0.7
0.1
-2.9
0.2
1.2
2.3
1.9
3.3
2.7
-3.5
-3.0
-1.5
1.4
2.0
2.3
2.8
5.3
1.6
-4.7
3.1
2.1
2.5
3.4
(= 5 + 6 + 7 + 8 + 9 + 10)
Employment impacts ('000)
12. Direct contribution of Travel & Tourism to
employment
13.
Total contribution of Travel & Tourism
to employment
Other indicators
14. Expenditure on outbound travel
1
2005-2011 real annual growth adjusted for inflation (%);
10
WTTC Travel & Tourism Economic Impact 2012
2
2011-2021 annualised real growth adjusted for inflation (%)
Glossary
Key Definitions
Internal tourism consumption – total revenue generated
Travel & Tourism – relates to the activity of travellers on
within a country by industries that deal directly with
trips outside their usual environment with a duration of less
tourists including visitor exports, domestic spending and
than one year. Economic activity related to all aspects of
government individual spending. This does not include
such trips is measured within the research.
spending abroad by residents. This is consistent with
Direct contribution to GDP – GDP generated by
industries that deal directly with tourists, including hotels,
total internal tourism expenditure in table 4 of the TSA:
RMF 2008.
travel agents, airlines and other passenger transport
Business Travel & Tourism spending – spending
services, as well as the activities of restaurant and leisure
on business travel within a country by residents and
industries that deal directly with tourists. It is equivalent to
international visitors.
total internal Travel & Tourism spending (see below) within
Leisure Travel & Tourism spending – spending on leisure
a country less the purchases made by those industries
travel within a country by residents and international visitors.
(including imports). In terms of the UN’s Tourism Satellite
Account methodology it is consistent with total GDP
Indirect and Induced Impacts
calculated in table 6 of the TSA: RMF 2008.
Indirect contribution – the contribution to GDP and
Direct contribution to employment – the number
jobs of the following three factors:
of direct jobs within the Travel & Tourism industry. This is
• Capital investment – includes capital investment spending
consistent with total employment calculated in table 7 of the
by all sectors directly involved in the Travel & Tourism
TSA: RMF 2008.
industry. This also constitutes investment spending by other
Total contribution to GDP – GDP generated directly by
industries on specific tourism assets such as new visitor
the Travel & Tourism industry plus its indirect and induced
accommodation and passenger transport equipment, as
impacts (see below). Total contribution to employment –
well as restaurants and leisure facilities for specific tourism
the number of jobs generated directly in the Travel &
use. This is consistent with total tourism gross fixed capital
Tourism industry plus the indirect and induced contributions
(see below).
formation in table 8 of the TSA: RMF 2008.
• Government collective spending – general government
spending in support of general tourism activity. This can
Direct Spending Impacts
include national as well as regional and local government
Visitor exports – spending within the country by international
spending. For example, it includes tourism promotion, visitor
tourists for both business and leisure trips, including
information services, administrative services and other public
spending on transport. This is consistent with total inbound
services. This is consistent with total collective tourism
tourism expenditure in table 1 of the TSA: RMF 2008.
consumption in table 9 of TSA: RMF 2008.
Domestic Travel & Tourism spending – spending within
a country by that country’s residents for both business and
leisure trips. Multi-use consumer durables are not included
• Supply-chain effects – purchases of domestic goods
and services directly by different sectors of the Travel &
Tourism industry as inputs to their final tourism output.
since they are not purchased solely for tourism purposes.
Induced contribution – the broader contribution to
This is consistent with total domestic tourism expenditure
GDP and employment of spending by those who are
in table 2 of the TSA: RMF 2008. Outbound spending by
directly or indirectly employed by Travel & Tourism.
residents abroad is not included here, but is separately
Other Indicators
identified according to the TSA: RMF 2008 (see below).
Outbound expenditure – spending outside the country by
Government individual spending – government spending
residents on all trips abroad. This is fully aligned with total
on individual non-market services for which beneficiaries
outbound tourism expenditure in table 3 of the TSA:
can be separately identified. These social transfers are
RMF 2008.
directly comparable to consumer spending and, in certain
cases, may represent public provision of consumer
services. For example, it includes provision of services in
national parks and museums.
Foreign visitor arrivals – the number of arrivals of foreign
visitors, including same-day and overnight visitors (tourists)
to the country.
WTTC Travel & Tourism Economic Impact 2012
11
Methodological note
In 2011, WTTC refined its methodology for estimating the direct contribution of Travel & Tourism to be
fully consistent with the UN Statistics Division-approved 2008 Tourism Satellite Account: Recommended
Methodological Framework (TSA:RMF 2008). Some further revisions to the research have been made
in 2012 as part of WTTC’s ongoing commitment to align the research with the TSA:RMF 2008. This has
involved further benchmarking of country reports to official, published TSAs, including for countries which
are reporting data for the first time as well as updates to earlier years. As part of the alignment process we
are now also able to isolate and exclude international travel flows related to education.
In addition to 181 individual country reports, one world report and 17 covering world regions and
sub-regions, we also provide reports with combined results for special economic groupings including,
for the first time in 2012, the G20 and SADC.
Special economic groups
G20
Argentina, Australia, Brazil, Canada, China, European Union, France, Germany, India, Indonesia,
Italy, Japan, Mexico, Russia, Saudi Arabia, South Africa, South Korea,Turkey, UK, USA.
SADC (Southern African Development Community)
Angola, Botswana, Democratic Republic of Congo (DRC), Lesotho, Madagascar, Malawi, Mauritius,
Mozambique, Namibia, Seychelles, South Africa, Swaziland, United Republic of Tanzania, Zambia,
Zimbabwe.
BRIC
Brazil, Russia, India, China.
APEC (Asia-Pacific Economic Cooperation)
Australia, Brunei, Canada, Chile, China, Hong Kong, Indonesia, Japan, South Korea, Malaysia,
Mexico, New Zealand, Papua New Guinea, Peru, Philippines, Russian Federation, Singapore,
Taiwan, Thailand, USA, Vietnam.
OECD (Organisation for Economic Co-operation and Development)
Australia, Austria, Belgium, Canada, Czech Republic, Denmark, Finland, France, Germany, Greece,
Hungary, Iceland, Ireland, Italy, Japan, South Korea, Luxembourg, Mexico, Netherlands,
New Zealand, Norway, Poland, Portugal, Slovakia, Spain, Sweden, Switzerland, Turkey, UK, USA.
12
WTTC Travel & Tourism Economic Impact 2012
Economic impact reports:
Regions, sub-regions and countries
WORLD
Algeria
Anguilla
Egypt
Antigua &
Barbuda
Libya
Aruba
Morocco
Bahamas
Tunisia
Barbados
Angola
Bermuda
Benin
Caribbean
China
Luxembourg
Hong Kong
Malta
South Korea
Macau
Taiwan
Netherlands
Poland
Portugal
Romania
Slovakia
Slovenia
Fiji
Spain
Kiribati
Sweden
Other Oceania
UK
Guadeloupe
Solomon Islands
Albania
Chad
Haiti
Tonga
Armenia
Democratic
Republic of Congo
Martinique
Jamaica
Puerto Rico
Gabon
St Kitts & Nevis
Ghana
St Vincent & the
Grenadines
Guinea
St Lucia
Americas
Gambia
Bangladesh
South Asia
Ethiopia
Vanuatu
Asia
Comoros
Azerbaijan
Belarus
Bosnia
Herzegovina
India
Nepal
Croatia
Pakistan
Other Europe
Central African
Republic
Grenada
Country
Lithuania
Europe
Cape Verde
Dominican
Republic
Subregion
Japan
New Zealand
Dominica
Cameroon
Region
Australia
Former
Netherlands
Antilles
Burundi
Country
Mongolia
Cuba
Burkina Faso
Sri Lanka
Trinidad &
Tobago
Maldives
US Virgin Islands
Cambodia
Iceland
Kazakhstan
Kyrgyzstan
Brunei
Lesotho
Argentina
Indonesia
Montenegro
Madagascar
Belize
Laos
Norway
Mali
Brazil
Myanmar
Serbia
Malawi
Bolivia
Chile
Mozambique
Colombia
Namibia
Niger
Nigeria
Republic of Congo
Reunion
Rwanda
Latin America
Mauritius
Sao Tome &
Principe
Costa Rica
Malaysia
Papua New
Guinea
Philippines
Turkey
Thailand
Bahrain
Austria
Israel
Ecuador
Vietnam
Guyana
Belgium
Guatemala
Honduras
Bulgaria
Cyprus
Panama
Czech Republic
Sierra Leone
Peru
Paraguay
South Africa
Suriname
Sudan
Uruguay
Swaziland
Tanzania
Togo
Uganda
Zambia
Zimbabwe
Venezuela
Canada
Mexico
USA
European Union
Nicaragua
Senegal
Seychelles
Moldova
Switzerland
Singapore
El Salvador
Macedonia
Russia
Denmark
Estonia
Finland
France
Germany
Greece
Ukraine
Iran
Jordan
Middle East
Kenya
SouthEast Asia
UK Virgin Islands
Ivory Coast
North
America
SUB-SAHARAN
Subregion
Cayman Islands
Botswana
Africa
Region
European Union
Subregion Country
NORTHEAST Asia
Region
Oceania
Country
Europe
Subregion
North Africa
Region
Kuwait
Lebanon
Oman
Qatar
Saudi Arabia
Syria
UAE
Yemen
Hungary
Ireland
Italy
Latvia
WTTC Travel & Tourism Economic Impact 2012
13
The World Travel & Tourism Council
is the forum for business leaders in the
Travel & Tourism industry.
With the Chairs and Chief Executives of the 100 foremost Travel & Tourism companies as its
Members, WTTC has a unique mandate and overview on all matters related to Travel & Tourism.
WTTC works to raise awareness of Travel & Tourism as one of the world’s largest industries,
supporting some 255 million jobs and generating 9% of global GDP in 2011.
Together with its research partner, Oxford Economics, WTTC produces comprehensive reports
on an annual basis – with updates whenever required – to quantify, compare and forecast the
economic impact of Travel & Tourism on 181 economies around the world. It also publishes a
World report highlighting global trends, as well as reports on regions, sub-regions and special
economic groupings.
To download one-page summaries, the full reports or spreadsheets, visit www.wttc.org
Assisting WTTC to provide tools for analysis,
benchmarking, forecasting and planning.
Over the last 30 years Oxford Economics has built a diverse and loyal client base of over 300
organisations worldwide, including international organisations, governments, central banks,
and both large and small businesses. Headquartered in Oxford, England, with offices in
London, Belfast, Paris, the UAE, Singapore, Philadelphia, New York and San Francisco,
Oxford Economics employs over 70 full-time, highly qualified economists and data specialists,
while maintaining links with a network of economists in universities worldwide.
For more information please take advantage of a free trial on our website,
www.oxfordeconomics.com, or contact John Gaster, Oxford Economics, Abbey House,
121 St Aldates, Oxford, OX1 1HB, UK.
Tel: +44 (0) 1865 268 900; email: [email protected]
14
WTTC Travel & Tourism Economic Impact 2012
CHAIRMAN
ABERCROMBIE & KENT
Geoffrey J W Kent
Founder, Chairman & CEO
PRESIDENT & CEO
WORLD TRAVEL &
TOURISM COUNCIL
OUTRIGGER ENTERPRISES
GROUP
DOLPHIN CAPITAL
INVESTORS
RIOFORTE INVESTMENTS SA
DUBAILAND
Dr Richard R Kelley
Chairman Emeritus
Manuel Fernando Espírito Santo
Chairman
SABRE HOLDINGS
David Scowsill
Tom Klein
President
VICE CHAIRMEN
SHUN TAK HOLDINGS
GLOBAL LEISURE PARTNERS
Mark Harms
Chairman & CEO
MANDARIN ORIENTAL
Edouard Ettedgui
Group Chief Executive
SILVERSEA CRUISES
Manfredi Lefebvre d’Ovidio di
Balsorano de Clunieres
Chairman
THE TRAVEL CORPORATION
Brett Tollman
President & Chief Executive
TUI AG
Dr Michael Frenzel
Chairman of the Executive Board
Pansy Ho
Managing Director
TRAVEL GUARD WORLDWIDE
Jeffrey C Rutledge
Chairman & CEO
TRAVELPORT
Gordon Wilson
President & CEO
TSOGO SUN GROUP
Jabu Mabuza
Deputy Chairman
VISITBRITAIN
Christopher Rodrigues, CBE
Chairman
GLOBAL MEMBERS
WORLD TRAVEL & TOURISM
COUNCIL
ALTOUR
Jean-Claude Baumgarten
Alexandre Chemla
President
WYNDHAM WORLDWIDE
AMADEUS IT GROUP SA
Stephen P Holmes
Chairman & CEO
EXECUTIVE COMMITTEE
ACCOR
Denis Hennequin
Chairman & CEO
AMERICAN EXPRESS
COMPANY
William Glenn
President, Global Merchant
Network Group
BEIJING TOURISM GROUP
Qiang Duan
Chairman
BHARAT HOTELS
Jyotsna Suri
Chairperson & Managing Director
CARLSON
Hubert Joly
President, CEO & Director
EMIRATES
Gary Chapman
President Group Services &
Dnata, Emirates Group
ETIHAD AIRWAYS
James Hogan
CEO
HILTON WORLDWIDE
Christopher J Nassetta
President & CEO
INTERCONTINENTAL HOTELS
GROUP PLC
Richard Solomons
Chief Executive
Luis Maroto
President & CEO
Jose Antonio Tazón
Chairman of the Board
AVIS BUDGET GROUP
Ronald L Nelson
Chairman & CEO
BEIJING CAPITAL
INTERNATIONAL AIRPORT CO
Zhiyi Dong
Chairman
Guanghui Zhang
President & CEO
BEIJING TOURISM GROUP
Yi Liu
President
Sebastián Escarrer
Vice Chairman
EAST JAPAN RAILWAY
COMPANY
Satoshi Seino
President & CEO
EXPEDIA INC
Dara Khosrowshahi
President & CEO
FAIRMONT RAFFLES HOTELS
INTERNATIONAL
Chris J Cahill
COO
GLOBAL BLUE GROUP
Per Setterberg
President & CEO
HERTZ CORPORATION
Mark Frissora
Chairman & CEO, Hertz
Corporation
Michel Taride
President, Hertz International &
Executive Vice President, Hertz
Corporation
HNA GROUP
Feng Chen
Chairman of the Board
HOGG ROBINSON GROUP
David Radcliffe
Chief Executive
MGM RESORTS
INTERNATIONAL
Jim Murren
CEO
MISSION HILLS GROUP
Ted J Balestreri
Chairman & CEO
CHINA INTERNATIONAL
TRAVEL SERVICE, HEAD
OFFICE (CITS)
Rong Chen
CEO
Jean Gabriel Pérès
President & CEO
NH HOTELS
Mariano Pérez Claver
Chairman
ORBITZ WORLDWIDE
Barney Harford
CEO
PAN PACIFIC HOTEL GROUP
Patrick Imbardelli
President & CEO
PHOCUSWRIGHT
Philip C Wolf
President & CEO
QUNAR
Chenchao Zhuang
Co-Founder & CEO
RADISSON EDWARDIAN
HOTELS
Jasminder Singh
Chairman & CEO
REED TRAVEL EXHIBITIONS
Richard Mortimore
Managing Director
Jaume Tàpies
President
HOTELPLAN HOLDING
R TAUCK & PARTNERS
Hans Lerch
Vice Chairman & CEO
Robin Tauck
President
HUANGSHAN TOURISM
GROUP
S-GROUP CAPITAL
MANAGEMENT
CHOICE HOTELS
INTERNATIONAL
Stephen P Joyce
President & CEO
COSTA CRUISES
Pier Luigi Foschi
Chairman & CEO
CTRIP.COM INTERNATIONAL
Khalid A bin Sulayem
Director General
DIAMOND RESORTS
Stephen J Cloobeck
Chairman & CEO
DLA PIPER
Sir Nigel Knowles
Co-CEO
RK Krishna Kumar
Vice Chairman
JONES LANG LASALLE
HOTELS
Arthur de Haast
Global CEO
JTB CORP
Hiromi Tagawa
President & CEO
LEBUA HOTELS & RESORTS
CO LTD
Rattawadee Bualert
President
Deepak Ohri
CEO
LOEWS HOTELS
Jonathan M Tisch
Chairman & CEO
LOS ANGELES WORLD
AIRPORTS
Gina Marie Lindsey
Executive Director
Andy Payne
CEO
ZAGAT SURVEY LLC
Tim Zagat
Co-Founder, Co-Chair & CEO
Adam Weissenberg
Global Segment Lead - Travel
Hospitality and Leisure
RELAIS & CHÂTEAUX
INDIAN HOTELS COMPANY LTD
WILDERNESS SAFARIS
MÖVENPICK HOTELS &
RESORTS
Clement Kwok
CEO & MD
Marty Salfen
General Manager, Global Travel &
Transportation Industry
Matthew D Upchurch CTC
CEO
INDUSTRY PARTNERS
HONG KONG & SHANGHAI
HOTELS
IBM
VIRTUOSO
Dr Ken Chu
Chairman & CEO
Vladimir Yakushev
Managing Partner
CANNERY ROW COMPANY
MARRIOTT INTERNATIONAL
MELIÁ HOTELS
INTERNATIONAL
Paul Denis Griffiths
CEO
Raimund Hosch
President & CEO
HYATT HOTELS CORPORATION SHANGRI-LA
INTERNATIONAL HOTEL
Mark S Hoplamazian
MANAGEMENT
President and CEO
Giorgio Boscolo
CEO
DEPARTMENT OF TOURISM &
COMMERCE MARKETING,
GOVERNMENT OF DUBAI
Arne M Sorenson
President & CEO
DUBAI AIRPORTS
INTERNATIONAL
MESSE BERLIN GMBH
Jiwei Xu
Chairman
Min Fan
CEO
JW Marriott, Jr
Chairman & CEO
Mohammed Al Habbai
CEO
Dong-Bin Shin
Chairman
BOSCOLO GROUP
JUMEIRAH GROUP
Gerald Lawless
Executive Chairman
Miltos Kambourides
Managing Partner
LOTTE
Greg Dogan
President & CEO
SOUTH AFRICAN AIRWAYS
Sizakele Mzimela
CEO
SPENCER STUART
Jerry Noonan
Co-leader, Global Hospitality &
Leisure Practice
STARWOOD HOTELS &
RESORTS WORLDWIDE, INC
Frits D van Paasschen
President & CEO
TAJ HOTELS RESORTS &
PALACES
Raymond Bickson
Managing Director & CEO
TAP PORTUGAL
Fernando Pinto
CEO
TRANSAERO AIRLINES
Alexander Pleshakov
CEO
UNITED AIRLINES
Jeff Smisek
President & CEO
Jim Compton
Executive Vice President & CEO
DELOITTE
REGIONAL MEMBERS
DOURO AZUL
Mario Ferreira
CEO
HONORARY MEMBERS
ACCOR
Gérard Pélisson
Co-Chairman, Supervisory Board
AMERICAN EXPRESS
COMPANY
Jonathan S Linen
Adviser to Chairman
ANDRÉ JORDAN GROUP
André Jordan
Chairman
FT MOORE P/L
Sir Frank Moore, AO
Chairman
THE HERTZ CORPORATION
Frank Olsen
Retired Chairman of the Board
NOMURA INTERNATIONAL
Lord Colin Marshall of
Knightsbridge
Chairman
TZ ASSOCIATES
Tommaso Zanzotto
President
UNIVERSAL MEDIA
Carl Ruderman
Chairman
CHAIRMAN EMERITUS
RRE VENTURES
James D Robinson III
General Partner
WTTC Chairman (1990-1994)
IMMEDIATE PAST
CHAIRMAN
GLOBAL ALLIANCE ADVISORS
LLC
Vincent A Wolfington
Chairman
WTTC Chairman (2004-2007)
FORMER CHAIRMEN
INTERCONTINENTAL HOTELS
GROUP PLC
Sir Ian Prosser
Retired Chairman
WTTC Chairman (2001-2003)
AIG INC
Harvey Golub
Non-Executive Chairman
WTTC Chairman (1996-2001)
ROBERT H BURNS HOLDINGS
LTD
Robert H Burns
Chairman
WTTC Chairman (1994-1996)
1-2 Queen Victoria Terrace,
Sovereign Court,
London E1W 3HA
United Kingdom
Telephone: +44 (0) 20 7481 8007
Fax: +44 (0) 20 7488 1008
Email: [email protected]
www.wttc.org
Download