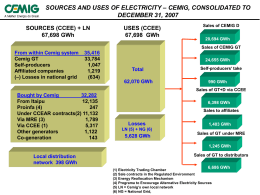
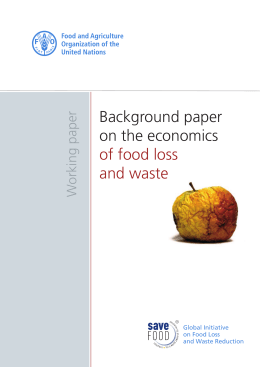
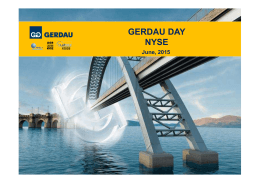
Corporate Presentation January 2013 Light Holdings Light S.A. (Holding) 100% Light Serviços de Eletricidade S.A. 100% 51% 100% Light Energia S.A. Lightger S.A. Itaocara Energia Ltda. Renova Energia S.A. Central Eólica Fontainha Ltda. Central Eólica São Judas Tadeu Ltda. 21.99% 100% 100% 25.5% Amazônia Energia S.A. Norte Energia S.A. 9.77% 100% Light Esco Prestação de Serviços S.A. 100% Lightcom Comercializadora de Energia S.A. 100% Light Soluções em Eletricidade Ltda. 51% 100% Instituto Light Axxiom Soluções Tecnológicas S.A. 20% CR Zongshen E-Power Fabricadora de Veículos Ltda. EBL Cia de Eficiência Energética S.A 33% Guanhães Energia S.A. 51% Distribution 100% Generation Commercialization and Service Institutional System Electric Vehicles 2 Rankings Among the largest players in Brazil Integrated Net Revenues 2011 – R$ Billion Distribution Energy Consumption in Concession Area (2011) - GWh1 54.590 15.8 50.404 45.101 12.8 9.8 7.8 6.2 29.139 5.4 25.593 22.932 Cemig CPFL Neoenergia Copel Light Energias do Brasil CPFL Cemig Eletropaulo Neoenergia Copel Light2 Generation Private-owned Companies Installed Hydro-generation Capacity (MW) – 2011 6.908 2.654 2.241 2.210 1.828 866 Tractebel Souce: Companies reports Note: 1 – Captive market + free clients 2 – It doesn’t consider the consumption of CSN and CSA AES Tiete Duke Energy CPFL Energias do Brasil Light 3 Shareholders Structure BTG PACTUAL SANTANDER 14.29% Indirect stake in blue 2.74% 28.57% 5.50% FIP REDENTOR 75% 5.50% BANCO DO BRASIL 19.23% 11 Board members: 8 from the controlling group, 2 independents e 1 employees nominated A qualifying quorum of 7 members to approve relevant proposals such as: M&A and dividend policy CEMIG 28.57% VOTORANTIM 6.41% 25% 28.57% 5.50% PARATI MINORITY SHAREHOLDERS 3.20% 25.64%* 96.80% 0.42% REDENTOR ENERGIA 100% CEMIG 26.06% 13.03% 100% FIP LUCE 100% 13.03% Controlling Shareholders 52.1% 13.03% NATIONAL 57.02% 13.03% LEPSA RME FOREIGN BNDESPAR 13.46% 42.98% MARKET 34.41% Free Float 47.9% Light S.A. (Holding) Percentage in blue: indirect stake in Light *12.61% (RME) + 13.03%(LEPSA) 4 Corporate Governance General Assembly Fiscal Council Board of Directors Finances Committee Human Resources Committee Governance and Sustainability Committee Auditors Committee Management Committee Chief Executive Officer Paulo Roberto R. Pinto Chief Financial and Investor Relations Officer Chief Distribution Officer Chief Energy Officer Chief HR Officer João B. Zolini Carneiro José Humberto Castro Evandro L. Vasconcelos Andreia Ribeiro Junqueira Chief Legal Officer Corporate Management Officer Chief Business Officer Chief Communications Officer Fernando Antônio F.Reis Paulo Carvalho Filho Evandro L. Vasconcelos* Luiz Otavio Ziza Valadares Interim* LGSXY ADR-OTC 5 Distribution Business 6th largest energy distribution company in Brazil (2011) LIGHT • 4.0 million clients (serving 10 million people) • Energy sales (2011) – 22.932 GWh • 70% of the consumption of Rio de Janeiro state (Brazil’s 2nd GDP) 6 Energy Consumption Distribution ELECTRICITY CONSUMPTION¹ TOTAL MARKET (GWh) - Quarter +3.2% +3.5% 4.989 5.144 5.299 5.486 OTHERS 15% 21.7ºC 3T09 3Q09 3T09 22.1ºC 22.4ºC 21.7ºC 3T10 3T11 3T12 3Q10 3T10 3Q11 3T11 3Q12 3T12 FREE 15% INDUSTRIAL 7% Série1 COMMERCIAL 30% RESIDENTIAL 33% ¹ Note: To preserve comparability in the market approved by ANEEL in the tariff adjustment process. the billed energy of the free customers Valesul, CSN and CSA were excluded in view of these customers’ planned migration to the Basic Network. 7 Total Market ELECTRICITY CONSUMPTION (GWh) TOTAL MARKET – 3rd QUARTER +3.5% 5.486 5.299 840 740 -4.3% 1.882 +13.3% 1.801 +1.7% 1.595 155 968 541 3T11 3Q11 3T12 3Q12 RESIDENTIAL 180 984 614 427 370 3T11 3Q12 3Q11 1.807 3T12 INDUSTRIAL 1.440 3T11 3Q11 1.627 3T12 3Q12 COMMERCIAL CAPTIVE +4.6% 854 894 45 47 810 847 3T11 3Q12 3Q11 4.645 4.559 3T12 OTHERS 3T11 3Q11 3T12 3Q12 TOTAL FREE 8 Prospects for State of Rio Investments of R$ 211.5 billion in the State of Rio de Janeiro¹ Period 2012-2014 Tourism R$ 1.8 bn 0.9% Others R$ 1.9 bn 0.9% Olimpic Facilities R$ 8.6 bn 4.1% Oil R$ 107.7 bn 50.9% Transformation Industry R$ 40.5 bn 19.1% Infrastructure R$ 51.0 bn 24.1% ¹Source: Firjan (Industry Federation of Rio de Janeiro) 9 Economic activity leading to more demand The State of Rio de Janeiro will attract $ 250 billion as investments by 2016 ¹ -Coquepar (42MW) -Procter & Gamble (10MW) -Alpargatas (ND) -RHI (5MW) -Lavazza (3MW) -Ajebras (5MW) -Reluz (ND) -Embelleze (5MW) -MRS (ND) -Nestlé (3MW) -AMBEV (ND) -NeoBus (10MW) -Petrobras (15MW) -CSN (100MW) -Gerdau (30MW) -Usiminas (20MW) -LLX (40MW) -Base Naval(25MW) -Hotel Comfort (3MW) -Gerdau (90MW) -Shop.CampoGde(3MW) - Rolls Royce (3MW) ¹Source: Associação Brasileira de Municípios – ABM website. Centro Tecnológico Fundão (ND) Rio de Janeiro -Bio Manguinhos (ND) -Hermes (3MW) -Votorantin (ND) -Ongoing (ND) -Bunge (ND) -AMBEV (2MW) -GE (6MW) -Shop. Metropolitano (10MW) -Maracanã (ND) -Porto Maravilha (ND) -Morar Carioca (ND) -Aeroporto Tom Jobim (5MW) -Estaleiro Inhauma (ND) -Atento (2MW) -Expansão Nova América (4MW) -Expansão Norteshopping (3MW) -Shopping Village Mall (7MW) - Edifício Tishman Speyer (5MW) - Expansão Via Parque (2MW) - Casa Granado (3.5MW) - Hospital São Lucas (4MW) - Metrô Ipanema (8MW) - Flow Serve (11MW) - Alog Data Center (12MW) 10 Collection COLLECTION RATE BY SEGMENT QUARTER 97.7% 97.8% TOTAL Total 93.0% 96.3% RETAIL Varejo 102.2% 99.7% 3T11 99.8% 97.2% LARGE CLIENTS Grandes Clientes 3Q11 106.2% COLLECTION RATE 12 MONTHS PUBLIC SECTOR Poder Público set-11 set/09' Sep/11 98.3% set-12 set/10' Sep/12 3Q12 3T12 11 Loss prevention LOSS (12 MONTHS) 43.1% 42.2% 40.7% 40.4% 7.627 7.582 41.2% 33.8% 7.665 7.839 8.047 5.229 5.247 5.316 5.457 5.615 2.328 2.335 2.349 2.381 2.432 Reflects exclusion of long term delinquent customers from the billing system, according to Resolution 414 by Aneel. Non Technical Losses Distribution (5.615 GWh) 63% 37% 1 2 Sep/11 jun/11 Dec/11 set/11 Mar/12 dez/11 Non-technical losses GWh % Non-technical losses/ LV Market Jun/12 mar/12 Sep/12 jun/12 Technical losses GWh % Non-technical losses / LV Market - Regulatory 1Risky 2Area 1 2Non-Risky Area 12 Loss prevention Reflects exclusion of long term delinquent customers from the billing system, according to Resolution 414 by Aneel. LOSS (12 MONTHS) 42.7% 42.4% 42.1% 41.8% 41.6% 41.3% 40.7% 40.4% 41.2% 42.2% 43.1% 33.8% 7.504 7.549 7.544 7.493 7,543 7,619 7,627 7,582 7,665 7,838 8,047 5,313 5,352 5,330 5,278 5,312 5,326 5,229 5,247 5,316 5,457 5,615 2,191 2,197 2,214 2,215 2,231 2,293 2,328 2,335 2,349 2,381 2,432 Mar/10 mar/10 Jun/10 jun/10 Sep/10 set/10 Dec/10 dez/10 Mar/11 mar/11 Jun/11 jun/11 Sep/11 set/11 Dec/11 dez/11 Mar/12 mar/12 Jun/12 jun/12 Sep/12 set/12 Non-technical losses GWh % Non-technical Perdas NT/BT % losses/ LV Market Technical losses GWh % Non-technical losses / LV Market - Regulatory 13 ,6% 41,3% Loss prevention 40,7% 41,2% 40,4% Reflects exclusion of long term delinquent customers from the billing system, according to Resolution 414 by Aneel. LOSS (12 MONTHS) 42.7% 42.4% 42.1% 41.8% 41.6% 41.3% 40.7% 40.4% 41.2% 42.2% 43.1% 33.8% 7.504 7.549 7.544 7.493 7,543 7,619 7,627 7,582 7,665 7,838 Non Technical Losses Distribution (5.615 GWh) 8,047 63% 5,313 5,352 5,330 5,278 5,312 5,326 5,229 5,247 5,316 5,457 5,615 2,191 2,197 2,214 2,215 2,231 2,293 2,328 2,335 2,349 2,381 2,432 mar/10 Mar/10 jun/10 Jun/10 set/10 Sep/10 dez/10 Dec/10 mar/11 Mar/11 jun/11 Jun/11 Non-technical losses GWh % Non-technical Perdas NT/BT % losses/ LV Market 37% 2 1Risky2Area 1 set/11 Sep/11 dez/11 Dec/11 mar/12 Mar/12 jun/12 Jun/12 1 Non-Risky Area 2 set/12 Sep/12 Technical losses GWh % Non-technical losses / LV Market - Regulatory 14 New Technology Program Light aims to reduce losses through investments in new technologies, integration of operational activities, increase of public awareness and institutional partnerships with interested agents. Grid shielding projects Technology used in regions in which conventional measures are not effective Areas that present high levels of non-technical losses Control room Actual grid Shielded grid Medium voltage Centralized meter Medium voltage 3m 9m Low voltage Low voltage Mechanical Meter Display 15 New Technology Program Meters Installed (Thousands) 283 208 38 38 245 110 38 Monitoring, reading, cutting and reconnection of customers telemetry– MCC (Measuring Center Centralized) Prioritization in areas of high losses and aggressiveness to the network Technology hindering interference in networks inappropriate 170 72 2010 2010 2011 2011 2012 Sep /12 INDIVIDUAL CENTRALIZED (ITRON) (LANDIS GYR. CAM and ELSTER) 16 New Technology Results - Individual Losses (before): 26% Losses (current): 7% 17 New Technology Results - Centralized Losses (before): 48% Losses (current): 14% 18 Zero Losses Area Area: Nova Cidade Neighborhood - Nilópolis FEATURES LV MV TOTAL 10,083 3 10,086 NETWORK (KM.) 50 23 73 TRANSFORMER (QTY.) 107 POWER (MVA) 12,9 CLIENTS RESULTS 2010 2011 COLLECTION (R$ MN) NON-TECHNICAL LOSSES 8.9 41.7% ¹ 10.3 7.4% ² ¹ Nov/10 ² DeC/11 19 Program Gains – An example NEW METER INSTALLATION REAL CONSUMPTION 300 kWh ENERGY SAVED 100 kWh LOST ENERGY 200 kWh BILLED CONSUMPTION INCREASE BILLED CONSUMPTION 100 kWh 100 kWh OTHER EFFECTS (BY-PRODUCTS): CAPEX GOES TO THE RAB BAD DEBT PROVISION REDUCTION OPERATIONAL COSTS REDUCTION 20 Transformation of risky areas 21 Pacified Communities Santa Marta Before After Clients 73 1.605 Losses 90% 6% Delinquency 70% 2% Alemão Batan Macacos 64.7 thousand clients inside pacified communities with new meters and network Andaraí Salgueiro Formiga S. Marta Cidade de Deus Borel e Casabranca Tabaj. e Cabr. Mang. e Babil. Cantag. e Pavãoz. 22 Generation Business Installed Capacity Installed Capacity 868 MW 51% 100% SHP Paracambi 13 MW Paraiba do Sul River Lajes Complex 100% HPP Ilha dos Pombos HPP Ilha dos Pombos 187 MW RJ SP HPP Santa Branca HPP Santa Branca 56 MW 100% HPP Fontes Nova 132 MW 100% HPP Underground Nilo Peçanha - 380 MW 100% HPP Pereira Passos 100 MW 24 Re-pricing of existing energy Conventional Energy Balance Assured energy (MW average) 553 25 53 539 25 52 535 25 535 25 535 25 535 25 535 25 535 25 535 25 535 25 206 228 259 267 272 282 282 282 282 251 243 238 228 228 228 2015 2016 2017 2018 2019 2020 2021 340 475 304 122 2012 Average sale price to free market (R$/MWh)¹ 2013 Energia contratada (ACR) 128 135 2014 Energia contratada (ACL) 148 Contracted Energy (Regulated)² ¹Database january. 2012 ² Average price to Regulated Market (dec/11): R$ 75/MWh 151 155 Recursos disponíveis para comercialização 157 Contracted Energy (Free) 157 157 Available Energy Hedge 157 157 Hedge 25 Generation Expansion Paraiba do Sul River Lajes Complex RJ SP HPP Itaocara Installed Capacity: 151 MW The construction is to be started by the end of 2012. Commercial Operational Start: 2nd half of 2015. Preliminary License already issued. SHP Lajes Installed Capacity: 17 MW The construction is to be started by the 2nd half of 2012. Operational Start: 2nd half of 2014; Installation License already issued. 26 Renova By the middle of 2011, Light signed an investment agreement of $360 million and the PPA (Power Purchased Agreement) of 400MW of installed capacity to have 25.9% stake at Renova. This year BNDESPAR is becoming a shareholder after a capital increase in Renova. Light keeps a 21.99% stake. Shareholder Structure Auctions Performance December 2012 FIP Santa FIP Caixa Barbara Outros; Ambiental 6.1% 4.0% Santander 7.1% 3.0% InfraBrasil 15.2% BNDESPAR RR 12.1% Participações(1) 8.5% RR Participações 21.99% Light 21.99% Location Wind Farms Inventory (SHPs) Basic Projects (SHPs) Controlling Shareholders 64.6% CS Light 32.3% CS 0% PS RR Participações 32.3% CS 0% PS The biggest winner in the Reserver Energy Auction of 2009 The biggest winner in the Reserver Energy Auction of 2010 2nd largest winner in the Auction A-3 of 2011 Company’s Portfolio 41.8 MW of SHPs in operation under the PROINFA contract 294.4 MW of wind energy under construction to start the operation in Jul/2012 808.3 MW of contracted wind energy to be delivered between 2013 until 2017 Pipeline 5.8 GW under development Projects in the same area providing synergies and scale gains (1) Share of RR Participacoes SA out of the control block 27 Installed Capacity (MW) Average Load Factor (%) Estimated Energy (MW average) CAPEX/MW installed (R$ MN) Loan Tariff (R$/MW) Term (years) 20 Operation Startup (Estimated) 3 Index SHPP Sites Contract Renova – Contracts IGPM In operation since 2008 41.8 61.3 24.2 4.901 BNB Contracted 182.06 293.6 50.8 148.9 (*) 3.996 BNDES Contracted 160.65 LER 2009 14 20 IPCA In operation since Jul 2012 LER 2010 6 20 IPCA Sep – 2013 162.0 52.7 86.8 (*) 3.878 BNDES Eligibility 130.76 Y-3 2011 9 19 years and 10 months IPCA Mar 2014 212.8 50.5 108.1 (*) 3.245 BNDES Eligibility 100.91 Y-5 2012 1 20 IPCA Jan – 2017 22.4 - - - - 90.07 PPA Light 1 10 (E) 20 IPCA Sep 2015 200.0 50.5(E) 100 (E) 3.245 - - PPA Light 2 10 (E) 20 IPCA Sep 2016 200.0 50.5 (E) 100 (E) 3.245 - - * Does not considered the network basic losses . 28 Belo Monte Overview Technical data on the concession: Norte Energia S.A. – Shareholders Profile Amazônia Energia 9,77% Concession period – 35 years End of concession – August 25, 2045 Self prod. 10,00% Technical data on the project: Others privates 30,25% Public sector 49,98% Installed capacity - 11.233 MW – Main engine room – 11.000 MW – Auxiliary engine room – 233 MW Assured Energy (Average MW) – 4.571 MW Reservoir – 516 Km² Flooded area/generation ratio of 0.05 Km²/MW 5.000 families affected Estimated project cost (April 2010) – R$ 25.8 billion Other Informations: 51.0% CS 0.0% PS 49.0% CS 100.0% PS 74.5% of total stock 25.5% of total stock Amazônia Energia Participações S.A – Construction works estimated to take 9 years. – Transaction does not affect Light ‘s dividend flow BNDES loan ensures leverage at low cost on favorable terms. – 9.77% Norte Energia S.A (Belo Monte) Amazônia Energia will own 9.77% of the enterprise. Tender 30 years, fixed installments. 85% of items financiable. PSI line. Amazônia Energia’s equity in the project estimated at R$ 150 million (Apr. 2010), to be disbursed over 6 years. Expansion of generation portfolio: – Increases Light’s total generation portfolio by 280 MW Terms for sale of electricity generated already set. − Regulated Market: 70%; Free Market: 20%; Self-producers: 10%. 29 Guanhães TOTAL CAPEX R$ Million PCH Installed Capacity (MW) Assured Energy (MW average) ANEEL Authorization Operation - Start up Authorization Term 269.2 Dores de Guanhães Senhora do Pôrto Jacaré Fortuna II Total 14 12 9 9 44 8 6.77 5.15 5.11 25.03 11/22/2002 10/08/2002 Dec/13 Dec/13 Equity 60.2 57.8 Light Energia Cemig GT 10/29/2002 12/21/2001 Feb/14 Oct/13 Debt 151.2 BNDES 30 years (with renewal for 20 years) 30 New Generation Projects Investments in Renova. Belo Monte and Guanhães. in line with our strategy da Geração (MW) of growing in the generationExpansão business Installed Capacity (MW) + 59.3% 280 22 1.500 171 855 Installed Installed Capacity Capacity 13 74* SHP (+) SHP (+) Renova Paracambi¹ (+) Renova² Paracambi ¹ Considering 51% stake 942 9 Current current Capacity (+)SHP Lajes capacity Lajes¹ 77 HPP (+) Itaocara (+) Renova Itaocara¹ (+) Renova² (+) (+)Belo Belo Monte³ Monte Capacity (+) CapacityAfter (+) Guanhães¹ Expansion Guanhães After Expansion ² Considering 21.9% stake ³ Considering 2.5% stake * 9 MW SHP + 65 MW Wind Farm (since jul/12) 31 Results Net Revenue NET REVENUE BY SEGMENT (3Q12)* Generation 6.8% NET REVENUE (R$MM) Comercialization 5.3% Distribution 87.9%** +6.2% 5.450.2 5.129.7 +5.5% * Eliminations not considered ** Construction revenue not considered 1.748.0 1.657.1 170.3 230.6 470.0 556.9 8.9% 4.572.8 4.980.2 NET REVENUE FROM DISTRIBUTION (3Q12) 10.6% 1.426.5 2T11 3Q11 1.577.7 2T12 3Q12 Others (Captive) 13.1% 1S11 9M11 1S12 9M12 Industrial 7.6% Network Use (TUSD) 10.3% (Free + Concessionaires) Construction Revenue Revenue w/out construction revenue Commercial 30.1% Residential 38.9% 33 Operating Costs and Expenses DISTRIBUTION MANAGEABLE COSTS (R$MN) -2.3% COSTS (R$MN)* 3Q12 974.0 951.8 -4.0% Manageable (distribution): R$ 300.2 (21.0%) Não gerenciáveis; 1.053,0; 71,18% Non manageable 312.5 2T12 300.2 Gerenciáveis; 321,8; 21,75% (distribution): R$ 1.003.1 (70.1%) Generation and Commercialization: R$ 127.4 (8.9%) * Eliminations not considered Geração e Comercialização ; 104,5; 7,07% R$ MN 2T12 3Q12 2T11 3Q11 1S11 9M11 1S12 9M12 3Q11 3Q12 Var % 9M11 9M12 Var % PMSO 149.0 178.5 19.8% 496.9 516.0 3.8% Provisions 83.0 52.3 -36.9% 242.6 222.9 -8.1% PCLD 72.2 39.3 -45.5% 216.0 173.2 -19.8% Contingencies 10.8 13.0 20.4% 26.6 49.7 87.1% Depreciation 80.6 69.3 -14.0% 234.5 212.9 -9.2% Total 312.5 300.2 -4.0% 974.0 951.8 -2.3% 34 EBITDA EBITDA BY SEGMENT* 3Q12 CONSOLIDATED EBITDA (R$MN) +4.8% 915.5 959.1 Distribution 67.9% Generation 29.5% (EBITDA Margin: 72.1%) Geração; 87,2; 33,41% (EBITDA Margin: 12.9%) Distribuição ; 166,2; 63,68% +12.4% 239.8 2T12 269.5 Comercialização Commercialization 2.6% ; 7,6; 2,91% (EBITDA Margin: 8.1%) 2T11 3Q11 2T12 3Q12 1S11 9M11 1S12 9M12 *Eliminations not considered 35 EBITDA EBITDA – 9M11/9M12 (R$ MN) +18.9% +4.8% 407 194 971 55 916 (350) EBITDA Ajustado Adjusted 2T11 EBITDA 9M11 Ativos e Passivos Regulatory Regulatórios Assets and Liabilities EBITDA 2T11 EBITDA 9M11 Receita Líquida Net Revenue 959 Provisões EBITDA 2T12 (34) Custos Não Custos Gerenciáveis Gerenciáveis NonManagable (PMSO) Managable Costs 20 1.154 Costs (PMSO) Provisions EBITDA 9M12 Ativos e EBITDA Passivos Ajustado Regulatory Regulatórios Adjusted 2T12 Assets and Liabilities EBITDA 9M12 36 Net Income NET INCOME – 9M11/9M12 (R$ MN) Lucro Líquido - 1S11/1S12 R$ Milhões 128 246 36 210 44 11 33 Taxes Impostos Others Outros 392 264 (34) LLAdjusted Ajustado - Regulatory Ativos e Net Assets and 9M12 passivos Regulatórios Income Liabilities 9M11 9M11 9M11 EBITDA EBITDA Financial Resultado Financeiro Result 9M12 9M12 Adjusted Regulatory Ativos e LL Ajustado Net passivos 9M12 Assets and Regulatórios Income Liabilities 9M12 37 Dividends DIVIDENDS AND DIVIDEND YIELD PAYOUT AND DIVIDEND POLICY Dividend Yield 16.2% 12.4% 11.6% 9.5% 795 554 Payout 8.7% 100% 100% 100% 76.3% 595 97.2% 81.0% 556 87 439 50% 87 469 2008 2008 2008 2009 2009 2009 Dividends (R$ MN) 2010 2010 2010 2011 2011 2011 352 2012 2012 2012 Interest on Equity (R$ MN) •Based on the closing price of the day before the announcement 2007 2007 Dividend Yield* 2008 2008 2009 2009* Payout 2010 2010 2011 2011 9M12 9M12 Dividend Policy •Based on Net Income of the year. before IFRS adjustments Note: Profit Reserve existing in the Balance of 12/31/2011: R$ 163 million. 38 Indebtedness leverage Net Debt¹ (R$ MM) and Net Debt / EBITDA Investment Grade (brA) Rating (brA + ) Rating (Aa2.br) Rating (AA-(bra)) Dec/11 3.383 1.947 1.580 1.637 3.622 2.8 2.7 1.1 1.2 1.2 2008 2009 2010 2008 2008 2009 2009 DL/EBITDA 2010 2010 Net Debt ¹ Net debt = total debt (excludes pension fund liabilities) – cash 2011 2012 2011 2011 mar/12 Sep/12 Net Debt/ EBITDA 39 Indebtedness 3T10 2007 NET DEBT AMORTIZATION SCHEDULE* (R$ MN) 3.621.6 Average Term: 3.7 years 3.143.5 832 2.5 jan/11 Sep/11 9M09 198 jan/12 Sep/12 9M10 2012 2013 2012 2012 Net Debt / EBITDA 2013 2013 2014 2015 2014 2014 2016 2015 2015 Após 2016 2016 2016 After 2016 Após 2016 * Principal only Others 2.0% COST OF DEBT 9.84% 11.08% 11.01% 5.30% 4.87% 4.51% 2007 2008 2009 2009 2007 754 582 2.8 1.477 855 2008 2009 2010 2010 2008 Real Cost Custo RealCusto Real Custo Nominal Custo Real CDI/Selic 74.2% 1T12 TJLP 23.5% 8.54% 3.09% 2009 set/10 US$/Euro 0.4%* set/10 jun/12 Sep/12 set/10 2011 2011 2009 Nominal Cost Custo Nominal Custo Nominal Custo Real Custo Nominal * Considering Hedge 40 Investments CAPEX BREAKDOWN (R$MN) 9M12 CAPEX (R$MN) +32.5% 700.6 546.7 92.9 453.8 2008 2008 928.6 169.9 592.7 563.8 116.9 181.8 758.7 518.8 2010 2010 85.1 507.6 446.9 2009 2009 -10.9% 2011 2011 9M11 9M11 527.8 Generation Maintenance 11.5 Generation Projects 1.7 Others 59.6 Develop. of Distribution System 200.7 45.8 482.0 9M12 9M12 Quality Improvement 97.9 Losses Combat 156.4 Investments in Electric Assets (Distribution) 41 Why Invest in Light? Economic Transformation in the Concession Area Major upcoming events Integration of favelas Pro-business environment New plants investments Expansion of the existing ones Market growth Energy Losses Reduction Progress in the Technology Program New network and meters in the pacified favelas Smart metering development “Zero Losses Area” Program Best-in-Class Corporate Governance Growth in the Generation Business Investment in Renova. Belo Monte and Guanhães (total of 548 MW) SHP Paracambi Operational Start SHP Lajes under construction. Dividend track Record Repricing of Existing Energy New PPAs starting in 2013 and 2014 Revenues increase with no aditional costs. Very active trading subsidiary Listed in “Novo Mercado” of Bovespa; Board Committees very active Included in the Sustainability Index (ISE) of Bovespa for the fifth year. Sound Dividend Policy: minimum 50% of net income; Average payout over last five years: 91% 42 Important Notice This presentation may include declarations that represent forward-looking statements according to Brazilian regulations and international movable values. These declarations are based on certain assumptions and analyses made by the Company in accordance with its experience, the economic environment, market conditions and future events expected, many of which are out of the Company’s control. Important factors that can lead to significant differences between the real results and the future declarations of expectations on events or business-oriented results include the Company’s strategy, the Brazilian and international economic conditions, technology, financial strategy, developments of the public service industry, hydrological conditions, conditions of the financial market, uncertainty regarding the results of its future operations, plain, goals, expectations and intentions, among others. Because of these factors, the Company’s actual results may significantly differ from those indicated or implicit in the declarations of expectations on events or future results. The information and opinions herein do not have to be understood as recommendation to potential investors and no investment decision must be based on the veracity, the updated or completeness of this information or opinions. None of the Company’s assessors or parts related to them or its representatives will have any responsibility for any losses that can elapse from the use or the contents of this presentation. This material includes declarations on future events submitted to risks and uncertainties, which are based on current expectations and projections on future events and trends that can affect the Company’s businesses. These declarations include projections of economic growth and demand and supply of energy, in addition to information on competitive position, regulatory environment, potential growth opportunities and other subjects. Various factors can adversely affect the estimates and assumptions on which these declarations are based on. 43 Contacts João Batista Zolini Carneiro CFO and IRO Gustavo Werneck IR Manager + 55 21 2211 2560 [email protected] www.light.com.br/ri 44
Download