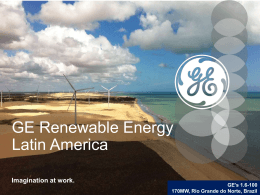
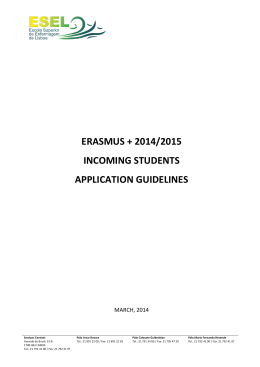
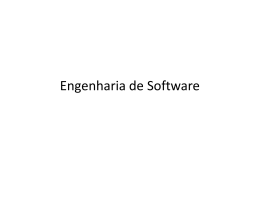
2Q15 EARNINGS RESULTS
São Paulo, August 4, 2015
HIGHLIGHTS OF THE PERIOD, AND SUBSEQUENT EVENTS:
• Agreement signed between Renova and SunEdison /
TerraForm Global.
• Contract signed for SunEdison to buy shares in Renova held
by Light Energia, and enter the controlling stockholding block
of Renova.
• First full year of operation of the wind farms commercialized
on LER 2009 auction– generation 10.8% higher than power
volume sold.
•
Alto Sertão III projects timetable – Status of Phase A.
• 2Q15 net operational revenue R$ 119.5 million – up 109.4%
year-on-year.
• 2Q15 EBITDA R$ 58.2 million – up 149.3% from 2Q14 – with
EBITDA margin 48.7%.
INVESTOR RELATIONS OFFICE
Pedro Pileggi
Vice-president for Finance, Business Development
and Investor Relations
Flávia Carvalho
Investor Relations Manager
Thatiana Zago
Investor Relations Analyst
[email protected]
+55 (11) 3509-1104/1174
MEDIA OFFICE
Josy Alves - [email protected]
(11) 3095-1100
STOCK PRICE AT AUGUST 3, 2015:
RNEW11 = R$ 32.10/Unit
MARKET VALUE ON BM&FBOVESPA
R$ 3,410.9 billion
[email protected]
1
INDEX
1.
2.
3.
4.
5.
6.
7.
8.
9.
10.
About Renova…………………………………………………………………………………………………………………………………………………………….2
Message from management………………………………………………………………………………………………………………………………………4
Highlights in detail……………………………………………………………………………………………………………………………………………………..5
Renova’s power trading company………………………………………………………………………………………………………………………………9
Consolidated profit and loss account………………………………………………………………………………………………………………………….9
Cash flow………………………………………………………………………………………………………………………………………………………………….16
Main indicators of the financial statements………………………………………………………………………………………………………………17
Stock price performance……………………………………………………………………………………………………………………………………………20
Stockholding structure………………………………………………………………………………………………………………………………………………21
Glossary …………………………………………………………………………………………………………………………………………………………………...22
1 – ABOUT RENOVA ENERGIA
Renova Energia S.A. (‘Renova’, or ‘the Company’) generates electric power from renewable sources, focusing on wind
farms, small hydroelectric plants (SHPs) and solar energy. It is the largest company generating electricity from
renewable sources in Brazil, by contracted installed capacity. It has been prospecting, developing and implementing
projects to generation power from renewable sources for 13 years – having invested to build a highly qualified
multidisciplinary team of experienced electricity sector professionals over this period. It has placed 1,609.1 MW of
contracted power in Brazil’s regulated market and 1,239.9 MW in the country’s Free Market – a total of 2,849.0 MW.
RENOVA – INSTALLED GENERATING CAPACITY (MW)
2,741.0
1,492.0
1,129.0
769.9
579.7
938.8
4.8
2,849.0
58.3
58.3
2,492.5
2,600.5
1,709.3
58.3
1,297.0
1,460.8
190.2
190.2
190.2
190.2
190.2
190.2
In
operation
2015
2016
2017
2018
2019
SHP
Wind
Solar
[email protected]
2
Parks
Installed
Capacity (MW)
Energy Sold
(avg MW)
Number of
wind farms
Start of the
contract
Source
Complex
LER 2009
LER 2010
Wind
Wind
Alto Sertão I
Alto Sertão II
294.4
167.7
127.0
78.0
14
6
Jul-12
Oct-14
LEN A-3 2011
LEN A-5 2012
Wind
Wind
Alto Sertão II
Alto Sertão III - Fase A
218.4
18.9
103.6
10.2
9
1
Mar /Sep-15
Jan-17
LER 2013
LEN A-5 2013
LEN A-5 2014
LER 2014
Wind
Wind
Wind
Wind
Alto Sertão III - Fase A
Umburanas
Umburanas
Alto Sertão
159.0
355.5
108.0
43.5
73.7
178.0
49.4
20.9
9
17
5
3
Sep-2015
May-18
Jan-19
Oct-17
Solar
Alto Sertão
53.5
10.9
4
Oct-17
SHP
-
41.8
18.7
3
2008
Brasil PCH
REGULATED MARKET
SHP
-
-
148.4
1,609.1
95.8
766.3
13
84
2008/2009
-
Light I
Light II
Mercado Livre I
Mercado Livre II
Wind
Wind
Wind
Wind
Alto Sertão III - Fase A
Alto Sertão III - Fase B
Alto Sertão III - Fase B
Alto Sertão III - Fase B
200.7
202.8
21.6
101.4
100.2
100.2
11.0
50.0
12
12
2
8
Sep-15 /Jan-16
Sep-16
Jan-16
Jan-17
Mercado Livre III
Wind
Alto Sertão III - Fase A
32.4
15.0
2
Sep-2015
Wind
Solar
-
Jacobina
Alto Sertão
-
676.2
4.8
1,239.9
354.0
1.0
631.4
TBD
1
37
Sep-18
2016
-
-
-
2,849.0
1,397.7
121
-
1
3
LER 2014
ESPRA
4
5
PPA Cemig
Híbrido
FREE MARKET
TOTAL
¹
²
³
4
5
6
6
2
2
2
2
Contracted under the LER 2009 (reserve auction); ready for operation since July 2012.
Projects awaiting transmission lines.
Refers to 50% equity interest, reflecting the joint venture with SunEdison.
This figure is for Renova’s 51% interest.
Reflects 100% participation in the project, since Cemig did not exercise its right to acquire 50% of the assets.
Of the nine wind farm complexes established under the LEN (new energy) A-3 2011 auction, four have started commercial
operation – on March 4, 2015; and the other five are awaiting their transmission lines. For all these, the start date of the
supply contract has been adjusted (‘synchronized’) to coincide with the start date of operation of the transmission lines.
[email protected]
3
2. MESSAGE FROM MANAGEMENT
Renova has just taken one more important step in maintaining its leadership in the development of renewable energy
projects in Brazil: Signature of an agreement with TerraForm Global and SunEdison, to increase its competitiveness,
value creation and growth capacity.
The first phase of the agreement comprised signature of share purchase contracts for sale of the assets of ESPRA
(three SHPs with a total of 41.8 MW installed capacity), and the assets of the Bahia project (five wind farms contracted
for construction in the 2009 Reserve Energy auction, with 99.2 MW of installed capacity), for R$ 587.0mn.
Also in the first phase was signature of a contract to exchange shares in the assets of the Salvador project (nine wind
farms which placed power supply in the LER 2009 auction, with 195.2 MW of installed capacity), for a total value of
R$ 1.026 billion receivable by the Company in the form of shares in TerraForm Global.
The second phase of this agreement includes signature of contracts to exchange further shares in TerraForm Global
for contracted assets of Renova with long-term Power Purchasing Agreements for total installed capacity of 2,204.2
MW, totaling enterprise value of R$ 13.4 billion. Also negotiated in this second phase is an option contract, in which
TerraForm Global will have a first refusal option to acquire any renewable energy projects to be developed by the
Company that sell power in long-term contracts.
Also under the contract and subject to its conditions, Renova will have the right to appoint a member of the Board of
Directors of TerraForm Global.
With this agreement includes the Company will recycle the capital invested, at an attractive and predictable cost; and
new options in the future for financing based on exchange contracts, and on the shares to be received from TerraForm
Global. Also, the dividends that Renova will receive from TerraForm Global will be a source of funding for Renova’s
multiple growth possibilities.
TerraForm Global is a globally diversified company, oriented to payment of growing dividends, created to hold and
operate clean power generation assets in emerging markets where there is high growth. SunEdison is the controlling
stockholder of TerraForm Global.
SunEdison has also signed a share purchase agreement to acquire the shares in Renova owned by Light Energia. As a
result of this, Renova will have all the expertise of SunEdison – the world’s largest developer of renewable energy –
within its controlling stockholding block.
Renova remains committed to quality in all its works and operations. The works on the Alto Sertão III wind complexes
continue to make progress. The transmission line that connects some of the wind farms is delayed, and Renova is
negotiating with the parties involved and considering market options to mitigate the negative impact of this delay.
On the operational side, the wind farms contracted in the LER 2009 auction have now been operating for one year,
generating in accordance with the Company’s expectations, but at a rate 10% higher than the level of power placed
in the auction. The Company also continues to operate the wind farms that placed their contracted output in the LER
2010 auctions, and those contracted in the LEN A-3 2011 auction, which are connected, and continues to have
confidence in further progress of alternative electricity sources in Brazil.
[email protected]
4
3. HIGHLIGHTS IN DETAIL:
3.1.
Agreement signed between Renova and SunEdison / TerraForm Global
On July 15, 2015 Renova took one more important step in its history, concluding the agreement for contribution of
assets to TerraForm Global, Inc. (‘TerraForm Global’). This transaction both inaugurates a new way for Brazilian
electricity companies to raise funding and also places Renova once again in an outstanding strategic position in the
renewable energy market. The model of the transaction will enable capital to be recycled at lower and more
predictable costs, sustaining the full execution of the Company’s business plan.
The transaction is divided into two phases. The first phase, announced on May 7, 2015, involved signature of the
following contracts:
(i)
Share purchase agreement for the sale of the assets of the ESPRA project, corresponding to three Small
Hydroelectric Plants with aggregate installed capacity of 41.8 MW and supply contracts in place under the
Proinfa program, for equity valuation of R$ 136 million, to be paid in cash.
(ii)
A share purchase agreement for sale of the assets of the Bahia project: five wind farms that placed supply in
the LER 2009, with 99.2 MW of installed capacity, assessed at equity value of R$ 451 million, to be paid in
cash.
(iii)
An agreement to exchange the shares of the Company’s subsidiaries that hold assets of the Salvador project
– nine wind farms that placed supply in the LER 2009, with 195.2 MW of installed capacity, with equity value
of R$ 1.026 billion – for shares in TerraForm Global, on the basis of the price per share paid in the IPO held
by TerraForm Global on July 31, 2015.
The amounts referred to above are subject to adjustments specified in each contract.
The second phase of the transaction was announced on July 15, and deals with other assets that have long-term
electricity sale contracts, both operational and not yet operational (‘the backlog’), and also projects in development
or to be developed by the Company that sell power supply in long-term contracts in the future (‘the pipeline’). This
phase includes signature of the following contracts:
(i)
A share exchange contract in which shares in the subsidiaries of the Company that own the assets of each
project of the backlog, as listed below, are exchanged at the Company’s enterprise value (i.e. including debt
in the valuation of the asset), of R$ 13.4 billion. The amounts will be adjusted on the date of exchange in
accordance with applicable terms of the contracts. The assets, with installed capacity for 2,204.2 MW, will
be exchanged after starting commercial operation and in accordance with the timetable below negotiated
by the parties. Renova will receive the corresponding amount in shares of TerraForm Global based on the
average market trading price in the 30 trading sessions prior to the closing date.
[email protected]
5
Asset
Light I
Light II
LEN A-5 2012
LER 2010
LEN A-3 2011
LER 2014 – wind
LER 2014 - solar¹
LER 2013
PPA Cemig²
LEN A-5 2013
LEN A-5 2014
¹
²
Installed capacity (MW)
200.7
202.8
18.9
167.7
218.4
43.5
53.5
159.0
676.2
355.5
108.0
Year of exchange
2017
2017
2017
2018
2018
2018
2018
2019
2019
2020
2020
Refers to 50% of the PPA, reflecting the joint venture with SunEdison.
Reflects 100% of the Cemig PPA, since Cemig did not exercise its right to acquire 50% of the asset.
(ii)
A contract giving TerraForm Global, until December 31, 2016, an option and first refusal to purchase any
renewable energy projects that the Company has in development and /or to be developed that sell power
supply under long-term contracts. The quantity of shares of TerraForm Global to be received by Renova will
be determined based on a multiple of the cash available for distribution from each project in the years
subsequent to the transfer, in accordance with a model agreed between the parties. After this period, the
parties will negotiate a new mechanism for the purchase option and first refusal right on acquisition of the
projects, intended to reflect the market conditions and the Company’s competitiveness.
It was also agreed that subject to certain conditions of the contract, Renova will have the right to appoint a member
of the Board of Directors of TerraForm Global.
As well as the advantages set out above, the objective of the transaction is to increase Renova’s competitiveness,
value creation and capacity for growth. With this transaction, Renova will have further new options for financing
based on the contracts for exchange of the backlog and on the shares in Terraform Global received as payment,
strengthening the capital structure for the development of the projects.
[email protected]
6
3.2.
Contract signed for SunEdison to buy shares in Renova held by Light Energia, and enter the
controlling stockholding block of Renova
On July 2, Light Energia S.A. announced that its Board of Directors had approved the share purchase agreement for
sale of the shares in Renova held by Light Energia S.A. (‘Light’) to SunEdison, Inc. (‘SunEdison’). The contract was
signed on July 15, and the amount to be paid for the 50,561,797 common shares is US$250,000,000.00, equivalent
to US$14.83 per Unit.
Completion of this transaction is subject to certain conditions precedent, including: regulatory approvals, waivers of
restrictions on transfer of shares, first refusal rights, and joint sale, under existing Stockholders’ Agreements.
On conclusion of the agreement, SunEdison will adhere to the existing Stockholders’ Agreement of the Company and
will be part of the controlling stockholding block of Renova. It is important to note that this transaction will not result
in disposal of control, neither direct nor indirect, of the Company, nor in acquisition of the power of control of the
Company by SunEdison.
New stockholding structure after entry of SunEdison into the controlling stockholder block:
RENOVA ENERGIA
Controlling shareholder block
RR Participações
SunEdison
Cemig GT
Other stockholders
RR Participações*
BNDESPAR
InfraBrasil
FIP Caixa Ambiental
Others
Total
ON Shares
188,309,630 79.6%
50,561,797 21.4%
50,561,797 21.4%
87,186,035 36.8%
48,534,656 20.4%
8,250,393
3.5%
9,311,425
3.9%
11,651,467
4.9%
5,470,293
2.3%
13,890,247
5.8%
236,883,455 100.0%
PN Shares
0.0%
0.0%
0.0%
0.0%
81,889,474 100.0%
1,280,600
1.6%
18,622,850 22.7%
23,302,933 28.5%
10,940,586 13.4%
27,742,505 33.8%
81,889,474 100.0%
Total Shares
188,309,629 59.1%
50,561,797 15.9%
50,561,797 15.9%
87,186,036 27.3%
130,345,793 40.9%
9,530,993 3.0%
27,934,275 8.8%
34,954,400 11.0%
16,410,879 5.1%
41,515,246 13.0%
318,772,929 100.0%
* Holding of RR Participações outside the controlling block
Nota: Bloco de controle considera ações sujeitas ao acordo de acionistas
3.3.
First full year of operation of the wind farms commercialized on LER 2009 auction– generation 10.8%
higher than power volume sold.
The 14 wind farms that commercialized on LER 2009 auction have completed one year of operation. They were
declared ready to operate as from July 2012, but with the delay in the transmission line, they started commercial
operation only in July 2014.
The volume of electricity that they placed in the initial auction was 127.0 MW average; but in this first year they
generated 140.7 MW – a level of generation 10.8% higher than the level contracted.
[email protected]
7
The capacity factor was 48%, close to the P50 estimate for these wind farms. Also, in this first year of operation there
were some non-recurring events, such as disconnections of rotors to make possible the connection of other wind
farms to the same transmission line. There are reimbursement clauses (constrained off clauses) in the contract for
these events, and the amounts will be calculated by Aneel.
LER 2009
200.0
48%
120.0
140.74
MWm
160.0
80.0
40.0
3Q14
4Q14
1Q15
Generated energy
2Q15
Sold¹
Avg
Capacity factor
¹ Volume sold has been seasonalized in accordance with the contract.
3.4.
Alto Sertão III projects timetable – Status of Phase A
Some of the Company’s projects of Phase A of Alto Sertão III were scheduled for inauguration in September 2015.
According to Aneel’s SIGET transmission line scheduling publication, however the transmission line that will connect
these wind farms is planned for September 30, 2015.
The Company is taking measures for this to cause the minimum possible impact.
In the case of Light I, with installed capacity of 200.7 MW, and a power output of 100.2 MW average currently
contracted, two-thirds of the contract was renegotiated for supply to start in January 2016. One-third of the contract
maintains the 2015 date, and the Company has bought backup supply to make good the energy needs.
The price of electricity is declining, since the hydrological situation has improved, with higher than average rainfall in
the South and Southeast; there are signs of reduction in the load forecasts produced by the National System Operator
(ONS), and there are attempts to decide on a regulatory solution for the GSF (Generation Scaling Factor) of the large
generation companies.
For the Mercado Livre III wind farm, with installed capacity of 32.4 MW and a total of 15.0 MW average contracted,
the Company is also negotiating purchase of backup supply.
For the facilities that were built under the LER 2013 auction, with installed capacity of 159.0 MW and a total of 73.7
MW average contracted, the Company is studying the alternative solutions.
[email protected]
8
4. RENOVA’S POWER TRADING COMPANY
Renova created its power trading company to manage its portfolio and mitigate risks. In the second quarter of 2015
Renova Comercializadora de Energia S.A. (‘Renova Comercializadora’, or ‘RC’) transacted electricity contracts
generating revenue of R$ 2.3 million, with electricity purchase costs of R$ 2.6mn. With other costs, principally of
personnel and consultancy, RC reported a loss of R$ 25,000 (twenty-five thousand Reais) for the quarter.
RC’s result in the half-year is a loss of R$ 0.5 million.
Renova Comercializadora S.A.
R$ ’000
Net revenue
Purchase of electricity
Other costs
Financial revenue (expenses)
Net profit
2Q15
2Q14
Change
1H15
1H14
Change
2,595
(2,595)
(83)
58
(25)
5,423
(3,393)
(2,058)
(28)
-52.1%
-23.5%
-96.0%
12.0%
4,909
(5,161)
(366)
107
(511)
5,423
(3,393)
(2,058)
(28)
-9.5%
-52.1%
-82.2%
1725.0%
5. CONSOLIDATED PROFIT AND LOSS ACCOUNT
Renova Energia S.A.
R$ ’000
2Q15
2Q14
Change
1H15
1H14
Change
124,064
59,597
108.2%
231,314
115,215
100.8%
(4,530)
(2,502)
81.1%
(8,737)
(4,519)
93.3%
119,534
57,095
109.4%
222,577
110,696
101.1%
(5,903)
(2,627)
124.7%
(11,922)
(4,975)
139.6%
Manageable Costs
(19,722)
(7,458)
164.4%
(30,294)
(7,011)
332.1%
Depreciation
(21,256)
(17,348)
22.5%
(52,902)
(34,861)
51.8%
72,653
29,662
144.9%
127,459
63,849
99.6%
(31,198)
(20,416)
52.8%
(56,646)
(32,924)
72.1%
(577)
(424)
36.1%
(1,300)
(734)
77.1%
(46,376)
(5,967)
677.2%
(91,528)
(23,655)
286.9%
Equity gain (loss) in subsidiaries
(4,474)
(3,233)
38.4%
(2,765)
(6,211)
-55.5%
Amortization of goodwill
(9,077)
-
-
(18,152)
-
-
Income Tax and Social Contribution
Tax
(8,238)
(2,944)
179.8%
(13,476)
(6,391)
110.9%
(27,287)
(3,322)
721.4%
(56,408)
(6,066)
829.9%
-22.8%
-5.8%
-17.0 p.p.
-25.3%
-5.5%
-19.9 p.p.
Gross operational revenue
(-) Taxes - PIS, Cofins and ICMS
Net operational revenue
Non-Manageable Costs – Total
Operational profit
Administrative Expenses
Administrative Depreciation
Financial revenues (expenses)
Net profit (loss)
Net margin
[email protected]
9
5.1. Consolidated net operational revenue
Renova reports net operational revenue in 2Q15 of R$ 119.5 million – an increase of 109.4% from 2Q14.
Renova Energia S.A.
R$ ’000
Net revenue – Wind power
Net revenue – SHPs
Net revenue – Solar power
Net revenue – Power trading
Net operational revenue
2Q15
2Q14
Change
1H15
1H14
Change
110,669
48,115
130.0%
205,693
96,229
113.8%
6,191
3,456
79.1%
11,752
8,943
31.4%
79
101
-21.8%
223
101
120.8%
2,595
5,423
-52.1%
4,909
5,423
-
119,534
57,095
109.4%
222,577
110,696
101.1%
The higher revenue is primarily higher revenue from the wind farms – up 130.0% year-on-year, with the start of
operation of two groups of wind farms: the plants contracted at the LER 2010 Auction, as from October 2014; and
four complexes contracted at the LEN A–3 2011 auction, in March of this year. Both these revenue sources were not
yet in existence in the second quarter of last year.
In this quarter there were also financial adjustments applied to generation by the wind farms, in the amount of R$ 23.5
million, since the complexes built under the LER 2009 and LER 2010 auctions generated a higher volume of output
than the volume contracted, and there were also adjustments to the LER 2009 auction, accounted in the transition
period between the facilities being ready to operate and commercial operation.
The revenue from the Small Hydro Plant (SHPs) was 79.1% higher than in 2Q14 – this continues to be affected by the
provision of R$ 2.3 million for the financial adjustment resulting from trading on the CCEE of output by Renova’s SHPs.
In this quarter, however, the provision was lower than in 2Q14 (when it was R$ 7.5mn).
Two of Renova’s SHPs – Cachoeira da Lixa and Colino I – are included in the Energy Reallocation Mechanism (ERM).
This mechanism makes an accounting reallocation of the total volume of electricity generated in the country,
transferring the excess of those that generated more than their physical guarantee to those that generated less. Since
the MRE plants generated less than their aggregate physical guarantee and the spot price is high due to the thermal
plants having been activated, the Company made a provision in the amount of its portion of the adjustment of the
accounting of the ERM amounts. The financial settlement of these amounts takes place only in the following year,
after the accounting of the whole of the current year. The Colino II SHP is outside the ERM, and either receives or
reimburses to Eletrobras depending on its generation output.
In this quarter there was also revenue from solar power due to development of a distributed generation project.
Finally, the revenue from trading in the quarter was R$ 2.6 million, 52.1% lower than in 2Q14.
In the half year, net operational revenue was R$ 222.6 million, or 101.1% higher than in 1H2014. The variation mainly
refers to the start of operation of the wind farms built under the LER 2010 and LEN A–3 2011 auctions, as noted above.
[email protected]
10
5.2. Consolidated costs
Electricity production costs are separated into manageable, and non-manageable, components.
Non-manageable costs are: (i) The tariff for use of the distribution system (TUSD), for the use of the distribution
system of Coelba – the concession holder to which the SHPs are connected – and the tariff for use of the transmission
system (TUST), for the transmission lines and substations of the wind farms; and (ii) the inspection charge made by
Aneel. These costs are related to the small hydro plants and the wind plants that are in operation.
Manageable costs are the costs of operation and maintenance of the SHPs of the subsidiary Energética Serra da Prata
S.A. (‘ESPRA’) and of the wind farms in operation.
Costs excluding depreciation (R$ 000)
42,216
11,922
25,625
5,903
10,085
2,627
7,458
11,986
4,975
7,011
30,294
19.722
2Q14
2Q15
1H14
1H15
Manageable
Non-manageable
In 2Q15 manageable costs totaled R$ 5.9 million, 124.7% higher than in 2Q14. The increase reflected the higher
payment of TUST and regulatory charges due to the start of operation of the wind farms of the LER 2010 auction and
four wind farms of the LEN A–3 2011 auction.
In the half year, non-manageable costs were R$ 11.9 million, or 139.6% more than in first half 2014, for the same
reason.
In 2Q15, manageable costs were R$ 19.7 million. The year-on-year increase of R$ 12.3 million was primarily due to:
•
•
Expenses on third party services R$ 13.9 million higher, mainly for maintenance of the wind farms,
following expiration of the grace period. The amount for the half-year was accounted in full in this second
quarter.
Rentals and leasing R$ 0.7 million lower in the second quarter due to a change in the rule for capitalization
of sites leased for Alto Sertão III.
[email protected]
11
•
•
•
Total expense on purchase of electricity for resale R$ 0.8 million lower in the quarter.
Expense on material for use and consumption R$ 0.2 million higher, reflecting purchase of material for
maintenance and replacement parts for the wind farm.
The item ‘Other costs’ was R$ 0.3 million lower.
In the half year, manageable costs totaled R$ 30.3 million, or 332.1% more than 1H2014, mainly due to higher
expenses on third party services.
Depreciation in the quarter was R$ 21.3 million, or 22.5% higher than in 2Q14. In the half year, depreciation was
R$ 52.9 million, up 51.8% due to the start of operation of the wind farm complexes under the LER 2010 auction and
four wind farms from the LEN A–3 2011 auction. Note that under IFRS 5 / CPC 31, assets held for sale are not to be
depreciated. Thus, no depreciation was accounted in the quarter for the complexes built under the 2009 LER auction,
and the SHPs of ESPRA.
5.3.
Consolidated administrative expenses
Renova Energia S.A.
R$ ’000
2Q15
2Q14
Change
1H15
1H14
Change
Personnel and management
10,733
5,012
114.1%
17,954
8,769
104.7%
Outsourced services
13,398
10,764
24.5%
24,910
17,075
45.9%
837
257
225.7%
1,328
444
199.1%
2,044
1,100
85.8%
3,941
1,516
160.0%
-
1,343
-100.0%
-
1,343
-100.0%
(137)
61
-324.6%
491
146
236.3%
Telephony and IT
335
532
-37.0%
1,632
1,141
43.0%
Material for use and consumption
762
208
266.3%
1,064
420
153.3%
3,226
1,139
183.2%
5,326
2,070
157.3%
31,198
20,416
52.8%
56,646
32,924
72.1%
Rentals and leasing
Travel
Projects discontinued
Insurance
Others
Total
*Excludes administrative depreciation.
Administrative expenses in 2Q15 were R$ 31.2 million, 52.8% higher than in 2Q14. This reflects:
•
•
•
•
•
•
Personnel and administration: higher number of employees – 328 at June 30, 2015 vs. 237 at June 30, 2014;
the wage increase under the union agreement of April 2015; and bonuses;
Outsourced services: R$ 2.6 million higher than in 2014, due to higher expenses on consultancy and lawyers;
Rentals and leasing: higher due to new rentals for the Salvador and São Paulo offices.
Travel: higher, reflecting the Company’s projects.
Insurance, telephony and IT: lower, on reclassifications between accounts and reversal of a provision.
Others: freight and mail costs, expenses on social programs for communities where the Company operates,
and non-recurring items. The higher total than in 2Q14 is mainly due to higher expenditure on events this
year, and expenses of the power trading company.
[email protected]
12
In the first half of 2015 administrative expenses totaled R$ 56.6mn, or 72.1% more than 1H14, mainly reflecting
personnel and administration and higher expenses on third party services.
5.4. Consolidated financial revenue (expenses)
Renova Energia S.A.
R$ ’000
2Q15
2Q14
Change
1H15
1H14
Change
Financial revenues
8,687
19,144
-54.6%
18,904
26,155
-27.7%
Revenue from cash investments
8,057
18,974
-57.5%
18,270
25,982
-29.7%
630
170
270.6%
634
173
266.5%
Financial expenses
(55,063)
(25,111)
119.3%
(110,432)
(49,810)
121.7%
Costs of debt
(50,415)
(23,617)
113.5%
(101,752)
(46,758)
117.6%
(4,648)
(1,494)
211.1%
(8,680)
(3,052)
184.4%
(46,376)
(5,967)
677.2%
(91,528)
(23,655)
286.9%
Other financial revenues
Other financial expenses
Financial revenue (expenses)
Renova reports net financial expenses in 2Q15, of R$ 46.4 million.
Financial revenues were 54.6% below their level of 2Q14, mainly due to the Company holding less cash.
Financial expenses increased by 119.3%, YoY, mainly on three factors: (i) higher financing volume in the quarter, especially
with the new debenture issue by the holding company, issued in December, and bridge loans for Alto Sertão III; (ii) higher
interest rates resulting from the indexers of the financings (TJLP and CDI); and (iii) accounting in the profit and loss
account of the financing of the 2010 LER projects and part of the 2011 A–3 LEN projects, since their costs are no longer
capitalized after they started operation.
The reported net financial result for the first half of the year was net financial expenses of R$ 91.5mn, 286.9% higher
than in 1H14. The variation also arises from the lower cash balance, and the higher expenses on debt costs.
5.5. Equity gain / Loss – Brasil PCH
Renova made the acquisition of 51% of Brasil PCH as part of the transaction which increased the share capital and
included Cemig GT in the controlling stockholding block. The acquisition was made through a subsidiary (Chipley), in
which until 3Q14 Renova owned 60%, and with completion of the capital increase, as from 4Q14 Renova owned 100%.
[email protected]
13
R$ ’000
Brasil PCH (100%)
2Q15
1H15
Net revenue
44,188
98,443
Costs
(8,030)
(15,632)
Expenses
(2,847)
(6,503)
Depreciation
(10,770)
(21,641)
Financial revenue (expenses)
Income tax and Social
Contribution tax
Net profit
(29,750)
(56,060)
(1,564)
(4,028)
(8,773)
(5,421)
Brasil PCH reported a loss of R$ 8.8 million in the second quarter,
and Renova (through Chipley) has the right to 51% of the result of
Brasil PCH.
The total goodwill in the acquisition was R$ 656.7 million. The
Company assessed the fair value of the assets and liabilities in
Brasil PCH, based on the best existing estimate. Thus the monthly
value of the amortization of goodwill was recorded in the month
of the acquisition. The total amortization of goodwill accounted in
the quarter was R$ 9.1 million.
This table shows the effect of the acquisition of Brasil PCH in Renova:
Renova
2Q15
1H15
Equity method gains (losses)
(4,474)
(2,765)
Amortization of goodwill
(9,077)
(18,152)
(13,551)
(20,917)
Net profit
5.6. Income tax, social contribution tax and net profit
Renova’s revenues from generation are taxed by the Presumed Profit method of tax reporting. Under this regime, the
amount on which the tax is calculated is the sum of 8% of gross revenues arising from electricity generation and 100%
of financial revenues. To this amount, Income Tax is applied, at the regular rates: 15% basic rate plus an additional
10% over a threshold figure. The Social Contribution tax is calculated, at its regular rate of 9%, on: 12% of gross
revenues from electricity generation, plus 100% of financial revenues.
Income tax and social contribution tax in 2Q15 totaled R$ 8.2 million, which compares to R$ 2.9 million in 2Q14, mainly
reflecting higher revenues with the new wind farms coming into operation. Income tax and social contribution tax in
the half year totaled R$ 13.5 million.
For second quarter 2015, Renova reported a net loss of R$ 27.3 million, which compares with a loss of R$ 3.3 million
in second quarter 2014. In the first half of 2015, Renova reported a net loss of R$ 56.4 million.
[email protected]
14
5.7. EBITDA
Renova Energia S.A.
R$ ’000
2Q15
2Q14
Change
1H15
1H14
Change
Net operational revenue
119,534
57,095
109.4%
222,577
110,696
101.1%
Net profit (loss)
(27,287)
(3,322)
721.4%
(56,408)
(6,066)
829.9%
8,238
2,944
179.8%
13,476
6,391
110.9%
(+) Depreciation
30,910
17,772
73.9%
72,354
35,595
103.3%
(+) Financial expenses
55,063
25,111
119.3%
110,432
49,810
121.7%
(-) Financial revenues
(8,687)
(19,144)
-54.6%
(18,904)
(26,155)
-27.7%
Ebitda
58,237
23,361
149.3%
120,950
59,575
103.0%
Ebitda margin
48.7%
40.9%
7.8 p.p.
54.3%
53.8%
0.5 p.p.
(+) Equity method gains (losses)
4,474
3,233
38.4%
2,765
6,211
-55.5%
(21,173)
7,488
-382.8%
19,848
12,580
57.8%
-
-
-
-
(4,645)
-
41,538
34,082
21.9%
143,563
73,721
94.7%
34.7%
59.7%
-24.9 p.p.
64.5%
66.6%
-2.1 p.p.
(+) Income Tax and Social Contribution tax
(+) Financial adjustments – generation
(+) Provision for 2010 LER
Adjusted EBITDA
Adjusted EBITDA margin
EBITDA in 2Q15 was R$ 58.2 million, that is to say an increase of 149.3% over 2Q14 – and with EBITDA margin of
48.7%.
EBITDA adjusted for equity gains/losses and generation adjustments was R$ 41.5 million, 21.9% higher than in 2Q14,
with EBITDA margin 34.7%.
In the first half of the year EBITDA was R$ 120.9 million – an increase of 103.0% from 1H15, and EBITDA margin in the
first half of 2015 was 54.3%.
Adjusted EBITDA for the first half of the year was R$ 143.6 million, or 94.7% more than in 2H14, with EBITDA margin
of 64.5%.
[email protected]
15
6. CASH FLOW
2Q15 Cash Flow
90,550
178,469
47,478
46,929
49,898
(252,454)
(13,596)
Initial Cash
97,376
Operational
Financing
Cash Investiments
Investments
Final Cash
Cash Investments
(total)
Availabilities
(total)
* In the cash flow statements, cash investments are classified as investing activities.
Renova’s cash position at June 30 was R$ 3.0 million higher than at March 31, 2015, with cash and cash equivalents
R$ 78.5 million lower. The main factors are:
•
•
•
•
R$ 14.3 million used in operational activities.
Cash inflow of R$ 178.5 million in financings, from the bridge loan from the BNDES for Alto Sertão III – Phase A.
Cash investments of R$ 90.6 million – positions held in investment funds, to be used in the construction of the
Alto Sertão III complexes.
Outflow of R$ 252.5 million in investments, mainly for works on Alto Sertão III.
In addition to cash, Renova has R$ 47.5 million in cash investments, resulting in cash and cash equivalents of R$ 97.4
million.
Note that R$ 23.6 million of the R$ 49.9 million in cash refers to assets of the LER 2009 project and of ESPRA, which
are classified in the balance sheet as held for sale. Of the R$ 97.4 million total of cash and cash equivalents, R$ 59.2
million refers to the assets of the LER 2009 projects, and of ESPRA.
[email protected]
16
7. ANALYSIS OF MAIN ECONOMIC AND FINANCIAL INDICATORS
Balance Sheet
Amounts in R$ thousands
Consolidated Assets
6/30/2015
Current Assets
1.734.469
Consolidated Liabilities
3/31/2015 12/31/2014
284.843
692.655
3/31/2015
Current Liabilities
Cas h and ca s h equiv.
26.336
46.929
86.599
Inves tments
11.834
128.934
509.018
Clients
18.198
70.309
68.627
Suppli ers
Other
32.198
38.671
28.411
Others
1.645.903
Long-term Assets
4.055.099
5.213.309
4.849.587
3
171.021
160.487
Others
Inves timents
Fixed As s ets in Us e
2.460
11.393
8.745
692.395
705.946
713.312
1.242.508
Debentures
Li abili ties as s oci ated with
as s ets for s a le
As s ets for Sa le
Loa ns a nd Financing
Loans and Fi na ncing
2.625.531
Long-term Liabilities
3/31/2015
3/31/2014
1.787.590
357.321
517.165
484.016
121.269
355.442
7.576
22.738
884
278.319
154.724
100.200
34.824
58.590
60.639
982.855
-
-
1.548.082
2.659.985
2.515.436
Loans and Fi na ncing
891.510
1.990.509
1.917.051
Debentures
649.451
641.239
572.315
7.121
28.237
26.070
Shareholder´s Equity
2.453.896
2.480.846
2.509.641
Ca pita l Stock
2.526.249
2.526.240
2.526.240
55.830
55.502
55.176
Other
2.175.130
Ca pita l Res erve
Fixed As s ets in Progres s
2.117.733
1.699.418
1.791.913
Reta ined Los s es
Total Assets
5.789.568
5.498.152
5.542.242
Total Liabilities
-
128.183 5.789.568
100.896 5.498.152
71.775
5.542.242
As noted (3.1 above), the board has approved the agreement between Renova, SunEdison and TerraForm Global.
IFRS 5 / CPC 31 requires that assets of which a sale is highly probable, with management engaged for this to happen,
and where the sale is likely to take place by the end of a year, should be classified as assets held for sale.
Thus, all the lines of assets relating to the LER 2009 projects and ESPRA have now been classified in current assets, in
a single line – assets held for sale.
The same takes place in liabilities: all the lines in liabilities relating to the projects have been classified in a single line
– liabilities directly associated with assets held for sale.
[email protected]
17
7.1. Main variations in assets
The main variation in current assets in this quarter, and in the year, was in Assets held for sale – this line now
consolidates all the assets of the LER 2009 projects and ESPRA: a total amount of R$ 1.646 billion.
Also in current assets, Cash and cash equivalents (cash plus financial investments) on June 30, 2015, was R$ 38.2
million. We expect the Company’s cash position to be strengthened with: the long-term disbursement from the BNDES
for Alto Sertão III; the cash inflow of R$ 587.0 million from the transaction with SunEdison/TerraForm Global; and new
financings that are being structured.
In non-current assets, the main variation in the quarter, and in the year, was the account of Deposits. On June 30,
2015 Renova had only R$ 3,000 (i.e. three thousand Reais) under this account, compared to R$ 171.0 million on March
31, and R$ 160.5 million on December 31, 2014. This was because a total of R$ 171.9 million in deposits relates to the
2009 LER projects and ESPRA which (as explained above) has now been reclassified to Assets held for sale. The majority
of the Deposits account consists of a specific reserve for O&M, and service of debt of the BNDES contract – to
guarantee full payment of the installments and principal of the debt, to ensure its coverage.
The Investments line refers to Renova’s 51% equity in Brasil PCH.
The change of R$ 1.383 billion in fixed assets in service from March 31, 2014 also relates to the classification of the
assets of the LER 2009 projects and of ESPRA in assets held for sale. The change in fixed assets and progress mainly
reflects the progress on the works of Alto Sertão III.
7.2. Main changes in liabilities
The main variation in Current liabilities in this quarter, and in the year, has been the line of Liabilities directly
associated to the assets held for sale, bringing together all the liabilities of the LER 2009 projects and of ESPRA, in a
total of R$ 982.9 million.
Short-term loans and financing totaled R$ 484.0 million. The increase of R$ 362.7 million from the end of the first
quarter was due to the bridge loan from the BNDES, now disbursed, which ceased to be long-term and became a part
of short-term liabilities. There was also a further disbursement of a bridge loan for Alto Sertão III.
Suppliers at June 30, 2015 was R$ 278.3 million: the increase of R$ 123.6 million in the quarter, and of R$ 178.1 million
since December 31, 2014, reflects the current stage of work on building of the Alto Sertão III wind farm complexes.
In Non-current liabilities, the main change was in Loans and financings, which was R$ 891.5 million at the end of the
quarter or R$ 1.099 billion less than at the end of 1Q15, and R$1.026 billion less than at the end of 2014. The reduction
is mainly due to: (i) the BNDES bridge loan which was reallocated from long-term to short-term; and (ii) R$ 858.7
million of loans relating to the LER 2009 projects and the ESPRA assets, which were grouped in the line specifically for
liabilities directly associated with assets held for sale.
Stockholders’ equity at the end of the quarter was R$ 2.454 billion, in line with previous quarters, with some variation
within Retained losses.
[email protected]
18
7.2.1. Financing
The total of short and long-term Loans, financings and debentures at the end of 2Q15 was R$ 2.984 billion¹, with
tenors and rates as follows:
Contract
BNDES – LER 2009
Rate
TJLP + 1.92%
R$ ’000
562,514
BNDES – LER 2009
TJLP + 2.18%
275,217
BNDES – LER 2009 (Social sub-credit)
TJLP
BNDES – Renova Eólica
TJLP + 2.45%
676,635
BNDES – Renova Eólica
TJLP + 2.60%
264,654
BNDES – Renova Eólica (Social sub-credit)
TJLP
BNDES – Bridge Loan 1, Diamantina Eólica
TJLP + 3.55%
146,465
BNDES – Bridge Loan 1, Diamantina Eólica
TJLP + 2.5%
283,447
BNB² – ESPRA
9.5% p.a.
93,779
3.5% p.a.
6,355
Finep – Itaparica Wind Power Consortium
6,594
1,361
rd
123.45% of CDI
st
IPCA + 7.60% p.a.
Debentures – 3 issue – Holding Company
Debentures – 1 issue – Renova Eólica
503,458
Total indebtedness
163,646
2,984,125
Funding cost
(22,000)
Transfer of liabilities associated with assets held for sale
(929.572)
Debt net of costs
2,032,553
Cash & cash equivalents
38,170
Net debt³
1,994,383
¹ The total represents the amount accounted, plus the interest generated, without considering the funding costs of the transactions.
² Financings have interest rates of 9.5% p.a. (able to be reduced to 8.08% by a 15% non-default bonus)
³ Cash equivalents plus cash investments.
Maturities timetable (R$ million)
2.984.125
1.803.597
563.835
untill 12
months
66.653
136.004
207.877
206.159
2015
2016
2017
2018
After 2018
[email protected]
Total
19
8. STOCK PRICE: RNEW11 ON THE BM&FBOVESPA
This chart compares the stock price of RNEW11, the Bovespa index and the Brazil electricity index, in the last 12 months.
R$ 32.10
August 3, 2015
RNEW11
50,00
40,00
30,00
20,00
10,00
ago-14
set-14
out-14
nov-14
dez-14
jan-15
fev-15
mar-15
abr-15
mai-15
jun-15
jul-15
mar-15
abr-15
mai-15
jun-15
jul-15
RNEW x IBOV x IEE
140
120
100
80
60
40
20
0
ago-14
set-14
out-14
nov-14
dez-14
jan-15
Rnew
fev-15
Ibov
IEE
Source: Bloomberg.
[email protected]
20
RNEW11¹
In R$
IPO (July 2010)
11.67
Close of August 3, 2015
32.10
Highest price since IPO:
50.00
Appreciation since IPO
174.1%
Appreciation, LTM
-17.6%
Appreciation in 2015
-13.9%
With the tools of the Company’s website and the constant relationship with
stockholders and potential investors at public events and events organized by
investment banks, Renova’s Investor Relations Department seeks to operate in
a transparent relationship with the market, updating investors on its positioning,
its projects under development and its outlook.
The company’s information and publications can be accessed on our website
(www.renovaenergia.com.br), which also carries leading news on the sector that
could be relevant to our business plan.
¹ Adjusted for corporate action.
9. STOCKHOLDING STRUCTURE
Controlling
stockholder block
79.6% ON
RR
Participações
21.4% ON
0.0 % PN
15.9% total
Light Energia
21.4% ON
0.0% PN
15.9% total
Cemig GT
36.8% ON
0.0% PN
27.3% total
RR
Participações1
3.5% ON
1.6% PN
3.0% total
BNDESPAR
FIP InfraBrasil
3.9% ON
22.8% PN
8.8% total
4.9% ON
28.5% PN
11.0% total
FIP Caixa
Ambiental
2.3% ON
13.4% PN
5.1% total
Others
5.8% ON
33.7% PN
13.0% total
Base date: June 2015
¹ Shares held by RR outside the controlling block.
Share capital of Renova on June 30, 2015:
RENOVA ENERGIA
ON shares
236,844,286
PN shares
81,811,136
Total shares
318,655,422
For calculation of market capitalization, the total number of shares of Renova is divided by 3 (due to its trading in
Units – one common share and two preferred shares) and multiplied by the price of the security RNEW11 on the date
in question.
[email protected]
21
10. GLOSSARY
A–3 or A–5 Auctions
‘New-build’ auctions, to contract supply starting respectively 3 and 5 years ahead.
Alto Sertão I
14 wind farms owned by Renova in the interior of Bahia State, with installed capacity of 294.4 MW, which
contracted electricity sales in the 2009 Reserve Energy auction (LER).
Alto Sertão II
15 Renova wind farms in the interior of Bahia State, with installed capacity of 386.1 MW, which contracted
electricity sales in the Reserve Energy (LER) Auction of 2010 and the A–3 Auction of 2011.
Alto Sertão III
44 Renova wind farms in the interior of Bahia, which sold supply in the 2012 (A–5) LEN Auction, in the
2013 LER auction, and in the Free Market, with total installed capacity of 736.8MW.
Alto Sertão III Phase A 23 Renova wind farms in the interior of Bahia with installed capacity of 411.0MW, which sold power
supply in the 2012 (A–5) LEN auction, the 2013 LER auction, and in the Free Market.
Aneel
Brazil’s electricity regulator (Agência Nacional de Energia Elétrica – National Electricity Agency).
CCEE
ESPRA
Free Market
ICB
ICSD
LEN
LER
MCPSE
Mercado Livre I
Mercado Livre II
Mercado Livre III
MRE
O&M
P50
P90
PCHs
The Electricity Trading Chamber (Câmara de Comercialização de Energia Elétrica): Brazil’s Wholesale
Electricity Market.
The company Energética Serra da Prata S.A., indirect subsidiary of Renova and holder and operator of
Renova’s three Small Hydro Plants.
Contracting environment in which prices for electricity supply are freely negotiated between the
consumer and the generating agent or trader.
Cost-Benefit Index (Índice Custo Benefício) calculated by Aneel for new-build auctions.
Debt servicing coverage index (Índice de Cobertura do Serviço da Dívida).
‘New-build’ auction: Auction to contract energy supply to be provided by facilities yet to be built (Leilão
de Energia Nova – ‘New Electricity Auction’).
‘Reserve Capacity’ auction (Leilão de Energia de Reserva – ‘Reserve Energy Auction’).
Electricity Sector Assets Property Management Manual (Manual de Controle Patrimonial do Setor Elétrico).
A Renova wind farm with installed capacity of 21.6MW, in the interior of Bahia State, which has sold power
supply in the Free Market.
A group of eight Renova wind farms in the interior of Bahia, with installed capacity of 101.4MW, which
have sold power supply in the Free Market.
A Renova wind farm with installed capacity of 32.4MW, in the interior of Bahia State, which has sold power
supply in the Free Market.
Electricity Reallocation Mechanism (Mecanismo de Realocação de Energia).
Operation and maintenance
An estimate of average electricity output for which the possibility of its being exceeded in the long term
is estimated at 50%. Regarded as an average estimate for electricity production.
An estimate of average electricity output for which the possibility of its being exceeded in the long term
is estimated at 90%. Regarded as a conservative estimate for electricity production.
SHPs – Small Hydroelectric Plants (Pequenas Centrais Hidrelétricas, in Portuguese).
Regulated market
SHPs
The Spot Market Price (Preço de Liquidação das Diferenças – ‘Differences Settlement Price’), published
weekly by the CCEE.
Power Purchase Agreement – contract to buy power supply.
The Program to Encourage Alternative Sources of Electric Power (Programa de Incentivos às Fontes
Alternativas de Energia).
Contracting environment in which prices are laid down by the regulator, Aneel.
Small Hydroelectric Plants (Pequenas Centrais Hidrelétricas, or PCHs, in Portuguese).
SPC
Special-purpose company (in Portuguese, Sociedade de Propósito Específico or ‘SPE’).
PLD
PPA
Proinfa
In accordance with CVM Instruction 381 (of January 14, 2003), the Company reports that it has signed a contract with Deloitte
Touche Tohmatsu Auditores Independentes (‘Deloitte’) to provide services of auditing of the accounting and financial statements
of the Company and its subsidiaries.
[email protected]
22
Individual and Consolidated
Interim Financial Information
As of June 30, 2015
1
CONTENTS
(Page)
Balance sheets ........................................................................................................................................................... 3
Income statements ..................................................................................................................................................... 5
Statements of comprehensive income ....................................................................................................................... 7
Statements of changes in equity ................................................................................................................................ 8
Statement of cash flows ............................................................................................................................................ 9
Statements of value added ....................................................................................................................................... 10
NOTES TO THE FINANCIAL STATEMENTS
1. General information......................................................................................................................................... 11
2. Basis of preparation ......................................................................................................................................... 18
3. Basis of consolidation...................................................................................................................................... 19
4. Authorizations ................................................................................................................................................. 20
5. Power sale........................................................................................................................................................ 22
6. Segment reporting ........................................................................................................................................... 24
7. Cash and cash equivalents and short-term investments ................................................................................... 26
8. Trade receivables ............................................................................................................................................. 26
9. Recoverable taxes ............................................................................................................................................ 27
10. Advances to suppliers ...................................................................................................................................... 27
11. Collaterals and restricted deposits ................................................................................................................... 28
12. Deferred taxes .................................................................................................................................................. 29
13. Investments ...................................................................................................................................................... 30
14. Property, plant and equipment ........................................................................................................................... 42
15. Trade payables ................................................................................................................................................. 50
16. Borrowings, financing and debentures ............................................................................................................ 51
17. Taxes payable .................................................................................................................................................. 58
18. Accounts payable / receivable - CCEE/Eletrobras .......................................................................................... 59
19. Provision for civil, tax and labor risks ............................................................................................................. 60
20. Provision for environmental costs ................................................................................................................... 61
21. Equity and shareholders’ compensation .......................................................................................................... 62
22. Net revenue ...................................................................................................................................................... 64
23. Costs and expenses .......................................................................................................................................... 65
24. Finance income (costs) .................................................................................................................................... 66
25. Income tax and social contribution .................................................................................................................. 67
26. Related-party transactions ............................................................................................................................... 68
27. Financial instruments and risk management.................................................................................................... 72
28. Earnings per share ........................................................................................................................................... 80
29. Assets classified as held for sale...................................................................................................................... 81
30. Insurance coverage .......................................................................................................................................... 84
31. Commitments .................................................................................................................................................. 86
32. Non-cash transactions ...................................................................................................................................... 86
33. Subsequent events ........................................................................................................................................... 86
2
BALANCE SHEETS
As of June 30, 2015
In thousands of Brazilian reais - R$
ASSETS
CURRENT ASSETS
Cash and cash equivalents
Short-term investments
Trade receivables
Accounts receivable - CCEE
Recoverable taxes
Prepaid expenses
Collaterals and restricted deposits
Dividends receivable
Advances to suppliers
Other receivables
Assets classified as held for sale
Note
7
7
8
18
9
11
13.4
10
29
Total current assets
NONCURRENT ASSETS
Accounts receivable - CCEE
Related parties
Collaterals and restricted deposits
Deferred taxes
Other receivables
Investments
Property, plant and equipment
Construction in progress
Total noncurrent assets
TOTAL ASSETS
18
26
11
12
13
14
14
Consolidated
06/30/2015
12/31/2014
26,336
11,834
18,198
13,058
546
1,835
12,157
4,602
88,566
1,645,903
86,599
509,018
68,627
199
15,064
721
40
8,575
3,812
692,655
-
Parent
06/30/2015
12/31/2014
1,391
3,535
85
9,218
324
1,835
2,561
10,945
4,604
34,498
655,185
28,598
171,027
8,476
219
40
539
6,033
4,118
219,050
-
1,734,469
692,655
689,683
219,050
2,214
3
131
115
692,395
1,242,508
2,117,733
4,055,099
6,100
160,487
2,495
150
713,312
2,175,130
1,791,913
4,849,587
3,094
115
1,445,107
36,242
801,358
2,285,916
55,063
115
1,973,507
30,285
758,554
2,817,524
5,789,568
5,542,242
2,975,599
3,036,574
The accompanying notes are an integral part of these interim financial information.
3
BALANCE SHEETS
As of June 30, 2015
In thousands of Brazilian reais - R$
EQUITY AND LIABILITIES
CURRENT LIABILITIES
Trade payables
Borrowings and financing
Debentures
Taxes payable
Payroll and related taxes
Accounts payable - CCEE/Eletrobras
Provision for social and environmental costs
Other payables
Liabilities directly associated with assets classified as held for sale
Note
15
16
16
17
18
20
29
Total current liabilities
NONCURRENT LIABILITIES
Borrowings and financing
Debentures
Deferred taxes
Accounts payable - CCEE/Eletrobras
Provision for social and environmental costs
Provision for civil, tax and labor taxes
Total noncurrent liabilities
EQUITY
Capital
(-) Costs on issuance of shares
Capital reserve
Accumulated losses
Total equity
16
16
12
18
20
19
Consolidated
06/30/2015
12/31/2014
278,319
484,016
7,576
15,827
12,006
6,476
515
804,735
982,855
100,200
355,442
884
17,561
13,974
22,339
6,686
79
517,165
-
Parent
06/30/2015
12/31/2014
11,532
2,554
3,727
12,006
33
29,852
10,989
217
3,002
13,974
33
28,215
-
-
1,787,590
517,165
29,852
28,215
891,510
649,451
149
1,928
4,956
88
1,548,082
1,917,051
572,315
424
15,627
9,940
79
2,515,436
491,763
88
491,851
498,639
79
498,718
2,568,006
(41,757)
55,830
(128,183)
2,453,896
2,567,997
(41,757)
55,176
(71,775)
2,509,641
2,568,006
(41,757)
55,830
(128,183)
2,453,896
2,567,997
(41,757)
55,176
(71,775)
2,509,641
5,789,568
5,542,242
2,975,599
3,036,574
21
TOTAL LIABILITIES AND EQUITY
The accompanying notes are an integral part of these interim financial information.
4
INCOME STATEMENTS
As of June 30, 2015
In thousands of Brazilian reais - R$
Note
NET REVENUE
COST OF SERVICES
Depreciation
Operating costs
Charges on use of distribution system
Total
119,534
57,095
222,577
110,696
14, 23
(21,256)
(19,722)
(5,903)
(46,881)
(17,348)
(7,458)
(2,627)
(27,433)
(52,902)
(30,294)
(11,922)
(95,118)
(34,861)
(7,011)
(4,975)
(46,847)
72,653
29,662
127,459
63,849
(30,934)
(577)
(264)
(31,775)
(19,820)
(424)
(596)
(20,840)
(55,495)
(1,300)
(1,151)
(57,946)
(32,240)
(734)
(684)
(33,658)
(13,551)
(45,326)
(3,233)
(24,073)
(20,917)
(78,863)
(6,211)
(39,869)
27,327
5,589
48,596
23,980
8,687
(55,063)
(46,376)
19,144
(25,111)
(5,967)
18,904
(110,432)
(91,528)
26,155
(49,810)
(23,655)
(19,049)
(378)
(42,932)
(7,779)
(459)
(8,238)
(3,149)
205
(2,944)
(12,769)
(707)
(13,476)
(6,722)
331
(6,391)
(27,287)
(3,322)
(56,408)
(6,066)
23
14, 23
23
Share of profit (loss) of subsidiaries
Total
01/01/2014
to
06/30/2014
22
GROSS PROFIT
INCOME (EXPENSES)
General and administrative
Depreciation and amortization
Other expenses
04/01/2015
to
06/30/2015
Consilidated
04/01/2014
01/01/2015
to
to
06/30/2014
06/30/2015
13.3
PROFIT BEFORE
FINANCE INCOME (COSTS)
FINANCE INCOME (COSTS)
Finance income
Finance costs
Total
24
(LOSS) PROFIT BEFORE
INCOME TAX AND SOCIAL CONTRIBUTION
Income tax and social contribution - current
Income tax and social contribution - deferred
Total
12.1
25
325
LOSS FOR THE PERIOD
The accompanying notes are an integral part of these interim financial information.
5
INCOME STATEMENTS
As of June 30, 2015
In thousands of Brazilian reais - R$
Note
NET REVENUE
COST OF SERVICES
Depreciation
Operating costs
Total
22
14, 23
04/01/2015
to
06/30/2015
79
Parent
04/01/2014
01/01/2015
to
to
06/30/2014
06/30/2015
101
223
01/01/2014
to
06/30/2014
101
(1,239)
(184)
(1,423)
(451)
(40)
(491)
(2,297)
(299)
(2,596)
(833)
(40)
(873)
(1,344)
(390)
(2,373)
(772)
(21,656)
(656)
(238)
(22,550)
(13,000)
(420)
(596)
(14,016)
(42,372)
(1,290)
(1,015)
(44,677)
(23,143)
(727)
(777)
(24,647)
10,033
(12,517)
3,202
(10,814)
16,654
(28,023)
14,483
(10,164)
PROFIT BEFORE
FINANCE INCOME (COSTS)
(13,861)
(11,204)
(30,396)
(10,936)
FINANCE INCOME (COSTS)
Finance income
Finance costs
Total
1,093
(14,519)
(13,426)
14,290
(6,408)
7,882
4,099
(30,111)
(26,012)
17,247
(12,377)
4,870
(27,287)
(3,322)
(56,408)
(6,066)
23
GROSS PROFIT
INCOME (EXPENSES)
General and administrative
Depreciation and amortization
Other expenses
14, 23
23
Share of profit (loss) of subsidiaries
Total
13.3
24
(LOSS) PROFIT BEFORE
INCOME TAX AND SOCIAL CONTRIBUTION
Income tax and social contribution - current
Income tax and social contribution - deferred
Total
12.1
25
(27,287)
LOSS FOR THE YEAR
Loss per share (in Brazilian reais - R$)
Basic
Diluted
-
28
28
-
(3,322)
-
-
(56,408)
(6,066)
(0.177)
(0.177)
(0.026)
(0.026)
The accompanying notes are an integral part of these interim financial information.
6
STATEMENTS OF COMPREHENSIVE INCOME
As of June 30, 2015
In thousands of Brazilian reais - R$
04/01/2015
to
06/30/2015
Loss for the period
Other comprehensive income
TOTAL COMPREHENSIVE INCOME FOR THE PERIOD
(27,287)
-
(27,287)
Consolidated
04/01/2014
01/01/2015
to
to
06/30/2014
06/30/2015
(3,322)
-
(3,322)
(56,408)
-
(56,408)
Parent
01/01/2014
to
06/30/2014
(6,066)
-
(6,066)
04/01/2015
to
06/30/2015
(27,287)
-
(27,287)
04/01/2014
to
06/30/2014
(3,322)
-
(3,322)
01/01/2015
to
06/30/2015
(56,408)
-
(56,408)
01/01/2014
to
06/30/2014
(6,066)
-
(6,066)
The accompanying notes are an integral part of these interim financial information.
7
STATEMENTS OF CHANGES IN EQUITY
As of June 30, 2015
In thousands of Brazilian reais - R$
Capital
Note
BALANCES AT DECEMBER 31, 2013
Cost on
issuance
of shares
Paid-in
1,017,697
Capital increase - issuance of shares
Funds for future capital increase
Loss for the period
(36,112)
17
-
-
Capital reserve
Reserve of
benefits to
employees
settled with
equity
instruments
Goodwill
Accumulated
losses
1
(36,052)
-
-
-
(6,066)
810,129
810,129
-
1,017,714
(36,112)
55,066
1
(42,118)
BALANCES AT DECEMBER 31, 2014
2,567,997
(41,757)
55,175
1
(71,775)
654
-
-
(56,408)
55,829
1
(128,183)
BALANCES AT JUNE 30, 2015
21.b
26.4
9
2,568,006
(41,757)
Total
parent´s
equity
55,066
BALANCES AT JUNE 30, 2014
Capital increase - issuance of shares
Recognition of share-based payment
Loss for the period
Funds
for future
capital
increase
-
17
810,129
(6,066)
1,804,680
2,509,641
-
1,000,600
9
654
(56,408)
2,453,896
The accompanying notes are an integral part of these interim financial information.
8
STATEMENT OF CASH FLOWS
As of June 30, 2015
In thousands of Brazilian reais - R$
Note
CASH FLOWS FROM OPERATING ACTIVITIES
Loss for the period
Adjustments to reconcile loss to
cash provided by (used in) operating activities:
Depreciation
Finance charges on intragroup loans (net)
Residual value of fixed assets disposed of
Interest on debentures and borrowings
Recognition of costs on debentures and borrowings
Interst on short-term investments and collaterals
Provision CCEE/Eletrobras, net
Deferred taxes
Expense on share-based payment
Accured bonuses
Provision for social and environmental costs
Provision for civil, tax and labor taxes
Share of profit (loss) of subsidiaries
Consolidated
06/30/2015
06/30/2014
Parent
06/30/2015
06/30/2014
(56,408)
(6,066)
(56,408)
(6,066)
54,202
1,403
101,752
1,151
(18,270)
(19,999)
1,545
654
4,369
1,066
9
20,917
35,595
1,343
46,760
516
(14,974)
7,935
(717)
2,363
6,211
3,587
(75)
29,031
526
(4,024)
654
4,369
9
(16,654)
1,560
(342)
1,343
11,651
208
(5,859)
2,363
(14,483)
(Increase) decrease in operating assets:
Trade receivables
Recoverable taxes
Prepaid expenses
Advances to suppliers
Other receivables
27,154
(390)
111
(4,899)
(1,094)
(10,178)
(1,293)
(4,706)
(880)
(936)
(85)
(742)
(105)
(4,912)
(486)
(56)
539
(5,382)
233
(824)
Increase (decrease) in operating liabilities:
Trade payables
Taxes payable
Payroll and accrued vacation
Accounts payable - CCEE / Eletrobras
Other payables
3,101
10,147
(6,337)
(5,718)
448
4,334
4,818
(3,716)
(3,153)
170
543
725
(6,337)
-
1,490
1,303
(3,716)
3
(5,614)
(86,473)
-
(3,805)
(56,019)
-
(33,359)
-
15,310
22,827
3,602
(83,743)
(725)
Payment of income tax and social contribution
Payment of interest on borrowings and financing
Dividends received
14, 23
26
14
16.4
16.4
18.1
12
26.4
13.3
18.1
16.4
Net cash provided by (used in) operating activities
CASH FLOWS FROM INVESTING ACTIVITIES
Capital contribution in investees
Short-term investments
Collaterals and restricted deposits
Purchase of property, plant and equipment
Payment of property, plant and equipment purchased in prior years
Intragroup loans - granted
Intragroup loans - received
Net cash provided by (used) in investing activities
CASH FLOWS FROM FINANCING ACTIVITIES
Payments of shares
Funds for future capital increase
Borrowings and financing
Costs on debentures and borrowings
Borrowings repaid
Intragroup loans - receivable
Intragroup loans - payable
Net cash (used in) provided by financing activities
13.3
14, 32
21.b
16.4
16.4
16.4
(DECREASE) INCREASE IN CASH AND CASH EQUIVALENTS
Cash and cash equivalents at beginning of period
Cash and cash equivalents at end of period
(DECREASE) INCREASE IN CASH AND CASH EQUIVALENTS
479,210
(8,722)
(516,565)
(80,442)
(126,519)
(1)
(42,194)
(13,279)
(298,961)
(226,657)
(581,092)
(112,153)
171,516
(1,795)
(44,831)
(966)
53,010
64,781
(30,750)
(190,195)
453
(375,895)
(2,506)
64
(598,829)
9
383,958
(9,838)
(307,138)
66,991
17
810,129
14,946
(1,228)
(33,468)
790,396
9
(8,254)
(8,245)
17
810,129
44
(1)
810,189
(36,701)
212,906
(27,207)
210,635
86,599
49,898
132,598
345,504
28,598
1,391
110,686
321,321
(36,701)
212,906
(27,207)
210,635
The accompanying notes are an integral part of these interim financial information.
9
STATEMENTS OF VALUE ADDED
As of June 30, 2015
In thousands of Brazilian reais - R$
Note
REVENUE
Electric power sales
Revenue from construction of own assets
Parent
06/30/2015
06/30/2014
231,314
47,466
115,215
69,319
244
25,877
116
28,743
INPUTS ACQUIRED FROM THIRD PARTIES
Cost of sales
Materials, power, outside services and other
(44,558)
(36,850)
(11,986)
(26,302)
(299)
(24,637)
(40)
(17,301)
Gross value added
197,372
146,246
1,185
11,518
(54,202)
(35,595)
(3,587)
(1,560)
143,170
110,651
(2,402)
9,958
16,654
4,099
14,483
17,247
Depreciation and amortization
22
Consolidated
06/30/2015 06/30/2014
14, 23
NET WEALTH CREATED
WEALTH RECEIVED IN TRANSFER
Share of profit (loss) of subsidiaries
Finance income
TOTAL WEALTH TO BE DISTRIBUTED
13.3
(20,917)
22,819
(6,211)
31,942
145,072
136,382
18,351
41,688
17,955
6,700
3,897
1,520
14,372
2,660
2,916
1,119
17,955
6,700
3,897
1,520
14,372
2,660
2,916
1,119
25,921
-
15,198
4
5,023
-
3,968
4
Lessers and lessors:
Interest
Rentals
Other
139,264
2,039
4,184
102,332
1,255
2,592
36,650
2,035
979
20,860
1,255
600
Loss for the period
(56,408)
(56,408)
(6,066)
TOTAL WEALTH DISTRIBUTED
145,072
18,351
41,688
DISTRIBUTION OF WEALTH
Personnel
Payroll and related taxes
Management fees
Benefits
FGTS
Taxes and contributions:
Federal
(6,066)
136,382
The accompanying notes are an integral part of these interim financial information.
10
NOTES TO THE FINANCIAL STATEMENTS
As of June 30, 2015
In thousands of Brazilian reais - R$
1. General information
Renova Energia S.A. (“Renova” or “Company” or “Parent”) is a publicly-held company enrolled with CNPJ under
no. 08.534.605/0001-74, with shares traded at BM&FBOVESPA (“BOVESPA”) under the Corporate Governance
Level 2. Headquartered at Av. Roque Petroni Júnior, 999, 4o andar, City of São Paulo, State of São Paulo, the
Company is primarily engaged in the development, implementation and operation of projects for generation of
energy from renewable sources – wind, small hydroelectric plants (PCHs) and solar, and in the sale of power and
related activities. The Company’s corporate purposes are the generation and sale of power of all types,
manufacturing of fuel from natural and renewable sources, provision of logistics supporting services to companies
or environmental advisory companies, provision of advisory services for power solutions relating to the generation,
sale, transmission and other businesses involving alternative power sources, provision of engineering, construction
and logistics services, and development of studies and projects related to the power generation plants of all types
and systems, as well as the implementation, operation, maintenance and development, manufacturing and sale of
parts and equipment for power generation, transmission and distribution, operation in the electric power generation
market through solar power generation equipment, including, but not limited to, sale of solar power and equipment
for generation, transmission and distribution of solar power, processing of polysilicon, ingots, wafers, cells, panels,
modules and inverters, sale, lease, rental or other type for provision of power generation assets, and investment in
other companies’ capital.
As of June 30, 2015, the Company holds equity interests in the following direct and indirect subsidiaries which are
in the operating and preoperating stages and under construction (“Renova Group”):
Consolidation
PCH
Enerbras Centrais Elétricas S.A. (Holding)
(a) Full
Energética Serra da Prata S.A.
Renova PCH LT DA.
Chipley SP Participações S.A. (Holding)
(b) Full in Enerbras
(c) Full
(d) Full
Wind Farms
Nova Renova Energia S.A. (Holding)
Bahia Eólica Participações S.A. (Holding) (*)
Centrais Eólicas Candiba S.A.(*)
Centrais Eólicas Igaporã S.A. (*)
Centrais Eólicas Ilhéus S.A. (*)
Centrais Eólicas Licínio de Almeida S.A. (*)
Centrais Eólicas Pindaí S.A. (*)
C onsolidation
(e)
(e)
(f)
(f)
(f)
(f)
(f)
Full
Full in
Full in
Full in
Full in
Full in
Full in
Nova Renova
Bahia Eólica
Bahia Eólica
Bahia Eólica
Bahia Eólica
Bahia Eólica
Equity inte re st - %
06/30/2015
12/31/2014
Dire ct
Indire ct
Dire ct Indire ct
100.00
100.00
99.99
99.99
99.00
99.00
100.00
-
Equity inte re st - %
06/30/2015
12/31/2014
Dire ct
Indire ct
Dire ct Indire ct
99.99
99.99
100.00
100.00
99.99
99.99
99.99
99.99
99.99
99.99
99.99
99.99
99.99
99.99
- CONTINUED -
11
- CONTINUATION –
Wind Farms
Salvador Eólica Participações S.A. (Holding) (*)
Centrais Eólicas Alvorada S.A.(*)
Centrais Eólicas Guanambi S.A. (*)
Centrais Eólicas Guirapá S.A. (*)
Centrais Eólicas Nossa Senhora Conceição S.A.(*)
Centrais Eólicas Pajeú do Vento S.A.(*)
Centrais Eólicas Planaltina S.A. (*)
Centrais Eólicas Porto Seguro S.A.(*)
Centrais Eólicas Rio Verde S.A. (*)
Centrais Eólicas Serra do Salto S.A. (*)
Renova Eólica Participações S.A. (Holding)
Centrais Eólicas da Prata S.A.
Centrais Eólicas dos Araçás S.A.
Centrais Eólicas Morrão S.A.
Centrais Eólicas Seraíma S.A.
Centrais Eólicas T anque S.A.
Centrais Eólicas Ventos do Nordeste S.A.
Centrais Eólicas Ametista S.A.
Centrais Eólicas Borgo S.A.
Centrais Eólicas Caetité S.A.
Centrais Eólicas Dourados S.A.
Centrais Eólicas Espigão S.A.
Centrais Eólicas Maron S.A.
Centrais Eólicas Pelourinho S.A.
Centrais Eólicas Pilões S.A.
Centrais Eólicas Serra do Espinhaço S.A.
Alto Sertão Participações S.A. (Holding)
Diamantina Eólica Participações S.A. (Holding)
Centrais Eólicas São Salvador S.A.
Centrais Eólicas Abil S.A.
Centrais Eólicas Acácia S.A.
Centrais Eólicas Angico S.A.
Centrais Eólicas Folha da Serra S.A.
Centrais Eólicas Jabuticaba S.A.
Centrais Eólicas Jacarandá do Serrado S.A.
Centrais Eólicas T aboquinha S.A.
Centrais Eólicas T abua S.A.
Centrais Eólicas Vaqueta S.A.
Centrais Eólicas Unha d'Anta S.A.
Centrais Eólicas Cedro S.A.
Centrais Eólicas Vellozia S.A.
Centrais Eólicas Angelim S.A.
Centrais Eólicas Facheio S.A.
Centrais Eólicas Sabiu S.A.
Centrais Eólicas Barbatimão S.A.
Centrais Eólicas Juazeiro S.A.
Centrais Eólicas Jataí S.A.
Centrais Eólicas Imburana Macho S.A.
Centrais Eólicas Amescla S.A.
Centrais Eólicas Umbuzeiro S.A.
Centrais Eólicas Pau d'Água S.A.
Centrais Eólicas Manineiro S.A.
Consolidation
(e)
(f)
(f)
(f)
(f)
(f)
(f)
(f)
(f)
(f)
(e)
(g)
(g)
(g)
(g)
(g)
(g)
(h)
(h)
(h)
(h)
(h)
(h)
(h)
(h)
(h)
(e)
(e)
(i)
(j)
(j)
(j)
(j)
(j)
(j)
(j)
(j)
(j)
(k)
(k)
(k)
(k)
(k)
(k)
(k)
(k)
(k)
(k)
(k)
(k)
(k)
(k)
Full in
Full in
Full in
Full in
Full in
Full in
Full in
Full in
Full in
Full in
Full in
Full in
Full in
Full in
Full in
Full in
Full in
Full in
Full in
Full in
Full in
Full in
Full in
Full in
Full in
Full in
Full
Full in
Full in
Full in
Full in
Full in
Full in
Full in
Full in
Full in
Full in
Full in
Full in
Full in
Full in
Full in
Full in
Full in
Full in
Full in
Full in
Full in
Full in
Full in
Full in
Full in
Nova Renova
Salvador Eólica
Salvador Eólica
Salvador Eólica
Salvador Eólica
Salvador Eólica
Salvador Eólica
Salvador Eólica
Salvador Eólica
Salvador Eólica
Nova Renova
Renova Eólica
Renova Eólica
Renova Eólica
Renova Eólica
Renova Eólica
Renova Eólica
Renova Eólica
Renova Eólica
Renova Eólica
Renova Eólica
Renova Eólica
Renova Eólica
Renova Eólica
Renova Eólica
Renova Eólica
Alto Sertão
Diamantina
Diamantina
Diamantina
Diamantina
Diamantina
Diamantina
Diamantina
Diamantina
Diamantina
Diamantina
Diamantina
Diamantina
Diamantina
Diamantina
Diamantina
Diamantina
Diamantina
Diamantina
Diamantina
Diamantina
Diamantina
Diamantina
Diamantina
Diamantina
Equity inte re st - %
06/30/2015
12/31/2014
Dire ct
Indire ct
Dire ct Indire ct
100.00
100.00
99.99
99.99
99.99
99.99
99.99
99.99
99.99
99.99
99.99
99.99
99.99
99.99
99.99
99.99
99.99
99.99
99.99
99.99
100.00
100.00
99.99
99.99
99.99
99.99
99.99
99.99
99.99
99.99
99.99
99.99
99.99
99.99
99.99
99.99
99.99
99.99
99.99
99.99
99.99
99.99
99.99
99.99
99.99
99.99
99.99
99.99
99.99
99.99
99.99
99.99
99.99
99.99
99.99
99.99
99.99
100.00
99.99
100.00
99.99
100.00
99.99
100.00
99.99
100.00
99.99
100.00
99.99
100.00
99.99
100.00
99.99
100.00
99.99
99.00
99.99
99.00
99.99
99.00
99.99
99.99
99.00
99.99
99.00
99.99
99.99
99.99
99.00
99.99
99.99
99.99
99.00
99.99
99.00
99.99
99.00
-
- CONTINUED –
12
- CONTINUATION –
Wind Farms
Centrais Elétricas Botuquara S.A.
Centrais Eólicas Anísio T eixeira S.A.
Centrais Eólicas Cabeça de Frade S.A.
Centrais Eólicas Canjoão S.A.
Centrais Eólicas Carrancudo S.A.
Centrais Eólicas Conquista S.A.
Centrais Eólicas Coxilha Alta S.A.
Centrais Eólicas Ipê Amarelo S.A.
Centrais Eólicas Jequitiba S.A.
Centrais Eólicas Macambira S.A.
Centrais Eólicas T amboril S.A.
Centrais Eólicas T ingui S.A.
Centrais Eólicas Alcacuz S.A.
Centrais Eólicas Caliandra S.A.
Centrais Eólicas Cansanção S.A.
Centrais Eólicas Embiruçu S.A.
Centrais Eólicas Ico S.A.
Centrais Eólicas Imburana de Cabão S.A.
Centrais Eólicas Lençóis S.A.
Centrais Eólicas Putumuju S.A.
Centrais Elétricas Itaparica S.A.
Centrais Eólicas Bela Vista XIV LT DA.
Centrais Eólicas Bela Vista XV LT DA.
Centrais Eólicas Itapuã IV LT DA.
Centrais Eólicas Itapuã V LT DA.
Centrais Eólicas Itapuã VII LT DA.
Centrais Eólicas Itapuã XV LT DA.
Centrais Eólicas Itapuã XX LT DA.
Centrais Eólicas Umburanas 1 S.A.
Centrais Eólicas Umburanas 2 S.A.
Centrais Eólicas Umburanas 3 S.A.
Centrais Eólicas Umburanas 4 S.A.
Centrais Eólicas Umburanas 5 S.A.
Centrais Eólicas Umburanas 6 S.A.
Centrais Eólicas Umburanas 7 LT DA.
Centrais Eólicas Umburanas 8 LT DA.
Centrais Eólicas Umburanas 9 LT DA.
Centrais Eólicas Umburanas 10 LT DA.
Centrais Eólicas Umburanas 11 LT DA.
Centrais Eólicas Umburanas 12 LT DA.
Centrais Eólicas Umburanas 13 LT DA.
Centrais Eólicas Umburanas 14 LT DA.
Centrais Eólicas Umburanas 15 LT DA.
Centrais Eólicas Umburanas 16 LT DA.
Centrais Eólicas Umburanas 18 LT DA.
Powe r Sale
Renova Comercializadora de Energia S.A.
Full
Full
Full
Full
Full
Full
Full
Full
Full
Full
Full
Full
Full
Full
Full
Full
Full
Full
Full
Full
Full
Full
Full
Full
Full
Full
Full
Full
Full
Full
Full
Full
Full
Full
Full
Full
Full
Full
Full
Full
Full
Full
Full
Full
Full
Equity inte re st - %
06/30/2015
12/31/2014
Dire ct
Indire ct
Dire ct Indire ct
99.00
99.00
99.00
99.00
99.00
99.00
99.00
99.00
99.00
99.00
99.00
99.00
99.00
99.00
99.00
99.00
99.00
99.00
99.00
99.00
99.00
99.00
99.00
99.00
99.00
100.00
99.00
99.00
99.00
99.00
100.00
99.00
99.00
99.00
99.00
99.00
99.00
99.00
99.00
99.00
99.00
99.00
99.00
99.00
99.00
99.00
99.00
99.00
99.00
99.00
99.00
99.00
99.00
99.00
99.00
99.00
99.00
99.00
99.00
99.00
99.00
99.00
99.00
99.00
99.00
99.00
99.00
99.00
99.00
-
(l) Full
Equity inte re st - %
06/30/2015
12/31/2014
Dire ct
Indire ct
Dire ct Indire ct
100.00
100.00
-
(m) Full
Equity inte re st - %
06/30/2015
12/31/2014
Dire ct
Indire ct
Dire ct Indire ct
100.00
100.00
-
C onsolidation
(k)
(k)
(k)
(k)
(k)
(k)
(k)
(k)
(k)
(k)
(k)
(k)
(k)
(k)
(k)
(k)
(k)
(k)
(k)
(k)
(k)
(k)
(k)
(k)
(k)
(k)
(k)
(k)
(k)
(k)
(k)
(k)
(k)
(k)
(k)
(k)
(k)
(k)
(k)
(k)
(k)
(k)
(k)
(k)
(k)
C onsolidation
C onsolidation
Holding
Renovapar S.A.
13
PCH
Brasil PCH S.A.
Share d control
(not consolidate d)
(n) Indirect by Chipley
Equity inte re st - %
06/30/2015
12/31/2014
Dire ct
Indire ct
Dire ct Indire ct
51.00
-
(*) in May 2015 these investments were transferred to line of assets classified as held for sale, in the current assets (see note 29).
(a) Enerbras Centrais Elétricas S.A. (“Enerbras”), a direct subsidiary, is a privately-held company, headquartered
in the State of Bahia, exclusively engaged in holding equity interest in Energética Serra da Prata S.A.
(“Espra”).
(b) Energética Serra da Prata S.A. (“Espra”), an indirect subsidiary, is a privately-held company, exclusively
engaged in the generation and sale of electric power from Serra da Prata Hydroelectric Complex, which are
comprised of PCHs Cachoeira da Lixa, Colino I and Colino II, located in the State of Bahia. Under an
authorization regime, 100% of its production is contracted with Centrais Elétricas Brasileiras (“Eletrobras”), in
the context of the Alternative Electric Power Source Incentive Program (PROINFA). Espra started operations
in 2008.
(c) Renova PCH Ltda. (“Renova PCH”), a direct subsidiary, is mainly engaged in the construction,
implementation, operation, maintenance and generation of water source power. The company is in the
preoperating stage.
(d) Chipley SP Participações S.A. (“Chipley”) is a privately-held company, mainly engaged in holding equity
interests in other businesses, as partner or shareholder, which may include participating in consortia, and
operating, directly or indirectly, as the case may be, electric power services, encompassing generation systems
and other related services.
(e) Privately-held companies, headquartered in São Paulo, which are mainly engaged in holding equity interests in
other companies that operate, directly or indirectly, in the wind power generation.
(f) Privately-held companies which are mainly engaged in the design, implementation, development and operation
of specific wind farm, located in the State of Bahia. Under an authorization regime, 100% of its production is
contracted with the Electric Power Trade Chamber (“CCEE”), in the context of the Reserve Auction – 2009
(“LER 2009”).
(g) Privately-held companies which are mainly engaged in the design, implementation, development and operation
of specific wind farm, located in the State of Bahia. Under an authorization regime, 100% of its production is
contracted with CCEE, in the context of the Reserve Auction – 2010 (“LER 2010”).
(h) Privately-held companies which are mainly engaged in the design, implementation, development and operation
of specific wind farm, located in the State of Bahia. Under an authorization regime, 100% of its production is
contracted with those distributors which declared demand in the New Power Auction – 2011 (“LEN 2011 [A3]”).
(i) Centrais Eólicas São Salvador S.A. (“São Salvador”), direct subsidiary, is a privately-held company
specifically engaged in the design, implementation, development and operation of São Salvador wind farm,
located in the State of Bahia. Under an authorization regime, 1005 of its production is contracted with those
distributors which declared demand in the New Power Auction – 2012 (“LEN 2012 [A-5]). The wind farm is
under implementation.
14
(j) Direct subsidiaries which are mainly engaged in the design, implementation, development and operation of
specific wind farm, located in the State of Bahia. Under an authorization regime, 100% of its production is
contracted with CCEE, in the context of the Reserve Auction – 2013 (“LER 2013”). The wind farm is under
implementation.
(k) Direct subsidiaries which are mainly engaged in the construction, implementation, operation, maintenance and
generation of wind power. These companies are under implementation.
(l) Renova Comercializadora de Energia S.A. (“Renova Comercializadora”), a direct, wholly-owned subsidiary,
which is mainly engaged in the sale of power of all types.
(m) Renovapar S.A. (“Renovapar”), a direct subsidiary, wholly-owned subsidiary, is a privately-held company,
mainly engaged in holding equity interests in other companies which operate, directly or indirectly, in the
generation and sale of power of all types.
(n) Brasil PCH S.A. (“Brasil PCH”) is a privately-held company, mainly engaged in holding equity interests in
other businesses, as partner or shareholder, which may include conducting activities related to the management,
construction, planning, operation, maintenance and development of renewable electric power generation
projects through PCHs.
As required by CVM Instruction 381/03, we disclose that in the period ended June 30, 2015 independent auditors
Deloitte Touche Tohmatsu Auditores Independentes (“Deloitte”), which provides services to the Company and its
subsidiaries and jointly-controlled subsidiaries, did not conduct any services not related to external audit that
accounted for more than 5% of the annually contracted fees.
1.1 Admission of Cemig Geração e Transmissão S.A. (“CEMIG GT”) to the Company´s
controlling block
On September 29, 2014, CEMIG GT subscribed and paid in 87,186,035 common shares issued by Renova, in the
total amount of R$1,550,072, through the capitalization of an advance for future capital increase, in the amount of
R$810,129, made on March 31, 2014 and through the assignment to Renova of the amount relating to the advance
for future capital increase in Chipley on February 14, 2014, in the amount of R$739,943.
Upon the subscription and payment, a new Shareholders Agreement was entered into between Cemig GT, RR
Participações and Light Energia.
On October 27, 2014, the Company’s Board of Directors’ meeting approved the capital increase made by CEMIG
GT, which subscribed and paid in 87,186,035 common shares issued by Renova, in the total amount of
R$1,550,072, of which R$810,129 through the capitalization of the advance for future capital increase made in the
Company and R$739,943 through assignment to the Company of the advance for future capital increase made by
CEMIG GT in Chipley.
In addition to CEMIG GT, preemptive rights relating to 10,866 common shares were exercised by the Company’s
other shareholders, totaling 87,196,901 subscribed and paid-in common shares, in the total amount of R$1,550,265.
15
1.2 Acquisition of the shared control of Brasil PCH
As disclosed by Renova in the material facts issued on August 8, 2013 and October 28, 2013, the Company’s
subsidiary Chipley SP Participações S.A. acquired, on February 14, 2014, 51% of the shares in Brasil PCH, thus
sharing its control. Brasil PCH holds 13 small hydroelectric plants (PCHs), with an installed capacity of 291 MW
and average guaranteed power of 194 MW. All PCHs have long-term agreements (20 years) for the sale of electric
power in the context of PROINFA (physical information and information relating to power capacity measures not
revised by the independent auditors).
The total amount of the acquisition of Brazil PCH was R$754,906, which comprises: (i) R$739,943 paid on
February 14, 2014; (ii) R$23,522 paid on August 14, 2014 as a purchase price acquisition; less (iii) R$8,559 relating
to the recognition and receipt of dividends originally due to the sellers of the shares in Brasil PCH.
Because the company control is shared, Chipley’s equity interest in Brasil PCH is recorded under the equity
method, as required by IFRS 11 / CPC 19 (R2) – Joint Arrangements.
Additional information on the acquisition of jointly-controlled subsidiary Brasil PCH
a) Considerations transferred
Brasil
PCH
Considerations transferred:
Cash transferred in cash and cash equivalents directly to shareholders
Price adjustment
Dividends originally due to the sellers of shares in Brasil PCH
Net cash from acquisition
739,943
23,522
(8,559)
754,906
b) Allocation of purchase price
The acquisition value paid was allocated to Brasil PCH’s assets and liabilities at fair values, including those
intangible assets associated to the right to operate each authorization, which will be amortized over the remaining
terms of the authorizations for the PCHs acquired. Consequently, as total amount paid was allocated to identifiable
assets and liabilities, no residual value was allocated to goodwill.
The purchase price allocation in accordance with the standards applicable to business combinations was made in the
fourth quarter of 2014 and was supported by a business appraisal report prepared by an independent firm in
conjunction with analyses conducted by the Company’s management. The acquisition of Brasil PCH was initially
accounted for as of January 31, 2014, and the fair value of Brasil PCH’s assets and liabilities as of the acquisition
date is shown below:
Brasil
PCH
Assets
Cash and cash equivalents
131,139
Trade receivables
34,047
Property, plant and equipment
1,593,984
Intangible assets - concession arrangement
1,785,877
Other assets
118,517
Total assets
3,663,564
16
Liabilities and equity
Trade payables
Borrowings and financing
Deferred taxes
Other liabilities
11.017
1,327,522
687,101
157,716
Equity
1,480,208
Total liabilities and equity
3,663,564
1.3 Commercial operation of wind farms under LER 2010 and LEN 2011 (A-3)
The Reserve Power Agreements sets forth that the wind farms under LER 2010 shall start commercial operations on
September 1, 2013. However, ANEEL Decision 1317, of April 28, 2014, changed this date so that it could coincide
with the date on which Igaporã II Substation, under the responsibility of Companhia Hidro Elétrica do São
Francisco (“Chesf”), starts commercial operations, granted an additional term of 30 days for the wind farms to start
commercial operations, as from the date Igaporã II Substation starts commercial operations, and maintained the
original date for ending the supply period under the agreement.
In March 2014, the Company reversed the provisions previously recognized to meet the reimbursement amount due
by the SPEs (clause 11 of the Reserve Power Agreement), in the amount of R$7,399, recorded in balance sheet line
item Trade payables – CCEE/Eletrobras, R$4,645 out of which relating to the year ended December 31, 2014 (see
note 23).
For the New Power Agreements under LEN 2011 (A-3), ANEEL Decision 571, of March 11, 2014, changed the
starting supply date of CCEARs so that it could coincide with the date on which the transmission facilities under
Concession Arrangement 19/2012 start commercial operations, granted an additional term of 30 days for starting
commercial activities, as from the date the transmission facilities are made available, and maintained the supply
period of 19 years and 10 months under the agreement.
The wind farms under LER 2010 started commercial operations on October 11, 2014, under ANEEL Decision 4108.
On March 4, 2015, four, out of the nine, farms which traded power under LEN 2011 (A-3) started commercial
operations connected to the same transmission line as that which serves the farms under LER 2009 and LER 2010
(Igaporã II). The other five farms will be connected to Igaporã III line, which, according to the Transmission
Projects Schedule (SIGET/ANEEL), is scheduled to be delivered on September 30, 2015.
1.4 Impact of new laws
1.4.1 Provisional Act 627/2013 (“MP 627”) – Law 12973/2014
On November 11, 2013, MP 627 was enacted and significantly changed the income tax and social contribution
rules, among others. The provisions set forth in MP 627 will become mandatory beginning calendar year 2015, with
early adoption beginning 2014 being allowed.
Management analyzed the tax effects of new provisions and concluded that the distributions of dividends and/or
interest on capital were not greater than those recorded in accordance with accounting methods and criteria effective
as at December 31, 2007. Accordingly, according to Management, no additional tax charges will be recorded in
addition to the profit sharing over the last five years. Management elected to early adopt such rules beginning
calendar year 2014.
17
MP 627 was converted into Law 12973, of May 13, 2014.
1.5 Net working capital
On September 30, 2014, the consolidated current liabilities of the Company is R$1,787,590, while the current assets
is R$1,734,469. The negative working capital is due mainly to the bridge loan signed with BNDES of R$418,000.
The bridge loan matures on June 15, 2016 or in long-term financing agreement for the disbursement date to be
signed between BNDES and the Company, whichever comes first.
The Company's management has been conducting actions in order to improve its financial structure and working
capital that include structuring loans with longer appropriate to the current needs and deadlines. The Company is in
final arrangements for framing next to the stretching BNDES of its debt through long-term financing contract,
which will replace the bridge loans taken from BNDES.
In addition, the Company also announced the approval of the transaction with Global Terraform, divided into two
phases (Phase I and Phase II). In Phase I, approved the entering into purchase and sale agreements amounting to
R$587,000 and stock exchange agreement in the amount of R$1,026,000. In Phase II, it approved the entering into
swap agreements in the amount of R$13,400,000 (notes 29, 33.1 and 33.2).
2. Basis of preparation
2.1 Statement of compliance
The individual financial statements have been prepared in accordance with accounting practices adopted in Brazil
(“BR GAAP”), according to guidelines issued by the Accounting Pronouncements Committee (“CPC”) (especially
CPC 21 (R1) – Interim Financial Statements) and the standards set forth by the Brazilian Securities and Exchange
Commission (“CVM”).
The consolidated financial statements have been prepared in accordance with accounting practices adopted in Brazil
(“BR GAAP”) and with the International Financial Reporting Standards ("IFRS") issued by the International
Accounting Standards Board (IASB). They were prepared and are presented in accordance with CPC 21 (R1) and
IAS 34 and the standards set forth by the Brazilian Securities and Exchange Commission (CVM).
The Company also follows the guidance in the Accounting Manual for the Brazilian Electricity Industry and
standards established by ANEEL.
The accounting practices and criteria adopted in the preparation of these interim financial statements are consistent
with those adopted in preparing the financial statements of December 31, 2014.
The issue of individual and consolidated interim financial information, expressed in thousands of reais and rounded
to the nearest thousand, unless other stated, were approved for issuance, filing with CVM and submittal to the
Annual Shareholders Meeting, as authorized by the Board of Directors, on August 4, 2015.
18
2.2 Basis of preparation, basis for measurement and significant accounting practices
The remaining information related to the basis for preparation, presentation of the Interim Financial Information and
summary of significant accounting practices have not suffered relevant alterations in relation to those disclosed in
note 2 to the annual financial statements for the year ended December 31, 2014, published on March 5, 2015 in the
newspapers Valor Econômico, Diário Oficial de São Paulo and made available by means of the following electronic
sites: www.cvm.gov.br, www.bmfbovespa.com.br, www.renovaenergia.com.br/ri .
For the Accounting Pronouncements and Interpretation that were prevailing as at December 31, 2014, there were no
significant alterations for these interim financial statements in relation to those disclosed in Note 2 to the financial
statements as at December 31, 2014.
For accounting Pronouncements and Interpretations that prevail as of January 1, 2015, as disclosed in note 2 to the
financial statements for the year ended December 31, 2014, there are not relevant impacts for the Company,
subsidiaries or jointly-owned subsidiaries.
3. Basis of consolidation
The financial statements of the subsidiaries referred to in note 1 were consolidated.
The main consolidation procedures are as follows:
• elimination of intercompany asset and liability balances between consolidated companies;
• elimination of the Parent’s interests in the equity of its subsidiaries, directly and indirectly;
• elimination of revenues and expenses and finance costs between the consolidated companies.
19
4. Authorizations
4.1. Regulated market (ACR)
Ref. Contract
ANEEL Resolution
Resolution date
Authorized
period
Installed
production capacity*
PROINFA
PROINFA
PROINFA
697
695
703
12/24/2003
12/24/2003
12/24/2003
30 years
30 years
30 years
14.80 MW
16.00 MW
11.00 MW
Wind Farms
Ref. Contract
MME Ordinance
Ordinance date
Authorized
period
Installed
production capacity*
Centrais Eólicas Alvorada S.A.
Centrais Eólicas Candiba S.A.
Centrais Eólicas Guanambi S.A.
Centrais Eólicas Guirapá S.A.
Centrais Eólicas Igaporã S.A.
Centrais Eólicas Ilhéus S.A.
Centrais Eólicas Licínio de Almeida S.A.
Centrais Eólicas Nossa Senhora Conceição S.A.
Centrais Eólicas Pajeú do Vento S.A.
Centrais Eólicas Pindaí S.A.
Centrais Eólicas Planaltina S.A.
Centrais Eólicas Porto Seguro S.A.
Centrais Eólicas Rio Verde S.A.
Centrais Eólicas Serra do Salto S.A.
Centrais Eólicas Morrão S.A.
Centrais Eólicas da Prata S.A.
Centrais Eólicas dos Araçás S.A.
Centrais Eólicas Seraíma S.A.
Centrais Eólicas Tanque S.A.
Centrais Eólicas Ventos do Nordeste S.A.
Centrais Eólicas Ametista S.A.
Centrais Eólicas Borgo S.A.
Centrais Eólicas Caetité S.A.
Centrais Eólicas Dourados S.A.
Centrais Eólicas Espigão S.A.
Centrais Eólicas Maron S.A.
Centrais Eólicas Pelourinho S.A.
Centrais Eólicas Pilões S.A.
Centrais Eólicas Serra do Espinhaço S.A.
Centrais Eólicas São Salvador S.A.
Centrais Eólicas Abil S.A.
Centrais Eólicas Acácia S.A.
Centrais Eólicas Angico S.A.
Centrais Eólicas Folha de Serra S.A.
Centrais Eólicas Jabuticaba S.A.
Centrais Eólicas Jacaranda do Cerrado S.A.
Centrais Eólicas Taboquinha S.A.
Centrais Eólicas Tabua S.A.
Centrais Eólicas Vaqueta S.A.
Centrais Eólicas Umburanas 1 S.A. (Umburanas 1)
Centrais Eólicas Umburanas 1 S.A. (Umburanas 2)
Centrais Eólicas Umburanas 1 S.A. (Umburanas 3)
Centrais Eólicas Umburanas 2 S.A. (Umburanas 4)
Centrais Eólicas Umburanas 2 S.A. (Umburanas 5)
Centrais Eólicas Umburanas 2 S.A. (Umburanas 6)
Centrais Eólicas Umburanas 3 S.A. (Umburanas 7)
Centrais Eólicas Umburanas 3 S.A. (Umburanas 8)
Centrais Eólicas Umburanas 3 S.A. (Umburanas 9)
LER 03/2009
LER 03/2009
LER 03/2009
LER 03/2009
LER 03/2009
LER 03/2009
LER 03/2009
LER 03/2009
LER 03/2009
LER 03/2009
LER 03/2009
LER 03/2009
LER 03/2009
LER 03/2009
LER 05/2010
LER 05/2010
LER 05/2010
LER 05/2010
LER 05/2010
LER 05/2010
LEN 02/2011
LEN 02/2011
LEN 02/2011
LEN 02/2011
LEN 02/2011
LEN 02/2011
LEN 02/2011
LEN 02/2011
LEN 02/2011
LEN 06/2012
LER 05/2013
LER 05/2013
LER 05/2013
LER 05/2013
LER 05/2013
LER 05/2013
LER 05/2013
LER 05/2013
LER 05/2013
LEN 10/2013
LEN 10/2013
LEN 10/2013
LEN 10/2013
LEN 10/2013
LEN 10/2013
LEN 10/2013
LEN 10/2013
LEN 10/2013
695
691
700
743
696
690
692
693
694
699
697
698
742
689
268
177
241
332
330
161
135
222
167
130
172
107
168
128
171
162
109
123
111
115
113
116
114
110
132
390
397
398
388
389
415
550
551
400
08/05/2010
08/05/2010
08/06/2010
08/19/2010
08/05/2010
08/05/2010
08/05/2010
08/05/2010
08/05/2010
08/05/2010
08/05/2010
08/05/2010
08/19/2010
08/05/2010
04/20/2011
03/25/2011
04/07/2011
05/27/2011
05/26/2011
03/18/2011
03/14/2012
04/13/2012
03/21/2012
03/13/2012
03/22/2012
03/08/2012
03/21/2012
03/13/2012
03/22/2012
05/22/2013
03/19/2014
03/24/2014
03/19/2014
03/19/2014
03/19/2014
03/19/2014
03/19/2014
03/19/2014
03/28/2014
08/01/2014
08/04/2014
08/04/2014
08/01/2014
08/04/2014
08/12/2014
11/27/2013
11/27/2013
08/04/2014
35 years
35 years
35 years
35 years
35 years
35 years
35 years
35 years
35 years
35 years
35 years
35 years
35 years
35 years
35 years
35 years
35 years
35 years
35 years
35 years
35 years
35 years
35 years
35 years
35 years
35 years
35 years
35 years
35 years
35 years
35 years
35 years
35 years
35 years
35 years
35 years
35 years
35 years
35 years
35 years
35 years
35 years
35 years
35 years
35 years
35 years
35 years
35 years
8.00 MW
9.60 MW
20.80 MW
28.80 MW
30.40 MW
11.20 MW
24.00 MW
28.80 MW
25.60 MW
24.00 MW
27.20 MW
6.40 MW
30.40 MW
19.20 MW
30.24 MW
21.84 MW
31.86 MW
30.24 MW
30.00 MW
23.52 MW
28.56 MW
20.16 MW
30.24 MW
28.56 MW
10.08 MW
30.24 MW
21.84 MW
30.24 MW
18.48 MW
22.40 MW
23.70 MW
16.20 MW
8.10 MW
21.00 MW
9.00 MW
21.00 MW
21.60 MW
15.00 MW
23.40 MW
27.00 MW
27.00 MW
18.90 MW
18.90 MW
18.90 MW
21.60 MW
24.30 MW
24.30 MW
18.00 MW
PCH
Cachoeira da Lixa
Colino 2
Colino 1
20
- CONTINUED - CONTINUATION –
Wind Farms
Centrais
Centrais
Centrais
Centrais
Centrais
Centrais
Centrais
Centrais
Centrais
Centrais
Centrais
Eólicas
Eólicas
Eólicas
Eólicas
Eólicas
Eólicas
Eólicas
Eólicas
Eólicas
Eólicas
Eólicas
Umburanas 4 S.A. (Umburanas 10)
Umburanas 4 S.A. (Umburanas 11)
Umburanas 4 S.A. (Umburanas 12)
Umburanas 5 S.A. (Umburanas 13)
Umburanas 5 S.A. (Umburanas 14)
Umburanas 5 S.A. (Umburanas 15)
Umburanas 6 S.A. (Umburanas 16)
Umburanas 6 S.A. (Umburanas 18)
Itapuã VII Ltda. (EOL Mulungu)
Itapuã VII Ltda. (EOL Quina)
Itapuã VII Ltda. (EOL Pau Santo)
UFV (Usina Fotovoltaica)
Centrais Eólicas Itapuã IV Ltda. (UFV Caetité I)
Centrais Eólicas Itapuã IV Ltda. (UFV Caetité II)
Centrais Eólicas Itapuã V Ltda. (UFV Caetité IV)
Centrais Eólicas Itapuã V Ltda. (UFV Caetité V)
Ref. Contract
MME Ordinance
Ordinance date
Authorized
period
Installed
production capacity*
LEN 10/2013
LEN 10/2013
LEN 10/2013
LEN 10/2013
LEN 10/2013
LEN 10/2013
LEN 10/2013
LEN 10/2013
LER 2014
LER 2014
LER 2014
399
407
433
434
435
436
437
438
241
242
285
08/04/2014
08/08/2014
08/21/2014
08/21/2014
08/21/2014
08/21/2014
08/21/2014
08/21/2014
06/01/2015
06/01/2015
06/26/2015
35 years
35 years
35 years
35 years
35 years
35 years
35 years
35 years
35 years
35 years
35 years
21.00 MW
15.00 MW
22.80 MW
18.90 MW
24.90 MW
18.90 MW
27.00 MW
8.10 MW
14.7 MW
10.80 MW
18.00 MW
Ref. Contract
LER 2014 (Leilão 08/2014)
LER 2014 (Leilão 08/2014)
LER 2014 (Leilão 08/2014)
LER 2014 (Leilão 08/2014)
MME Ordinance
246
245
244
243
Ordinance date
06/01/2015
06/01/2015
06/01/2015
06/01/2015
Authorized
period
35 years
35 years
35 years
35 years
Installed
production capacity*
29.75 MW
29.75 MW
29.75 MW
10.5 MW
Ref. Contract
MME Ordinance
Ordinance date
Authorized
period
Installed
production capacity*
ACL
ACL
ACL
ACL
ACL
ACL
ACL
ACL
ACL
ACL
ACL
ACL
ACL
ACL
ACL
ACL
ACL
ACL
ACL
ACL
ACL
ACL
ACL
ACL
ACL
ACL
ACL
5099
5092
5093
5098
5085
5081
5088
5084
5091
5096
5087
5124
5128
5125
5126
5094
5090
5101
5086
5089
5102
5170
5097
5100
5083
5095
5082
03/26/2015
03/26/2015
03/26/2015
03/26/2015
03/26/2015
03/26/2015
03/26/2015
03/26/2015
03/26/2015
03/26/2015
03/26/2015
04/01/2015
04/01/2015
04/01/2015
04/01/2015
03/26/2015
03/26/2015
03/26/2015
03/26/2015
03/26/2015
03/26/2015
04/27/2015
03/26/2015
03/26/2015
03/26/2015
03/26/2015
03/26/2015
35 years
35 years
35 years
35 years
35 years
35 years
35 years
35 years
35 years
35 years
35 years
35 years
35 years
35 years
35 years
35 years
35 years
35 years
35 years
35 years
35 years
35 years
35 years
35 years
35 years
35 years
35 years
13.5 MW
21.6 MW
16.2 MW
16.5 MW
16.2 MW
16.2 MW
18.9 MW
13.5 MW
21.6 MW
13.5 MW
21.9 MW
8.1 MW
13.5 MW
14.4 MW
18 MW
13.5 MW
5.7 MW
21.6 MW
6 MW
18.9 MW
24.3 MW
19.2 MW
18 MW
8.1 MW
21.6 MW
27 MW
18.9 MW
4.2. Free-trading market (ACL)
Wind Farms
Centrais
Centrais
Centrais
Centrais
Centrais
Centrais
Centrais
Centrais
Centrais
Centrais
Centrais
Centrais
Centrais
Centrais
Centrais
Centrais
Centrais
Centrais
Centrais
Centrais
Centrais
Centrais
Centrais
Centrais
Centrais
Centrais
Centrais
Eólicas Amescla S.A.
Eólicas Angelim S.A.
Eólicas Barbatimão S.A.
Eólicas Facheio S.A.
Eólicas Imburana Macho S.A.
Eólicas Jataí S.A.
Eólicas Juazeiro S.A.
Eólicas Sabiu S.A.
Eólicas Umbuzeiro S.A.
Eólicas Unha d'Anta S.A.
Eólicas Vellozia S.A.
Elétricas Itaparica S.A.
Elétricas Itaparica S.A.
Eólicas Manineiro S.A.
Eólicas Pau D'Água S.A.
Eólicas Arapuã Ltda.
Eólicas Bela Vista I Ltda.
Eólicas Botuquara Ltda.
Eólicas Canjoão S.A.
Eólicas Carrancudo S.A.
Eólicas Conquista Ltda.
Eólicas Coxilha Alta Ltda.
Eólicas Ipê Amarelo S.A.
Eólicas Jequitibá S.A
Eólicas Macambira S.A.
Eólicas Tamboril S.A.
Eólicas Tingui S.A.
- CONTINUED -
21
-CONTINUATIONWind Farms
Centrais
Centrais
Centrais
Centrais
Centrais
Centrais
Centrais
Centrais
Eólicas
Eólicas
Eólicas
Eólicas
Eólicas
Eólicas
Eólicas
Eólicas
Ref. Contract
MME Ordinance
Ordinance date
Authorized
period
Installed
production capacity*
ACL
ACL
ACL
ACL
ACL
ACL
ACL
ACL
5118
5119
5121
5122
5123
5171
5127
5120
04/01/2015
04/01/2015
04/01/2015
04/01/2015
04/01/2015
04/27/2015
04/01/2015
04/01/2015
35 years
35 years
35 years
35 years
35 years
35 years
35 years
35 years
18.9 MW
5.4 MW
6 MW
10.8 MW
20.1 MW
10.8 MW
14.7 MW
14.7 MW
Alcaçuz S.A.
Caliandra S.A.
Embiruçu S.A.
Ico S.A.
Imburana de Cabão S.A.
Lençóis Ltda.
Putumuju S.A.
Recôncavo I Ltda.
(*) Information not reviewed by independent auditors
5. Power sale
5.1. Regulated market (ACR)
Group company
Ref. Contract
S mall hydroelectric plants:
Caxoeira da Lixa
Colino1
Colino2
PROINFA
PROINFA
PROINFA
Wind power generation
Centrais Eólicas Alvorada S.A.
Centrais Eólicas Candiba S.A.
Centrais Eólicas Guanambi S.A.
Centrais Eólicas Guirapá S.A.
Centrais Eólicas Igaporã S.A.
Centrais Eólicas Ilhéus S.A.
Centrais Eólicas Licínio de Almeida S.A.
Centrais Eólicas NS Sr. Conceição S.A.
Centrais Eólicas Pajeú do Vento S.A.
Centrais Eólicas Pindaí S.A.
Centrais Eólicas Planaltina S.A.
Centrais Eólicas Porto Seguro S.A.
Centrais Eólicas Rio Verde S.A.
Centrais Eólicas Serra do Salto S.A.
Buyer
Amounts
Annual p ower
Original contract
contracted
amount
(MWh)
Historical
price
M Wh
(R$)
Adjusted
price
M Wh
(R$)
Effective Term
Inflation
Tariff
adjustment adjustment
Final
index
month
Initial
Eletrobras
Eletrobras
Eletrobras
172,450
153,243
219,008
65,349
87,337
61,057
121.35
121.35
121.35
217.41
217.41
217.41
M ay 2008
Sep 2008
July 2008
April 2028
Aug 2028
June 2008
IGP-M
IGP-M
IGP-M
June
June
June
LER 03/2009
LER 03/2009
LER 03/2009
LER 03/2009
LER 03/2009
LER 03/2009
LER 03/2009
LER 03/2009
LER 03/2009
LER 03/2009
LER 03/2009
LER 03/2009
LER 03/2009
LER 03/2009
CCEE
CCEE
CCEE
CCEE
CCEE
CCEE
CCEE
CCEE
CCEE
CCEE
CCEE
CCEE
CCEE
CCEE
76,233
101,644
203,287
330,341
334,900
128,808
254,109
309,138
283,377
279,520
309,138
51,523
406,574
177,876
26,280
35,040
70,080
113,880
113,880
43,800
87,600
105,120
96,360
96,360
105,120
17,520
140,160
61,320
144.94
144.94
144.94
144.94
146.94
146.94
144.94
146.94
146.94
144.94
146.94
146.94
144.94
144.94
190.12
190.12
190.12
190.12
192.75
192.75
190.12
192.75
192.75
190.12
192.75
192.75
190.12
190.12
July
July
July
July
July
July
July
July
July
July
July
July
July
July
June 2032
June 2032
June 2032
June 2032
June 2032
June 2032
June 2032
June 2032
June 2032
June 2032
June 2032
June 2032
June 2032
June 2032
IPCA
IPCA
IPCA
IPCA
IPCA
IPCA
IPCA
IPCA
IPCA
IPCA
IPCA
IPCA
IPCA
IPCA
July
July
July
July
July
July
July
July
July
July
July
July
July
July
LER 05/2010
LER 05/2010
LER 05/2010
LER 05/2010
LER 05/2010
LER 05/2010
CCEE
CCEE
214,701
295,480
88,476
121,764
121.25
121.25
154.69
154.69
Aug 2033
Aug 2033
IPCA
IPCA
September
September
CCEE
312,486
128,772
121.25
154.69
Nov 2014
Nov 2014(**)
Aug 2033
IPCA
September
CCEE
325,241
134,028
121.25
154.69
Nov 2014(**)
Aug 2033
IPCA
September
CCEE
295,480
121,764
121.25
154.69
Nov 2014(**)
Aug 2033
IPCA
September
CCEE
214,701
88,476
121.25
154.69
Nov 2014(**)
Aug 2033
IPCA
September
Distributors
238,148
121,764
101.53
109.61
Feb 15 (**)
April 2035
IPCA
January
Distributors
166,189
84,972
100.73
108.74
July 15 (**)
April 2035
IPCA
January
Distributors
245,001
125,268
100.90
108.92
July 15 (**)
April 2035
IPCA
January
Distributors
226,155
115,632
100.87
108.89
Feb 15 (**)
April 2035
IPCA
January
Distributors
83,951
42,924
102.07
110.19
July 15
(**)
April 2035
IPCA
January
Distributors
Distributors
236,434
202,168
120,888
103,368
101.32
101.23
109.37
109.28
Feb 15
(**)
IPCA
IPCA
January
January
Distributors
224,441
114,756
100.09
108.05
July 15
Feb 15 (**)
April 2035
April 2035
April 2035
IPCA
January
Centrais Eólicas Serra do Espinhaço S.A.(*)
LEN 02/2011
LEN 02/2011
LEN 02/2011
LEN 02/2011
LEN 02/2011
LEN 02/2011
LEN 02/2011
LEN 02/2011
LEN 02/2011
Distributors
152,483
77,964
99.69
107.62
Jul 15 (**)
April 2035
IPCA
January
Centrais Eólicas São Salvador S.A.
LEN 06/2012
Distributors
158,583
89,352
88.68
90.07
Jan 2017
Dec 2036
IPCA
January
Centrais Eólicas da Prata S.A.
Centrais Eólicas dos Araçás S.A.
Centrais Eólicas M orrão S.A.
Centrais Eólicas Seraíma S.A.
Centrais Eólicas Tanque S.A.
Centrais Eólicas Ventos do Nordeste S.A.
Centrais Eólicas Ametista S.A.(*)
Centrais Eólicas Borgo S.A.(*)
Centrais Eólicas Caetité S.A.(*)
Centrais Eólicas Dourados S.A.(*)
Centrais Eólicas Espigão S.A.(*)
Centrais Eólicas M aron S.A.(*)
Centrais Eólicas Pelourinho S.A.(*)
Centrais Eólicas Pilões S.A.(*)
2012
2012
2012
2012
2012
2012
2012
2012
2012
2012
2012
2012
2012
2012
Nov 2014
(**)
(**)
(**)
- CONTINUED -
22
- CONTINUATION –
Group company
Centrais Eólicas
Centrais Eólicas
Centrais Eólicas
Centrais Eólicas
Centrais Eólicas
Centrais Eólicas
Centrais Eólicas
Centrais Eólicas
Centrais Eólicas
Abil S.A.
Acácia S.A.
Angico S.A.
Folha de Serra S.A.
Jabuticaba S.A.
Jacaranda do Cerrado S.A.
Taboquinha S.A.
Tabua S.A.
Vaqueta S.A.
CRNV&M (Umburanas
CRNV&M (Umburanas
CRNV&M (Umburanas
CRNV&M (Umburanas
CRNV&M (Umburanas
CRNV&M (Umburanas
CRNV&M (Umburanas
CRNV&M (Umburanas
CRNV&M (Umburanas
CRNV&M (Umburanas
CRNV&M (Umburanas
CRNV&M (Umburanas
CRNV&M (Umburanas
CRNV&M (Umburanas
CRNV&M (Umburanas
CRNV&M (Umburanas
CRNV&M (Umburanas
1) (*)
2) (*)
3) (*)
4) (*)
5) (*)
6) (*)
7) (*)
8) (*)
9) (*)
10) (*)
11) (*)
12) (*)
13) (*)
14) (*)
15) (*)
16) (*)
18) (*)
Amounts
Annual p ower
Original contract
contracted
amount
(MWh)
Ref. Contract
Buyer
LER 05/2013
LER 05/2013
LER 05/2013
LER 05/2013
LER 05/2013
LER 05/2013
LER 05/2013
LER 05/2013
LER 05/2013
CCEE
CCEE
CCEE
CCEE
CCEE
CCEE
CCEE
CCEE
CCEE
202,880
136,979
75,789
175,459
82,011
172,488
186,909
135,406
197,191
LEN 10/2013
LEN 10/2013
LEN 10/2013
LEN 10/2013
LEN 10/2013
LEN 10/2013
LEN 10/2013
LEN 10/2013
LEN 10/2013
LEN 10/2013
LEN 10/2013
LEN 10/2013
LEN 10/2013
LEN 10/2013
LEN 10/2013
LEN 10/2013
LEN 10/2013
Distributors
Distributors
Distributors
Distributors
Distributors
Distributors
Distributors
Distributors
Distributors
Distributors
Distributors
Distributors
Distributors
Distributors
Distributors
Distributors
Distributors
98,245
99,774
83,590
82,621
81,692
71,979
28,764
28,169
72,059
82,967
67,410
92,611
81,843
108,051
81,086
97,626
35,807
96,360
60,444
34,164
84,972
39,420
83,220
88,476
64,824
93,732
123,516
121,764
85,848
84,972
81,468
98,988
98,988
109,500
75,336
91,104
63,072
102,492
87,600
104,244
82,344
111,252
36,792
Effective Term
Inflation
Tariff
adjustment adjustment
Final
index
month
Historical
price
M Wh
(R$)
Adjusted
price
M Wh
(R$)
105.20
113.70
111.30
103.60
104.38
103.99
105.99
104.80
105.55
112.05
121.11
118.55
110.35
111.18
110.76
112.89
111.63
112.42
Sep
Sep
Sep
Sep
Sep
Sep
Sep
Sep
Sep
2015
2015
2015
2015
2015
2015
2015
2015
2015
Aug 2035
Aug 2035
Aug 2035
Aug 2035
Aug 2035
Aug 2035
Aug 2035
Aug 2035
Aug 2035
IPCA
IPCA
IPCA
IPCA
IPCA
IPCA
IPCA
IPCA
IPCA
September
September
September
September
September
September
September
September
September
119.83
119.80
120.92
121.46
121.60
120.27
121.52
119.43
121.95
119.87
120.85
120.15
119.93
121.30
121.41
121.60
120.64
119.83
119.80
120.92
121.46
121.60
120.27
121.52
119.43
121.95
119.87
120.85
120.15
119.93
121.30
121.41
121.60
120.64
M ay
M ay
M ay
M ay
M ay
M ay
M ay
M ay
M ay
M ay
M ay
M ay
M ay
M ay
M ay
M ay
M ay
2018
2018
2018
2018
2018
2018
2018
2018
2018
2018
2018
2018
2018
2018
2018
2018
2018
Dec 2037
Dec 2037
Dec 2037
Dec 2037
Dec 2037
Dec 2037
Dec 2037
Dec 2037
Dec 2037
Dec 2037
Dec 2037
Dec 2037
Dec 2037
Dec 2037
Dec 2037
Dec 2037
Dec 2037
IPCA
IPCA
IPCA
IPCA
IPCA
IPCA
IPCA
IPCA
IPCA
IPCA
IPCA
IPCA
IPCA
IPCA
IPCA
IPCA
IPCA
January
January
January
January
January
January
January
January
January
January
January
January
January
January
January
January
January
Initial
* The p rice includes ICB (Benefit Cost Index) and CEC (Short-term Economic Cost).
** Original date pursuant to Decision 1317, dated April 28, 2014, and Decision 571, dated M arch 11, 2014.
5.2. Free-trading market (ACL)
The Company is currently a party to various free trading market agreements totaling 901.8 MW(*) of installed
capacity. In August 2011, the Company entered into a power purchase and sale commitment with Light Energia,
whereby Renova will deliver average 200.4 MW(*) of wind power, corresponding to 403.5 MW(*) of installed
capacity; wind farms will begin to generate power between 2015 and 2016. Out of the total amount of 200.4
MW(*), 1/3 of the power was traded with LIGHTCOM Comercializadora de Energia S.A. and 2/3 with CEMIG
GT.
Other agreements were negotiated in the free market, whereby Renova will deliver average 77.0 MW(*) of wind
and solar power, corresponding to 160.2 MW of installed capacity. The wind farms that will satisfy these
agreements will start to operate in 2015, 2016 and 2017.
Additionally, in March 2014, Renova Comercializadora traded average 308.0 MW with CEMIG GT, corresponding
to 676.2 MW(*) of installed capacity. On July 17, 2014, a Share Purchase and Sale Investment Agreement was
entered into among the Company and Companhia Energética de Minas Gerais (“CEMIG”), which will hold a 50%
stake in the project. The wind farms that will satisfy this agreement will start to generate power in 2018. On
October 22, 2014, the Administrative Council of Economic Defense (CADE) approved the execution of such
Investment Agreement.
23
Pursuant to the Investment Agreement, the transaction will be carried out upon the acquisition by CEMIG of 50% of
the voting and total capital of a publicly-held company (SPE) to be established by the Company, in which all
agreements relating to the Wind Project will be paid in. The acquisition price will correspond to up to R$113,450
relating to 50% of the amounts of advances relating to agreements already entered into by the Company, adjusted by
the fluctuation of the interbank deposit rate (“CDI”) from effective disbursement by the Company up to the date of
payment by CEMIG. After the acquisition, CEMIG and Renova will share the future investment of the Wind Project
proportionally to their share in the SPE’s capital.
(*) Information not reviewed by independent auditors.
6. Segment reporting
The Company has four reportable segments representing its strategic business units, besides the performance of its
administrative activities. Such strategic business units offer different renewable power sources and are administered
separately as they require different technologies, developments and operating characteristics. The operations on
each one of the Company´s reportable segments can be summarized as follows:
a) PCH – This segment is responsible for the development, implementation and operation of water source
power generation projects. This segment includes the development of studies on inventories and basic
projects and power generation. The PCHs are under operation stage for comparison between the periods
ended June 30, 2015 and 2014.
b) Wind – This segment is responsible for the development, implementation and operation of wind source
power generation projects. It includes wind measurement, leased land, implementation and power
generation. The plants which won LER 2009 became able to operate in the second half of 2012. The plants
which won LER 2010 started commercial operations on October 11, 2014. Four plants which traded power
under LEN 2011 (A-3) started commercial operations on March 4, 2015 and other five plants are ready to
operate and await the transmission line (see note 1.3).
c) Solar – This segment is responsible for the development, implementation and operation of the solar source
power generation projects. It includes measurements, development of solar projects for generation in high
scale and distributed generation, as well as the sale of goods and services.
d) Sale – This segment is responsible for the power sale of all types.
As at June 30, 2015 and 2014, segment reporting for result, and as at June 30, 2015 and December 31, 2014,
segment reporting for profit or loss and total assets and liabilities are broken down as follows:
24
06/30/2015
Net revenue
Non-manageable costs
Gross margin
Manageable costs
Share of profit (loss) of subsidiaries
Depreciation
Finance income
Finance costs
Income tax and social contribution
(Loss) profit
PCH
11,752
(215)
11,537
(4,496)
(20,917)
(1,857)
3,411
(3,746)
(1,335)
(17,403)
Wind
205,693
(11,705)
193,988
(33,234)
(48,758)
11,355
(76,568)
(12,141)
34,642
Solar
223
223
(299)
(76)
Total assets
Total liabilities
926,986
117,860
3,989,084
2,694,103
410
-
Sale
4,909
(2)
4,907
(5,525)
114
(7)
(511)
Admin.
(43,386)
(3,587)
4,024
(30,111)
(73,060)
Consolidated
222,577
(11,922)
210,655
(86,940)
(20,917)
(54,202)
18,904
(110,432)
(13,476)
(56,408)
3,848
2,008
869,240
521,701
5,789,568
3,335,672
5,423
5,423
(5,451)
(28)
Admin
(23,850)
(727)
16,610
(12,082)
(20,049)
Consolidated
110,696
(4,975)
105,721
(39,935)
(6,211)
(35,595)
26,155
(49,810)
(6,391)
(6,066)
6,323
3,700
531,896
364,486
4,457,054
2,652,374
06/30/2014
Net revenue
Non-manageable costs
Gross margin
Manageable costs
Share of profit (loss) of subsidiaries
Depreciation
Finance income
Finance costs
Income tax and social contribution
Profit (loss)
Total assets
Total liaibilities
PCH
8,943
(312)
8,631
(3,280)
(6,211)
(2,784)
1,982
(4,055)
(1,139)
(6,856)
Wind
96,229
(4,663)
91,566
(7,285)
(32,084)
7,563
(33,673)
(5,252)
20,835
Solar
101
101
(69)
32
271,219
125,378
3,647,071
2,158,810
545
-
Sale
25
7. Cash and cash equivalents and short-term investments
Note
Cash
Banks checking account
Short-term investments
Transfer to assets held for sale:
Cach and cash equivalents
Short-term investments
Consolidated
06/30/2015
12/31/2014
71
44,033
53,272
97,376
29.2
29.2
Stated as:
Cach and cash equivalents
Short-term investments
Total
Parent
06/30/2015
12/31/2014
22
56,898
538,697
595,617
(23,562)
(35,644)
38
669
4,219
4,926
-
-
9
785
198,831
199,625
38,170
595,617
4,926
199,625
26,336
11,834
38,170
86,599
509,018
595,617
1,391
3,535
4,926
28,598
171,027
199,625
Short-term and highly liquid investments which can be immediately converted into a known cash amount and are
subject to an insignificant risk of change in value were classified as cash equivalents. These financial investments
refer to fixed-income instruments under repurchase agreements yielding rates ranging from 100.5% to 102.37% of
CDI. Those financial investments corresponding to investment funds which do not have characteristics of cash and
cash equivalents were classified in line item short-term investments.
The Company’s exposure to interest rate risks and a sensitivity analysis of its financial assets and financial liabilities
are disclosed in note 27.
8. Trade receivables
Consolidated
Note
Eletrobras
Câmara de Comercialização de Energia Elétrica - CCEE
Others
Transfer to assets held for sale
Total
Parent
Trade accounts
receivable
falling due
Over due by
90 days
06/30/2015
12/31/2014
06/30/2015
2,634
1,931
979
5,544
4,744
-
26,221
-
-
26,221
60,957
-
9,708
-
12/31/2014
-
9,708
2,926
85
38,563
1,931
979
41,473
68,627
85
(20,365)
(1,931)
(979)
(23,275)
18,198
-
-
18,198
29.2
-
-
68,627
85
As of June 30, 2015, balances are comprised of receivables and over due, with average collection period of 24 days
(Espra and the farms under LER 2009 and LER 2010) and 60 days (the farms under LEN 2011) for which losses on
performance are not expected.
26
9. Recoverable taxes
Note
Consolidated
06/30/2015 12/31/2014
Withholding Income Tax IRPJ
Corporate Income Tax (IRPJ)
COFINS (tax on revenue)
IRRF on short-term investments
Social Contribution on Net Profit (CSLL)
PIS (tax on revenue)
Other recoverble taxes
Total
Transfer to assets held for sale
29.2
Total
Parent
06/30/2015 12/31/2014
4,226
10,483
9
338
370
3
25
15,454
3,610
9,534
615
582
552
134
37
15,064
1,023
8,134
31
12
3
8
7
9,218
8,138
31
289
3
8
7
8,476
(2,396)
-
-
-
9,218
8,476
13,058
15,064
10. Advances to suppliers
Note
Advances to suppliers
Transfer to assets held for sale
Total
Consolidated
06/30/2015 12/31/2014
13,474
29.2
Parent
06/30/2015 12/31/2014
8,575
10,945
6,033
8,575
10,945
6,033
(1,317)
12,157
These advances relate to anticipation for legal services and others to the Company as well as the maintenance of its
subsidiaries’ farms.
27
11. Collaterals and restricted deposits
Note
Consolidated
06/30/2015
12/31/2014
173,764
Collaterals and restricted deposits
Transfer to assets held for sale
29.2
Parent
06/30/2015
12/31/2014
160,527
(171,926)
-
1,835
40
-
-
Total
1,838
160,527
1,835
40
Stated as:
Current
Noncurrent
Total
1,835
3
1,838
40
160,487
160,527
1,835
1,835
40
40
As at June 30, 2015, collaterals and restricted deposits including the balance classified as held for sale are broken
down as shown below:
Consolidated
Company
Collateral
Contractual Subject
06/30/2015 12/31/2014
Renova
Other
Property lease/Other items
1,835
40
Total current
1,835
40
Company
LER 2009
LER 2009
LER 2009
Espra
Renova Eólica
Collateral
Special reserve
O&M reserve
SD reserve
Guarantee
Guarantee
(c)
Institution
(a)
(b)
Rate
Contractual Subject
Consolidated
06/30/2015 12/31/2014
109,505
101,111
Citibank
98.70% CDI
BNDES Financing
Citibank
98.70% CDI
BNDES Financing
4,760
4,536
Citibank
BNB
Itaú
98.70% CDI
98.70% CDI
-
BNDES Financing
BNB Financing
Debentures
Total noncurrent
43,979
13,682
3
171,929
41,908
12,932
160,487
The balances refer to short-term fixed-income instruments linked to financing agreements with BNDES and Banco
do Nordeste do Brasil (“BNB”). The Company can solely manage these short-term investments upon express
authorization of BNDES and BNB.
(a) Refers to collateral “Special reserve” under the BNDES agreement transferred by the SPEs’ mandatory bank to
its direct parent companies. This reserve is entitled to receive the total exceeding resources from the central
accounts maintained with the bank and not managed by the subsidiary in order to ensure the full payment of the
installments for payment of principal and debt accessories. These collaterals may solely be managed by the
subsidiary upon BNDES’ express authorization.
(b) A reserve that the subsidiaries must maintain over the agreement to ensure the payments of the operation and
maintenance agreement obligations (O&M).
28
(c) A reserve that the subsidiaries must maintain over the agreement to ensure the payments of the financing
agreement obligations.
12. Deferred taxes
Consolidated
Assets
Note
PIS deferred
COFINS deferred
IRPJ deferred
CSLL deferred
Total
Transfer to assets held for sale
or liabilities directly related to
assets held for sale
29.2
Liabilities
06/30/2015
12/31/2014
06/30/2015
12/31/2014
220
1,016
649
289
2,174
251
1,158
669
417
2,495
159
736
490
263
1,648
41
189
126
68
424
(2,043)
-
(1,499)
-
131
2,495
149
424
Deferred taxes were recorded based on the differences between generated and effectively invoiced power (note 18).
These deferred taxes were calculated using the rates based on the deemed income.
12.1. Changes, net (assets and liabilities) in deferred IRPJ and CSLL
Consolidated
Balance at December 31, 2013
Changes, net
Balance at June 30, 2014
374
331
705
Balance at December 31, 2014
Changes, net
Transfer to assets held for sale
Balance at June 30, 2015
892
(707)
(193)
(8)
29
13. Investments
13.1 Breakdown of investments
Investments in subsidiaries and jointly controlled entities are as follows:
Company
PCH
Enerbras Centrais Elétricas S.A. (Holding)
Renova PCH LTDA.
Chipley SP Participações S.A. (Holding)
Brasil PCH S.A.
Consolidated
06/30/2015
12/31/2014
692,395
713,312
Parent
06/30/2015
12/31/2014
2,671
243
694,200
-
110,866
3
709,949
-
Wind farms
Nova Renova Energia S.A.
Alto Sertão Participações S.A. (Holding)
Centrais Eólicas Carrancudo S.A.
Centrais Elétricas Botuquara S.A.
Centrais Eólicas Alcacuz S.A.
Centrais Eólicas Tamboril S.A.
Centrais Eólicas Conquista S.A.
Centrais Eólicas Coxilha Alta S.A.
Centrais Eólicas Tingui S.A.
Centrais Eólicas Cansanção S.A.
Centrais Eólicas Macambira S.A.
Centrais Eólicas Imburana de Cabão S.A.
Centrais Eólicas Ipê Amarelo S.A.
Centrais Eólicas Putumuju S.A.
Centrais Eólicas Lençóis S.A.
Centrais Eólicas Anísio Teixeira S.A.
Centrais Eólicas Ico S.A.
Centrais Eólicas Jequitiba S.A.
Centrais Eólicas Caliandra S.A.
Centrais Eólicas Canjoão S.A.
Centrais Eólicas Cabeça de Frade S.A.
Centrais Eólicas Embiruçu S.A.
Centrais Eólicas Itapuã V LTDA.
Centrais Eólicas Bela Vista XIV LTDA.
Centrais Eólicas Umburanas 3 S.A.
Centrais Elétricas Itaparica S.A.
Outras participações (*)
Renovapar S.A.
-
-
582,930
68,458
6,439
6,506
6,576
7,304
6,354
5,579
5,120
3,776
5,722
5,370
4,669
3,842
3,428
3,572
3,324
2,208
1,737
1,491
1,504
1,855
269
406
141
6,793
780
-
1,071,110
46,968
2,955
2,728
2,682
2,415
2,326
2,085
2,007
1,358
1,958
1,933
1,594
1,350
1,310
1,218
1,185
807
606
595
548
538
190
95
97
(323)
3
-
Power sale
Renova Comercializadora de Energia S.A.
-
-
1,865
2,351
1,445,132
1,973,507
Total
692,395
713,312
30
13.2 Information on investees
The main information on subsidiaries and jointly controlled entities is broken down as follows:
06/30/2015
Company
PCH
Enerbras Centrais Elétricas S.A. (Holding)
Renova PCH LTDA.
Chipley SP Particip ações S.A. (Holding)
Wind farms
Nova Renova Energia S.A.
Alto Sertão Particip ações S.A. (Holding)
Centrais Eólicas Itap uã V LTDA.
Centrais Eólicas Bela Vista XIV LTDA.
Centrais Eólicas Umburanas 3 S.A.
Centrais Elétricas Itaparica S.A.
Outras particip ações (*)
Renovapar S.A.
Centrais Eólicas Carrancudo S.A.
Centrais Elétricas Botuquara S.A.
Centrais Eólicas Alcacuz S.A.
Centrais Eólicas Tamboril S.A.
Centrais Eólicas Conquista S.A.
Centrais Eólicas Coxilha Alta S.A.
Centrais Eólicas Tingui S.A.
Centrais Eólicas Cansanção S.A.
Centrais Eólicas M acambira S.A.
Centrais Eólicas Imburana de Cabão S.A.
Centrais Eólicas Ipê Amarelo S.A.
Centrais Eólicas Putumuju S.A.
Centrais Eólicas Lençóis S.A.
Total
number of
shares
Equity
interest
Renova (%)
Capital
12/31/2014
Equity
Profit (loss) for
the year**
Total
number of
shares
Equity
interest
Renova (%)
Capital
Equity (equity
deficiency)
Proposed
dividends
Profit (loss)
for the year
5,170,101
31,875
1,200
100.00
99.00
100.00
101,955
32
739,944
2,671
243
694,200
3,280
(7)
(20,676)
5,170,101
31,875
1,200
100.00
99.00
100.00
101,955
32
1
110,866
3
709,949
15,966
-
2,697
(6)
(24,736)
870,083,000
12,163,808
100
10,000
51,130
100
100
21,197
100
100
100
100
100
100
10,000
100
100
10,000
100
99.99
100.00
99.00
99.00
99.00
99.00
100.00
99.00
99.00
99.00
99.00
99.00
99.00
99.00
99.00
99.00
99.00
99.00
99.00
99.00
870,083
12,164
10
51
21
10
10
-
1,128,662
68,458
269
406
141
6,793
780
6,439
6,506
6,576
7,304
6,354
5,579
5,120
3,776
5,722
5,370
4,669
3,842
3,428
36,464
(2,213)
(9)
(40)
(35)
(38)
(513)
(15)
(1)
(7)
(7)
(5)
(4)
(9)
(5)
(55)
(44)
(57)
(8)
(4)
870,083,000
12,163,808
100
10,000
51,130
100
100
21,197
100
100
100
100
100
100
10,000
100
100
10,000
100
99.99
100.00
99.00
99.00
99.00
99.00
100.00
99.00
99.00
99.00
99.00
99.00
99.00
99.00
99.00
99.00
99.00
99.00
99.00
99.00
870,083
12,164
10
51
100
21
10
10
-
1,071,110
46,968
190
95
97
(323)
3
2,955
2,728
2,682
2,415
2,326
2,085
2,007
1,358
1,958
1,933
1,594
1,350
1,310
-
70,011
(1,598)
(7)
1
5
(323)
(65)
(4)
(23)
(6)
(33)
(47)
(6)
(8)
(207)
(10)
(26)
(188)
(26)
(16)
(6)
- CONTINUED –
31
06/30/2015
Company
Centrais
Centrais
Centrais
Centrais
Centrais
Centrais
Centrais
Centrais
Centrais
Centrais
Centrais
Centrais
Centrais
Centrais
Centrais
Centrais
Centrais
Centrais
Centrais
Centrais
Centrais
Centrais
Centrais
Centrais
Centrais
Centrais
Centrais
Centrais
Centrais
Centrais
Centrais
Eólicas
Eólicas
Eólicas
Eólicas
Eólicas
Eólicas
Eólicas
Eólicas
Eólicas
Eólicas
Eólicas
Eólicas
Eólicas
Eólicas
Eólicas
Eólicas
Eólicas
Eólicas
Eólicas
Eólicas
Eólicas
Eólicas
Eólicas
Eólicas
Eólicas
Eólicas
Eólicas
Eólicas
Eólicas
Eólicas
Eólicas
Anísio Teixeira S.A.
Ico S.A.
Jequitiba S.A.
Caliandra S.A.
Canjoão S.A.
Cabeça de Frade S.A.
Embiruçu S.A.
São Salvador S.A.
Abil S.A.
Acácia S.A.
Angico S.A.
Folha da Serra S.A.
Jabuticaba S.A.
Jacarandá do Serrado S.A.
Taboquinha S.A.
Tabua S.A.
Vaqueta S.A.
Unha d'Anta S.A.
Cedro S.A.
Vellozia S.A.
Angelim S.A.
Facheio S.A.
Sabiu S.A.
Barbatimão S.A.
Juazeiro S.A.
Jataí S.A.
Imburana M acho S.A.
Amescla S.A.
Umbuzeiro S.A.
Pau d'Água S.A.
M anineiro S.A.
S ale
Renova Comercializadora de Energia S.A.
Total
number of
shares
100
10,000
100
10,000
100
100
100
-
Equity
interest
Renova (%)
99.00
100.00
99.00
100.00
99.00
99.00
99.00
-
58,377
100.00
Capital
12/31/2014
3,572
3,324
2,208
1,737
1,491
1,504
1,855
-
(21)
(7)
(14)
(57)
(8)
(5)
(9)
-
Total
number of
shares
100
10,000
100
10,000
100
100
100
-
1,840
(511)
58,377
Equity
10
10
-
58
1,990,839
Profit (loss) for
the year**
15,360
Equity
interest
Renova (%)
99.00
100.00
99.00
100.00
99.00
99.00
99.00
-
100.00
Capital
10
10
10
-
58
Equity (equity
deficiency)
Proposed
dividends
Profit (loss)
for the year
1,218
1,185
807
606
595
548
538
-
-
(19)
(13)
(60)
(43)
(15)
(8)
(145)
(17)
(140)
(34)
(29)
(158)
(47)
(100)
(29)
(160)
(126)
(75)
(117)
(109)
1
(8)
(32)
2
2
(8)
1
2
(19)
(10)
(30)
2,351
-
(1,542)
1,973,507
15,966
42,288
(*) Other comp anies listed in Note 1.
(**) Considering the Comp any ´s equity interest.
32
13.3 Changes in investments
Changes in investments in subsidiaries and jointly controlled entities are as follows:
13.3.1 Consolidated
Company
12/31/2013
Share of profit (loss)
of Brasil Chipley
Jan - Sep (*)
AFCI
Consolidated
elimination
Loss on
gain of
equity
interest
Assgnment
of
receivables
Share of
profit (loss) of
Brasil PCH
Oct - Dec (*)
Amortization of
appreciation (*)
Dividends
12/31/2014
(5,259)
754,907
(7,787)
(9,168)
(11,494)
713,312
PCH
Chipley / Brasil PCH S.A.
-
Company
739,943
12/31/2014
(7,887)
(739,943)
Share of profit (loss)
Amortization of
appreciation (*)
Brasil PCH
06/30/2015
PCH
Chipley / Brasil PCH S.A.
713,312
(2,765)
(18,152)
692,395
13.3.1.1 Changes in equity interests
Through September 30, 2014, the Company had the shared control of Chipley, with a 60% equity interest.
Beginning October 2014, CEMIG GT completed the transaction mentioned in note 1.1., and Renova became the
holder of 100% of the shares. The effects of changes in Chipley’s equity interest are shown as follows:
Loss on gain of equity interest in Chipley
Equity interest through September 30, 2014
Equity interest after September 30, 2014
Equity interest acquired
Chipley's equity as of September 30, 2014
Loss on gain of equity interest
60%
100%
40%
(13,145)
(5,259)
33
13.3.1.2 Shared control investment – Brasil PCH S.A.
The Company measures its investments in equity interests in joint ventures using the equity method of
accounting. On February 14, 2014, Chipley acquired a 51% equity interest in Brasil PCH S.A. and, as a result of
the new Shareholders Agreement, obtained the shared control of this venture.
Brasil PCH holds 13 small hydroelectric plants (PCHs), with an installed capacity of 291 MW and average
guaranteed power of 194 MW. All PCHs have long-term agreements (20 years) for the sale of electric power in
the context of PROINFA (physical information and information relating to power capacity measures not
reviewed by the independent auditors).
Because the company control is shared, Chipley’s equity interest in Brasil PCH is recorded under the equity
method, as required by IFRS 11 / CPC 19 (R2) – Joint Arrangements.
As required by CPC 45 (IFRS 12), the financial statements of Brasil PCH (jointly controlled entity) are as
follows:
BALANCE SHEET AS OF JUNE 30, 2015
ASSETS
06/30/2015
12/31/2014
CURRENT ASSETS
EQUITY AND LIABILITIES
06/30/2015
12/31/2014
CURRENT LIABILITIES
Cash and cash equivalents
97,061
85,855
Borrowings and financing
180,692
170,098
Other
35,558
49,340
Other
148,965
128,154
132,619
135,195
Total current liabilities
329,657
298,252
877,624
950,957
60,839
60,310
938,463
1,011,267
95,402
97,025
1,363,522
1,406,544
Total current assets
NONCURRENT LIABILITIES
NONCURRENT ASSETS
Property, plant and equipment
Other
Total noncurrent assets
1,161,653
1,171,028
69,250
100,321
1,230,903
1,271,349
Borrowings and financing
Other
Total noncurrent liabilities
EQUITY
TOTAL ASSETS
1,363,522
1,406,544
TOTAL LIABILITIES
AND EQUITY
34
INCOME STATEMENT FOR THE PERIOD ENDED JUNE 30, 2015
06/30/2105
02/01/2014
to
06/30/2014
98,443
107,087
Depreciation
(17,767)
(14,879)
Cost of operations
(12,806)
(14,995)
(2,715)
(2,177)
(33,288)
(32,051)
65,155
75,036
(6,300)
(6,273)
NET REVENUE
COSTS OF SALES
Charges on use of distribution system
Total
GROSS PROFIT
INCOME (EXPENSES)
General and administrative
Depreciation and amortization
(3,873)
(3,227)
(10,173)
(9,500)
54,982
65,536
(56,378)
(53,192)
PROFIT BEFORE INCOME TAX
AND SOCIAL CONTRIBUTION
(1,396)
12,344
Income tax and social contribution
(4,028)
(4,274)
PROFIT FOR THE PERIOD
(5,424)
8,070
Total
PROFIT BEFORE FINANCE INCOME (COSTS) AND
INCOME TAXES
FINANCE INCOME (COSTS)
35
13.3.2 Parent
Company
PCH
Enerbras Centrais Elétricas S.A. (Holding)
Renova PCH LTDA.
Chipley SP Participações S.A. (Holding)
12/31/2013
Transfers
Additions
AFCI
-
Loss on gain
of equity
interest
Proposed
dividends
Share of
profit (loss)
of
subsidiarie
12/31/2014
Additions
4,927
124,135
-
-
5
1
4
739,943
(5,259)
(15,966)
-
2,697
(6)
(24,736)
110,866
3
709,949
858,291
266
10
10
10
10
10
10
10
10
1
1
1
1
(2)
(1)
1
(1)
(2)
(2)
-
12,164
(801)
(677)
(533)
(286)
(644)
(337)
(646)
(693)
(370)
-
72,908
552
807
557
305
792
374
736
712
520
-
69,900
36,402
2,977
2,733
2,714
2,461
2,334
2,094
2,213
1,369
1,984
2,121
1,620
1,366
1,318
1,239
1,198
-
-
70,011
(1,598)
(17)
(140)
(34)
(29)
(158)
(47)
(100)
(29)
(160)
(23)
(6)
(33)
(47)
(6)
(8)
(207)
(10)
(26)
(188)
(26)
(16)
(6)
(19)
(13)
1,071,110
46,968
2,955
2,728
2,682
2,415
2,326
2,085
2,007
1,358
1,958
1,933
1,594
1,350
1,310
1,218
1,185
AFCI
247
-
Proposed
dividends
Share of
profit (loss)
of
subsidiaries
Transfer to assets
held for sale
06/30/2015
(2,022)
-
3,280
(7)
(20,676)
(109,453)
-
2,671
243
694,200
-
37,758
(2,213)
(15)
(1)
(7)
(7)
(5)
(4)
(9)
(5)
(55)
(44)
(57)
(8)
(4)
(21)
(7)
(545,732)
-
582,930
68,458
6,439
6,506
6,576
7,304
6,354
5,579
5,120
3,776
5,722
5,370
4,669
3,842
3,428
3,572
3,324
Wind farms
Nova Renova Energia S.A.
Alto Sertão Participações S.A. (Holding)
Centrais Eólicas São Salvador S.A.
Centrais Eólicas Abil S.A.
Centrais Eólicas Acácia S.A.
Centrais Eólicas Angico S.A.
Centrais Eólicas Folha da Serra S.A.
Centrais Eólicas Jabuticaba S.A.
Centrais Eólicas Jacarandá do Serrado S.A.
Centrais Eólicas Taboquinha S.A.
Centrais Eólicas Tabua S.A.
Centrais Eólicas Carrancudo S.A.
Centrais Elétricas Botuquara S.A.
Centrais Eólicas Alcacuz S.A.
Centrais Eólicas Tamboril S.A.
Centrais Eólicas Conquista S.A.
Centrais Eólicas Coxilha Alta S.A.
Centrais Eólicas Tingui S.A.
Centrais Eólicas Cansanção S.A.
Centrais Eólicas Macambira S.A.
Centrais Eólicas Imburana de Cabão S.A.
Centrais Eólicas Ipê Amarelo S.A.
Centrais Eólicas Putumuju S.A.
Centrais Eólicas Lençóis S.A.
Centrais Eólicas Anísio Teixeira S.A.
Centrais Eólicas Ico S.A.
-
19,794
23,703
3,499
3,779
3,901
4,896
4,033
3,498
3,122
2,423
3,819
3,481
3,132
2,500
2,122
2,375
2,146
- Continued -
36
- Continuation -
Company
Centrais Eólicas Jequitiba S.A.
Centrais Eólicas Caliandra S.A.
Centrais Eólicas Canjoão S.A.
Centrais Eólicas Cabeça de Frade S.A.
Centrais Eólicas Embiruçu S.A.
Centrais Eólicas Itapuã V LTDA.
Centrais Eólicas Bela Vista XIV LTDA.
Centrais Eólicas Umburanas 3 S.A.
Centrais Eólicas Vaqueta S.A.
Centrais Eólicas Unha d'Anta S.A.
Centrais Eólicas Cedro S.A.
Centrais Eólicas Vellozia S.A.
Centrais Eólicas Angelim S.A.
Centrais Eólicas Facheio S.A.
Centrais Eólicas Sabiu S.A.
Centrais Eólicas Barbatimão S.A.
Centrais Eólicas Juazeiro S.A.
Centrais Eólicas Jataí S.A.
Centrais Eólicas Imburana Macho S.A.
Centrais Eólicas Amescla S.A.
Centrais Eólicas Umbuzeiro S.A.
Centrais Eólicas Pau d'Água S.A.
Centrais Eólicas Manineiro S.A.
Centrais Elétricas Itaparica S.A.
Outras participações (*)
Renovapar S.A.
Power sale
Renova Comercializadora de Energia S.A.
Total
12/31/2013
1
(2)
29
1
(1)
(1)
1
(1)
1
(1)
(2)
(16)
AFCI
Loss on gain
of equity
interest
Proposed
dividends
Share of
profit (loss)
of
subsidiarie
12/31/2014
Transfer to assets
held for sale
Additions
(660)
(342)
(246)
(544)
(616)
(467)
(378)
(460)
(540)
(465)
(464)
(386)
(611)
(494)
(504)
-
757
416
364
653
615
475
411
458
538
472
463
384
630
505
533
-
867
649
609
558
683
197
94
92
1
70
20
-
-
(60)
(43)
(15)
(8)
(145)
(7)
1
5
(126)
(75)
(117)
(109)
1
(8)
(32)
2
2
(8)
1
2
(19)
(10)
(30)
(323)
(65)
(4)
807
606
595
548
538
190
95
97
(323)
3
-
-
1,415
1,188
904
961
1,326
88
351
79
7,154
1,290
-
-
(14)
(57)
(8)
(5)
(9)
(9)
(40)
(35)
(38)
(513)
-
-
2,208
1,737
1,491
1,504
1,855
269
406
141
6,793
780
-
-
-
(1,542)
2,351
-
-
-
(511)
-
1,840
(5,259)
(15,966)
42,288
1,973,507
-
19
3,873
982,779
-
85,962
883,703
4,927
AFCI
Proposed
dividends
Transfers
1
Additions
Share of
profit (loss)
of
subsidiaries
107,226
(2,022)
16,654
(655,185)
06/30/2015
1,445,107
(*) Other companies listed in Note 1
37
13.4 Changes in dividends receivable
Balance as of December 31, 2013
Proposed dividends
Dividends received
Balance as of December 31, 2014
Proposed dividends
Balance as of June 30, 2015
Consolidated
11,494
(11,494)
-
Parent
20,452
15,966
(35,879)
539
2,022
2,561
As of June 30, 2015, subsidiary Enerbras had dividends payable in the amount of R$2.561 (December 31, 2014,
R$ 539). These amounts were recorded as dividends receivable in the Parent’s current assets.
38
13.5 Changes in investments in subsidiary Nova Renova
The investments made in subholding Nova Renova, which controls Renova Eólica, Salvador Eólica and Bahia
Eólica, are broken down as follows:
Company
Nova Renova Energia S.A.
12/31/2014
477
Additions
-
AFCI
108
Proposed
dividends
Share of profit
(loss) of subsdiaries
(106)
9
Transfer to
assets held for
sale
-
Renova Eólica Participações S.A.
Centrais Eólicas da Prata S.A.
Centrais Eólicas dos Araçás S.A.
Centrais Eólicas Morrão S.A.
Centrais Eólicas Seraíma S.A.
Centrais Eólicas Tanque S.A.
Centrais Eólicas Ventos do Nordeste S.A.
Centrais Eólicas Ametista S.A.
Centrais Eólicas Borgo S.A.
Centrais Eólicas Caetité S.A.
Centrais Eólicas Dourados S.A.
Centrais Eólicas Espigão S.A.
Centrais Eólicas Maron S.A.
Centrais Eólicas Pelourinho S.A.
Centrais Eólicas Pilões S.A.
Centrais Eólicas Serra do Espinhaço S.A.
(2,536)
37,836
64,532
47,777
52,044
54,025
42,068
34,200
22,719
39,570
35,924
15,283
39,097
24,443
44,578
21,672
-
(106)
2,139
2,410
1,870
1,804
677
1,565
4,623
3,071
1,633
-
(38,859)
3,110
3,382
3,813
3,986
3,412
3,455
1,541
(215)
(475)
1,235
(216)
3,541
(491)
2,529
(215)
Bahia Eólica Participações S.A.
Centrais Eólicas Candiba S.A.
Centrais Eólicas Igaporã S.A.
Centrais Eólicas Ilhéus S.A.
Centrais Eólicas Licínio de Almeida S.A.
Centrais Eólicas Pindaí S.A.
9,248
21,023
53,389
23,302
42,701
43,776
-
-
6,657
(2,307)
(1,469)
(2,881)
4,714
725
621
2,652
1,643
2,761
(20,619)
(21,748)
(51,703)
(25,969)
(42,860)
(43,656)
31,785
12,214
27,110
40,269
36,732
32,582
36,119
12,229
48,000
26,922
1,071,110
-
19,130
(705)
(928)
(3,422)
(3,863)
(1,842)
(2,296)
(5,276)
(798)
-
9,433
437
696
1,026
3,690
6,340
6,267
871
3,847
2,608
37,758
(60,348)
(11,946)
(26,878)
(37,873)
(36,559)
(37,080)
(40,090)
(13,100)
(46,571)
(28,732)
(545,732)
Salvador Eólica Participações S.A.
Centrais Eólicas Alvorada S.A.
Centrais Eólicas Guanambi S.A.
Centrais Eólicas Guirapá S.A.
Centrais Eólicas N. S. Conceição S.A.
Centrais Eólicas Pajeú do Vento S.A.
Centrais Eólicas Planaltina S.A.
Centrais Eólicas Porto Seguro S.A.
Centrais Eólicas Rio Verde S.A.
Centrais Eólicas Serra do Salto S.A.
TOTAL
19,794
(9)
-
06/30/2015
479
(41,492)
40,946
67,914
51,590
56,030
57,428
45,523
37,880
24,914
40,965
38,963
15,744
44,203
28,575
50,178
23,090
582,930
39
13.6 Transfer of control
On November 10, 2014, the Company increased the capital of subsidiary Alto Sertão Participações S.A. (“Alto
Sertão”) from R$100 to R$12,164, which, in turn, increased the capital of its direct subsidiary Diamantina Eólica
Participações S.A. (“Diamantina”) from R$100 to R$12,164, all at the carrying amounts of the investments
through the transfer of 100% of the registered common shares, without par value, of its subsidiaries Centrais
Eólicas Manineiro, Centrais Eólicas Pau d’Água, Centrais Eólicas São Salvador, Centrais Eólicas Abil, Centrais
Eólicas Tabua, Centrais Eólicas Jabuticaba, Centrais Eólicas Vaqueta, Centrais Eólicas Jacarandá do Serrado,
Centrais Eólicas Taboquinha, Centrais Eólicas Acácia, Centrais Eólicas Folha da Serra, Centrais Eólicas Angico,
Centrais Eólicas Jataí, Centrais Eólicas Amescla, Centrais Eólicas Imburana Macho, Centrais Eólicas Juazeiro,
Centrais Eólicas Facheio, Centrais Eólicas Sabiu, Centrais Eólicas Umbuzeiro, Centrais Eólicas Unha d'Anta,
Centrais Eólicas Vellozia, Centrais Eólicas Cedro, Centrais Eólicas Angelim, Centrais Eólicas Barbatimão, as
supported by appraisal reports, through the issuance of 12,163,708 new registered common shares without par
value.
As a result, Diamantina obtained the direct control of said subsidiaries, and Alto Sertão obtained the indirect
control of them.
This change was necessary due to the financing structure of its wind farms related to LEN 2012 (A-5), LER
2013 and free trading market.
The investments made in subholding Alto Sertão, which controls Diamantina, are broken down as follows:
40
Company
12/31/2013
Transfer of
control
AFCI
Share of
profit (loss) of
subsidiaries
-
AFCI
59
(59)
23,644
(1,111)
22,540
06/30/2015
Alto Sertão Participações S.A. (Holding)
-
-
-
Diamantina Eólica Participações S.A. (Holding)
-
-
-
Centrais Eólicas M anineiro S.A.
-
504
1,523
(106)
1,921
-
(36)
1,885
Centrais Eólicas Pau d'Água S.A.
-
494
1,674
(42)
2,126
-
(26)
2,100
Centrais Eólicas São Salvador S.A.
-
801
1,359
(47)
2,113
-
(21)
2,092
Centrais Eólicas Abil S.A.
-
677
2,172
(184)
2,665
-
(67)
2,598
Centrais Eólicas Tabua S.A.
-
370
1,337
(48)
1,659
-
(59)
1,600
Centrais Eólicas Jabuticaba S.A.
-
337
786
(95)
1,028
-
(66)
962
Centrais Eólicas Vaqueta S.A.
-
660
2,099
(78)
2,681
-
(137)
2,544
Centrais Eólicas Jacarandá do Serrado S.A.
-
646
1,445
(36)
2,055
-
(35)
2,020
Centrais Eólicas Taboquinha S.A.
-
693
1,168
(63)
1,798
-
(28)
1,770
Centrais Eólicas Acácia S.A.
-
533
2,236
(68)
2,701
-
(22)
2,679
Centrais Eólicas Folha da Serra S.A.
-
644
1,480
(37)
2,087
-
(73)
2,014
Centrais Eólicas Angico S.A.
-
286
670
(144)
812
-
(35)
777
Centrais Eólicas Jataí S.A.
-
465
1,017
(32)
1,450
-
(80)
1,370
Centrais Eólicas Amescla S.A.
-
386
1,199
(6)
1,579
-
(55)
1,524
Centrais Eólicas Imburana M acho S.A.
-
464
1,262
(52)
1,674
-
(21)
1,653
Centrais Eólicas Juazeiro S.A.
-
540
1,387
(60)
1,867
-
(20)
1,847
Centrais Eólicas Facheio S.A.
-
467
1,246
(64)
1,649
-
(21)
1,628
Centrais Eólicas Sabiu S.A.
-
378
1,142
(62)
1,458
-
(13)
1,445
Centrais Eólicas Umbuzeiro S.A.
-
611
1,479
(65)
2,025
-
(25)
2,000
Centrais Eólicas Unha d'Anta S.A.
-
342
2,931
(90)
3,183
-
(40)
3,143
Centrais Eólicas Vellozia S.A.
-
544
2,192
(51)
2,685
-
(44)
2,641
Centrais Eólicas Cedro S.A.
-
246
1,220
(49)
1,417
-
(28)
1,389
Centrais Eólicas Angelim S.A.
-
616
2,236
(88)
2,764
-
(33)
2,731
Centrais Eólicas Barbatimão S.A.
-
460
1,142
(38)
1,564
-
(58)
1,506
-
12,164
36,402
(1,598)
46,968
(2,213)
68,458
TOTAL
-
12/31/2014
Share of
profit (loss) of
subsidiaries
7
7
23,703
-
41
14. Property, plant and equipment
14.1 Consolidated
06/30/2015
Annual
de pre ciation
rates %
Historical
cost
Accumulated
depre ciation
12/31/2014
Ne t value
Historical
cost
Accumulate d
de pre ciation
Ne t value
Property, plant and equipment
Generation
Land
595
95,797
(15,212)
595
595
80,585
95,797
(14,467)
595
Reservoirs, dams and watermains
3%
Buildings, civil works and improvements
3%
192,502
(19,344)
173,158
136,763
(16,428)
120,335
Machinery and equipment
4%
2,247,638
(197,533)
2,050,105
1,825,932
(154,822)
1,671,110
Vehicles
20%
202
(41)
161
202
(32)
170
Furniture and fixtures
10%
142
(77)
65
120
(74)
46
IT equipment
20%
245
(222)
23
245
(209)
36
Measurement towers
20%
23,042
(8,129)
14,913
19,489
(6,141)
13,348
Measurement equipment
20%
2,875
(112)
2,763
367
(3)
364
T ower equipment
20%
2,318
(200)
2,118
951
-
Other
20%
6,773
(680)
6,093
6,768
(679)
81,330
951
6,089
T ransmission and connection system
Buildings, civil works and improvements
3%
5,385
(245)
5,140
5,385
(174)
5,211
Machinery and equipment
4%
267,544
(13,395)
254,149
268,947
(9,259)
259,688
2,845,058
(255,190)
2,589,868
2,361,561
(202,288)
2,159,273
Administration
Machinery and equipment
10%
5,199
(645)
4,554
3,958
(394)
3,564
Improvements
10%
2,036
(245)
1,791
1,949
(206)
1,743
Furniture and fixtures
10%
7,605
(1,454)
6,151
7,492
(1,080)
6,412
Software
20%
3,637
(1,598)
2,039
3,480
(1,325)
2,155
IT equipment
20%
3,630
(1,360)
2,270
2,980
(997)
1,983
22,107
(5,302)
16,805
19,859
(4,002)
15,857
-
-
-
T ransfer to assets held for sale (Note 29.2)
T otal construction in progress
(1,572,983)
208,818
(1,364,165)
1,294,182
(51,674)
1,242,508
2,381,420
(206,290)
2,175,130
Construction in progress
Generation
Unapportioned
400,931
-
400,931
348,769
-
348,769
Studies and projects
23,785
-
23,785
23,757
-
23,757
Land
16,900
-
16,900
11,325
-
11,325
149,389
-
149,389
115,470
-
115,470
Buildings, civil works and improvements
Measurement towers
10,527
-
10,527
3,285
-
3,285
Wind generators
426,061
-
426,061
549,307
-
549,307
Substation equipment
136,215
-
136,215
87,804
-
87,804
Advances to suppliers
953,432
-
953,432
652,196
-
652,196
493
-
T otal construction in progress
Social projects- BNDES
2,117,733
493
-
-
2,117,733
1,791,913
T otal property, plant and equipment
3,411,915
(51,674)
3,360,241
4,173,333
(206,290)
1,791,913
3,967,043
42
14.2 Changes in property, plant and equipment (consolidated)
12/31/2014
Property, plant and equipment
Cost
Generation
Plant
Land
Reservoirs, dams and watermains
Buildings, civil works and improvements
Machinery and equipment
Vehicles
Furniture and fixtures
IT equipment
Measurement towers
Measurement equipment
T ower equipment
Other
T ransmission and connection system
Buildings, civil works and improvements
Machinery and equipment
Administration
Machinery and equipment
Improvements
Furniture and fixtures
Software
IT equipment
T otal property, plant and equipment - cost
(-) Depreciation
Generation
Plant
Reservoirs, dams and watermains
Buildings, civil works and improvements
Machinery and equipment
Vehicles
Furniture and fixtures
IT equipment
Measurement towers
Measurement equipment
T ower equipment
Other
T ransmission and connection system
Buildings, civil works and improvements
Machinery and equipment
Administration
Machinery and equipment
Improvements
Furniture and fixtures
Software
IT equipment
T otal property, plant and equipment - depreciation
T otal property, plant and equipment
Transfe r to
asse ts held for
sale
Additions
Write -offs
Reclassifications
03/31/2015
595
95,797
136,763
1,825,932
202
120
245
19,489
367
951
6,768
201
1,731
22
3,154
2,508
892
5
-
55,538
419,975
399
475
-
(595)
(95,797)
(127,734)
(1,252,957)
(202)
(142)
(245)
(6,773)
64,768
994,681
23,042
2,875
2,318
-
5,385
268,947
2,361,561
8,513
(1,403)
(1,403)
476,387
(1,668)
(86,503)
(1,572,616)
3,717
181,041
1,272,442
3,958
1,949
7,492
3,480
2,980
19,859
2,381,420
1,241
87
113
157
650
2,248
10,761
(1,403)
476,387
(139)
(210)
(18)
(367)
(1,572,983)
5,060
2,036
7,395
3,637
3,612
21,740
1,294,182
(14,467)
(16,428)
(154,822)
(32)
(74)
(209)
(6,141)
(3)
(679)
(745)
(2,916)
(42,711)
(9)
(3)
(13)
(1,988)
(109)
(200)
(1)
-
-
15,212
17,517
166,408
41
77
222
680
(1,827)
(31,125)
(8,129)
(112)
(200)
-
(174)
(9,259)
(202,288)
(71)
(4,136)
(52,902)
-
-
146
8,454
208,757
(99)
(4,941)
(46,433)
(394)
(206)
(1,080)
(1,325)
(997)
(4,002)
(206,290)
2,175,130
(251)
(39)
(374)
(273)
(363)
(1,300)
(54,202)
(43,441)
4
(641)
(245)
(1,415)
(1,598)
(1,342)
(5,241)
(51,674)
1,242,508
-
(1,403)
476,387
39
18
61
208,818
(1,364,165)
- CONTINUED -
43
- CONTINUATION 12/31/2014
Construction in progress
Generation
Unapportioned
Studies and projects
Land
Buildings, civil works and improvements
Measurement towers
Wind generators
Substation equipment
Advances to suppliers
Social Pojects- BNDES
Additions
348,769
23,757
11,325
115,470
3,285
549,307
87,804
652,196
-
128,710
31
8,191
89,457
8,663
169,534
95,018
302,110
493
T otal construction in progress
1,791,913
802,207
T otal property, plant and equipment
3,967,043
758,766
Write -offs
-
Reclassifications
(76,548)
(3)
(2,616)
(55,538)
(1,421)
(292,780)
(46,607)
(874)
-
(1,403)
(476,387)
-
Transfe r to
asse ts held for
sale
06/30/2015
-
400,931
23,785
16,900
149,389
10,527
426,061
136,215
953,432
493
-
(1,364,165)
2,117,733
3,360,241
44
12/31/2013
Property, plant and equipment
Cost
Generation
Plant
Land
Reservoirs, dams and watermains
Buildings, civil works and improvements
Machinery and equipment
Vehicles
Furniture and fixtures
IT equipment
Measurement towers
Measurement equipment
T ower equipment
Other
T ransmission and connection system
Buildings, civil works and improvements
Machinery and equipment
Administration
Machinery and equipment
Improvements
Furniture and fixtures
Software
IT equipment
Total property, plant and equipment - cost
(-) Depreciation
Generation
Plant
Reservoirs, dams and watermains
Buildings, civil works and improvements
Machinery and equipment
Vehicles
Furniture and fixtures
IT equipment
Measurement towers
Measurement equipment
Other
T ransmission and connection system
Buildings, civil works and improvements
Machinery and equipment
Administration
Machinery and equipment
Improvements
Furniture and fixtures
Software
IT equipment
Total property, plant and equipment - depreciation
Total property, plant and equipment
Additions
Write -offs
Re classifications
12/31/2014
595
95,797
127,732
1,242,337
202
119
245
9,086
6,768
7,790
1
10,403
367
951
-
-
9,031
575,805
-
595
95,797
136,763
1,825,932
202
120
245
19,489
367
951
6,768
1,668
87,594
1,572,143
710
20,222
-
3,717
180,643
769,196
5,385
268,947
2,361,561
2,167
2,304
3,223
2,472
1,650
11,816
1,583,959
1,393
16
4,269
1,008
1,330
8,016
28,238
398
398
769,594
3,958
1,949
7,492
3,480
2,980
19,859
2,381,420
(371)
(371)
(371)
(12,232)
(10,990)
(89,799)
(2)
(62)
(170)
(3,839)
(356)
(2,235)
(5,438)
(65,023)
(30)
(12)
(39)
(2,302)
(3)
(323)
-
-
-
-
(14,467)
(16,428)
(154,822)
(32)
(74)
(209)
(6,141)
(3)
(679)
(80)
(4,378)
(121,908)
(94)
(4,881)
(80,380)
-
-
(174)
(9,259)
(202,288)
(91)
(243)
(680)
(776)
(599)
(2,389)
(124,297)
1,459,662
(303)
(158)
(400)
(549)
(398)
(1,808)
(82,188)
(53,950)
195
195
195
(176)
769,594
(394)
(206)
(1,080)
(1,325)
(997)
(4,002)
(206,290)
2,175,130
CONTINUED -
45
- CONTINUATION 12/31/2013
Construction in progress
Generation
Unapportioned
Studies and projects
Land
Buildings, civil works and improvements
Measurement towers
Wind generators
Substation equipment
Advances to suppliers
T otal construction in progress
T otal property, plant and equipment
237,438
27,102
12,462
183,853
4,105
895,864
113,417
171,582
1,645,823
3,105,485
Additions
Write-offs
258,319
3,293
4,049
31,507
405
110,529
33,389
478,025
919,516
865,566
Reclassifications
(3,832)
(3,832)
(4,008)
12/31/2014
(146,988)
(2,806)
(5,186)
(99,890)
(1,225)
(457,086)
(59,002)
2,589
(769,594)
-
348,769
23,757
11,325
115,470
3,285
549,307
87,804
652,196
1,791,913
3,967,043
14.3 Parent
06/30/2015
Annual
depreciation
rates %
Historical
cost
Accumulated
depreciation
12/31/2014
Net value
Historical
cost
Accumulated
depreciation
Net value
13,348
Property, plant and equipment
Generation
Measurement towers
20%
23,042
(8,129)
14,913
19,489
(6,141)
Measurement equipment
20%
2,875
(112)
2,763
367
(3)
364
Tower equipment
20%
2,318
(200)
2,118
951
-
951
28,235
(8,441)
19,794
20,807
(6,144)
14,663
Administration
Machinery and equipment
10%
5,060
(641)
4,419
3,890
(392)
3,498
Improvements
10%
2,036
(245)
1,791
1,949
(206)
1,743
Furniture and fixtures
10%
7,395
(1,415)
5,980
7,291
(1,048)
6,243
Software
20%
3,586
(1,598)
1,988
3,480
(1,325)
2,155
IT equipment
20%
Total property, plant and equipment
3,612
(1,342)
2,270
2,963
(980)
1,983
21,689
(5,241)
16,448
19,573
(3,951)
15,622
49,924
(13,682)
36,242
40,380
(10,095)
30,285
203,747
-
203,747
160,277
-
160,277
23,785
-
23,785
23,757
-
23,757
2,612
-
2,612
2,612
-
2,612
571,908
Construction in progress
Generation
Unapportioned
Studies and projects
Land
571,214
-
571,214
571,908
-
Total consctruction in progress
801,358
-
801,358
758,554
-
758,554
Total property, plant and equipment
851,282
(13,682)
837,600
798,934
(10,095)
788,839
Advances to suppliers
46
14.4 Changes in property, plant and equipment (parent)
12/31/2014
Additions
Reclassifications
19,489
367
951
20,807
3,154
2,508
892
6,554
399
475
874
23,042
2,875
2,318
28,235
3,890
1,949
7,291
3,480
2,963
19,573
40,380
1,170
87
104
106
649
2,116
8,670
874
5,060
2,036
7,395
3,586
3,612
21,689
49,924
(6,141)
(3)
(6,144)
(1,988)
(109)
(200)
(2,297)
-
(8,129)
(112)
(200)
(8,441)
(392)
(206)
(1,048)
(1,325)
(980)
(3,951)
(249)
(39)
(367)
(273)
(362)
(1,290)
-
(641)
(245)
(1,415)
(1,598)
(1,342)
(5,241)
(10,095)
(3,587)
-
(13,682)
Total property, plant and equipment
30,285
5,083
874
36,242
Construction in progress
Generation
Unapportioned
Studies and projects
Land
Advances to suppliers
Total construction in progress
Total property, plant and equipment
160,277
23,757
2,612
571,908
758,554
788,839
43,467
31
180
43,678
48,761
3
(3)
(874)
(874)
-
203,747
23,785
2,612
571,214
801,358
837,600
Property, plant and equipment
Generation
Measurement towers
Measurement equipment
Tower equipment
Administration
Machinery and equipment
Improvements
Furniture and fixtures
Software
IT equipment
Total property, plant and equipment - cost
(-) Depreciation
Generation
Measurement towers
Measurement equipment
Tower equipment
Administration
Machinery and equipment
Improvements
Furniture and fixtures
Software
IT equipment
Total property, plant and equipment - depreciation
-
06/30/2015
47
12/31/2013
Additions
Writeoffs
Capital
payment
- Wind power
SPEs
Reclassifications
12/31/2014
19,489
Property, plant and equipment
Generation
M easurement towers
9,086
10,403
-
-
-
M easurement equipment
-
367
-
-
-
367
Tower equipment
-
951
-
-
-
951
9,086
11,721
-
-
-
20,807
M achinery and equipment
2,138
1,752
Improvements
2,304
16
Administration
(371)
-
-
3,890
-
-
1,949
Furniture and fixtures
3,171
4,120
-
-
-
7,291
Software
2,472
1,008
-
-
-
3,480
-
IT equipment
Total property, plant and equipment - cost
1,632
1,331
-
-
2,963
11,717
8,227
(371)
-
-
19,573
20,803
19,948
(371)
-
-
40,380
(3,839)
(2,302)
-
-
-
(6,141)
(3)
-
-
-
(3)
(2,305)
-
-
-
(6,144)
(-) Depreciation
Generation
M easurement towers
M easurement equipment
(3,839)
Administration
M achinery and equipment
(90)
(302)
-
-
-
(392)
Improvements
(243)
(158)
195
-
-
(206)
Furniture and fixtures
(658)
(390)
-
-
-
(1,048)
Software
(776)
(549)
-
-
-
(1,325)
(583)
(397)
-
-
-
(980)
Total property, plant and equipment - depreciation
IT equipment
(6,189)
(4,101)
195
-
-
(10,095)
Total property, plant and equipment
14,614
15,847
(176)
123,354
86,921
27,102
3,293
2,612
-
-
-
-
2,612
Advances to suppliers
40,018
528,163
-
-
3,727
571,908
Total construction in progress
193,086
618,377
(3,832)
(49,077)
Total property, plant and equipment
207,700
634,224
(4,008)
(49,077)
-
-
30,285
Construction in progress
Generation
Unapportioned
Studies and projects
Land
(3,832)
(49,077)
-
(921)
160,277
(2,806)
23,757
-
758,554
788,839
48
14.5 Property, plant and equipment
The Company and its subsidiaries did not identify evidence of impairment of property, plant and equipment.
ANEEL, in accordance with the Brazilian regulatory framework, defines the economic useful lives of the power
generation assets, with periodical reviews on the estimates. The rates established by ANEEL are recognized as a
reasonable estimate of the useful life of the assets. Accordingly, these rates were used as the basis for
depreciation of property, plant and equipment.
According to articles 63 and 64 of Decree 41019/1957, those assets and facilities used in the power generation,
transmission, distribution and sale are linked to these services and cannot be removed, sold, assigned or provided
as pledge without the prior and express authorization of the regulatory body.
ANEEL, through SFF/ANEEL Letter 459/2001, authorized the assignment of the emerging rights, assets and
facilities for the concession of Serra da Prata Hydroelectric Complex, pledged as collateral for the obligations
assumed by the Company in the context of the direct financing.
14.6 Construction in progress
Property, plant and equipment in progress include investments in water projects, divided into inventories and
basic projects already authorized by ANEEL. They also include investments in the wind projects which won
LEN 2011 (A-3), five plants which did not start commercial operations, LEN 2012 (A-5), LER 2013 and
projects traded in the free market which are under construction through the Company’s subsidiaries. The
investments include amounts to purchase wind power generators, civil works, substations and sundry costs.
As at June 30, 2015, the consolidated balance of advances to suppliers amounts to R$953,432 (December 31,
2014, R$652,196), comprised of the following: an advance to purchase measurement towers with IEM, in the
amount of R$466, an advance under a substation equipment supply agreement entered into with ABB Ltda.,
Metalurgica Santa Rita and Sadesul, in the amount of R$114,075, an advance to purchase wind power
generators, in the amount of R$672,729, with GE, Alstom and others, an advance to assemble wind generators,
in the amount of R$77, with Mammoet, an advance for civil works, in the amount of R$115,214, with Consórcio
MGT and others, an advance for solar equipments in the amount of R$6,427, an advance for sundry services
related to the compliance with environmental requirements by wind plant facilities and other, in the amount of
R$4,044, and an advance to acquire a project in the amount of R$40,000.
Amounts to be apportioned refer mainly to project costs, with the implementation of plants and capitalized
interest. As of June 30, 2015 and 2014, capitalized interest in the period amounts to R$33,019 and R$27,272,
respectably.
14.7 Project breakdown
As of June 30, 2015, property, plant and equipment in progress totals R$2,117,733, broken down as follows:
49
Projects
Consolidated
LEN 2011 (A-3)
LEN 2012 (A-5)
LER 2013
LEN 2013 (A-5)
Subtotal - Regulated market
474,157
32,420
399,069
42,668
948,314
Subtotal - Free trading market
Other construction in progress
969,515
199,904
Total construction in progress
2,117,733
14.8 Write-off of projects
The Company reviews its portfolio of basic projects and inventories on a quarterly basis. After reviewing its
portfolio of development of small hydroelectric plant projects, the Company verified there is no inventory
projects to be discontinue. As at December 31, 2014, the total amount R$3,832 was elected to discontinue the
inventory projects.
15. Trade payables
Note
Trade payables
Transfer to liabilities directly related to assets held for sale
Consolidated
06/30/2015
12/31/2014
290,159
29.2
(11,840)
278,319
100,200
100,200
Parent
06/30/2015 12/31/2014
11,532
10,989
-
-
11,532
10,989
As of June 30, 2015, the consolidated balance of trade payables mainly includes the amounts relating to the
agreements for supply of equipment and materials contracted for the construction of plants under LEN 2011 (A3), LER 2013, LEN 2012 (A-5), free trading market, among others, relating to wind power generators,
substations and civil construction.
50
16. Borrowings, financing and debentures
16.1 Consolidated
Consolidated
06/30/2015
Current
Debt cost
Finance charges
12/31/2014
Noncurrent
Principal
Total
Finance charges
Principal
Current
Grand total
Total
Finance charges
Noncurrent
Principal
Total
Finance charges
Principal
Grand total
Total
Local currency
BNDES - LER 2009 (a)
T JLP + 1.92% p.a.
1,827
40,675
42,502
-
520,020
520,020
562,522
1,730
40,682
42,412
-
540,733
540,733
583,145
BNDES - LER 2009 (a)
T JLP + 2.18% p.a.
955
19,955
20,910
-
254,316
254,316
275,226
878
19,959
20,837
-
264,394
264,394
285,231
2,699
BNDES - LER 2009 (T ranche "C")(a)
T JLP
-
529
529
-
1,959
1,959
2,488
5
531
536
-
2,163
2,163
BNDES - LER 2009 (T ranche "D")(a)
T JLP
-
995
995
-
3,094
3,094
4,089
10
995
1,005
-
3,253
3,253
4,258
5,712
5,735
-
88,044
88,044
93,779
-
5,896
5,896
-
90,739
90,739
96,635
-
-
-
-
-
-
5,398
251,200
256,598
-
-
-
256,598
-
6,346
6,346
6,355
-
-
-
-
6,356
6,356
6,356
FNE - Banco do Nordeste do Brasil S.A. - Espra (b)
9.5% p.a. (8.08% p.a.)*
Promissory Notes - LEN 2011 (e)
100% CDI + 0.98% p.a.
BNDES - Renova Eólica
-
3.5% p.a.
Finep - CEOL Itaparica (f)
BNDES - Renova Eólica
23
9
-
9
(a)
T JLP + 2.45%
8,122
31,284
39,406
13,963
623,266
637,229
676,635
1,097
21,449
22,546
1,047
650,417
651,464
674,010
(a)
T JLP + 2.60%
3,697
11,515
15,212
4,701
1,855
4,464
6,319
2,177
150,575
152,752
159,071
-
-
-
3
1,320
1,323
1,323
140,000
140,000
140,061
T JLP
BNDES - Renova Eólica (T ranche "P")(a)
BNDES - Ponte I Diamantina Eólica (T ranche "A") (d)
T JLP + 3.55%
BNDES - Ponte I Diamantina Eólica (T ranche "B") (d)
T JLP + 2.5%
Subtotal borrowings
Borrowing costs
41
-
244,741
249,442
264,654
41
-
1,320
1,320
1,361
-
-
-
1,697
144,768
146,465
2,714
280,733
283,447
-
19,085
536,166
555,251
18,664
-
(1,181)
Transfer to liabilities directly related to assets held
for sale (Note 29.2)
(2,805)
(67,249)
TO TAL BO RRO WINGS AND FINANCING
16,280
467,736
(1,181)
1,743,106
1,761,770
-
(10,742)
(10,742)
(70,054)
-
(859,518)
(859,518)
484,016
18,664
872,846
891,510
61
146,465
283,447
33
2,317,021
11,067
(11,923)
(929,572)
1,375,526
11,067
-
61
345,176
(801)
344,375
33
356,243
(801)
355,442
3,227
3,227
75,000
75,000
75,033
1,924,950
1,928,177
2,284,420
(11,126)
-
(11,126)
(11,927)
-
1,913,824
1,917,051
2,272,493
500,269
*15% timely payment bonus
Debentures - 3rd issuance - Renova Energia S.A.
(c)
Debentures - 1st issuance - Renova Eólica Participações S.A. (g)
Subtotal debentures
Borrowing costs
TO TAL DEBENTURES
123.45% CDI
IPCA + 7.6054% p.a.
3,458
-
3,458
-
500,000
500,000
503,458
269
-
269
-
500,000
500,000
532
4,593
5,125
-
158,521
158,521
163,646
667
-
667
-
73,676
73,676
74,343
3,990
4,593
8,583
-
658,521
658,521
667,104
936
-
936
-
573,676
573,676
574,612
-
(1,007)
(1,007)
-
(10,077)
-
(52)
(52)
-
3,990
3,586
7,576
-
657,027
936
(52)
884
-
(9,070)
649,451
(9,070)
649,451
(1,361)
572,315
(1,361)
572,315
(1,413)
573,199
51
16.2 Parent
Pare nt
06/30/2015
C urre nt
Finance charge s
Local curre ncy
Debentures - 3rd issuance - Renova Energia S.A.(c)
Borrowing costs
TO TAL DEBENTURES
Principal
12/31/2013
Noncurre nt
Total
Principal
Curre nt
Grand
Total
total
500,000
503,458
Finance charge s
Principal
Noncurre nt
Total
Principal
Grand
Total
total
500,000
500,269
Debt cost
123.45% CDI
3,458
-
-
(904)
3,458
(904)
3,458
(904)
2,554
500,000
(8,237)
491,763
(8,237)
491,763
(9,141)
494,317
269
-
269
-
(52)
(52)
269
(52)
217
500,000
(1,361)
498,639
(1,361)
498,639
(1,413)
498,856
52
16.3 Collaterals
As at June 30, 2015, the balance payable of borrowings and financing is collateralized as follows:
Receivables
Pledge of shares
Mortgage/Sale of assets
Surety - money
Total
BNDES (a)
7,748,008
1,129,952
2,394,338
158,247
11,430,545
BNB (b)
483,052
112,123
169,394
13,682
778,251
Debentures (c)
1,242,075
1,242,075
Total
8,231,060
2,484,150
2,563,732
171,929
13,450,871
16.4 Changes
Changes in borrowings, financing and debentures are as follows:
Consolidated
Principal Finance charges
Parent
Total
Principal Finance charges
Total
Balances as of December 31, 2013
2,320,045
70,211
2,390,256
300,064
36,203
336,267
Borrowings and financing
Accrued finance charges
Finance charges paid
Finance charges capitalized
Finance charges added to the principal
Financing and debentures repayment
2,006,419
23,972
(1,517,912)
110,012
(240,518)
99,497
(23,972)
-
2,006,419
110,012
(240,518)
99,497
(1,517,912)
500,000
(301,883)
27,314
(81,183)
17,935
-
500,000
27,314
(81,183)
17,935
(301,883)
Borrowing costs
Recognition of borrowing costs
Borrowing costs capitalized
Balances as of December 31, 2014
Borrowings and financing
Accrued finance charges
Finance charges paid
Finance charges capitalized
Financing and debentures repayment
Finance charges added to the principal
Borrowing costs
Recognition of borrowing costs
Transferência para passivos diretamente
associados a ativos mantidos para venda
Balances as of June 30, 2015
(3,149)
1,061
26
2,830,462
383,958
(307,138)
21,791
(9,838)
1,151
(926,767)
1,993,619
15,230
101,752
(86,473)
33,021
(21,791)
(2,805)
38,934
(3,149)
1,061
26
2,845,692
383,958
101,752
(86,473)
33,021
(307,138)
-
(9,838)
1,151
(929,572)
2,032,553
406
498,587
-
269
406
498,856
-
29,031
(33,359)
7,517
-
29,031
(33,359)
7,517
-
(8,254)
526
-
(8,254)
526
-
-
-
490,859
3,458
494,317
53
16.5 Maturity of non-current amounts (principal and finance charges)
Maturities of the amounts classified in noncurrent liabilities (consolidated) are as follows:
Maturity year
2016
2017
2018
2019
2020
2021 to 2025
2026 to 2030
+ 2030
Total
06/30/2015
Consolidated
Parent
66,653
136,004
207,877
71,450
206,159
71,450
229,207
71,450
1,042,039
285,650
501,463
30,889
2,420,291
(*)
500,000
(*)
(*) This amount does not include borrowings costs
16.6 Summary of agreements
(a) BNDES agreements (long term)
LER 2009
Subsidiaries Pajeú do Vento, Planaltina, Porto Seguro, Nossa Senhora da Conceição, Guirapá, Serra do Salto,
Guanambi, Alvorada and Rio Verde, with the intermediation of subsidiary Salvador Eólica, entered into a
financing agreement with BNDES in the total amount of R$586,677. Financing is subject to interest rates of
1.92% p.a. + Long-term Interest Rate (TJLP), payable in 16 years. The first installment fell due on May 15, 2013
and the last will mature on April 15, 2029. The nine plants total 195.2MW of installed capacity and average 84
MW of contracted firm power. In April 2014, the last installment of the financing agreement, in the amount of
R$4,370, was released.
The total amount financed for Porto Seguro and Serra do Salto plants includes subloan “D”, which is designed for
social investments, in the total amount R$6,400. The financing is subject to TJLP rate, with a two-year grace
period for interest payment and a six-year grace period for principal repayment. The first installment fell due on
May 15, 2013 and the last will mature on May 15, 2019. In April 2014, the last installment of the financing
agreement, in the amount of R$2,500, was released
Subsidiaries Candiba, Igaporã, Ilhéus, Licínio de Almeida and Pindaí, with the intermediation of subsidiary Bahia
Eólica, entered into a financing agreement with BNDES, in the total amount of R$297,380. Financing is subject to
interest rates of 2.18% p.a. + TJLP (Long-Term Interest Rate) and 16 years for principal repayment. The first
installment fell due on April 15, 2013 and the last will mature on March 15, 2029. The five plants total an installed
capacity of 99.2 MW and average contracted firm power of 43 MW. In April 2014, the last installment of the
financing agreement, in the amount of R$192, was released.
The total amount financed for Candiba and Ilhéus includes subloan “C”, which is designed for social investments,
in the total amount R$3,000. The financing is subject to TJLP rate, with a two-year grace period for interest
payment and a six-year grace period for principal amortization. The first installment fell due on January 15, 2014
54
and the last will mature on December 15, 2029. In April 2014, the last installment of the financing agreement, in
the amount of R$248, was released
All BNDES contracts are collateralized by pledged shares, collateral assignment of credit and emerging rights,
financed assets, bank guarantee letter during the construction and first year of commercial operations and reserve
accounts equivalent to three months of debt service and three months of operation and maintenance. Under this
operation, the Debt Service Coverage Ratio (ICSD) = [(activity cash generation + closing cash balance from prior
year)/debt service] must be greater than or equivalent to 1.3. As of June 30, 2015, this ratio was met.
LER 2010 and LEN 2011 (A-3)
Subsidiary Renova Eólica, with the intermediation of subsidiaries Ametista, Araças, Borgo, Caetité, Dourados,
Espigão, Maron, Morrão, Pelourinho, Pilões, Da Prata, Seraíma, Serra do Espinhaço, Tanque, Ventos do Nordeste,
its direct subsidiary Nova Renova and the Company obtained a financing in the amount of R$1,044,100 (a direct
agreement executed on June 4, 2014, in the amount of R$734,020, and a transfer agreement entered into with
Banco do Brasil, in the amount of R$310,080). As of June 30, 2015, the amount released was R$910,077, which
was used to settle the bridge loan obtained from BNDES, in the amount of R$647,894 and the remainder part of
promissory notes, in the amount of R$251,200.
The direct BNDES financing will be divided into 16 tranches, from “A” to “P”, having the followings features: (a)
tranches A, C, D, E, F, G, I, J, M and P will have a use and grace period through December 15, 2015, with a
repayment term of 192, in monthly consecutive installments, each one in the amount of the debt principal falling
due, divided by the number of installments yet to fall due. The first installment will mature on January 15, 2016
and the last, on December 15, 2031; and (b) tranches B, H, K, L, N and O have a use and grace period through
December 15, 2014, with a repayment term of 192, in monthly consecutive installments, each one in the amount
of the debt principal falling due, divided by the number of installments yet to fall due. The first installment fell
due on January 15, 2015 and the last will mature on December 15, 2030.
Tranches A, B, C, D, E, F, G, H, I, J, K, L, M, N and O are subject to interest rates of 2.45% p.a.+ TJLP where
Tranche P is subject to TJLP.
The transfer agreement with Banco do Brasil is subject to a rate of 2.60% p.a. + TJLP.
All agreements entered into with BNDES are collateralized by pledged shares, collateral assignment of receivables
and emerging rights, financed assets, bank guarantee letter and reserve accounts equivalent to three months of debt
service and three months of operation and maintenance. Under this transaction, the Debt Service Coverage Ratio
(ICSD) = [(activity cash generation + closing cash balance from prior year)/debt service] must be greater than or
equivalent to 1.3 calculated at the end of the year. As of June 30, 2015, this ratio was met.
(b) BNB agreement
Subsidiary Espra, with the intermediation of subsidiary Enerbras, obtained a financing with BNB on June 30,
2006, in the total amount of R$120,096. The agreements are subject to an interest rate of 9.5% p.a. (which can be
reduced to 8.08% due to the 15% timely payment bonus) payable monthly on the 30th of each month. The
agreement matures on June 30, 2026. The contracted amount was fully released.
55
This financing is collateralized by property mortgage of Serra da Prata Complex, pledged shares, pledged
emerging rights of Authorization Resolutions, right to receive any and all amounts that, actually or potentially, are
or may become payable by the Concession Grantor to Espra, all other tangible or intangible rights of the
respective Authorization Resolutions and liquidity fund in reserve account (note 11). The financing agreement
with BNB does not include covenants requiring compliance with financial ratios subject to accelerated payment of
the debt.
(c) Simple, nonconvertible debentures
On December 15, 2014, a new debenture (3rd issuance) was issued in the amount of R$500,000. The proceeds
from this debenture were used to prepay the already existing debenture (2nd issuance) in the amount of R$370,754,
generating an additional cash for the Company in the amount of R$129,246. The 3rd issuance debenture yields the
same as the 2nd issuance one (123.45% of CDI), with a grace period of four years as from the agreement signature
date. The amortization will begin on December 15, 2018 with annual consecutive installments through December
15, 2024. Interest will be paid in semi-annual installments, with no grace period, in June and December of each
year, with the first payment falling due on June 15, 2015.
The 3rd issuance of debentures was made in accordance with CVM Instruction 476, as resolved by the Company’s
Board of Directors’ meeting of December 17, 2014 (“RCA”). Debentures have no restructuring clause.
The debentures are collateralized by the pledge of 100% of the Enerbras’ shares owned by the Company and
collateral assignment of assets and rights deposited in restricted account with Banco do Brasil from the dividends
distributed by subsidiaries Enerbras and Nova Renova.
This transaction sets forth that the ICSD (Debt Service Coverage Ratio = dividends received/debt service) must be
greater than or equivalent to 1.0. The debt service is represented by the payment of principal and interest of the
falling due series in each year of verification. As of June 30, 2015, this ratio was met.
(d) BNDES (short-term)
On December 19, 2014, a short-term financing agreement was entered into between BNDES and Diamantina, in
the total amount of R$700,000, divided into two tranches: tranche “A”, in the amount of R$140,000, and tranche
“B”, in the amount of R$560,000, for wind farms under LEN 2012 (A-5), LER 2013 and free trading market. As
at June 30, 2015, the amount of R$418,000 had been released. The bridge loans will be settled on June 15, 2016 or
on the date the long-term financing with BNDES is released.
The principal of tranche A will be subject to interest of 3.55% p.a. above TJLP. The principal of tranche B will be
subject to interest of 2.50% p.a. above TJLP. The loans are collateralized by the shares issued by Diamantina and
the SPEs in which Diamantina holds shares.
This agreement does not include covenants requiring compliance with financial ratios subject to accelerated
payment of the debt.
(e) Promissory notes
On November 05, 2013, the indirect subsidiaries which are part of the wind farms under LER 2010 and LEN 2011
(A-3) issued commercial promissory notes, for public distribution with restrict placement efforts, in the amount of
56
up to R$400,000 and pursuant to CVM Instruction 476. The distribution is financially settled through CETIP and
the commercial bills were deposited in the name of the respective holder as registered with CETIP’s Electronic
Custody System.
The promissory notes will be subject to compensatory interest calculated based on the accumulated variation of
100% of the daily average interbank deposit (DI) rate, “over extra group”, plus a surcharge of 0.98% per year.
On April 30, 2014, these indirect subsidiaries settled the commercial promissory notes, in the amount of
R$400,000 (principal) plus interest for the period and renegotiated the issuance of new promissory notes for an
additional period of 6 months as from April 30, 2014, in the amount of R$400,000, under the same financial
conditions as those of the first issuance.
On August 29, 2014, when the second tranche of the agreement with BNDES was released, part of the promissory
notes was settled, thus remaining a balance of the principal in the amount of R$251,200.
On February 02, 2015, promissory notes issued against eight companies under LEN 2011 (A-3) were settled, in
the total amount of R$259,316, out of which R$251,200 relating to the principal and R$8,116 relating to interest.
(f) FINEP
On December 19, 2013, subsidiary Centrais Elétricas Itaparica S.A. entered into a financing agreement with
Financiadora de Estudos e Projetos - FINEP, in the amount of R$107,960. The funds from this financing will be
used to implement a hybrid and wind power generation and distribution plant. The financing is subject to interest
of 3.5% p.a., with a grace period of 36 months, which covers the period from the agreement signature date and to
the date of maturity of the amortization installment, payable in 85 installments, with the first one falling due on
January 15, 2017 and the last on January 15, 2024. Through June 30, 2015, the amount of R$6,346 had been
released.
This financing is collateralized by bank letters of guarantee in an amount equivalent to 50% of each release, plus
finance charges, and the finance assets (equipment).
(g) Infrastructure debentures
On November 15, 2014, the 1st issuance of simple, non-convertible debentures, occurred, subject to collateral and
an additional unsecured guarantee, in two series (“Debentures”), for public distribution, with restrict placement
efforts, of the Company´s indirect subsidiary, Renova Eólica, in the total amount of R$146,000.
The 1st series debentures are subject to IPCA + prefixed interest of 7.6054% p.a. where those of the 2nd series are
subject to IPCA + prefixed interest of 7.8707% p.a.
Debentures were issued as infrastructure debentures, considering the classification of the ventures as priority
projects, under the ordinances issued by the Ministry of Mines and Energy (MME). The proceeds from these
debentures will be allocated to LER 2010 and LEN 2011 (A-3) in order to supplement the BNDES financing for
acquisition of new assets.
The first series in the amount of R$73,000 was settled in December 2014 and the second series, also in the amount
of R$73,000, was settled in January 2015. The amortization began on June 15, 2016 with semi-annual,
consecutive installments through December 15, 2025. The interest is payable in semi-annual installments, with no
grace period, in June and December of each year.
57
Under this transaction, the Debt Service Coverage Ratio (ICSD) = [(activity cash generation + closing cash
balance from prior year)/debt service] must be greater than or equivalent to 1.3 calculated at the end of the year.
As of June 30, 2015, this ratio was met.
On January 21, 2015, the 2nd series of debentures of the indirect subsidiary Renova Eólica, in the amount of
R$73,000, was settled. The amount was inflation adjusted based on IPCA + prefixed interest of 7.8707% p.a.,
from the issuance date, November 15, 2014 to the settlement date, of R$75,106.
17. Taxes payable
Note
IRPJ
COFINS
CSLL
INSS (third parties)
INSS
IRRF (payroll)
FGTS
ISS
PIS
PIS, COFINS and CSLL
IRRF
Other
TOTAL
Transfer to assets held for sale or liabilities directly
related to assets held for sale
TOTAL
Consolidated
06/30/2015 12/31/2014
6,191
1,881
3,522
1,175
1,535
672
414
3,064
447
880
2,176
137
22,094
29.2
(6,267)
15,827
4,214
3,636
2,426
1,641
1,315
1,267
430
874
789
557
300
112
17,561
17,561
Parent
06/30/2015 12/31/2014
24
36
1,532
972
414
110
5
391
129
114
3,727
3,727
6
45
1,315
883
430
48
1
145
57
72
3,002
3,002
58
18. Accounts payable / receivable - CCEE/Eletrobras
Consolidated
Assets
Note
Current
Eletrobras
CCEE
06/30/2015
12/31/2014
Liabilitties
06/30/2015
12/31/2014
1,294
1,294
199
199
21,559
21,559
21,174
1,165
22,339
22,092
6,100
7,777
15,627
(1,294)
-
(21,559)
-
-
(19,878)
-
(5,849)
-
Total
2,214
6,299
1,928
37,966
Stated as:
Current
Noncurrent
2,214
199
6,100
1,928
22,339
15,627
Noncurrent
CCEE
Transfer to assets held for sale or liabilities directly related to assets
held for sale:
Current
Eletrobras
CCEE
Noncurrent
CCEE
29.2
Eletrobras
The Power Purchase and Sale Agreement, entered into the indirect subsidiary Espra and Eletrobras, sets forth that
the sales revenues in the context of the CCEE is determined each year (from January to December). The financial
adjustment portion resulting from this calculation will be offset in the monthly invoices of the next year.
In the period ended June 30, 2015, the generated power volume (58,362 MWh) was lower than the invoice power
volume (82,080 MWh), which resulted after accounting of the Power Relocation Mechanism (MRE) in the context
of the CCEE – system for sharing the hydrological risks of the generators – in a negative financial adjustment in
the amount of R$3,160 (December 31, 2014, R$21,174). These provisions were transferred to the item "liabilities
directly associated with assets held for sale".
CCEE
The Reserve Power Agreements entered into the indirect subsidiaries under LER 2009, LER 2010 and CCEE set
forth that the differences between the power generated by plants and contracted power are calculated in each
contractual year.
The reimbursement for negative deviations (below the tolerance level – 10%) of generation will be paid in 12
equal monthly installments over the next agreement, at 115% of the current sales price, as set forth in subclause
11.3 of such agreement. The returns within the tolerance level – 10% of generation will be reimbursed in 12
installments after possible offset against the positive deviations as from the end of the first four-year period,
counted from the startup in commercial operation.
59
The reimbursement for positive deviations (above the tolerance level – 30%) of generation will be paid in 12 equal
monthly installments over the next agreement, at 70% of the current sales price, as set forth in subclause 8.11 of
such agreement. The returns within the tolerance level – 30% of generation will be reimbursed in 12 installments
after possible offset against the negative deviations as from the end of the first four-year period, counted from the
startup in commercial operation.
As of March 31, 2014, the Company reversed the provision for fines relating to the reimbursement of LER 2010
(see note 1.3).
(*) Information not reviewed by independent auditors.
18.1 Changes
Changes in the period are as follows:
Changes in assets
12/31/2013
CCEE
Total assets
-
Additions
6,299
6,299
Receipts
-
12/31/2014
Additions
6,299
6,299
17,087
17,087
Receipts
-
Transfer to
assets held for
sale
(21,172)
(21,172)
06/30/2015
2,214
2,214
Changes in liabilities
12/31/2013
Provision
Amortization 12/31/2014
Eletrobras
CCEE
Total liabilities
2,060
18,546
21,174
337
(2,060)
(2,091)
20,606
21,511
Tota, net
20,606
15,212
Transfer to
assets held for
sale
Provision
Amortization
06/30/2015
21,174
16,792
6,103
(9,015)
(5,718)
-
(21,559)
(5,849)
1,928
(4,151)
37,966
(2,912)
(5,718)
(27,408)
1,928
(4,151)
31,667
(19,999)
(5,718)
(6,236)
(286)
19. Provision for civil, tax and labor risks
As of June 30, 2015, the individual and consolidated provision for civil, tax and labor risks amounted to R$88
(December 31, 2014, R$79). The change of R$9 basically refers to monetary correction of Company’s
contingencies.
The Company’s and its subsidiaries’ management, based on the opinion of their legal advisors with respect to the
likelihood of favorable outcome from several claims, considers that the provisions recorded in the balance sheet
are sufficient to cover probable losses.
The Company and its subsidiaries are parties to several contingencies amounting to approximately R$12,371
(December 31, 2014, R$7,346), out of which civil claims in the amount of R$7,790 (December 31, 2014, R$3,
855), and labor claims in the amount of R$4,525 (December 31, 2014, R$3,491), which Management, based on
60
the opinion of its legal counsel, assessed as possible loss and did not record any provisions for the period ended
June 30, 2015. The main lawsuits refer to pain and suffering and termination of lease and rental agreements.
Power Grid Charges - National Energy Policy Council Resolution
CNPE Resolution 3, of March 6, 2013, defined new criteria for apportionment of the additional commissioning
cost of thermal power plants. According to the new criteria, the Power Grid Charges (ESS), for purposes of power
security, which was fully apportioned amongst free consumers and distributors, would be apportioned amongst all
members of the National Interconnected System (SIN), including generators and sellers.
The Brazilian Association of Independent Power Producers (APINE), of which the Company is a member,
obtained the preliminary injunction to suspend the effects of article 2 and 3 of CNPE Resolution 3, which
exempted the generators from the ESS payment in accordance with such Resolution.
The risk involved approximately R$1,420. Based on Management’s understanding and on the legal counsel’s
opinion, this risk was classified as possible loss and did not recognize a provision for the period ended June 30,
2015.
20. Provision for environmental costs
Note
Current
Consolidated
06/30/2015 12/31/2014
11,130
6,686
6,562
9,940
Current
Noncurrent
(4,654)
(1,606)
-
Total
11,432
16,626
6,476
4,956
11,432
6,686
9,940
16,626
Noncurrent
Transfer to liabilities directly related to assets
held for sale
Apresentados como:
Current
Noncurrent
29.2
Considering that: (a) before the PCHs and the wind power plants are placed into service, the Company obtains all
the environmental permits and, consequently, has a present obligation to comply with all the obligations set out in
such permits to be able to operate; (b) such obligation arises from past events (power plant construction); and (c) it
is expected that there will be cash outflows capable of generating future economic benefits, the Company provides
for socio-environmental costs in current and noncurrent liabilities, and capitalizes such costs in fixed assets over
the projects’ construction periods. After plant startup, such costs are recognized directly in profit or loss.
61
The provision is initially measured at fair value and, subsequently, adjusted to present value and upon change in
the value or timeliness of the estimated cash flows, which are considered sufficient for the subsidiaries’ future
disbursements during the phase of construction and the operation of wind farms in operation.
21. Equity and shareholders’ compensation
a)
Authorized capital
As prescribed by article 8 of the Bylaws, the Company is authorized to increase its capital, as approved by the
Board of Directors, regardless of any amendment to the bylaws, through the issuance of common or preferred
shares, up to the limit of R$5,002,000.
b)
Capital
On September 29, 2014, CEMIG GT subscribed and paid in 87,186,035 common shares issued by Renova, in the
total amount of R$1,550,072, through the capitalization of an advance for future capital increase, in the amount of
R$810,129, made on March 31, 2014 and through the assignment to Renova of the amount relating to the advance
for future capital increase in Chipley on February 14, 2014, in the amount of R$739,943. The capital increase was
authorized by the Company’s Board of Directors on October 27, 2014.
In addition to CEMIG GT, preemptive rights relating to 10,866 common shares were exercised by the Company’s
other shareholders, totaling 87,196,901 subscribed and paid-in common shares, in the total amount of
R$1,550,265.
On October 30, 2014, a capital increase was made through the stock option plan whereby eligible employees
subscribed and paid in 50,165 common shares in the amount of R$18.
A summary of the capital increases made in 2014, plus the R$17 paid during the first quarter, is shown in the table
below:
Date
09/29/2014
09/29/2014
10/30/2014
Total
Common
87,186,035
10,866
Number
Preferred
Total
Value
-
87,186,035
1,550,072
-
10,866
193
18
1,550,283
50,165
100,330
150,495
87,247,066
100,330
87,347,396
On May 6, 2015, the Board of Directors approved the capital increase on the basis of the stock option plan. The
eligible employees subscribed 39,169 common shares and 78,338 preferred shares, of which 33,669 common
shares and 37,338 preferred shares were paid. The shares were effectively issued by the custodian bank in July
2015.
As of June 30, 2015, the Company’s subscribed and paid-in totaled R$2,568,006 (2014, R$2,567,997), distributed
as follows:
62
RENOVA ENERGIA
Common
Preferred
Total shares
Number
%
Number
%
Controlling block
188,309,629
79.6%
0.0%
RR Participações
50,561,797
21.4%
0.0%
Light Energia
50,561,797
21.4%
0.0%
Cemig GT
87,186,035
36.8%
0.0%
Other shareholders
48,534,657
20.4%
81,811,136 100.0%
RR Participações*
8,260,093
3.5%
1,300,000
1.6%
BNDESPAR
9,311,425
3.9%
18,622,850
22.8%
InfraBrasil
11,651,467
4.9%
23,302,933
28.5%
FIP Caixa Ambiental
5,470,293
2.3%
10,940,586
13.4%
Other
13,841,379
5.8%
27,644,767
33.7%
236,844,286
100.0%
81,811,136 100.0%
Total
* Shares not included in the controlling block
Note: The controlling block considers shares subject to the Shareholders Agreement
Number
188,309,629
50,561,797
50,561,797
87,186,035
130,345,793
9,560,093
27,934,275
34,954,400
16,410,879
41,486,146
318,655,422
% of total
capital
%
59.1%
15.9%
15.9%
27.3%
40.9%
3.0%
8.8%
11.0%
5.1%
13.0%
100.0%
In the period 1,106 common shares were converted into preferred shares.
c)
Share issuance costs
Parent
06/30/2015 12/31/2014
Costs on issuance of shares
(41,757)
(41,757)
The Company records all share issuance costs in a specific line item. These amounts refer to consulting and
financial advisory fees relating to the capital increase operations, as shown below:
Event
Initial Pulic Offering (IPO)
Date
Costs on issuance
of shares
July 2010
13,686
New investor: Light Energia
September 2011
20,555
New investor: BNDESPAR
September 2012
1,871
New investor: CEMIG GT
September 2014
5,645
Total
d)
41,757
Reserves
Capital reserve
The Company recorded in the capital reserve the effect of costs on share-based payment relating to its plants under
LER 2009, LER 2010 and LEN 2011 (A-3) and other projects, as well as the awards paid relating to the successful
63
IPO and also agreements entered into with its executive officers. These records both reflect the shares granted and
the shares to be granted in the medium and short term. These accounting records are detailed in note 26.4.
e)
Dividends
Accumulated losses, if any, and provision for income tax and social contribution will be deducted from profit
(loss) for the period before profit sharing.
Net profit recorded will be allocated successively in the order below, as set forth in Chapter XVI of the Brazilian
Corporate Law:
(i) 5% will be directed, prior to any other allocation, to the legal reserve, which cannot exceed 20% of capital;
(ii) a portion, as proposed by the management bodies and approved at the General Meeting, may be allocated to
the provision for risks, as prescribed by article 195 of the Brazilian Corporate Law;
(iii) a portion will be allocated to the payment of mandatory dividends to shareholders.
The shareholders are entitled to receive as mandatory dividends, in each year, 25% on net profit for the year, less
or plus the following: (i) amount allocated to legal reserve; and (ii) amount allocated to reserve for contingencies
and reversal of this reserve from prior years.
22. Net revenue
06/30/2015
MWh*
Power generation/supply
Electric power supply - PCHs - Eletrobras
Wind power supply - CCEE
Difference in generation - Eletrobras/CCEE agreement
Total revenue
82,081
967,324
95,918
Consolidated
06/30/2014
06/30/2015
MWh*
106,872
556,640
(44,353)
(-) Deductions from revenue
COFINS
PIS
Total deductions
Other revenues
Operations - solar and sale of electric power
(-) Deductions from revenue
COFINS
PIS
Total
1,145,322
619,159
17,967
187,514
19,999
225,480
06/30/2014
Parent
06/30/2015 06/30/2014
21,829
99,874
(12,580)
109,123
-
-
(6,649)
(1,386)
(8,035)
(3,247)
(704)
(3,951)
-
-
5,834
6,092
244
116
(463)
(101)
5,524
110,696
(14)
(4)
223
223
(9)
(2)
101
101
(574)
(125)
5,132
222,577
(*) Information not revised by independent auditors.
64
23. Costs and expenses
Consolidated
Cost of
services
(1)
06/30/2015
Operating
expenses
Cost of
services
Total
06/30/2014
Operating
expenses
Total
Tusd/Tust
Inspection fee
11,386
536
11,922
-
11,386
536
11,922
4,935
40
4,975
-
4,935
40
4,975
Personnel and management
Outside services
Rentals and leases
Travels
Depreciation
Discontinued projects
Insurance
Telephony and IT
Materials and consumables
19,662
2,468
184
52,902
312
117
1,741
17,954
24,910
1,328
3,941
1,300
491
1,632
1,064
17,954
44,572
3,796
4,125
54,202
803
1,749
2,805
4,321
2,603
34,861
1,028
271
8,769
17,075
444
1,516
734
1,343
146
1,141
420
8,769
21,396
3,047
1,516
35,595
1,343
1,174
1,141
691
(149)
5,161
798
83,196
95,118
5,326
57,946
57,946
5,161
6,124
141,291
153,213
(4,645)
3,393
40
41,872
46,847
2,070
33,658
33,658
(4,645)
3,393
2,110
75,530
80,505
Fine on reimbursement
Power for resale
Other
(2)
Total
(1) Tusd - distribution system use tariff and Tust - transmission system use tariff
(2) As mentioned in note 1.2, the Company reversed the fine balance, for wind farms under LER 2010 having not being placed into operation and recorded this
reversal in the same line item as that which triggered the operation cost.
Parent
Personnel and management
Outside services
Rentals and leases
Travels
Depreciation
Discontinued projects
Insurance
Telephony and IT
Materials and consumables
Other
Total
Cost of
services
06/30/2015
Operating
expenses
2,297
299
2,596
17,954
16,277
978
3,564
1,290
54
1,470
1,007
2,083
44,677
Total
17,954
16,277
978
3,564
3,587
54
1,470
1,007
2,382
47,273
Cost of
services
12/31/2014
Operating
expenses
833
40
873
8,769
9,135
444
1,462
727
1,343
146
1,081
344
1,196
24,647
Total
8,769
9,135
444
1,462
1,560
1,343
146
1,081
344
1,236
25,520
65
24. Finance income (costs)
Consolidated
06/30/2015
06/30/2014
Parent
06/30/2015
06/30/2014
Finance income
Income from short-term investments
Interest income - intragroup loans
Discounts obtained
Other finance income
Total finance income
18,270
6
628
18,904
25,982
7
166
26,155
4,024
75
4,099
16,460
637
7
143
17,247
Finance costs
Debt charges
Interest
Interest - intragroup loan
Tax on Financial Transactions (IOF)
Banking fees
Other finance costs
Total finance costs
Total finance income (costs)
(101,752)
(222)
(1,506)
(297)
(6,655)
(110,432)
(91,528)
(46,758)
(315)
(460)
(57)
(2,220)
(49,810)
(23,655)
(29,031)
(58)
(356)
(96)
(570)
(30,111)
(26,012)
(11,651)
(28)
(295)
(126)
(23)
(254)
(12,377)
4,870
66
25. Income tax and social contribution
Consolidated
Parent
06/30/2015
06/30/2014
06/30/2015
06/30/2014
(42,932)
325
(56,408)
(6,066)
34%
34%
34%
34%
14,597
(111)
19,179
2,062
(281)
(810)
(281)
(810)
(7,112)
(2,112)
5,662
4,924
3,880
2,818
-
-
Temporary provisions
(1,486)
1,124
(1,486)
1,124
Tax loss carryforwards
(23,074)
(7,300)
(23,074)
(7,300)
(13,476)
(6,391)
-
-
(Loss) earnings before income tax and social contribution
Combined income tax and social contribution rate
Income tax and social contribution at statutory rates
Permanent deductions (additions)
Nondeductible expenses
Share of profit (loss) of subsidiaries
Effect on subsidiaries taxed under the deemed income
Effect of unrecognized deferred tax assets on:
Income tax and social contribution in profit or loss
The Company did not record taxable income for the period. As of June 30, 2015, the Company had tax loss
carryforwards to offset, for which deferred taxes were not recorded, in the following amounts:
Parent
06/30/2015 06/30/2014
Tax loss for the year
Prior years' tax loss carryforwards
Total tax loss carryforwards
(67,865)
(188,828)
(256,693)
(21,470)
(125,723)
(147,193)
The consolidated tax refers to subsidiaries Espra (deemed income regime), 14 wind farms under operation
(deemed income regime), subholdings Bahia Eólica and Salvador Eólica (actual income regime) and 15 plants
under construction (actual income regime).
Income tax and social contribution are calculated at the rate of 15%, plus a 10% surtax on taxable income
exceeding R$240 for income tax and 9% on taxable income for social contribution, and take into consideration the
offset of tax loss carryforwards, limited to 30% of taxable income.
The income tax and social contribution under the deemed income regime are paid on gross revenues on a quarterly
basis, based on the estimated percentage, according to the conditions and rates set forth in applicable legislation
(estimated bases of 8% and 12% on sales, income tax and social contribution, respectively, plus other finance
income).
Deferred taxes on tax loss carryforwards were not recognized as future taxable income is not expected.
67
26. Related-party transactions
Parent
Effective term
Start
End
Intragroup loans
Espra
Salvador Eólica
Bahia Eólica
CE Itaparica
Total
07/10/2009
05/27/2011
10/17/2011
01/01/2014
12/31/2014
12/31/2015
12/31/2015
06/30/2014
Assets
06/30/2015
12/31/2014
Finance income (costs)
06/30/2015
06/30/2014
2,184
910
1,106
578
51
24
(295)
416
219
3,094
1,684
75
2
342
-
38,452
-
-
-
14,927
-
-
3,094
55,063
75
342
Redeemable shares
(*)
Nova Renova
Advance for future capital increase
Chipley
(**)
(*) Redeemable shares issued by the subsidiary Nova Renova S.A. in accordance with its bylaws.
(**) The advance for future capital increase agreement does not meet the criteria to characterize it as an
investment.
The main balances of assets and liabilities as of June 30, 2015, as well as the transactions that impact the profit or
loss for the period, relating to the related-party transactions, resulted from the Company’s transactions with its
subsidiaries.
Despite of the short-term maturities, the Company expects that these amounts will be performed in the long term.
26.1 Trade receivables
Trade receivables – loans entered into with the subsidiaries described in the table. These loans were performed to
meet these companies’ cash needs.
For the balances (receivable and payable), the amount payable is subject to TJPL rate, plus interest varying
between 0.25% and 0.5% p.a.
68
26.2 Sales
In August 2011, the Company entered into a power purchase and sale commitment with Light Energia, whereby
Renova will deliver average 200.4 MW(*) of wind power, corresponding to 403.5 MW(*) of installed capacity;
wind farms will begin to generate power between 2015 and 2016. Out of the total amount of 200.4 MW(*), 1/3 of
the power was traded with LIGHTCOM Comercializadora de Energia S.A. and 2/3 with CEMIG GT.
In March 2014, Renova Comercializadora traded average 308.0 MW with CEMIG GT, corresponding to 676.2
MW of installed capacity. On June 17, 2014, a Share Purchase and Sale Commitment Investment Agreement was
entered into among the Company and Companhia Energética de Minas Gerais (“CEMIG”), which will hold a 50%
stake in the project. The wind farms that will satisfy this agreement will start to operate in 2018.
Pursuant to the Investment Agreement, the transaction will be carried out upon the acquisition by CEMIG of 50%
of the voting and total capital of a publicly-held company (SPE) to be established by the Company, in which all
agreements relating to the Wind Project will be paid in. The acquisition price will correspond to up to R$113,450
relating to 50% of the amounts of advances relating to agreements already entered into by the Company, adjusted
by the fluctuation of the interbank deposit rate (“CDI”) from effective disbursement by the Company up to the
date of payment by CEMIG. After the acquisition, CEMIG and Renova will share the future investment of the
Wind Project proportionally to their share in the SPE’s capital.
(*) Information not reviewed by independent auditors.
26.3 Compensation of key management personnel
Compensation of key management personnel for the periods ended June 30, 2015 and 2014, as set forth in CVM
Resolution 560, of December 11, 2008, amounted to R$7,516 and R$3,083, respectively, including short-term
benefits only.
Compensation of the Statutory Board paid by the Company in the period
06/30/2015
Statutory
Board (*)
06/30/2014
Non-statutory
Board (*)
Total
Statutory Board (*)
4.00
4.16
8.16
6
1,037
951
1,022
934
2,059
1,885
1,255
1,109
Direct and fringe benefits
86
88
174
146
Compensation due to participation in
committee
n/a
n/a
n/a
n/a
Variable compensation
3,693
1,122
4,815
1551
Bonus
3,693
1,122
4,815
1551
Charge s
246
396
642
277
Post-employme nt bene fits
n/a
n/a
n/a
n/a
4,976
2,540
7,516
3,083
Number of me mbe rs
Accrued fixed compe nsation
Salary or fees
T otal compensation by management body
69
Monthly average compensation of the Statutory Board
06/30/2014
06/30/2015
Statutory Board (*)
Non-statutory
Board (*)
Statutory
Board
Number of members
4.00
4.16
6.00
Highest individual compensation amount
Lowest individual compensation amount
Average individual compensation amount
343
30
184
51
33
42
240
150
195
26.4 Stock option plan
The Company’s Stock Option Plan, created under the terms of article 168, § 3, of Law 6404/76, and approved at
the Extraordinary General Meeting, held on January 18, 2010, sets forth the general grant conditions for the
Company’s stock options. The Plan’s main purpose is to retain qualified professional and improves the expansion
and performance of the Company’s goals, aligned with its shareholders’ and management’s interests. The Stock
Option Plan (“Plan’) established that beneficiaries eligible under the Plan include the Company’s directors,
executive officers and employees, as well as individuals providing services to the Company or other companies
under its control.
The options are granted within the maximum limit of 5% of the total shares representing the Company’s capital,
on a diluted basis, including in the calculation all options already granted under the plan. Once the option is
exercised, the shares subject to this option will be issued through the Company’s capital increase, to be approved
under the terms of applicable legislation and the Company’s Bylaws.
Plan 2011
Plan 2011 was designed to ensure the high performance of the wind projects, the grants and vesting are
simultaneous and fully related to goals achieved in each project, subject to the percent of 3% of the project’s net
present value calculated on the following dates:
10% on the execution of the power sale agreement;
20% on the execution of the financing for project construction;
20% on the date the project is placed into operation; and
50% after one year of start-up of operations of the project.
The options granted entitle beneficiaries to acquire shares at the price of R$0.34 per unit (corresponding to a one
common and two preferred shares).
The services provided by project paid through shares/units are as follows:
70
10%
20%
20%
50%
10%
20%
20%
50%
upon execution of the power sale agreement
upon execution of the project construction financing agreement
on the date the project is placed into operation
one year after the project is placed into operation
upon execution of the power sale agreement
upon execution of the project construction financing agreement
on the date the project is placed into operation
one year after the project is placed into operation
LER 2009
Total amount
R$/thousand
Number of units Unit value - R$
53,385
26.86
1,434
106,771
26.86
2,868
127,319
29.16
3,713
344,006
30.97
10,654
631,481
18,669
Grant and vesting
date
2011
2011
2012
2013
LER 2010
Total amount
R$/thousand
Number of units Unit value - R$
27,272
26.86
733
72,772
29.40
2,139
78,693
29.40
2,314
215,340
29.40
6,331
394,077
11,517
Grant and vesting
date
2011
2014
2015
scheduled for 2016
LEN 2011
10%
20%
20%
50%
upon execution of the power sale agreement
upon execution of the project construction financing agreement
on the date the project is placed into operation
one year after the project is placed into operation
Number of units Unit value - R$
10,498
31.76
34,106
29.40
37,841
29.40
101,468
29.40
183,913
Total amount
R$/thousand
333
1,003
1,113
2,983
5,432
Grant and vesting
date
2012
2014
scheduled for 2015
scheduled for 2016
In addition, the Company distributed the following shares in connection with the Initial Public Offering (IPO) and
key management agreements:
Parent
Initial Public Offer (IPO) Success
Initial Public Offer (IPO) Success
Key executive agreement
Key executive agreement
Key executive agreement
Number of units Unit value - R$
360,051
24.78
125,000
32.96
48,000
33.15
22,890
25.35
54,000
26.76
609,941
Total amount
R$/thousand
8,922
4,120
1,591
580
1,445
16,658
Grant and vesting
date
2011
2011
2011
2012
2012
For beneficiaries terminated during 2013, options were granted under the new projects (free trading market) as
part of existing contractual conditions, as shown below:
71
The grant
date
18/03/13
19/09/13
20/12/13
Number of
units granted
11,573
47,288
4,547
Fair value
of the grant
32.32
46.55
47.00
Exercise
price
0.34
0.34
0.34
Others
Fair value
in the grant date
370
2,185
212
25
2,792
In 2013, the fair value of the grants was recorded in the reverse for employee’s benefits in the amount of R$2,792.
On June 26, 2013, the Company’s Board of Directors resolved to suspend Plan 2011 and did not allow the
admission of new participants and limited to the projects traded between December 2009 and June 2013. The
eligible beneficiaries will continue to participate in the Plan until all goals of these projects are met.
In 2014, for the goals of projects traded by the Company after November 2011, the amount of R$3,432, including
charges, was paid via payroll. These amounts were recorded in property, plant and equipment in progress of the
respective project.
The other grants in 2014 refer to the share-based payment plan of former projects already recorded.
Plan 2013
Also on June 26, 2013, another program was approved (“Plan 2013”). The grants are exercisable in up to 6 years,
with a vesting period of four years (25% per year) subsequently to the grant date. The share exercise price is
determined by the average weighted by the volume of the 30 trading sessions prior to the reference date.
The first grant was approved by the Company’s Board of Directors on December 19, 2014, in the total volume of
444,520 shares, corresponding to 148,173 units. The exercise price of each option is R$38.42 per unit. As of June
30, 2015, the Company recorded the amount of R$654 directly in equity and profit (loss) for the period.
27. Financial instruments and risk management
The Company and its subsidiaries conduct transactions with financial instruments. These financial instruments are
managed through operating strategies and internal controls that aim at liquidity, profitability and security. Gains
and losses on these transactions are consistent with the policies set by Company’s management.
The risks associated with these operations are managed according to the practices defined by Management,
including the monitoring of the levels of exposure of each market risk and estimated future cash flow. These
practices also determine that the information is updated in the operating systems, as well as the information and
operation of the transactions with counterparties.
a.
Fair value of financial instruments
Fair value is the amount for which an asset could be exchanged or a liability could be settled, between parties
aware of and interested in the business, through a transaction without beneficiaries. The definition of fair value
covers several variations on the metrics adopted to measure an amount at reliable value.
72
The calculation of the fair value was determined based on the available market information and methodologies
adopted in the evaluation. However, significant judgment is necessary to understand the market information and
estimate the fair value. Some line items have accounting balance equivalent to the fair value. This results from the
fact that these financial instruments have characteristics similar to those that would be obtained had these financial
instruments been traded in the market.
The use of different market methodologies may have a material effect on the estimated realizable values. The
transactions with financial instruments are recorded in the Company’s balance sheet at their carrying amount,
which is equivalent to their fair value in cash and cash equivalents, trade receivables, related parties, collaterals
and restricted deposits and trade payables. The accounting balances of borrowings, financing and debt charges
differ from fair value.
C onsolidated
Fair value
Financial assets
06/30/2015
Carrying amount
12/31/2014
06/30/2015
12/31/2014
Curre nt asse ts
Short-term investments
53,272
538,697
53,272
538,697
T rade receivables
41,473
68,627
41,473
68,627
1,835
40
1,835
40
171,929
160,487
171,929
160,487
290,159
100,200
290,159
100,200
8,583
936
7,576
884
555,251
356,243
554,071
355,442
658,521
573,676
649,451
572,315
1,761,769
1,928,177
1,751,027
1,917,051
Collaterals and restricted deposits
Noncurre nt asse ts
Collaterals and restricted deposits
Financial liabilities
Curre nt liabilitie s
T rade payables
Debentures
Borrowings and financing
Noncurre nt liabilitie s
Debentures
Borrowings and financing
73
Parent
Fair value
Financial assets
06/30/2015
Carrying amount
12/31/2014
06/30/2015
12/31/2014
Curre nt asse ts
Short-term investments
4,219
198,831
4,219
198,831
T rade receivables
85
-
85
-
Collaterals and restricted deposits
40
40
40
40
3,094
55,063
3,094
55,063
11,532
10,989
11,532
10,989
3,458
269
2,554
217
500,000
500,000
491,763
498,639
Noncurre nt asse ts
Related parties
Financial liabilities
Curre nt liabilitie s
T rade payables
Debentures
Noncurre nt liabilitie s
Debentures
b. Categories of financial instruments
The classification of financial instruments and their accounting balances are broken down below:
Consolidated
06/30/2015
Financial assets
Loans and
re ceivables
Fair value through
profit or loss
12/31/2014
O ther at
amortized cost
Loans and
receivables
Total
Fair value through
profit or loss
O ther at
amortized cost
Total
Current assets
Short-term investments
T rade receivables
Collateral and restricted deposits
-
53,272
-
53,272
-
538,697
-
538,697
41,473
-
-
41,473
68,627
-
-
68,627
1,835
-
-
1,835
40
-
-
40
171,929
-
-
171,929
160,487
-
-
160,487
Noncurre nt assets
Collateral and restricted deposits
Financial liabilities
Current liabilities
T rade payables
-
-
290,159
290,159
-
-
100,200
100,200
Borrowings and financing
-
-
554,070
554,070
-
-
355,442
355,442
Debentures
-
-
7,576
7,576
-
-
884
884
Noncurre nt liabilities
Borrowings and financing
-
-
1,751,027
1,751,027
-
-
1,917,051
1,917,051
Debentures
-
-
649,451
649,451
-
-
572,315
572,315
74
Pare nt
06/30/2015
Financial assets
Fair value through
profit or loss
Loans and
re ceivable s
12/31/2014
O the r at
amortiz e d cost
Total
Fair value through
profit or loss
Loans and
re ceivable s
O the r at
amortiz e d cost
Total
Curre nt asse ts
Short-term investments
-
4,219
-
4,219
-
198,831
-
85
-
-
85
-
-
-
-
1,835
-
-
1,835
40
-
-
40
3,094
-
-
3,094
55,063
-
-
55,063
T rade payables
-
-
11,532
11,532
-
-
10,989
10,989
Debentures
-
-
2,554
2,554
-
-
217
217
-
-
491,763
491,763
-
-
498,639
498,639
T rade receivables
Collateral and restricted deposits
198,831
Noncurrent asse ts
Related parties
Financial liabilities
Curre nt liabilitie s
Noncurrent liabilities
Debentures
c. Fair value measurement
The Company adopts the measurement at fair value of its financial assets and financial liabilities. Fair value is
measured at market value based on the assumptions that the market players are able to measure an asset or
liability. For purposes of consistency and comparison, the fair value hierarchy prioritizes the inputs adopted in the
measurement of the three main levels, as follows:
Level 1. Active market: Price - a financial instrument is considered as quoted in an active market if the quoted
prices are immediately and regularly available in stock exchange or organized over-the-counter market, by
operators, brokers or market association, by entities whose purpose is to disclose the prices by regulatory agencies,
and if these prices represent market transactions regularly carried out between independent parties, without
beneficiaries.
Level 2. Without active market: Valuation method – In relation to financial instruments not traded in an active
market, the fair value must be determined based on the valuation/pricing methodology. Criteria used include
current fair value of another financial instrument significantly similar, analysis of discounted cash flow and option
pricing models. The purpose of the evaluation method is to determine the transaction price on the measurement
date through a commercial exchange not subject to personal interests.
Level 3. Without active market: Inputs for an asset or liability not based on observable market variations (nonobservable inputs) as at June 30, 2015 – the Company did not have any financial instrument classified in this
category.
The instruments stated at fair value are broken down as follows:
75
Description
Assets
Short-term investments
Description
Assets
Short-term investments
Balance at
03/31/2015
53,272
Balance at
12/31/2014
538,697
Active market
- quoted price
(level 1)
-
Fair value as of June 30, 2015
No active market No active market valuation technique
nonobservable inputs
(level 2)
(level 3)
53,272
-
Fair value as of December 31, 2014
Active market
No active market No active market - quoted price
valuation technique
nonobservable inputs
(level 1)
(level 2)
(level 3)
-
538,697
-
Short-term investments: prepared taking into consideration the security market quotation or market information
used in such calculation, based on future interest and exchange rates of similar instruments. The fair value of a
security corresponds to its value at the maturity date, discounted to present value using a discount obtained using
the market interest curve, in Brazilian reais.
In the period ended June 30, 2015, there were no transfers between fair value measurements of level 1 and level 2
or between level 3 and level 2.
d. Market risk
The market risk reflects the possibility of monetary losses due to the changes in variables that impact the
prices and rates traded in the market. These fluctuations basically impact all sectors and, therefore,
represent financial risk factors.
The Company’s and its subsidiaries’ borrowings and financing, as described in Note 16, were entered into with
BNB, BNDES and the Debentureholders. The contractual rules applicable to financial liabilities represent risks
related to these exposures. As at June 30, 2015, the Company and its subsidiaries are exposed to market risk
associated to the CDI, TJLP and fixed rates.
e. Sensitivity analysis (consolidated)
The Company and its subsidiaries present below the additional disclosures on their financial instruments required
by CVM Instruction 475/08, specifically on the sensitivity analysis in addition to the sensitivity analysis required
by IFRSs and accounting practices adopted in Brazil. The Company adopted the assumptions below, defined in
CVM Instruction 475/08, to conduct this sensitivity analysis:
• definition of a probable scenario for risk behavior that, if materialized, can generate adverse results for the
Company, and which is benchmarked by an independent external source (Scenario I);
• definition of two additional scenarios with stresses of at least 25% and 50% in the risk variable considered
(Scenario II and Scenario III, respectively); and
76
• presentation of the impact of the defined scenarios on the fair values of the financial instruments operated by the
Company and its subsidiaries.
Transaction as of June 30, 2015
Rate effective at June 30, 2015
Short-term investments:
Annual estimated CDI rate for 2016
Annual effect on short-term investments:
Loss
Transaction
Rate effective at June 30, 2015
Borrowings:
DEBENTURES - RENOVA
Annual estimated CDI rate for 2016
Annual effect on borrowings:
Gain
Loss
Transaction
Rate effective at June 30, 2015
Borrowings:
BNDES - LP - LER 2009
BNDES - LP - Renova Eólica
BNDES - CP - Diamantina Eólica
Annual estimated TJLP rate for 2016
Reduction
Loss
Risk
CDI decrease
Risk
CDI increase
Risk
TJLP increase
TJLP increase
TJLP increase
Scenario I Probable
scenario
Scenario II 25%
decrease
Scenario III 50%
decrease
13.64%
53,272
11.66%
13.64%
53,272
8.75%
13.64%
53,272
5.83%
(1,069)
(2,642)
(4,215)
Scenario II 25%
decrease
Scenario III 50%
decrease
13.64%
13.64%
13.64%
503,458
11.66%
503,458
14.58%
503,458
17.49%
(12,306)
-
5,811
23,928
Scenario II 25%
decrease
Scenario III 50%
decrease
6.00%
6.00%
6.00%
844,325
942,650
429,912
6.00%
844,325
942,650
429,912
7.50%
844,325
942,650
429,912
9.00%
-
33,253
66,507
Scenario I Probable
scenario
Scenario I Probable
scenario
For short-term investments, the probable scenario considers SELIC future rates, used as the basis for calculation
of the CDI rate, based on the Central Bank of Brazil’s expectations, over a year, at 11.66%. Scenarios II and III
consider a reduction of this rate by 25% (8.75% p.a.) and 50% (5.83% p.a.), respectively. These projections are
also applicable to debentures and promissory notes subject to the CDI rate, considering scenarios II and III, based
on an increase of 25% (14.58%) and 50% (17.49%), respectively.
For borrowings and financing subject to the TJLP rate, the Company and its subsidiaries considered a probable
scenario according to the rate for the third quarter of 2015 provided by BNDES, which rate is expected to be
maintained over a year, at 6%. Scenarios II and III consider a reduction of this rate by 25% (7.50% p.a.) and 50%
(9.00% p.a.), respectively. The weighted average spread in the short-term investments and loans is: (i) 101.31% of
77
CDI rate on short-term investments; (ii) 2.42% + TJLP on BNDES loans; and (iii) 123.45% of CDI rate on
debentures.
The effects (increase/decrease) included in this sensitivity analysis refer to interest rate changes considered in
scenarios I, II and III based on the interest rate in effect as at June 30,2015.
These sensitivity analyses have been prepared in accordance with CVM Instruction 475/2008, whose purpose is to
measure the effects from the changes in market variables on each financial instrument of the Company and its
subsidiaries. However, the actual settled amounts could differ from these estimates due to the subjectivity inherent
in the process used in preparing the analyses.
f. Liquidity risk
The liquidity risk determines the parent’s and subsidiary’s ability to settle the obligations assumed. In order to
determine the subsidiary’s financial capacity to properly comply with the commitments assumed, the maturity
flows of the funds raised and other obligations are included in the disclosure. For further information on the
Company’s borrowings, see note 16.
The Company’s management solely enters into with credit lines to leverage its operating capacity. This
assumption is confirmed based on the characteristics of the Company’s borrowings.
f.1. Liquidity and interest rate risk tables
The tables below detail the remaining contractual maturity of the Company’s and its subsidiaries’ non-derivative
financial liabilities and the contractual repayment periods. These tables were prepared using the undiscounted cash
flows of the financial liabilities based on the nearest date on which the Company and its subsidiaries should settle
the related obligations. The tables include interest and principal cash flows. As interest flows are based on floating
rates, the undiscounted amount was based on the interest curves at period end. The contractual maturity is based
on the most recent date on which Renova Group should settle its respective obligations.
Consolidated
Intruments at interest rate
1 to 3
months
3 months to
1 year
1 year to 5
years
Over 5
years
Total
Fixed
Borrowings and financing - principal and finance charge
Debentures - principal and finance charge
24,859
-
520,117
9,155
524,397
208,894
1,247,715
449,055
2,317,088
667,104
Total
24,859
529,272
733,291
1,696,770
2,984,192
Parent
Intruments at interest rate
1 to 3
months
3 months to
1 year
1 year to 5
years
Over 5
years
Total
Fixed
Debentures - principal and finance charge
-
-
143,845
359,612
503,457
Total
-
-
143,845
359,612
503,457
78
g. Credit risk
The credit risk reflects the possibility that the Company may not exercise its rights. This description is directly
related to line item Trade receivables.
Carrying amount
Consolidated
Financial assets
Note
Parent
06/30/2015
12/31/2014
06/30/2015
12/31/2014
41,473
68,627
85
-
Current
Trade receivables
8
In the power sector, the operations carried out are directed to the regulatory agency that maintains the active
information on the positions of produced and consumed power. Based on structure, planning is made to operate
the system without interferences or interruptions. Power is sold through auctions, agreements, among others. This
system is reliable and controls the payments by the players in the market.
The Company does not carry out transactions for speculative purposes. The Company manages its risks on a
continuous basis, evaluating whether the practices adopted in the performance of its activities are aligned with
Management’s policies. The Company does not carry out transactions with financial instruments for equity hedge
purposes as it believes that the risks to which its assets and liabilities are exposed can be compensated between
each other over the normal course of its activities. These financial instruments are managed using operating
strategies that seek to obtain liquidity, profitability, and security. The control policy consists of a permanent
monitoring of contracted terms and conditions compared to market terms and conditions. As at June 30, 2015, the
Company did not make speculative investments in derivatives or any other risk assets.
h. Derivative transactions
No transactions with derivative financial instruments were conducted in the periods reported.
i. Capital management
Consolidated
06/30/2015
12/31/2014
Borrowings and financing debt
(-) Cash and cash equivalents and short-term investments
2,962,125
97,376
2,845,692
595,617
Net debt
2,864,749
2,250,075
Equity
Financial leverage ratio - %
2,453,896
117%
2,509,641
90%
The objectives of the Company in managing its capital are to ensure that the Company is always capable of
providing return to its shareholders and benefits to other stakeholders, and maintain an ideal capital structure to
reduce this cost.
In order to maintain or adjust the capital structure, the Group may adjust the amount of dividends paid to
stockholders, return capital to stockholders or, also, issue new shares or sell assets to reduce, for example,
indebtedness.
79
j. Risk of shortage of wind
This risk results from the shortage of wind due to natural factors, which is reduced because the “wind deposits” in
Brazil are one of the best in the world, as in addition to high speed, wind is considered stable, different from
certain regions in Asia and the United States, which are subject to cyclones, typhoons and other natural factors.
k. Risk of shortage of water
Indirect subsidiary Energética Serra da Prata S.A. and the jointly controlled entity Brasil PCH generate power
through small hydroelectric plants (PCHs). A long period of shortage of rain, during the humid season, will reduce
the water volume of the plants’ reservoirs. An extreme condition would imply decrease in revenues.
The occurrence of unfavorable hydrologic conditions, and the obligation to deliver the contracted energy, may
result in the Company’s exposure to the long-term energy market, which would affect its future financial results.
However, except for one PCH, 100% of the hydroelectric generation capacity of the other PCHs is part of the
Power Relocation Mechanism (“MRE”), which mitigates part of the hydrologic risk, through the allocation
between all plants linked to the MRE.
28. Earnings per share
Basic earnings (loss) per share are calculated by dividing profit (loss) for the period attributable to the holders of
common and preferred shares of the Parent by the weighted average number of common and preferred shares
outstanding during the period.
Diluted earnings (loss) per share is calculated by dividing profit (loss) for the year attributable to the holders of the
Parent’s common and preferred shares by the weighted average number of common and preferred shares available
during the year, plus the weighted average number of common shares issued on the assumption of exercise of
stock options with strike price lower than fair value.
According to the Company’s bylaws, preferred shares are entitled to the same conditions of the common shares in
profit sharing.
The table below shows the data and number of shares used to calculate basic and diluted earnings (loss) per share
for the periods indicated in the statement of operations.
80
Parent
06/30/2015
Loss for the year
06/30/2014
(56,408)
(6,066)
318,691
231,308
(0.177)
(0.026)
318,691
231,308
(Loss) basic earnings per share:
Weighted average of outstanding common shares (in thousands)
(Loss) basic earnings per share (in R$)
Diluted earnings per share:
Weighted average of outstanding common shares (in thousands)
Dilutive effect of stock options (in thousands)
Total shares applicable to dilution (in thousands)
Loss diluted earnings per share (in R$)
478
-
319,136
231,308
(0.177)
(0.026)
29. Assets classified as held for sale
29.1 Parent
Changes in Parent’s investments:
Assets
Bahia Eólica Participações S.A.
Salvador Eólica Participações S.A.
Energética Serra da Prata S.A.
Total assets classified as held for sale
06/30/2015
206,555
339,177
109,453
655,185
81
29.2 Consolidated
Balance sheets as of June 30, 2015
ASSETS
CURRENTS
Cash and cash equivalents
Short-term investments
Trade receivables
Accounts receivable - CCEE
Recoverable taxes
Prepaid expenses
Advances to suppliers
Other receivables
Total current assets
Bahia
06/30/2015
Salvador
Espra
Combined
7,690
390
6,002
647
449
15,178
10,751
818
11,729
1,294
1,642
661
284
27,179
5,121
34,436
5,544
107
64
207
20
45,499
23,562
35,644
23,275
1,294
2,396
64
1,317
304
87,856
NONCURRENTS
Accounts receivable - CCEE
Collaterals and restricted deposits
Deferred taxes
Other receivables
Property, plant and equipment
Total noncurrent assets
31
49,864
31
425,467
475,393
19,847
108,380
130
768,377
896,734
13,682
1,882
35
170,321
185,920
19,878
171,926
2,043
35
1,364,165
1,558,047
TOTAL ASSETS
490,571
923,913
231,419
1,645,903
82
EQUITY AND LIABILITIES
CURRENTS
Trade payables
Borrowings and financing
Taxes payable
Accounts payable - CCEE/Eletrobras
Provision for social and environmental costs
Dividends payable
Other payables
Total current liabilities
Bahia
06/30/2015
Salvador
Espra
Combinado
3,648
21,044
1,809
1,399
2
27,902
6,261
43,276
4,081
3,255
456
57,329
1,931
5,735
377
21,559
4,313
7
33,922
11,840
70,055
6,267
21,559
4,654
4,769
9
119,153
NONCURRENTS
Borrowings and financing
Deferred taxes
Accounts payable - CCEE/Eletrobras
Provision for social and environmental costs
Related parties
Total noncurrent liabilities
251,904
77
2,740
483
910
256,114
519,569
1,422
3,109
1,123
2,184
527,407
88,044
88,044
859,517
1,499
5,849
1,606
3,094
871,565
EQUITY
206,555
339,177
109,453
655,185
TOTAL LIABILITIES AND EQUITY
490,571
923,913
231,419
1,645,903
Classified as:
Assets classified as held for sale
Liabilities directly related to assets held for sale
1,645,903
982,855
83
Income and cash flow statements as of June 30, 2015
06/30/2015
Bahia
Salvador
Espra
Combined
Profit of assets classified as held for sale
Revenue
Costs and expenses
Profit before taxes
Income tax and social contribution
Profit of period
40,479
(28,883)
11,596
(2,177)
9,419
88,767
(55,538)
33,229
(4,705)
28,524
11,752
(7,540)
4,212
(1,229)
2,983
140,998
(91,961)
49,037
(8,111)
40,926
Cash flow of assets classified as held for sale
Net cash of operating activities
Net cash provided of investing activities
Net cash of financing activities
(Redução) aumento no saldo de caixa e equivalentes de caixa
12,046
(967)
(10,252)
827
15,986
1,522
(19,502)
(1,994)
3,494
(10,015)
(2,859)
(9,380)
31,526
(9,460)
(32,613)
(10,547)
6,863
7,690
12,745
10,751
14,501
5,121
34,109
23,562
827
(1,994)
(9,380)
(10,547)
Cash and cash equivalents at beginning of period
Cash and cash equivalents at end of period
(Decrease) Inrease in Cash and Cash Equivalents
On May 8, 2015 the Board of Directors approved the conclusion of an agreement of contribution of securities
between Renova, the SE Emerging Markets Yield, Inc. ("Global terraform") and SunEdison Inc. ("SunEdison" )
through which the Company agrees to contribute the operating assets related to the projects of Espra (three small
hydropower plants), Salvador wind (nine wind farms sold in LER 2009) and Bahia wind (5 wind farms sold in
LER 2009) to R$1,613,000 subject to adjustments contemplated in the agreement.
The consummation of the agreement is subject to a number of conditions precedent, including the completion of
the TerraForm Global IPO, obtaining third-party consent and regulatory approvals, including CADE, ANEEL and
Eletrobrás.
30. Insurance coverage
The Company and its subsidiaries contracted insurance for certain property, plant and equipment items, civil
liability and other contractual guarantees. As at June 30, 2015, current policies are summarized as follows:
Risks of generation, construction and transmission:
84
Operation
Insured item
Coverage
Civil liability – LER 2009
Effective term
Start
End
Insured
R$ 10,000
06/28/2013
10/10/2015 Renova Energia
R$ 1,287,348
07/11/2014
07/11/2015 Renova Energia
R$ 183
09/08/2014
09/08/2015
COELBA
Operating risks
R$ 233,591
09/25/2014
09/25/2015
ESPRA
Civil liability
R$ 233,591
09/25/2014
09/25/2015
ESPRA
Operating risks (LER 2010)
R$ 872,116
10/10/2014
10/10/2015 Renova Energia
Civil liability – LER 2010
R$ 671,452
10/10/2014
10/10/2015 Renova Energia
Operating risks (LER 2009)
Surety - Contractual obligations
Construction
Insured item
Coverage
Effective term
Start
End
Insured
Performance bond for implementation of LEN 2011
R$ 41,193
12/05/2011
08/21/2015
Transportation / Delay Start Up (Project LER 2010 / LEN 2011)
R$ 801,500
11/30/2012
08/01/2015 Renova Energia
Performance Bond (LEN 2012)
R$ 3,144
04/02/2013
04/01/2017
ANEEL
Performance Bond (LER 2013)
R$ 31,750
12/05/2013
12/01/2015
ANEEL
Performance Bond (A-5 2013)
R$ 64,715
04/28/2014
08/01/2018
ANEEL
Performance Bond (ACL)
R$ 40,140
09/19/2014
10/01/2015
ANEEL
Performance Bond (ACL)
R$ 40,560
09/19/2014
10/01/2016
ANEEL
Performance Bond (ACL)
R$ 19,520
09/19/2014
01/31/2017
ANEEL
Performance Bond (ACL)
R$ 4,320
09/19/2014
01/31/2016
ANEEL
Performance Bond (ACL)
R$ 6,480
09/19/2014
01/10/2015
ANEEL
Civil liability (ACL)
ANEEL
R$ 2,229,363
12/01/2014
01/01/2017 Renova Energia
Civil liability (LEN 2012 (A-5))
R$ 77,645
12/01/2014
01/01/2017 Renova Energia
Civil liability/ Transportation/Enginnering Risk (LER 2013)
R$ 654,103
12/01/2014
01/01/2017 Renova Energia
Cosntruction Bond (A-5 2014)
R$ 20,633
04/01/2015
07/01/2019
ANEEL
Cosntruction Bond (A-5 2014)
R$ 20,633
04/01/2015
07/01/2019
ANEEL
Performance bond for implementation (LER 2014)
R$ 33,903
03/04/2015
04/01/2018
ANEEL
Engineering risks /Transportation (LEN 2012)
R$ 77,645
12/01/2014
01/01/2017 Renova Energia
Engineering risks (ACL)
R$ 112,615
11/14/2014
01/01/2017 Renova Energia
Engineering risks/ Transportation (ACL)
R$ 417,050
12/01/2014
01/01/2017 Renova Energia
Engineering risks/ Transportation (ACL)
R$ 825,864
12/01/2014
01/01/2017 Renova Energia
Engineering risks/ Transportation (ACL)
R$ 834,099
12/01/2014
01/01/2017 Renova Energia
Engineering risks/ Transportation (ACL)
R$ 132,350
12/01/2014
01/01/2017 Renova Energia
Administration and Portfolio
Insured item
Coverage
Effective term
Start
End
Insured
Civil liability – D&O
R$ 30,000
01/31/2015
01/31/2016 Renova Energia
Civil liability - Initial Public Offering – POSI
R$ 25,000
07/07/2014
07/07/2015 Renova Energia
R$ 593
09/12/2014
09/12/2015
Rd Equipment (Wind measurer - Lidar)
LIDAR
85
31. Commitments
The Company and its subsidiaries have contractual obligations and commitments assumed in connection with the
construction and maintenance of their wind farms, including purchases of machinery and equipment, in the
amount of R$4,303,569, civil construction, in the amount of R$438,507 and acquisition of projects, in the amount
of R$93,212.
32. Non-cash transactions
As of June 30, 2015, the Company conducted the following noncash transactions; therefore, these transactions are
not reflected in the statement of cash flows:
Note
Finance charges capitalized
Finance income capitalized
Payment of capital in subsidiaries through property, plant and equipment
Acquisition of property, plant and equipment - Trade payables
Proposed dividends of parents
Payment of borrowings and promissory notes through a new financing
Payment of interest on borrowings through a new financing
14.2, 14.4
14.2
14.4
14.2
13.4
16
16
Consolidated
06/30/2015
06/30/2014
33,021
(3,915)
(267,297)
-
55,578
(5,787)
(165,211)
1,000,000
47,894
Parent
06/30/2015
06/30/2014
7,517
2,022
-
9,209
46,611
15,427
-
33. Subsequent events
33.1 Sale of assets
On July 15, 2015, the Company entered into definitive agreements with TerraForm Global, Inc., ("TerraForm
Global"), TerraForm Global, LLC and SunEdison, Inc. ("SunEdison") divided into two phases:
The first phase of the operation, announced on May 7, 2015, included the signing of the following agreements:
(i) The contract of purchase and sale of shares for the sale of the assets of Espra project for R$136,000, through
payment in cash;
(ii) purchase agreement and sale of shares for the sale of the assets of the Bahia project, the value (equity value) of
R$451,000, through payment in cash; and
(iii) the stock exchange contract for the exchange of the shares of the Company's subsidiaries which hold the
assets of Salvador project, for R$1,026,000, by TerraForm Global shares based on the price per share to be paid in
the tender offer (IPO) of TerraForm Global in progress.
The above amounts are subject to adjustments included in their contracts.
The second phase of the operation, approved and celebrated on July 15, 2015, includes other assets that have longterm power sales contracts, operational and non-operational ("Backlog") and projects under development and to be
developed by the Company that may sell power under long-term contracts (Pipeline), and included the signing of
the following agreements:
86
(i) The contract of exchange of shares for the exchange of the shares of the Company's subsidiaries which hold the
assets of each Backlog the project, as listed below, for the total value of the company (enterprise value, which
considers the debt in the value of assets) of R$13.4 billion. The values will be adjusted on the exchange date as the
applicable contractual provisions. The assets, with 2204.2 MW of installed capacity, will be exchanged after their
respective entries into commercial operation and according to the schedule below negotiated by the parties and
Renova will receive the corresponding value in TerraForm Global shares based on the average of the last 30
quotations trading days prior to closing.
Asset
Light I
Light II
LEN A-5 2012
LER 2010
LEN A-3 2011
LER 2014 - wind
LER 2014 - solar
LER 2013
PPA Cemig
LEN A-5 2013
LEN A-5 2014
Installed
capacity (MW)
200.7
202.8
18.9
167.7
218.4
43.5
53.5
159.0
676.2
355.5
108.0
Year exchange
2017
2017
2017
2018
2018
2018
2018
2019
2019
2020
2020
(ii) option contract through which the TerraForm Global will have until December 31, 2016, a call option and
preference in the acquisition of renewable energy projects under development and to be developed by the
Company that may sell energy contracts long term. The amount of TerraForm Global shares to be received by
Renova will be determined based on a multiple of cash available for distribution of their project in the years
following transfer, according to the methodology agreed by the parties. After this period, the parties will negotiate
new mechanics of the purchase option and first refusal to acquire the projects, aiming to reflect market conditions
and the Company's competitiveness.
33.2 Entry of SunEdison in the Company's Controlling Block
On July 15, 2015, the contract of purchase and sale of shares for the sale of the Company's shares held by Light
Energia S.A. for SunEdison was concluded.
The closing of this transaction is still subject to conditions precedent, among which: regulatory approvals and
manifestation as the transfer restrictions of shares and rights of first refusal and tag-along, provided for in the
existing shareholder agreements.
Upon closing of this transaction, SunEdison will adhere to existing shareholders agreements of the Company and
will be part of the Renova controlling block, as follows:
87
RENOVA ENERGIA
Controlling block
RR Participações
SunEdison
Cemig GT
Other shareholders
RR Participações*
BNDESPAR
InfraBrasil
FIP Caixa Ambiental
Other
Total
Common
Number
188.309.629
50.561.797
50.561.797
87.186.035
48.534.657
8.250.393
9.311.425
11.651.467
5.470.293
13.851.079
236.844.286
Preferred
%
79,6%
21,4%
21,4%
36,8%
20,4%
3,5%
3,9%
4,9%
2,3%
5,8%
100,0%
Number
81.811.136
1.280.600
18.622.850
23.302.933
10.940.586
27.664.167
81.811.136
*
*
%
0,0%
0,0%
0,0%
0,0%
100,0%
1,6%
22,8%
28,5%
13,4%
33,7%
100,0%
Total shares
Number
188.309.629
50.561.797
50.561.797
87.186.035
130.345.793
9.530.993
27.934.275
34.954.400
16.410.879
41.515.246
318.655.422
% of total
capital
%
59,1%
15,9%
15,9%
27,3%
40,9%
3,0%
8,8%
11,0%
5,1%
13,0%
100,0%
*
Carlos Mathias Aloysius Becker Neto
Chief Executive Officer
Pedro V.B. Pileggi
Vice-President for Finance, Business Development and
Investors Relations Officer
Ricardo de Lima Assaf
Vice-President for Legal Affairs, Regulation and
Institutional Relations Officer
Ney Maron de Freitas
Vice-President for Environment and Sustainability
Reinaldo Cardoso da Silveira
Accountant CRC 014311-0/0-S- SP
88
(Convenience Translation into English from the
Original Previously Issued in Portuguese)
Renova Energia S.A.
and Subsidiares
Individual and Consolidated Interim Financial
Information for the Quarter Ended
June 30, 2015 and Report on Review of Interim
Financial Information
Deloitte Touche Tohmatsu Auditores Independentes
Deloitte Touche Tohmatsu
Auditores Independentes
Avenida Tancredo Neves 450
Edf. Suarez Trade – 29º andar
41.820-020 – Salvador - BA
Tel: + 55 (71) 2103-9400
Fax:+ 55 (71) 2103-9440
www.deloitte.com.br
(Convenience Translation into English from the Original Previously Issued in Portuguese)
REPORT ON REVIEW OF INTERIM FINANCIAL INFORMATION
To the Shareholders, Directors and Management of
Renova Energia S.A.
São Paulo - SP
Introduction
We have reviewed the accompanying individual and consolidated interim financial information of
Renova Energia S.A. (“Company”), identified as Parent and Consolidated, respectively, included in
the Interim Financial Information Form (ITR), for the quarter ended June 30, 2015 and which
comprise the balance sheet as of June 30, 2015, and the related income statement and the statement
of comprehensive income for the three-month and for the six-month then ended, and statement of
changes in equity and statement of cash flows for the six-month then ended, including a summary
of significant accounting policies and other explanatory notes.
Management is responsible for the preparation and fair presentation of the individual and
consolidated interim financial information in accordance with technical pronouncement CPC 21
(R1) – Interim Financial Reporting and IAS 34 – Interim Financial Reporting, issued by the
International Accounting Standard Board - IASB, as well as for the presentation of such
information in accordance with the standards issued by the Brazilian Securities Commission
(CVM), applicable to the preparation of Interim Financial Information (ITR). Our responsibility is
to express a conclusion on this interim financial information based on our review.
Scope of Review
We conducted our review in accordance with Brazilian and International Standards on Review
Engagements (NBC TR 2410 and ISRE 2410 - Review of Interim Financial Information Performed
by the Auditor of the Entity). A review of interim financial information consists of making
inquiries, primarily of persons responsible for financial matters and accounting, and applying
analytical and other review procedures. The scope of a review is substantially less than an audit
conducted in accordance with International Standards on Auditing and consequently does not
enable us to obtain assurance that we would become aware of all significant matters that might be
identified in an audit. Therefore, we do not express an audit opinion.
Deloitte refers to one or more of Deloitte Touche Tohmatsu Limited, a UK private company limited by guarantee (“DTTL”), its
network of member firms, and their related entities. DTTL and each of its member firms are legally separate and independent
entities. DTTL (also referred to as “Deloitte Global”) does not provide services to clients. Please see www.deloitte.com/about for a
more detailed description of DTTL and its member firms.
Renova Energia S.A. and Subsidiaries
Conclusion on the individual interim financial information
Based on our review, nothing has come to our attention that causes us to believe that the
accompanying individual interim financial information included in the ITR referred to above was
not prepared, in all material respects, in accordance with technical pronouncement CPC 21 (R1),
applicable to the preparation of Interim Financial Information (ITR), and presented in accordance
with the standards issued by CVM.
Conclusion on the consolidated interim financial information
Based on our review, nothing has come to our attention that causes us to believe that the
accompanying consolidated interim financial information included in the ITR referred to above was
not prepared, in all material respects, in accordance with technical pronouncement CPC 21 (R1) and
international standard IAS 34, applicable to the preparation of Interim Financial Information (ITR),
and presented in accordance with the standards issued by CVM.
Emphasis
As described in Note 14, the fixed assets used in the power generation activity under the
independent production regime are depreciated over their estimated useful lives, considering the
facts and circumstances that are mentioned in said Note. As new information or decisions by the
regulatory agency or concession grantor are published, the current depreciation period for such
assets may or may not be changed. Our conclusion does not contain qualification related to this
issue.
Other matters
Statement of value added
We have also reviewed the individual and consolidated statements of value added (“DVA”) for the
six-month period ended June 30, 2015, prepared under the responsibility of the Company's
management, the presentation of which is required by standards issued by CVM applicable to
preparation of Interim Financial Information (ITR) and consider as supplemental information under
International Financial Reporting Standards - IFRS, which do not require the presentation of these
statement. These statements were submitted to the same review procedures described above and,
based on our review, nothing has come to our attention that causes us to believe that they were not
prepared, in all material respects, in relation to the individual and consolidated interim financial
information taken as a whole.
The accompanying interim financial information has been translated into English for the
convenience of readers outside Brazil.
São Paulo, August 4, 2015
DELOITTE TOUCHE TOHMATSU
Auditores Independentes
© 2015 Deloitte Touche Tohmatsu. All rights reserved.
José Luiz Santos Vaz Sampaio
Engagement Partner
2
Download