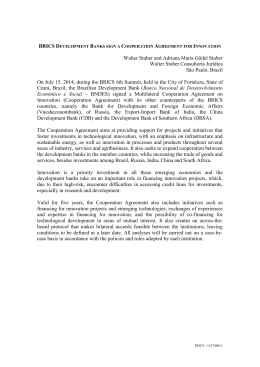
Naohiko Baba
Blaise Gadanecz
Patrick McGuire
+41 61 280 8819
[email protected]
+41 61 280 8417
[email protected]
+41 61 280 8921
[email protected]
Highlights of international banking and financial
market activity 1
The BIS, in cooperation with central banks and monetary authorities worldwide,
compiles and disseminates several datasets on activity in international banking
and financial markets. The latest available data on the international banking
market refer to the second quarter of 2008. The discussion on over-the-counter
derivatives refers to the first half of 2008, and that on international debt
securities and exchange-traded derivatives draws on data for the third quarter
of 2008.
The international banking market
Outstanding claims in the international banking market contracted sharply
during the second quarter of 2008. BIS reporting banks’ international claims 2
fell by an unprecedented $1.1 trillion (Graph 1, centre panel), with most
currency segments registering sizeable declines. While a significant decrease
in interbank claims (–$812 billion) accounted for most of the overall decline
(Graph 1, left-hand panel), international claims on non-banks also fell (for the
first time since 1998), mainly vis-à-vis the United States, the United Kingdom
and Japan. At the same time, residents of emerging markets and many central
banks around the world reduced their placements of funds with BIS reporting
banks (Graph 1, right-hand panel).
Interbank activity contracts
Banks throughout the reporting area continued to write down and unwind their
international positions, with banks in the United Kingdom reporting the largest
decline in outstanding claims (81% of the overall decline). Graph 2 plots UK
1
Queries concerning the banking statistics should be addressed to Patrick McGuire and Blaise
Gadanecz, queries concerning over-the-counter derivatives statistics to Jacob Gyntelberg,
and queries concerning international debt securities and exchange-traded derivatives
statistics to Naohiko Baba. The authors gratefully acknowledge the research assistance
provided by Carlos Mallo, Denis Pêtre and Swapan-Kumar Pradhan.
2
In the BIS locational banking statistics by residence, international claims (liabilities) are crossborder claims (liabilities) plus locally booked claims (liabilities) in foreign currencies vis-à-vis
residents of the reporting country.
BIS Quarterly Review, December 2008
25
Changes in international claims¹
In billions of US dollars
By sector
By currency
Banks
Non-banks
2,000
2,000
United States
Euro area
Japan
2,000
1,000
1,000
1,000
0
0
0
–1,000
Pound sterling
Swiss franc
Other currencies
–2,000
01 02 03 04 05 06 07 08
By vis-à-vis countries
US dollar
Euro
Yen
–1,000
United Kingdom
Emerging markets
Other countries
–2,000
01 02 03 04 05 06 07 08
–1,000
–2,000
01 02 03 04 05 06 07 08
¹ International claims are cross-border claims plus locally booked claims in foreign currencies on residents of the reporting country.
Source: BIS locational banking statistics by residence.
Graph 1
resident banks’ cumulative net (assets minus liabilities) change in international
positions vis-à-vis banks (solid lines) and non-banks (dashed lines), broken
down by currency (left-hand panel) and by residence of the counterparty (righthand panel). Since 2000, these banks have built up large net claims on nonbank borrowers, financed by similarly large net liabilities vis-à-vis the banking
sector (which include borrowing from central banks). These net positions have
contracted since the start of the crisis in mid-2007, with particularly large
movements in the second quarter of 2008. Net borrowing from other banks
(including inter-office borrowing) shrank by $352 billion (left-hand panel, solid
red line), stemming from a $545 billion decline in gross claims and an even
larger one (–$897 billion) in gross liabilities. At the same time, net claims on
non-banks contracted by $307 billion (left-hand panel, dashed red line), driven
by a reduction of $339 billion in gross claims, primarily vis-à-vis non-banks in
the United States (right-hand panel, dashed green line).
The contraction in interbank borrowing was especially pronounced in the
US dollar segment of the market, although interbank borrowing in other
currencies also fell sharply. Across all reporting countries, US dollar interbank
liabilities dropped by $693 billion. Banks in the United Kingdom registered a
$423 billion decline, roughly half of this vis-à-vis banks in the United States.
Reduced liabilities to banks in offshore financial centres, Asia-Pacific, Africa
and the Middle East and to other banks in the United Kingdom made up much
of the difference. Banks in Switzerland and in many offshore financial centres
also reported significant decreases in US dollar interbank liabilities. In contrast,
banks in the euro area reported a $76 billion increase, primarily vis-à-vis banks
in the United States.
26
BIS Quarterly Review, December 2008
Lending to banks in
the United Kingdom
contracts …
... particularly in US
dollars
Cumulative net claims of banks located in the United Kingdom¹
In billions of US dollars
By sector and currency
By sector and counterparty
Total
US dollar
Euro
Other currencies
United States
Euro area
UK residents
Other countries
1,000
500
500
250
0
0
–500
–250
–1,000
00
01
02
03
04
05
06
07
08
–500
00
01
02
03
04
05
06
07
08
1
Thick lines refer to cumulative net interbank claims and dashed lines to cumulative net claims on non-banks, booked by banks
located in the United Kingdom. Net claims are claims minus liabilities, and include reporting banks’ cross-border positions in all
currencies plus local positions vis-à-vis UK residents in foreign currencies, expressed at constant end-Q2 2008 exchange rates. These
flows are estimated by combining data from several reporting countries, which helps in identifying the residence of the holders of
banks’ debt security liabilities.
Source: BIS locational banking statistics by residence.
Graph 2
The BIS consolidated banking statistics, 3 which track reporting banks’
foreign interbank exposures excluding inter-office activity, shed light on which
banking systems experienced large moves during the second quarter of 2008
(Graph 3). Across all banking systems, (gross) consolidated interbank claims
dropped by $298 billion in that quarter, the first outright decrease since 2005.
This was mainly caused by reduced interbank positions reported by UK banks
(–$171 billion) and French banks (–$102 billion), especially vis-à-vis US,
Dutch, German and UK banks. US banks, in contrast, reported reductions of
only $9 billion.
Over the past few quarters, these interbank exposures have declined
relative to banks’ capital bases (Graph 4, right-hand panel). While these
reductions, most pronounced in the case of Dutch banks, primarily reflected the
contraction in the interbank claims described above, they were also the result
of increases in Tier 1 capital levels reported by most banking systems.
First decline in claims on non-banks in a decade
BIS reporting banks’ international claims on non-banks contracted in the
second quarter of 2008 for the first time since 1998. 4 While a decrease in
3
The BIS consolidated banking statistics (ultimate risk basis) track individual banking systems’
foreign claims (excluding inter-office claims). The ultimate risk reporting concept, combined
with the sectoral breakdown, provides a rough estimate of bilateral interbank exposures of
national banking systems. For example, on an ultimate risk basis, interbank claims reported
by the United States vis-à-vis the United Kingdom provide an estimate of US banks’ foreign
claims on UK banks (as opposed to US banks’ claims on banks located in the United
Kingdom, as in the BIS consolidated statistics on an immediate borrower basis).
4
Reductions, totalling $286 billion, were reported mainly by banks located in the United
Kingdom (–$339 billion), the United States (–$78 billion), Japan and the Cayman Islands
(–$36 billion each). Meanwhile, banks in the euro area registered a $125 billion expansion of
their cross-border claims on non-banks, primarily driven by intra-euro area activity.
BIS Quarterly Review, December 2008
27
Interbank exposures of selected banking systems
By nationality, in billions of US dollars
US banks
Swiss banks
All (lhs)
1
United States (rhs)
600 Rhs:
450
300
United Kingdom
Germany
France
Switzerland
Japan
240
600
240
600
240
180
450
180
450
180
120
300
120
300
120
60
150
60
150
60
150
0
0
2005
2006
Japanese banks
2007
0
2008
0
2005
French banks
2006
2007
0
0
2005
2008
UK banks
2006
2007
2008
Other European banks²
1,400
400
1,400
400
4,000
1,000
1,050
300
1,050
300
3,000
750
700
200
700
200
2,000
500
350
100
350
100
1,000
250
0
0
2005
2006
2007
2008
0
0
2005
2006
2007
2008
0
0
2005
2006
2007
2008
1
Bars indicate total interbank exposures of reporting banks headquartered in selected countries (panel headings). Lines indicate
foreign claims vis-à-vis banks of the nationality indicated by the legend, where nationality is defined by the residence of the ultimate
obligor. Data are not adjusted for exchange rate changes. Spanish and Swiss banks began reporting in the second quarter of
2
2005.
Austrian, Belgian, Danish, Dutch, Finnish, German, Greek, Irish, Italian, Norwegian, Portuguese, Spanish and Swedish
banks.
Source: BIS consolidated banking statistics on an ultimate risk basis.
loans accounted for almost 80% of the $286 billion overall decline, decreases
in debt security claims also contributed (–$23 billion), reflecting both
writedowns and outright sales of securities. 5 Claims on non-banks in the
United States fell the most (–$191 billion), followed by the United Kingdom
(–$144 billion), the Cayman Islands (–$62 billion) and Japan (–$55 billion).
Much of this was US dollar-denominated ($229 billion), although euro- and yendenominated credit declined as well. 6
5
Reductions in outstanding claim stocks may reflect a combination of factors, including
writedowns, the extension or drawing-down of credit lines, the movement of affiliated
structured investment vehicles onto the balance sheet, and outright cutbacks in lending.
6
Data from Dealogic on signings of international syndicated loans also suggest a slowdown in
lending to non-banks in the major economies. New signings of loan facilities granted to nonbanks fell to $462 billion in the second quarter of 2008, and to $401 billion in the third quarter,
compared with a peak of $768 billion in the second quarter of 2007. The slowdown in new
signings was especially pronounced for residents of the United States, the United Kingdom
and the euro area. The non-bank financial sector as well as industries exhibiting a strong
sensitivity to the economic cycle were particularly affected. The ratio of uncompleted
(announced but unsigned) facilities to completed ones for non-bank borrowers worldwide rose
28
BIS Quarterly Review, December 2008
Graph 3
Global interbank exposures
Total interbank borrowing1
Interbank claims/capital2
US banks
French banks
UK banks
Swiss banks
German banks
Japanese banks
Belgian and French banks
Canadian banks
Dutch banks
1,200
600
800
400
400
200
0
2005
2006
2007
2008
0
2005
2006
2007
2008
Data are not adjusted for exchange rate changes, since currency breakdowns are not reported in the consolidated banking statistics.
1
Foreign claims of all reporting banking systems on the national banking systems identified in the legend, in billions of US dollars, on
an ultimate risk basis. 2 Foreign claims on unaffiliated banks reported by banks of the nationality identified in the legend, as a
percentage of their Tier 1 capital. The Tier 1 capital data relate to internationally active banks which report the BIS consolidated
banking statistics. Semiannual balance sheet data (France, Switzerland, United Kingdom) are converted to quarterly frequency by
exponential interpolation up to the most recent available quarter.
Source: BIS consolidated banking statistics on an ultimate risk basis.
Graph 4
The BIS consolidated banking statistics, which track the exposure of
national banking systems and have a finer counterparty sectoral breakdown,
shed some more light on these moves. Reporting banks’ foreign claims on US
non-banks fell by $259 billion in the second quarter of 2008, with the Swiss and
UK banking systems registering the largest decreases (–$72 billion and
–$66 billion, respectively). Across all reporting banks, foreign claims on the US
non-bank public sector remained stable in absolute terms in the second
quarter, at $666 billion, while foreign claims on the non-bank private sector fell
by $253 billion to $4.3 trillion. As a result, foreign claims on the US non-bank
private sector declined to 69% of total foreign claims on the United States,
down from a peak of 72% at end-2007.
Banks’ liabilities come under pressure
Decreases in
liabilities to official
monetary
authorities ...
BIS reporting banks’ liabilities vis-à-vis official monetary authorities continued
to decline in the second quarter (Graph 5, left-hand panel). Total liabilities to
these counterparties fell by a record $157 billion, with the UK, French and
Swiss banking systems registering the largest decreases. US dollardenominated liabilities dropped by $73 billion and euro-denominated by
$62 billion. The BIS statistics do not include information on which countries’
official monetary authorities accounted for these moves. 7 However, data on
to 7% in the second quarter (slightly more for facilities related to mergers and acquisitions and
to leveraged buyouts), after averaging 5% between 2004 and 2007.
7
Banks’ positions vis-à-vis official monetary authorities are reported as a memo item in the BIS
statistics, and thus are not broken down by the country of residence. Reported liabilities will
include deposits placed in reporting banks as part of central bank reserve management,
reverse repo positions vis-à-vis reporting banks, and any loans which have arisen in the
context of central banks’ liquidity enhancement operations. There are some differences in the
definition of official monetary authorities across reporting countries. For example, positions
BIS Quarterly Review, December 2008
29
Liabilities of BIS reporting banks
In billions of US dollars
To official monetary authorities1
Rhs:
1,600
1,200
Rhs:
All currencies
USD
EUR
JPY
800
400
To Asia-Pacific2
2
200
800
100
To Africa and Middle East2
CHF
GBP
Other
100
800
100
600
50
600
50
0
400
0
400
0
–100
200
–50
200
–50
–200
0
Total (lhs)
0
00
02
04
06
08
–100
00
02
04
06
08
0
–100
00
02
04
06
08
The lines represent outstanding stocks and the bars quarterly changes, expressed at constant end-Q2 2008 exchange rates.
1
Liabilities to central banks and other monetary authorities worldwide.
2
Liabilities to all counterparties (ie banks and non-banks).
Source: BIS locational banking statistics by residence.
Graph 5
reserve holdings reported by 63 monetary authorities to the IMF provide some
information on which central banks were involved. As in the first quarter of
2008, central banks in emerging economies, in particular Russia (–$42 billion),
and some Asian countries (–$96 billion) reported relatively large reductions in
deposits placed in commercial banks in the second quarter. 8
BIS reporting banks’ also registered large declines in liabilities to some
emerging market regions in the second quarter of 2008 (Graph 5, centre and
right-hand panels). 9 Liabilities to all sectors in Asia fell by $100 billion, mainly
vis-à-vis China (–$56 billion), Hong Kong SAR (–$22 billion), Singapore
(–$21 billion), Chinese Taipei (–$18 billion) and Korea (–$14 billion). Most of
this was in US dollars, driving down the share of US dollar liabilities to 68% of
total liabilities vis-à-vis the region, from 70% in the previous quarter. Banks’
liabilities to Africa and the Middle East fell by a record $36 billion, bringing
down the share of US dollar liabilities vis-à-vis that region to 63%, from 65% in
the first quarter.
vis-à-vis central governments and other international organisations are included in this sector
in the data reported by the United States.
8
The largest declines were observed for Hong Kong SAR (–$18 billion), Japan (–$17 billion),
Korea (–$16 billion), Malaysia (–$15 billion) and the Philippines (–$10 billion). These
reductions may also reflect a switch by central banks from unsecured to secured lending
(ie reverse repos), which is not included in the SDDS figures used here. Note, in addition, that
large reserve-accumulating countries such as China and some Middle East oil producers do
not report the SDDS data.
9
These may in part reflect the changes in liabilities vis-à-vis official monetary authorities
discussed above.
30
BIS Quarterly Review, December 2008
... and to emerging
markets
Derivatives markets
Exchange-traded derivatives
Turnover of futures
and options
decreases …
… particularly in
derivatives on
short-term interest
rates
Trading in
commodity
derivatives declines
The third quarter of 2008 saw a retreat in activity on the international
derivatives exchanges. Total turnover based on notional amounts decreased to
$542 trillion from $600 trillion in the second quarter. Most of the contraction
took place in derivatives on short-term interest rates. Turnover declined slightly
in derivatives on long-term interest rates. By contrast, it increased in
derivatives on stock indices and foreign exchange. Turnover in derivatives on
commodities, observable only in terms of the numbers of contracts, dropped for
the second consecutive quarter.
Turnover in derivatives on short-term interest rates decreased to
$407 trillion from $473 trillion in the previous quarter. The most significant fall
was observed in the US dollar segment, followed by the euro and sterling
segments (Graph 6). In particular, turnover in futures and options on both
three-month eurodollar rates and federal funds rates declined in the third
quarter, although monthly data show that turnover in both contracts rebounded
in September, amid the increased tensions in financial markets.
Activity in equity derivatives recovered to $76 trillion from $67 trillion. By
currency of denomination, the largest increase came from US dollardenominated contracts, followed by Korean won contracts. Conversely, activity
in Indian rupee and yen contracts declined slightly.
Turnover in derivatives on foreign exchange rates increased marginally, to
$7.9 trillion from $7.5 trillion. The increase was attributed mostly to eurodenominated contracts and offset a decline in trading in currencies such as the
US dollar and Swiss franc.
Trading in commodity derivatives declined in the third quarter. Global
turnover in commodity derivatives measured by number of contracts (notional
amounts are not available) decreased from 425 million to 410 million. Most of
the fall was attributed to agricultural derivatives, occurring largely on the US
Turnover in short-term interest rate contracts
Monthly data, in trillions of US dollars
US dollar
Euro
Sterling
1
Spread (lhs)
Futures (rhs)
Options (rhs)
160
100
80
60
120
16
80
50
40
30
60
8
0
0
0
0
0
Jan 08
Apr 08
Jul 08
Jan 08
Apr 08
Jul 08
0
Jan 08
Apr 08
Jul 08
1
Three-month interbank Libor rates (for the United States, eurodollar; for the euro area, Euribor) minus corresponding overnight index
swap (OIS) rates (for the euro area, EONIA swap), in basis points.
Sources: Bloomberg; FOW TRADEdata; Futures Industry Association; BIS calculations.
BIS Quarterly Review, December 2008
Graph 6
31
exchanges. Turnover in oil-related derivatives went down from 98 million to
92 million contracts amid the significant drop in oil prices, though turnover in
the broader category of energy derivatives remained at a high level of
140 million.
OTC derivatives
In November, the BIS released the latest statistics based on positions as at
end-June 2008 in the global over-the-counter (OTC) derivatives
markets. 10 The notional amounts outstanding of OTC derivatives continued to
expand in the first half of 2008. Notional amounts of all types of OTC contracts
stood at $683.7 trillion at the end of June, 15% higher than six months before.
While, by volume, credit default swap (CDS) contracts registered their first ever
decline, markets for interest rate and FX derivatives, as well equity and
commodity derivatives, recorded significant growth.
For the first period ever since publication of the statistics began in
December 2004, the notional amounts outstanding of CDS contracts saw a 1%
decline compared with the notional amounts outstanding at the end of 2007.
This compares with an average six-month growth rate for outstanding CDS
contracts over the last three years of 45%. The fall was due largely to
significantly higher numbers of multilateral terminations of CDS contracts, as a
result of the financial turbulence (see box). Despite the decline in outstanding
volumes, gross market values, which measure the cost of replacing all existing
contracts and are thus a better gauge of market risk than notional amounts, of
CDS contracts increased by 58% in the wake of increases in credit and
counterparty risk during the turmoil. Gross market values rose for both singleand multi-name contracts.
Growth in the notional amounts outstanding of interest rate derivatives
increased in the first half of 2008 after an average rate of growth in the second
half of 2007. Notional amounts outstanding of these instruments reached
$458.3 trillion at the end of June 2008, 17% higher than six months previously.
Gross market values of OTC interest rate derivatives grew by 29% to
$9.3 trillion, driven primarily by interest rate swaps, which constitute by far the
largest market segment. The first half of 2008 also saw robust activity in
foreign exchange derivatives, as notional amounts increased by 12% to
$63.0 trillion, while gross market values rose by 25% to $2.3 trillion.
Notional amounts outstanding of equity derivatives went up by 20% in the
first half of 2008, reversing a 1% decline in the second half of 2007. Notional
amounts of OTC equity contracts stood at $10.2 trillion at the end of
June 2008, more than half of which was accounted for by contracts written on
European stocks.
Robust activity was also observed in the market for OTC commodity
derivatives, with notional amounts outstanding increasing by 56% to reach
$13 trillion at the end of June. This was largely due to strong growth in nongold contracts, which rose to $12.6 trillion. Forwards and swaps in these
10
32
For a discussion of the methodology of the survey, see the November 2008 Statistical
Release, available at www.bis.org/publ/otc_hy0811.htm.
BIS Quarterly Review, December 2008
CDS volumes
decline in wake of
turmoil
Robust activity in
foreign exchange
derivatives …
… and strong
increase in
commodity
derivatives
Voluntary terminations of credit default swap contracts
Jacob Gyntelberg and Carlos Mallo
Turmoil in credit markets and money markets in the first half of 2008 led market participants to
engage in a significantly higher number of multilateral terminations of credit default swap (CDS)
contracts. As a result, notional amounts outstanding of CDS contracts saw a decline, for the first
period ever since publication of the statistics began in December 2004, of 1% compared with the
notional amounts outstanding at the end of 2007 (Graph A, left-hand panel).
The decline to a large extent reflects unusually large volumes of voluntary multilateral
terminations, or “tear-ups”, of outstanding CDS contracts, which totalled $17.4 trillion, mainly in the
multi-name segment (centre panel). Without these terminations, the outstanding notional amounts
would have increased by nearly 30%. Terminations were mainly in CDS indices (right-hand panel)
and were more pronounced after credit spreads widened. Although most outstanding CDS contracts
continued to be between reporting dealers, this segment remained unchanged in terms of
outstanding size. In contrast, the outstanding contracts between dealers and other financial
institutions declined by 7%. The decrease for insurance companies was 21%, while that for
securities firms, the largest segment, was 2%.
Credit default swaps
By instrument
2,700
Multilateral terminations
Gross market
1
values (lhs)
2
Single-name (rhs)
2
Multi-name (rhs)
1,800
900
60
Single-name:
2, 3
BIS
2, 4
TriOptima
40
Multi-name:
2, 3
BIS
2, 4
TriOptima
CDS spreads and terminations
5, 6
45
150
15
0
H1 05
H1 06
H1 07
H1 08
0
H2 06
H1 07
United States (lhs)
5, 7
Europe (lhs)
2
Single-name (rhs)
2
Multi-name (rhs)
6.0
4.5
30
20
0
200
H2 07
H1 08
100
3.0
50
1.5
0
0.0
2005
2006
2007
2008
1
In billions of US dollars. 2 In trillions of US dollars. 3 Notional amounts outstanding at end of period reported to BIS. 4 Notional
amounts outstanding terminated by TriOptima during period. 5 Five-year on-the-run CDS mid-spread on index contracts of
investment grade quality, in basis points. 6 DJ CDX IG. 7 iTraxx Europe.
Sources: JPMorgan Chase; TriOptima; BIS.
Graph A
Since 2003, the private firm TriOptima has been offering multilateral termination services to
OTC derivatives dealers, initially for interest rate swaps and subsequently for CDS. A termination
cycle consists of two steps. Dealers first provide contract-by-contract information on their
derivatives positions, and the firm then checks whether each individual contract is reported by both
counterparties with identical terms. In a second step, TriOptima computes a set of bilateral
contracts between participants that provides the same net exposures but lowers gross exposures.
More recently, Markit, a specialised CDS data manager, and Creditex, a CDS broker, initiated
so-called “compression runs” for single-name CDS contracts. The first compression run ended on
27 August 2008. By end-November, 26 compression runs, 14 in Europe and 12 in the United States,
had resulted in a total gross reduction in notional amounts outstanding of single-name CDS
contracts in excess of $1.1 trillion.
contracts expanded by 49% to $7.6 trillion, and option volume by 81% to
$5 trillion. Growth in gold contracts slowed to 9% (after rising to 40% in the
second half of 2007). Gross market values of commodity contracts in total
increased by 16% to $2.2 trillion.
BIS Quarterly Review, December 2008
33
The international debt securities market
Borrowing in the international debt securities market retreated sharply in the
third quarter of 2008 amid the continued turmoil in financial markets. Net
issuance of bonds and notes decreased to $247 billion, down substantially from
$1,086 billion in the second quarter. The decline was well beyond normal
seasonal patterns, and resulted in the lowest level of net issuance since the
third quarter of 2005. 11 Money market borrowing also stagnated, with net
issuance falling into negative territory in the third quarter.
By currency of denomination, the largest decrease in bond and note
issuance came from the euro-denominated segment, closely followed by the
dollar-denominated segment (Graph 7, left-hand panel). Net issuance of eurodenominated bonds and notes plummeted from $466 billion in the second
quarter to $28 billion in the third quarter. Net issuance of dollar-denominated
bonds and notes also fell sharply, from $396 billion to $40 billion. By contrast,
net issuance of sterling-denominated bonds and notes remained at a high level
of $153 billion, up from $144 billion. Strong sterling issuance was attributable
chiefly to active issuance of mortgage-backed bonds. Yen issuance decreased
from $16 billion to $8 billion, although the decline would have been even more
pronounced without robust issuance of yen-denominated bonds in Japan by
non-Japanese issuers (samurai bonds) of $7 billion on a net basis.
The breakdown by nationality of issuer indicates that the largest
contraction in net issuance came from US borrowers, down from $308 billion in
the second quarter to $46 billion in the third quarter. A large fall was also seen
in the issuance by Belgian, French and UK borrowers.
By sector, financial institutions recorded the largest decline, where net
issuance of bonds and notes decreased from $888 billion to $246 billion in the
third quarter. Corporate issuance also dropped sharply, albeit to a somewhat
lesser extent: net issuance decreased from $133 billion to $47 billion.
Issuance of international mortgage-backed bonds (for which only gross
figures are available) remained relatively active in the third quarter. Gross
issuance of mortgage-backed bonds declined from the record level of
$188 billion in the second quarter, but still stood at $139 billion. Notable
decreases were posted by Belgian, Irish and Spanish borrowers, as well as by
the US government-sponsored agencies, Fannie Mae and Freddie Mac in
particular. By contrast, there was an increase from UK borrowers, up further
from $90 billion to $98 billion, due possibly to the Bank of England’s Special
Liquidity Scheme that enables UK banks to swap illiquid assets such as
mortgage-backed securities for UK Treasury bills.
In the emerging economies, net issuance of bonds and notes declined
from $45 billion in the second quarter to $11 billion in the third quarter (Graph 7,
right-hand panel). The decrease was most marked in emerging Europe (where
net issuance by Russian borrowers fell from $13 billion to $3 billion), followed
11
34
For seasonal patterns in international bond and note issuance, see J Amato and J Sobrun,
“Seasonality in international bond and note issuance”, BIS Quarterly Review, September 2005.
BIS Quarterly Review, December 2008
Borrowing retreats
sharply …
… particularly in
euro-denominated
bonds and notes
Issuance of
mortgage-backed
bonds remains
relatively active
International debt securities issuance
Net issuance, in billions of US dollars
Bonds and notes
Emerging markets1
Money market instruments
US dollar
Euro
Pound sterling
Other currencies
2
US dollar
Euro
Pound sterling
Other currencies
150
120
900
100
60
600
50
0
300
0
1,200
0
2004
1
2005
2006
2007
–50
2008
Bond and note issuance, by nationality.
2004
2
2005
2006
2008
90
60
30
–60
–120
0
–30
2004 2005 2006 2007 2008
Quarterly change in spread of JPMorgan EMBI Global Composite index, in basis points.
Sources: Dealogic; Euroclear; Thomson Financial; Xtrakter Ltd; BIS.
Money market
instruments
stagnate
2007
Change in spread (lhs)
Africa & Middle East
Asia-Pacific
Europe
Latin America & Caribbean
Graph 7
by Latin America and Africa and the Middle East. By currency of denomination,
the largest decrease occurred in the dollar-denominated segment, followed by
the euro-denominated segment.
Borrowing through international money markets also stagnated. Net
issuance of money market instruments entered negative territory, decreasing
from $69 billion to –$30 billion in the third quarter, the lowest level since the
third quarter of 2003 (Graph 7, centre panel). The largest decline was observed
in the sterling-denominated segment, followed by the euro-denominated
segment.
BIS Quarterly Review, December 2008
35
Download