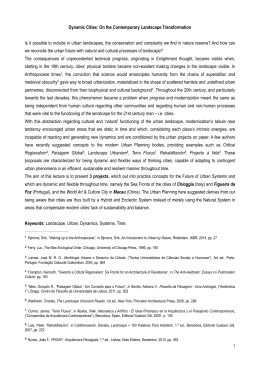
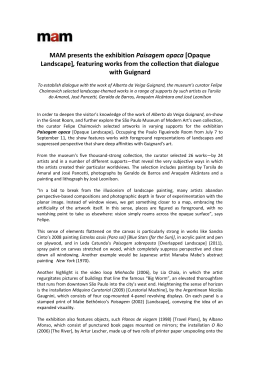
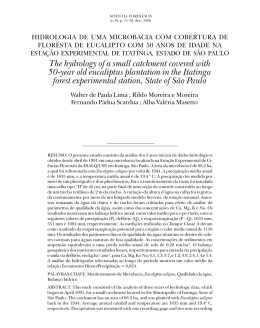
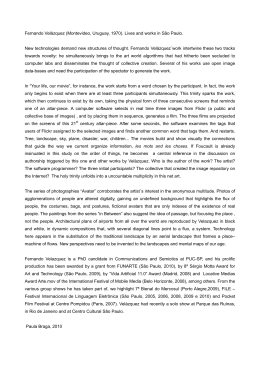
PII: S0043-1354(01)00062-8
Wat. Res. Vol. 35, No. 14, pp. 3462–3472, 2001
# 2001 Elsevier Science Ltd. All rights reserved
Printed in Great Britain
0043-1354/01/$ - see front matter
BUFFER ZONE VERSUS WHOLE CATCHMENT
APPROACHES TO STUDYING LAND USE IMPACT ON
RIVER WATER QUALITY
LUCIE SLIVA* and D. DUDLEY WILLIAMS
Division of Life Sciences, University of Toronto at Scarborough, 1265 Military Trail, Scarborough,
Ontario MIC 1A4, Canada
(First received 1 July 2000; accepted in revised form 1 January 2001)
Abstract}Secondary databases, GIS and multivariate analysis tools were used to determine whether there
was a correlation between water quality and landscape characteristics within three local southern Ontario
watersheds. Whole catchment and 100 m buffer zone influences on water quality over three seasons were
compared. Chemical fluxes were also calculated and used to compare the loading of pollutants to
downstream environments. Urban land use had the greatest influence on water quality. The influence of
agricultural land use was variable and did not agree with the results of other studies. The only natural
landscape variables that appeared to have an influence on water quality were slope and silt–clay surficial
geology deposit. There was a clear trend of increased chemical fluxes with increasing urban land use
intensity within a watershed. Forested land use appeared important in mitigating water quality
degradation. The catchment landscape characteristics appeared to have slightly greater influence on water
quality than the 100 m buffer. The results of this study may have been influenced by the scale and accuracy
of databases used. The secondary data were useful in determining major trends in water quality and
possible non-point origins of surface water pollution, and in identifying areas that are in need of further
investigation. # 2001 Elsevier Science Ltd. All rights reserved
Key words}water quality, land use, non-point pollution, secondary data analysis
INTRODUCTION
Surface waters can be contaminated by human
activities in two ways: (1) by point sources, such as
sewage treatment discharge and storm-water runoff;
and (2) by non-point sources such as runoff from
urban and agricultural areas. Non-point sources are
especially difficult to detect since they generally
encompass large areas in drainage basins and involve
complex biotic and abiotic interactions (Solbe, 1986).
Natural catchment characteristics such as topography and surficial geology can influence surface water
quality also. For example, the biochemical processes
in the terrestrial environment dominate the hydrochemical response of small catchments, because
stream water is largely made up of drainage from
soils (Moldan and Cerny, 1994). Despite their
importance, the influences of natural landscape
variables are not usually included in watershed
management studies because they considerably complicate the analysis.
Watershed management and catchment scale
studies have become increasingly more important in
*Author to whom all correspondence should be addressed.
Fax: +1-416-287-7423; e-mail: [email protected]
determining the impact of human development on
water quality both within the watershed as well as
that of the receiving waters. Although these studies
have become more common in the past 20 years, they
still leave many questions unanswered. For example,
there is still an ongoing dispute regarding whether
the land use of the entire catchment or that of the
riparian zone is more important in influencing the
water quality, all other factors remaining constant
(Osborne and Wiley, 1988; Delong and Brusven,
1991; Johnson et al., 1997). These uncertainties
remain partly because each catchment has a unique
combination of characteristics that influence water
quality, and partly because thorough investigations
at the watershed scale are extremely time and
resource consuming.
Effective analytical tools, such as geographical
information systems (GIS) and multivariate statistics,
are able to deal with spatial data and complex
interactions, and are coming into common usage in
watershed management (Richards and Host, 1994;
Xiang, 1995; Allan and Johnson, 1997; Johnson
and Gage, 1997; Cao et al., 1999). However, their
effectiveness depends on the quality and quantity of
data collected in the field, which tend to be sparse,
especially when dealing with entire watersheds. One
3462
Land use impact on river water quality
method of analyzing the interaction between a
watershed and its water quality is to look at existing
databases, generated by local and regional governments for monitoring purposes. These databases may
be useful in gaining an initial understanding of the
processes and interactions that might be occurring
within a watershed and may give direction to more
detailed research and management objectives.
This study investigates the benefits and limitations
of using such secondary data in determining the
magnitude of human impacts on freshwater environments. The two databases (water quality and
discharge) used were provided by the Ontario Ministry of Environment and the Water Survey Division
of Environment Canada. Besides having a basic
monitoring objective, the bulk of these databases was
generated without an extensive study purpose in
mind and thus they may be limited in their spatial
and temporal resolution. Usually, the sampling
schedule is rigidly set, regardless of the irregular
nature of environmental phenomena. Despite these
shortcomings, the use of readily available databases
is very attractive because a considerable investment
3463
in time and resources has to be devoted to sampling,
especially in large watershed-scale projects, in order
to obtain results that reasonably reflect reality.
The objectives of this study were therefore threefold: (1) to investigate the benefits and limitations of
using governmental water quality monitoring databases; (2) to determine the effects of human (land use)
and natural (topographic and geologic) landscape
influences on water quality in three local rivers; and
(3) to compare the influences of a 100 m buffer zone
and whole catchment landscape characteristics on
water quality.
SITE DESCRIPTION
The three watersheds in the study area are located
adjacent to each other on the east side of the Greater
Toronto Area (GTA), Ontario, Canada (Fig. 1). All
of the constituent rivers flow into Lake Ontario. The
Highland Creek watershed is the smallest and the
most urbanized (10,168 ha); the Rouge River watershed is moderately urbanized covering the largest
Fig. 1. Location of study area showing the location of the Ontario Ministry of Environment water quality
sampling stations and Environment Canada discharge stations in Highland Creek, Rouge River and
Duffins Creek.
3464
Lucie Sliva and D. Dudley Williams
area (33,288 ha); and the Duffins Creek watershed is
the least urbanized, and 28,653 ha in size. The
surficial geology of the area is a direct result of
Pleistocene glaciations, which left behind a mixture
of glaciolacustrine beach deposits, glaciolacustrine
deposits, Halton and Northern tills, and the deposits
of the Oak Ridges Moraine (Eyles and Clinton,
1998).
geology layer was subdivided into four categories:
(1) sand–gravel–silt deposits (alluvial stream deposits, Oak
Ridges ice contact deposit); (2) sand deposits (Lake Iroquois
shallow water deposits and Peel Ponds shallow water
deposits); (3) silt–clay deposits (Lake Iroquois deep water
deposits, Peel Ponds deep water deposits and Middle
Wisconsinan and older tills); and (4) silty-sand till deposits
(Late Wisconsinan Halton Till; Eyles and Boyce, 1991).
GIS analysis
METHODS
Data sets
Water quality data were obtained from the Ontario
Ministry of the Environment, which takes monthly samples
of surface water and analyzes them using standard methods
(OME, 1994). Twelve water quality stations (Fig. 1) were
chosen because they had complete water quality sampling
records for the entire study period: 1990–1993, the longest
possible intact water quality record span.
Dissolved oxygen (DO), temperature, alkalinity, faecal
coliform count, ammonium (NH4), nitrate (NO3), phosphate (PO4), total solids (TS), copper (Cu), and chloride
(Cl) were chosen to represent the state of surface water
quality. These variables were averaged over three time
periods: spring (January–April), summer (May–August)
and fall (September–December). The three time periods
were chosen based on the characteristic river discharge
patterns as well as on the region’s growing season. The
average discharge regime for the three rivers was highest in
the spring and lowest in the summer. Spring discharge was
significantly greater than summer and fall discharge (T-test,
p50:001). Although the average summer and fall discharges
were not significantly different, the two seasons were treated
separately because the reduction in interception capacity of
the region’s vegetation during fall and winter may have an
influence over chemical loading to the watersheds. The
winter period was divided between spring and fall because
field sampling by the OME during that time was not as
regular as the rest of the year. The mean seasonal water
quality was averaged over a four-year period (1990–1993) to
reduce the effects of possible field sampling and laboratory
analysis errors and any missing values.
For each of the major watersheds (sub-watersheds 1, 3
and 12), fluxes were calculated using concentrations of the
chemicals and discharge to determine the amount of
pollution that was transported downstream. The Water
Survey Division of Environment Canada provided the
discharge data. These data matched locations for three
OME water quality stations within the study area (Fig. 1). A
two-year period (1990–1991) was chosen for the analysis of
chemical loading, because continuous discharge measurements for all three streams were available only for this time
period. The discharge data were used to calculate average
monthly and yearly specific fluxes for six water quality
parameters (NH4, NO3, PO4, TS, Cu and Cl) by multiplying
the discharge by chemical concentrations and dividing them
by the catchment area.
Digitized land use maps were obtained from the
Metropolitan Toronto and Region Conservation Authority
(MTRCA) at a scale of 1 : 50,000, and from Meriano (1992)
at a scale of 1 : 100,000. A surficial geology map (representing soils) was obtained from Westgate (1971), and a digital
elevation model (DEM), developed for the GTA, was
provided by the Ontario Ministry of Natural Resources and
Canadian Hydrographic Service (1999).
The land use for each watershed was subdivided into four
categories: (1) field, including pasture lands, and golf
courses; (2) forested land; (3) agricultural land, including
row and non-row crop agriculture; and (4) urbanized land,
including industrial and residential areas. The surficial
ArcView (ESRI, 1996), a vector-based GIS software
package, was used to determine the composition of the land
use and surficial geology characteristics within the three
watersheds. Surface elevation and the standard deviation of
slope were derived from the DEM. The standard deviation
of slope was used, as opposed to average slope, because of
the relatively flat terrain present in Southern Ontario, with
only a few areas of large elevation changes generally located
around the southern portion of the river catchments. For
each water sampling station, watershed and sub-watershed
boundaries were delineated with ArcView’s spatial analyst
(ESRI, 1996) using the DEM data. The land use and
surficial geology percent compositions, along with the
watershed area and standard deviation of slope, were
determined for each of the sub-watersheds using the tools
provided by the GIS software. All databases were transformed into a common digital format, projected onto a
common coordinate system (UTM) and analyzed in ArcView as vectors. For each of the sub-watersheds, ArcView’s
buffer facility was used to extract landscape data for the
area 100 m, the smallest unit determined by the lowest
resolution of the digitized landscape data, on each side of
the river. This procedure allowed a comparison of the
influence of landscape data on water chemistry within the
100 m buffer area with that of the landscape data derived for
the whole catchment.
Statistical analysis
Identical statistical analyses were performed on data both
from the buffer zone and the entire catchment to determine
relationships between the landscape variables and water
quality. The Kolmogorov–Smirnov goodness of fit test was
used to test for normality of distribution of the individual
water quality and landscape variables. The Kruskal–Wallis
test was used to determine whether there was a significant
difference between seasonal concentrations within the 12
sub-watersheds. The predictors (landscape data) and the
response variables (water quality) were transformed with
either a power or logarithmic function, to make the data
normally distributed and to reduce the influence of outliers.
Water quality–landscape interactions were explored using
multiple regression and redundancy analysis (RDA). Multiple regression (MathSoft, 1998) was used to determine
whether landscape factors have positive or negative
influence on separate water quality variables and how
strong this interaction is using six predictor variables
(agricultural, forested, urban and field land-use variables;
and standard deviation of slope and silt–clay deposit natural
landscape variables). RDA was performed using CANOCO
(ter Braak, 1991). The two important outputs obtained with
this method were: (1) interset correlations of the landscape
factors with the RDA axes, which show the landscape
factors that have the largest influence on the ordination; and
(2) the portion of each predicted variable that is explained
by the RDA axes (Jongmann et al., 1995).
For the analysis of chemical fluxes from the three
watersheds, monthly averages were calculated using the
OME monthly water chemistry results and monthly average
discharges recorded by Environment Canada. Standardized
coefficients of variation (CV=[SD/x]100%; where SD is
the standard deviation and x is the sample mean) for each of
Land use impact on river water quality
the water quality variables were calculated using the monthly flux data from years 1990 to 1991, to compare the
variability of loadings between the three watersheds. A oneway balanced ANOVA was performed on the log-transformed monthly flux values to determine if the differences among
flux values from the three watersheds were significant.
ANOVA was applied also to monthly average discharge
values for the 2 years to determine if there was a significant
discharge difference between the three watersheds.
3465
RESULTS
Spatial and temporal patterns
For the 12 sub-catchments, the composition ranges
were generally larger for catchment land use and
geology variables than for the 100 m buffer (Fig. 2).
On average, the standard deviation of slope within
Fig. 2. Whole catchment and 100 m buffer zone landscape characteristics of the 12 sub-watersheds within
the Highland Creek, Rouge River and Duffins Creek catchments.
0.119
286
387.9
1854
0.0110
11.4
0.051
836
4.24
23
0.002
174
10.9
6
0.0008
6.3
0.001
313
0.25
3
0.020 [73]
231.4 [6]
81.6 [74]
304 [95]
0.0027 [40]
9.89 [6]
0.008 [109]
482 [21]
1.32 [55]
7.00 [24]
0.002
147
20.7
40
0.0005
2.7
0.001
308
0.03
9
0.002
178
28.6
8
0.0005
8.3
0.001
363
0.89
0
0.141 [78]
213 [22]
146.1 [98]
348 [98]
0.0032 [72]
11.40 [4]
0.014 [62]
607.3 [45]
1.64 [39]
4.46 [31]
NH4 (mg/L)
Alkalinity (mg/L)
Cl (mg/L)
Coliform (count)
Cu (mg/L)
DO (mg/L)
PO4 (mg/L)
TS (mg/L)
NO3 (mg/L)
Temp (8C)
Max
Min
Average [CV(%)]
0.927
254
671.0
2188
0.0122
13.7
0.059
1616
4.98
16
0.031 [46]
201.3 [13]
72.7 [51]
1787 [156]
0.0022 [53.73]
8.19 [8]
0.011 [111]
453.6 [20]
1.05 [79]
14.09 [8]
0.132
259
203.8
20100
0.0088
8.2
0.068
784
5.00
22
Max
Min
Min
Average [CV(%)]
Max
Average [CV(%)]
Fall–Winter
Summer
Winter–Spring
Table 1. Seasonal averages, coefficients of variation [CV(%)], minima and maxima for water quality parameters. The probabilities associated with the Kruskal-Wallis rank sum test are also given
50.0001
0.003
0.352
0.002
0.258
50.0001
0.047
0.136
0.005
50.0001
Lucie Sliva and D. Dudley Williams
p-value
3466
the buffer zone was larger and more variable than
over the whole catchment.
The water quality parameters varied greatly in
space and time (Table 1). NH4 and NO3 concentrations showed considerable variability among the
watersheds and a highly significant seasonal variability, with the highest concentrations being in the
spring (p50:001 and p ¼ 0:005, respectively). The
largest concentrations of nutrients (NH4, NO3, and
PO4) were in watersheds 8 and 10 (sub-watersheds of
Duffins Creek), which were most likely caused by
point-source pollution generated by the Stouffville
Sewage Treatment Plant, just above sampling station
8, since neither of these watersheds showed degraded
land use characteristics usually associated with such
large nutrient concentrations. PO4 was highly variable among the watersheds and varied significantly
among seasons (p ¼ 0:047). Cl and Cu did not differ
significantly over the seasons; however, concentrations varied considerably among the watersheds, with
the largest being in watershed 1, the most urbanized
watershed. Alkalinity varied significantly among
seasons (p ¼ 0:003) being largest in the fall–winter,
but it differed only slightly between watersheds.
Faecal coliform count varied significantly spatially
and seasonally (p ¼ 0:002), showing the highest
numbers in the summer and in watershed 1. DO
varied significantly only with season (p50:001),
being highest in spring and lowest in summer. TS
did not vary significantly either among the watersheds or seasonally. Temperature varied significantly
only among seasons (p50:001).
Landscape–water quality linkages
Urban land use appeared to have the greatest effect
on water quality (Table 2). Faecal coliform count,
Cu, TS, Cl and NH4 concentrations were all
positively correlated with this predictor.
Forested land cover was also included in a large
number of the regression models, being most often
negatively correlated with indicators of degraded
water quality (e.g., high concentrations of Cu, TS,
and Cl). However, larger forested land cover also
seemed to account for higher NH4 in the fall and
alkalinity in the summer. Similarly, degraded water
quality was negatively correlated with field land use.
Surprisingly, agriculture was not a dominant
predictor for degraded water quality, as suggested
by other studies (Lenat and Crawford, 1994; Johnson
et al., 1997). In a few cases the influence of this
landscape factor appeared to act in a manner
opposite to that initially predicted. For example, TS
was negatively correlated with agriculture in both
summer and fall. NH4 and faecal coliform count were
negatively correlated with this predictor in summer.
The one surficial geology variable that appeared to
have the most influence over the water quality
variables in this study was silt–clay. NH4 was
positively correlated with this predictor in the spring
Land use impact on river water quality
3467
Table 2. Results of multiple regression of the effect of landscape, within the entire catchment and 100 m buffer, on water quality in 12
subwatersheds of Highland Creek, Rouge River and Duffins Creek over three seasons. (+) represents a positive correlation and () represents a negative correlation, and no symbol represents no correlation
Spring
Catchment
Ammonium
Cl
Cu
Fecal coliform
Total solids
100 m buffer
Alkalinity
Cl
Cu
Fecal coliform
Total solids
Summer
Catchment
Alkalinity
Ammonium
Cl
Cu
Fecal coliform
Total solids
100 m buffer
Alkalinity
Ammonium
Cl
Fecal coliform
Total solids
Fall
Catchment
Alkalinity
Ammonium
Cl
Cu
Fecal coliform
Total solids
100 m buffer
Alkalinity
Ammonium
Cl
Cu
Fecal coliform
Total solids
Forest
Urban
Agriculture
Field
Silt–clay
Slope
R2
+
0.48
0.68
0.54
0.56
0.78
+
+
+
0.65
0.53
0.74
0.53
0.71
Slope
R2
+
+
+
Forest
Urban
+
Agriculture
Field
Silt–clay
+
0.66
0.55
0.54
0.40
0.55
0.54
+
+
+
+
+
+
+
Forest
Urban
0.69
0.55
0.44
0.65
0.48
+
Agriculture
Field
Silt–clay
Slope
+
0.47
0.57
0.68
0.58
0.62
0.78
+
+
+
+
+
+
+
+
and summer. Alkalinity was both positively (in the
fall) and negatively (in the spring) correlated with
silt–clay. Total solids were positively correlated with
slope. Copper also was positively correlated with
slope during the large spring discharge.
Buffer vs. catchment landscape influences and
seasonal variations
While water chemistry was better correlated, in
most cases, with the entire catchment, there were
some exceptions (Table 2). During the spring, only
alkalinity was correlated with the buffer zone landscape (R2 ¼ 0:65) and Cu variability was better
accounted for by the buffer zone (R2 ¼ 0:74) than
by the catchment landscape (R2 ¼ 0:54).
During summer, the faecal coliform count was
better correlated with the buffer zone landscape
R2
0.51
0.50
0.52
0.53
0.54
0.58
(R2 ¼ 0:65) than with the catchment (R2 ¼ 0:54).
During this season, water quality was more similarly
correlated with both buffer and landscape data than
during the other seasons. Summer water quality was
not correlated with slope. The water quality variable
that had the highest multiple regression coefficients in
the summer was alkalinity (R2 ¼ 0:69) and it was
better correlated with buffer zone landscape.
During the fall, ammonium and faecal coliforms
were better correlated with whole catchment landscape predictors (R2 ¼ 0:57 and 0.62, respectively)
than at other times. Cl (R2 ¼ 0:68) and TS
(R2 ¼ 0:78) were best, and equally well, correlated
with spring and fall catchment.
Nutrient chemistry, other than NH4, was not
correlated with any of the catchment or buffer
landscape factors. Similarly, DO and temperature
variability could not be explained by any models
3468
Lucie Sliva and D. Dudley Williams
Fig. 3. Redundancy analysis results: (a) using winter–spring water quality and catchment landscape
variables; (b) using winter–spring water quality and 100 m buffer landscape variables; (c) using summer
water quality and catchment landscape variables; (d) using summer water quality and 100 m buffer
landscape variables; (e) using fall–winter water quality and catchment landscape variables; (f ) using fall–
winter water quality and 100 m buffer landscape variables (1–12 represent the sub-watersheds).
Land use impact on river water quality
using the catchment or buffer zone landscape factors
as predictors.
Alkalinity appeared to be affected by different
landscape factors in each season. A similar seasonal
inconsistency was seen with other water quality variables. The highest proportion of variability observed
in the water chemistry, that was accounted for by a
fitted multiple regression model, was for TS in the
spring and in the fall when catchment landscape
factors were used. In the spring, the concentration of
TS was positively correlated with slope and negatively correlated with forested land use (R2 ¼ 0:78),
while in the fall it was negatively correlated with both
agriculture and forested land uses (R2 ¼ 0:78).
Some of the landscape variables were consistently included in the multiple regression models
for the same water quality variables throughout the
year. For example, Cl was always negatively
correlated with forested land use on the catchment
landscape scale. Cu was similarly negatively
correlated with field. Faecal coliform count was
always positively correlated with urban land use.
Multiple regression models for TS always included
urban land use on the buffer scale and forest on the
catchment scale. Urban land use seemed to influence
water quality more with-in the buffer zone than
within the whole catchment. On the other hand,
forested and field land uses appeared to be better
predictors of water quality on the catchment scale.
3469
that reflect eutrophication, which was related to
slope, but this relationship was not as strong.
Agriculture was better correlated with the second
axis in the summer, but the direction of the
interaction with the water quality variables (mainly
nutrients) was the opposite of what was predicted.
The RDA results also showed that while there was
some difference in correlation of water quality and
landscape variables between the three seasons, there
was very little difference in interactions using the
whole catchment and buffer landscape variables.
Chemical fluxes
The average annual loading of PO4, NH4, Cu, Cl,
TS and NO3 was greatest in Highland Creek, and
least in Duffins Creek (Fig. 4). On the contrary, the
average annual discharge for the sampled years was
lowest for Highland Creek (1.38 0.15 m3/s), intermediate for Rouge River (1.91 0.31 m3/s) and
highest for Duffins Creek (2.67 0.43 m3/s). The
differences among the three watersheds with respect
to their average monthly discharges were significant
(F2;69 ¼ 4:18, p ¼ 0:019) when measured by a oneway ANOVA (Table 4). The loading differences
among the three watersheds were significant for all
the chemistry variables except for NH4 and PO4. The
apparent trend of in increasing chemical fluxes from
watersheds with lower discharge implies that the
loading of pollutants is the greatest in these rivers.
RDA results
Figure 3 shows ordination diagrams derived from
running an RDA using the seasonal water chemistry
variables and landscape variables from the buffer and
catchment. Most water quality variation was explained by the first two axes, with the first axis
explaining, in most cases, more than twice as much as
the second (Table 3). Although the results indicated
similar interactions to those found using multiple
regression, the dominance of urban land use as the
explanatory variable was greater using this technique. The first axis consistently displayed a gradient of
pollution (e.g., TS, faecal coliform and Cu increased
with the axis), which was positively correlated with
urbanization and negatively correlated with forested
land cover. The second axis represented variables
DISCUSSION
The results of this study suggest that, using both
catchment and buffer landscape variables, urban land
use is the most important predictor of water quality
variability (see also Osborne and Wiley, 1988). This
relationship may have been highly influenced by
point source as well as non-point source pollution
that is commonly associated with urbanized areas
(e.g., storm water runoff ).
After urban land use, the three landscape factors
that appeared important in determining water quality
were forested land use, the standard deviation of
slope, and the silt–clay deposit. Degraded water
quality, as expected, was generally negatively correlated with forested land use, except in a few cases
Table 3. RDA results showing the proportion of total variance in water quality variables explained by the first and second RDA ordination
axes, the landscape variables that were most correlated with the axes, and the total variation explained by all the canonical axes
First axis
Catchment (spring)
Buffer (spring)
Catchment (summer
Buffer (summer)
Catchment (fall)
Buffer (fall)
Second axis
Dominant
variable(s)
% variation
explained
Dominant
variable
% variation
explained
Total variation
explained by
all axes (%)
Urban, forest, field
Urban, forest
Urban, forest
Urban, forest
Urban, forest
Urban, forest
39
39
29
29
35
35
Slope
Slope
Agriculture
Agriculture
Slope
Slope
14
14
19
20
23
28
67
67
68
71
70
69
3470
Lucie Sliva and D. Dudley Williams
Fig. 4. Estimated average annual loadings of phosphate, ammonium, nitrate, total solids, chloride and
copper from Highland Creek, Rouge River and Duffins Creek (X 1SE).
Table 4. Average monthly values and coefficients of variaton [CV(%)] of chemical fluxes for the period 1990–1991 in Highland Creek, Rouge
River and Duffins Creek. The results of one-way ANOVA are also given
Average flux (kg/ha/month)
Ammonium
Chloride
Copper
Nitrate
Phosphate
Total solids
ANOVA Results
Highland Creek [CV(%)]
Rouge River [CV(%)]
Duffins Creek [CV(%)]
DF
F
p-value
0.0156 [291]
63.45 [194]
0.0015 [157]
0.34 [248]
0.0026 [444]
181.41 [148]
0.013 [310]
22.57 [311]
0.0007 [233]
0.18 [268]
0.0016 [427]
80.22 [175]
0.007 [452]
6.01 [215]
0.0005 [207]
0.12 [228]
0.0009 [348]
55.00 [171]
2
2
2
2
2
2
1.38
30.9
10.37
4.26
2.65
14.84
0.2564
50.0001
0.0001
0.0178
0.0773
50.0001
where the influence of point source pollution most
likely masked the interaction. Increased deviation of
slope was generally associated with greater pollution,
related especially to TS and Cu. Slope is a fundamental parameter for predicting the rates of water
flow across surfaces (Richards et al., 1996). Greater
rates of flow across surfaces increase erosion rates
and thus the rates of particulate matter entering the
river channel. The chances of these flows picking up
pollutants, such as Cu, on impermeable surfaces
(e.g., roads) are thus increased. Lacustrine clay soils
are relatively impermeable to water compared with
sands and gravels (Richards and Host, 1994). In
addition, clay minerals and clay humics have a larger
potential for adsorption of nutrients such as phosphorus and ammonia and may increase the fluxes of
these chemicals (Johnson et al., 1997). The reason for
this is that greater overland flow, such as that
characterized by disturbed surfaces, may easily carry
particulates with adsorbed nutrients into rivers. This
is reflected well in this study by the positive correlation of ammonium with silt–clay composition in
the spring and in the summer indicating higher
nutrient content in watersheds with clay soils.
The landscape factors used in our analysis could
not explain most of the variability in nutrient
concentrations, nor the dissolved oxygen and temperature differences in these watersheds. This may
have been caused by point sources, such as the
Stouffville Sewage Treatment Plant (SSTP) upstream
of sampling station 8 and 10, both of which were
characterized by high nutrient concentrations. Dissolved oxygen and temperature showed no correlation with land possibly because the range of sampling
times spanned early morning to high noon. Since,
both surface water temperature and dissolved oxygen
Land use impact on river water quality
follow diurnal cycles, the spatial variability of these
parameters among watersheds may have been
masked by temporal variability.
Alkalinity tends to vary with season and usually
declines with increasing discharge (Moldan and
Cerny, 1994). This agreed with our results which
showed that alkalinity, in all the watersheds, was
lowest in the spring. Otherwise, multiple regression
analysis showed that alkalinity was correlated with
various landscape parameters, but none of these
appeared to be strong influences. The dynamics of
the acid-neutralizing capacity of surface waters are
most likely too complex to be determined by the few
predictors used in this study.
Most seasonal variations in river water chemistry
are driven by climatic and biotic factors and are
therefore largely governed by the processes that are
taking place in the terrestrial part of the watershed
such as natural or human induced vegetation cover
changes (Moldan and Cerny, 1994). Our results show
slight seasonal difference in the interaction between
the landscape factors and water quality. Water
quality was better explained by interactions with
the landscape in spring and fall rather than in
summer. This may have been the result of relatively
higher discharge within watersheds of this region
between fall and spring, as well as tighter nutrient
spiraling (Elwood et al., 1983), increased interception
capacity and reduced overland runoff associated with
the growing season (Dunne and Leopold, 1978). This
is further supported by the general lower concentrations of most nutrients and pollutants within the subwatersheds in the summer. The significantly higher
concentrations of nutrients in the late winter and
spring also coincide with the period of fertilization of
agricultural fields in the area. Nutrients are easily
transported to the channels via surface runoff and
subsurface flows during this period (Osborne and
Wiley, 1988).
Several researchers have addressed the issue of
whether land use near streams and rivers is a better
predictor of water quality than land use over the
entire catchment (Osborne and Wiley, 1988; Hunsaker and Levine, 1995; Johnson et al., 1997). Our
multiple regression analysis results show water
quality to be correlated with catchment scale landscape slightly better than with buffer landscape. The
redundancy analysis showed a similar pattern except
that the difference between the influence of buffer and
catchment landscape on water quality was further
reduced. Other studies have shown mixed results with
respect to this topic. For example, Hunsaker and
Levine (1995) found that when landscape was
classified at the level of the whole catchment, the
relationship between land use and water quality was
distinctly stronger than if only a 200 or 400 m buffer
strip was considered. Conversely, Johnson et al.
(1997) found that the whole catchment explained
slightly less of the water quality variability than their
100 m buffer. The influence of buffer landscape
3471
composition in our study and those mentioned above
may be underestimated due to the low resolution of
digitized data used. This demonstrates the difficulty
in determining the desirable width of a riparian zone
buffer that would be effective in mediating pollutant
loading since it is affected by the spatial variations in
physical, ecological and land use conditions within
the streamside areas of the watershed. For example,
Xiang (1995) used GIS and modeling techniques to
determine that, for one small Southern Carolina
watershed, the width of an effective buffer varied
from 8 to 175 m.
The type of vegetation within a buffer strip is also
important in determining its effectiveness. Osborne
and Kovacic (1993) found that, on an annual basis,
forested buffers were able to reduce concentrations of
nitrate more than grassed buffers. However, in the
same study, grass buffers were found to be more
effective in retaining total and dissolved phosphate.
Our results show that both field and forested buffer
strips play a role in reducing the amount of
pollutants, such as chloride, copper and total solids,
entering a river. However, the nutrient variability in
the rivers appeared to be influenced by predictors
other than the landscape, and the effect of forest or
field on water quality could not be determined, most
likely due to the influence of point source pollution.
The average annual chloride flux derived for Highland Creek (750 150 kg/ha/year) was similar to that
determined by a study that involved much greater
sampling frequencies. Using a sampling frequency of
every 15 minutes for two years, Howard and Haynes
(1993) determined that the annual chloride loading
for Highland Creek was 5036 tonnes for the 1989–
1990 salting season, or 614 kg/ha/year. They found
that only about 45% of the chloride applied to the
Highland Creek watershed, mainly in the form of
road salt, gets flushed out of the catchment in surface
waters. The rest remains in the groundwater.
An adequate sampling frequency is essential in
terms of monitoring dissolved and particulate fluxes
from watersheds (Howard and Haynes, 1993). Based
on this premise, the annual fluxes determined from
the monthly water quality measurement databases in
this study may not be representative of the actual
downriver loading from these watersheds. However,
the database is certainly useful in comparing fluxes
among the catchments even if it fails to accurately
quantify the chemical loads. Given this, the results
suggest that significant loading differences occur
among the three catchments, possibly of an order
of magnitude in the case of chloride, where the
annual loading in Highland Creek was calculated to
be up to 15 times greater than in Duffins Creek.
CONCLUSIONS
The importance of having accurate, complete and
representative ranges of datasets for landscape scale
3472
Lucie Sliva and D. Dudley Williams
studies cannot be sufficiently stressed. The minimal
budget and resource demands of secondary data
analysis may appear very attractive especially with
the large number of governmental databases available. In fact, this type investigation can be invaluable
on many occasions when one wants to explore
possible interactions that may be taking place in the
field. For example, the data used sufficed in generating a preliminary impression of the dynamics connected to surface water quality that might be taking
place within these watersheds. The preliminary results
show that there are clear differences between catchments with varying land uses that are worth further
investigation. However, as was the case in this study,
the use of existing databases that were not developed
with clear aims can, at best, be used for tentative
exploratory and hypothesis-generating purposes.
Further investigations will require a better designed
spatial and temporal sampling regime as well
as higher resolution digital maps with more land use
classes.
Acknowledgements}We thank Brian Whitehead at the
Ontario Ministry of Environment data and Sue Sanders at
Environment Canada for providing the surface water
quality and discharge data; as well as Kristin Geater and
Don Parkinson at the Metro Toronto and Region
Conservation Authority for providing digitized maps and
information on local watersheds. The Ministry of Natural
Resources and Canadian Hydrographic Services provided
the Digital Elevation Model of Southern Ontario, Mandy
Mariano provided digitized maps, Mike Doughty gave
technical assistance, and Oliver Gathmann provided statistical advice.
REFERENCES
Allan J. D. and Johnson L. (1997) Catchment-scale analysis
of aquatic ecosystems. Freshwat. Biol. 37, 107–111.
Cao Y., Williams D. D. and Williams N. E. (1999) Data
transformation and standardization in the multivariate
analysis of a river water quality. Ecol. Appl. 9(2),
669–677.
Delong D. D. and Brusven M. A. (1991) Classification and
spatial mapping of riparian habitat with application
towards management of streams impacted by nonpoint
source pollution. Environ. Management 15(4), 565–571.
Dunne T. and Leopold L. B. (1978) Water in Environmental
Planning, pp. 1–818. W.H. Freeman, San Francisco.
Elwood J. W., Newbold J. D., O’Neil R. V. and Van Winkle
W. (1983) Resource spiraling: an operational paradigm
for analyzing lotic ecosystems. In Dynamics of Lotic
Ecosystems, eds T. D. Fontaine and S. M. Bartell,
pp. 3–27. Ann Arbor Science, Ann Arbor, MI.
ESRI (1996) ArcView User’s Manual, pp. 1–349. Environmental Systems Research Institute, Redlands, California.
Eyles N. and Boyce J. I. (1991) Earth Science Survey of the
Rouge Valley Park. Ministry of Natural Resources,
Central Region, Aurora, Ontario.
Eyles N. and Clinton L. (1998) Toronto Rocks: The
Geological Legacy of the Toronto Region, pp. 1–40. Nick
Eyles and Laura Clinton Copyright, Toronto.
Howard K. W. F. and Haynes J. (1993) Urban geology 3.
Groundwater contamination due to Road de-icing
chemicals}salt balance implications. Geosci. Can. 20(1),
1–8.
Hunsaker C. T. and Levine D. A. (1995) Hierarchical
approaches to the study of water quality in rivers.
BioScience 45, 193–202.
Johnson L. B. and Gage S. H. (1997) Landscape approaches
to the analysis of aquatic ecosystems. Freshwat. Biol. 37,
113–132.
Johnson L. B., Richards C., Host G. E. and Arthur J. W.
(1997) Landscape influences on water chemistry on Midwestern stream ecosystems. Freshwat. Biol. 37, 193–208.
Jongmann R. H. G., ter Braak C. J. F. and van Tongeren O.
F. R. (1995) Data Analysis in Community and Landscape
Ecology, pp. 1–299. Cambridge University Press,
Cambridge.
Lenat D. R. and Crawford J. K. (1994) Effects of land use
on water quality and aquatic biota of three North
Carolina Piedmont streams. Hydrobiologia 294, 185–199.
MathSoft (1998) S-plus, Version 4.0 for Windows,
pp. 1–243. MathSoft Inc., Seattle, WA.
Moldan B. and Cerny K. (1994) Biogeochemistry of Small
Catchments: A Tool For Environmental Research,
pp. 1–419. Wiley, Chichester, England.
Ontario Ministry of Environment and Energy (1994) Water
Management}Policies, Guidelines and Provincial Water
Quality Objectives, pp. 1–85. Cette Publication Technology, Toronto.
Ontario Ministry of Natural Resources and Canadian
Hydrographic Service (1999) Digital elevation model of
the Greater Toronto Area, Southern Ontario and Lake
Ontario bathymetry. Geological Survey of Canada Open
File D3678.
Osborne L. L. and Kovacic D. A. (1993) Riparian vegetated
buffer strips in water-quality restoration and stream
management. Freshwat. Biol. 9, 243–258.
Osborne L. L. and Wiley M. J. (1988) Empirical relationships between land use/cover and stream water quality in
an agricultural watershed. Journal of Environmental
Management 26, 9–27.
Richards C. and Host G. E. (1994) Examining land use
influences on stream habitats and macroinvertebrates: a
GIS approach. Wat. Resources Bull. 30, 729–738.
Richards C., Johnson L. B. and Host G. E. (1996)
Landscape scale influences on stream habitats and biota.
Can. J. Fisheries Aquatic Sci. 53, 295–311.
Solbe J. F. de L. G. (Ed.) (1986) Effects of Land Use on
Fresh Waters: Agriculture, Forestry, Mineral Exploitation,
Urbanization, pp. 1–352. Ellis Horwood Ltd., London,
UK.
ter Braak C. J. (1991) CANOCO-A FORTRAN program
for canonical community ordination by (partial)
(detrended) (canonical) correspondence analysis, principal component analysis (version 2.2). Technical Report
LWA-88-02. Agricultural Mathematics Group, Wageningen, The Netherlands, pp. 1–233.
Westgate J. (1971) Quaternary Geology of Southern Ontario.
University of Toronto, Scarborough Campus. Unpublished.
Xiang W. N. (1995) GIS-based analysis: injection of
geographic information into landscape planning.
Landscape Urban Planning 34, 1–10.
Download