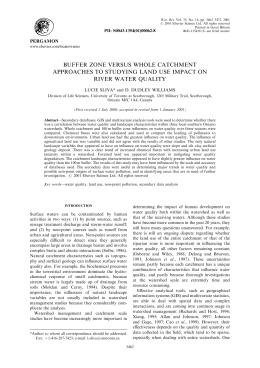
SCIENTIA FORESTALIS n. 50, p. 11-19, dez., 1996 HIDROLOGIA DE UMA MICROBACIA COM COBERTURA DE FLORESTA DE EUCALIPTO COM 50 ANOS DE IDADE NA ESTAÇÃO EXPERIMENTAL DE ITATINGA, ESTADO DE SÃO PAULO The hydrology of a small catchment covered with 50-year old eucaliptus plantation in the Itatinga forest experimental station, State of São Paulo Walter de Paula Lima ; Rildo Moreira e Moreira Fernando Pádua Scardua ; Alba Valéria Masetto RESUMO: O presente estudo consistiu da análise dos 3 anos iniciais de dados hidrológicos obtidos desde abril de 1991 em uma microbacia localizada na Estação Experimental de Ciências Florestais da ESALQ/USP, em Itatinga, São Paulo. A área da microbacia é de 68,2 ha, a qual foi reflorestada com Eucalyptus saligna por volta de 1944. A precipitação média anual é de 1635 mm, e a temperatura média anual é de 19,4 0 C. A precipitação foi medida por meio de um pluviógrafo e dois pluviômetros. Para o monitoramento da vazão foi instalada uma calha tipo Hde 45 cm, na parte final de uma seção de controle construído ao longo de um trecho retilíneo de 2 m do riacho. A variação da altura dágua na calha foi registrada continuamente por meio de um linígrafo modelo Stevens, de rotação semanal. Amostras semanais da água da chuva e do riacho foram coletadas para efeito de análise de parâmetros de qualidade da água, assim como das concentrações de Ca, Mg, K e Na. Os resultados mostraram um balanço hídrico anual, como valor médio para o pe-ríodo, com os seguintes valores de precipitação (P), deflúvio (Q), e evapotranspiração (P - Q): 1635 mm, 551 mm e 1084 mm, respectivamente. As medições realizadas no Tanque Classe A deram como resultado da evapotranspiração potencial para a região o valor médio anual de 1138 mm. Os resultados dos parâmetros físicos de qualidade da água situaram-se dentro de valores normais para águas naturais de boa qualidade. As concentrações de sedimentos em suspensão equivaleram a uma perda média anual de solo de 0,28 ton.ha-1. O balanço geoquímico dos nutrientes estudados foram, respectivamente para entrada via precipitação e saída via deflúvio, em kg.ha-1.ano-1, para Ca, Mg, K e Na: 4,1, 1.3, 3.7, e 1.2; 4.9, 2.4, 1.4,e 1.4. A análise de hidrógrafas selecionadas ao longo do período mostrou um valor médio da relação Escoamento Direto/Precipitação = 0,024. PALAVRAS-CHAVE: Monitoramento de Microbacia, Eucalyptus saligna, Qualidade da água, Balanço hídrico. ABSTRACT: This study consisted of the analysis of three years of hydrologic data, which began in April 1991, for a small catchment located in the Municipality of Itatinga, State of São Paulo. The catchment has an area of 68.2 ha, and was planted with Eucalyptus saligna back in the 1944. Average annual rainfall and temperature are 1635 mm and 19.40 C, respectively. Precipitation was measured with one recording gage and two non-recording 12 n Small Catchment Hydrology gages. Streamflow was monitored using a 45-cm type H flume, which was installed in the downstream end of a 2-m long artificial, rectilinear control section, and the stage was continuously monitored with a Stevens stage recorder, with weekly rotation. Weekly samples of precipitation and streamflow were also collected, which were analyzed for Ca, Mg, K and Na, as well as for physical water quality parameters and suspended sediment concentrations. Results showed an average annual water balance for the three-year period as follows: Precipitation (P) = 1635 mm; Streamflow (Q) = 551 mm; Water Loss (P - Q) = 1084 mm. Class A pan evaporation measurements showed an average value of 1138 mm per year. Water quality parameters remained well within the range of variation of natural, good quality, waters. Suspended sediment loads amounted to a total soil loss of about 0.28 ton/ha/year, as average for the three study years. The geochemical balance of nutrients showed the following results, in terms of flux density (kg.ha-1.yr-1) of Ca, K, Mg and Na. Precipitation inputs: 4.1, 2.7, 1.3, 1.2; Streamflow outputs: 4.9, 1.4, 2.4, 1.4. The analysis of selected streamflow hydrographs for the study period showed an average catchment response, in terms of direct stormflow runoff / Precipitation, of 0.024. KEYWORDS: Catchment Monitoring, Eucalyptus saligna, Water quality, Water balance. INTRODUCTION Eucalyptus plantations are the center of a very debated controversy in many parts of the world, mainly over environmental and ecological effects of large-scale industrial plantations. Within this controversy, water consumption is by far the most polemical aspect, and there is a general belief that eucalypts dry up the soil, leading, in the long run, to the destabilization of the water cycle. A comprehensive review about the environmental impacts of the eucalypts has been published recently by Lima (1993), and recent results of a very broad cooperative programme of field studies about the growth and water use of eucalypt plantations can be found in Calder et al.(1992). In this paper we examine the results of the first three years of hydrologic measurements of an experimental catchment covered with the regrowth of an old eucalypt forest planted about 50 years ago. Experimental catchments as a suitable methodology for the study of water and nutrient budgets of forest ecosystems have been proved useful in many studies conducted in different countries since the beginning of this century (Hibbert,1967; Bosch & Hewlett, 1982; Likens et al., 1977; Likens,1985). As an excellent example of a geomorphological open system (Gregory & Walling, 1973), the catchment renders itself very adequate for the global evaluation of the land use impacts on water con-sumption, water quality and nutrient budgets. In this context, it is particularly suitable for the long-term monitoring of the influence of forest management on the catchment water balance. This is precisely the case of the preoccupation with water consumption implicit in the eucalypt controversy. Although there are several catchment results dealing with forest plantations in the literature (Lima et al., 1996), only a few such studies can be found with eucalypt plantations, worldwide. A pioneer study of the effect of eucalypt plantation at the catchment level was conducted in South Africa (Van Lill et al., 1980), in a 26-ha catchment originally covered with savanna. Other similar studies then Lima et al. followed: (David et al., 1986; Samraj et al., 1988; Sharda et al., 1988; Bosch & Smith, 1989). In general, these studies examined the hydrological effects of the initial 5 to 10 years of the plantation growth, which are characterized by a decrease in the catchment water yield, as has been also encountered in similar studies with different tree species (Lima, 1993). As stated by Van Lill et al.(1980), their data revealed that the annual rate of water yield decrease began to stabilize after the fifth year of the plantation, in proportion with the stabilization of the rate of tree growth. Therefore, it is interesting to analyse the hydrological behaviour of a catchment, in terms of water balance, water quality and nutrient cycling, which has been under eucalypt plantation for so long a period. THE STUDY AREA The experimental catchment is part of the Itatinga Forest Experimental Station, of the University of São Paulo, which is located in the municipality of Itatinga, in the central part of the State of São Paulo, at latitude of 230 02S, and longitude of 480 38W. Mean altitude is about 830 m and topography is generally undulating, with slopes of up to 10 - 15 %. Soils of the area are very deep and vary from sandy to clayey, formed from altered sandstones. The catchment is of the 2nd order, and has an area of 68.2 ha, and drains perennially in a general NW direction. Average annual precipitation is about 1635 mm, and mean annual temperature is around 19.40 C. Thornthwaite water balance (Thornthwaite & Matter, 1955) shows annual potential evapotranspiration of 877 mm. June, July and August are the driest months, when there is some soil moisture utilization, but practically no water deficit. Eucalyptus saligna was planted around 1944. From 1947 to 1957 the area was logged n 13 for firewood production, after which the sprouts were left to grow for selective extraction of larger trees for the production of railroad sleepers, which was stopped in 1978. The present condition is characterized by an understocked coppice, with total, surveyed volume of about 135 m3/ha, and a dense understory of natural, herbaceous vegetation. MEASUREMENTS Measurements of precipitation, streamflow, and water quality have been taken since April 1991 as part of a broader and longer research project, with the purpose of attempting to establish a self-calibration procedure for the catchment, which will be followed by the hydrologic monitoring of some prescribed forest treatment (Scardua, 1994). Precipitation is being measured by one recording rain gage and three non-recording gages. Weekly samples of rain water are collected on a device similar to the one developed by Coutinho (1979). Other climatic measurements include Class A pan evaporation, air temperature, wind and relative humidity. Streamflow is being monitored in a streamgaging station which includes a pre-fabricated, 45cm H type flume, installed at the downstream end of a 2-m long artificial control section, and a Stevens water-level recorder. The stream gaging station is serviced weekly, when a grab sample of the stream water is taken at the flume for chemical analysis. The station is also provided with a semiautomated collecting system for sampling stream water in two different levels of the stage hydrograph (Knisel Jr. et al., 1971). The weekly samples of rain water and stream water were routinely analysed for Ca, Mg, K and Na, turbidity, conductivity and pH, according to standard laboratory procedures (APHA, 1975). Suspended sediments in streamflow were also analysed by filtration through a 0.45 µ membrane. 14 n Small Catchment Hydrology RESULTS AND DISCUSSION The average monthly values of precipitation and streamflow for the three-year period are given in table 1, for the water year AprilMarch. Table 1: Average monthly values of precipitation (P), and streamflow (Q) for the three-year period. Médias mensais de precipitação (P), do deflúvio (Q) para o período de 3 anos. _______________________________________________________ MONTH P (mm) Q (mm) _________________________________________________________ April 138 47 May 91 50 June 49 43 July 22 39 August 37 37 September 138 41 October 135 40 November 111 36 December 161 43 January 279 45 February 273 68 March 201 62 __________________________________________________ ANNUAL 1635 551 The precipitation data of the study period was found to be consistent, using double-mass analysis, with the regional, historical record. As given in table 1, the ratio between the annual values of streamflow and rainfall (∑Q / ∑p) is equal to 0.337, wich is similar to the water balance measured in other catchment experiments (Bosch & Hewlett, 1982; Leopoldo et al., 1992). Neglecting the change in storage, the simplied water balance equation of the catchment can be written as ET = P - Q wich, for the annual average results shown in table 1 gives the following value for the aver- age annual catchment evapotranspiration: ET = 1084 mm. As a comparison, the adjusted Class A pan evaporation for the area was found to be 1138 mm, which is practically similar to the mass balance value of the catchment evapotranspiration, and slightly higher than the Thornthwaite estimate of 877 mm. The arrangement of the water balance data according to the water year minimizes the changes in storage, but part of the difference may still be attributed to this aspect. Nevertheless, the long-term catchment water balance is apparently well within the climatic mean. Flow duration curve analysis showed that the catchment presented, for the study period, an average daily streamflow of 1.5 mm, equivalent to an average daily discharge of 11.8 l/s, which occurred during 38 % of the time. The median value (50% of the time) was 1.31 mm, equivalent to 10.3 l/s. The minimum daily streamflow was 0.4 mm, equivalent to a minimum daily discharge rate of 3.2. l/s. Stormflow analysis is also convenient for the evaluation of the hydrologic conditions of a catchment. Table 2 shows the compilation of selected stormflow hydrographs which occurred during the study period, in terms of rainfall characteristics, total volume, duration and peak flow of stormflow, as well as its partition between base flow and direct runoff. It can be observed in table 2 that the average value of the ratio direct runoff / rainfall is 0.024, that is, in general only 2.4% of the rainfall volume leaves the catchment as direct runoff, implying that most of the rainfall infiltrates in the soil. The range of variation of this ratio in table 2 is from 1.3 to 4.9%. As reviewed by Lima (1989), the direct runoff of forested catchments is, in general, mostly composed by subsurface processes. Therefore, the occurrence of surface runoff in the study catchment, if any, is practically similar to what can be found in catchments well protected with undisturbed forest cover. Lima et al. n 15 Table 2: Tabulation of select stormflow hydrographs for the study period, in terms of rainfall depth (P), duration (D), total stormflow volume (STR), duration of storm runoff (D), peak flow (PF), direct runoff (DR) and base flow (BF). Tabulação da hidrógrafa de algumas chuvas durante o período de estudos em termos do total de chuva (P), duração da chuva (DP), volume total do hidrograma da chuva (STR), duração do hidrograma (DH), pico do hidrograma (PF), escoamento direto (DR) e escoamento base (BF). _______________________________________________________________________ DATE P (mm) D (min) STR (mm) D (min) PF (l/s) DR (mm) BF (mm) 24/04/91 61.6 960 2.43 1250 54.35 1.30 1.13 24/06/91 20.4 220 1.29 1320 25.73 0.55 0.74 11/07/91 19.4 600 08/08/91 18.4 150 1.48 1380 33.35 0.51 0.97 1.16 1290 21.13 0.35 0.81 25/09/91 15.6 02/10/91 18.8 510 0.87 1290 10.38 0.65 0.22 810 1.21 1230 16.63 0.35 0.86 17/10/91 41.0 205 1.73 1260 50.22 0.90 0.83 09/11/91 35.6 180 1.31 1115 44.38 0.67 0.64 14/11/91 22.2 390 1.26 1380 19.48 0.39 0.87 22/12/91 13.6 540 1.67 1140 37.26 0.67 1.00 25/01/92 25.8 790 1.44 1580 22.60 0.50 0.94 28/01/92 12.8 30 0.74 1140 8.71 0.13 0.61 30/01/92 13.0 315 0.88 1140 14.23 0.22 0.66 04/03/92 62.1 230 3.36 1200 143.0 2.32 1.03 13/03/92 26.8 55 1.71 1220 65.56 0.81 0.90 24/03/92 43.4 720 2.14 1680 45.89 1.03 1.11 31/03/92 50.0 300 2.25 1260 79.13 1.00 1.25 01/05/92 23.8 420 1.84 1500 33.03 0.48 1.36 13/05/92 35.2 1180 2.31 1240 67.47 0.85 1.46 12/11/92 31.0 180 1.34 1110 35.93 0.42 0.92 20/01/93 25.4 360 1.31 1200 26.27 0.43 0.88 21/04/93 31.3 90 2.79 1215 107.23 1.04 1.75 05/05/93 13.0 120 1.96 1170 31.18 0.25 1.71 04/06/93 26.6 420 3.16 1380 47.44 0.76 2.40 18/06/93 21.0 320 2.54 1390 32.10 0.50 2.04 21/09/93 29.4 300 2.57 1310 44.01 0.74 1.83 23/10/93 34.8 600 2.36 1405 52.26 0.71 1.65 24/11/93 19.8 95 1.76 1165 34.62 0.58 1.18 05/02/94 105.8 800 6.21 1510 155.56 3.16 3.04 _________________________________________________________________________________ _________________________________________________________________________________ 16 n Small Catchment Hydrology Another interesting aspect in connection with this stormflow discussion is related to the results of water quality parameters shown in figure 1, which were measured in two different levels of the rising limb of the stormflow hydrograph. As can be observed in these selected parameters, nutrient concentrations, turbidity, color and suspended sediments tend to increase during the stormflow, particularly due to surface runoff leaching. Therefore, the observed small values of direct runoff are also related to small nutrient and soil losses from the study catchment. The average concentrations of the studied nutrients in the streamflow was generally greater than those found in precipitation, with the exception of potassium, which showed similar values for both precipitation and streamflow. Table 3: Precipitation inputs and streamflow outputs of the studied nutrients as annual average values for the three-year period Entradas pela precipitação e saídas pelo deflúvio dos nutrientes estudados (médias anuais para o período de 3 anos). ____________________________________________________ NUTRIENT INPUTS OUTPUTS BALANCE (kg.ha-1.yr-1) ____________________________________________________ Ca 4.1 4.9 - 0.8 K 3.7 1.4 + 2.3 Mg 1.3 2.4 - 1.1 Na 1.2 1.4 - 0.2 ____________________________________________________ The results of turbidity and color were highly variable along the weekly samples, but pH and conductivity values were very consistent throughout the period. Average values of suspended sediment concentrations for the three-year period amounted to a total soil loss of 0.28 ton per hectare per year. Similarly, in terms of catchment geochemical budget, the calculation of nutrient inputs and outputs gave the results shown in table 3, which are very similar to results obtained in other catchment studies (Lima, 1993). CONCLUSIONS The present study consisted of a three-year period of monitoring of water balance, water quality, and nutrients geochemical budget of a small catchment covered with a 50-year old Eucalyptus plantation. The overall analysis of the results showed that the catchment is in a very stable condition, presenting an annual water balance which is well within the climatic mean, as well as a very conservative storm runoff response. Streamflow water quality parameters presented a seasonal pattern of variation, but the range were within the expected variation for natural, good quality waters. The geochemical budget of the studied nutrients was very similar to the results obtained in other catchment studies, with a balance characteristic of stable catchments. Lima et al. K mg/l 17 Ca mg/l 0,5 n 1,2 1 0,4 0,8 0,3 0,6 0,2 0,4 0,1 0,2 0 0 p eb ed 1 ed 2 p Mg mg/l eb 0,5 0,4 0,4 0,3 0,3 0,2 0,2 0,1 0,1 0 ed 2 ed 1 ed 2 ed 1 ed 2 Fe mg/l 0,5 ed 1 0 p eb ed 1 ed 2 p Na mg/l eb Color PCU 0,3 50 40 0,2 30 20 0,1 10 0 0 p eb ed 1 ed 2 p µ S/cm Turbidity NTU 12 eb Conductivity 60 10 8 40 6 4 20 2 0 0 p eb ed 1 ed 2 p Sediments mg/l eb 80 ed 1 ed 2 pH mg/l 6 5 60 4 40 3 2 20 1 0 0 p eb ed 1 ed 2 p eb ed 1 ed 2 Figure 1: Average annual concentrations of K, Ca, Mg , Na and suspended sediments, as well as values of turbidity, color, conductivity and pH, in samples of rain water (p) and stream water, in both base flow (eb) and direct runoff (two levels of the rising limb(ed1, ed2)). Annual values are average for the three years of the study period. Concentrações médias anuais de K, Ca, Mg, Na e sedimentos em suspensão, e valores médios anuais de turbidez, cor, condutividade e pH para amostras de água da chuva (p), do escoamento base (eb), e escoamento direto em dois níveis do braço de ascensão da hidrógrafa (ed1 e ed2) 18 n Small Catchment Hydrology AUTHORS AND ACKNOWLEDGEMENTS WALTER DE PAULA LIMA is Full Professor of the Department of Forest Sciences (ESALQ/ USP, Departamento de Ciências Florestais, 13418-900 Piracicaba SP); FERNANDO PÁDUA SCARDUA is Forester of Brasília Botanical Garden (Jardim Botânico de Brasília, 71680-120 Brasília DF); RILDO MOREIRA E MOREIRA is manager of Itatinga Forest Experimental Station (Estação Experimental de Ciências Florestais de Itatinga, ESALQ/ USP, Departamento de Ciências Florestais); ALBA VALÉRIA MASETTO is technician of the Applied Ecology Laboratory of Department of Forest Sciences (ESALQ/USP, Departamento de Ciências Florestais, 13418-900 Piracicaba SP). Thanks are due to Lourival Firmiano, from the staff of the Itatinga Forest Experimental Station, for his field support for the project. The support of CNPq, Processo No. 301007/ 90-0, is also gratefully acknowledged. LITERATURE CITED APHA AMERICAN PUBLIC HEALTH ASSOCIATION. Standard Methods for the Examination of Water and Wastewater. 13 ed. Washington, 1975. 1193 p. BOSCH, J. M.; HEWLETT, J. D. A review of catchment experiments to determine the effects of vegetation changes on water yield and evapotranspiration. Journal of Hydrology, v. 55, p. 3-23, 1982. BOSCH, J. M.; SMITH, R. E. The effects of afforestation of indigenous scrub forest with eucalyptus on streamflow from a small catchment in the Transvaal, South Africa. South African Forestry Journal, n. 150, p. 7-17, 1989. CALDER, I. R.; HALL, R. L.; ADLARD, P. G., ed. Growth and Water Use of Forest Plantations. New York: John Wiley, 1992. 381 p. COUTINHO, L. M. Aspectos ecológicos do fogo no cerrado: 3 - A precipitação atmosférica de nutrientes minerais. Revista Brasileira de Botânica, v. 2, n. 2, p. 97101, 1979. DAVID, J. S.; HENRIQUES, M. O.; REGO, Z. C. Shortterm responses of streamflow following clearcutting in Eucalyptus globulus stands in Central Portugal. In: IUFRO/FAO. The Influence of Different Kinds of Vegetation Cover on Erosion, Water Quality and Quantity. Wien, 1986. 12 p. GREGORY, K. J.; WALLING, D. E. Drainage Basin Form and Process: A geomorphological approach. New York: John Wiley, 1973. 456 p. HIBBERT, A. R. Forest treatment effects on water yield. In: I NTERNATIONAL S YMPOSIUM ON F OREST HYDROLOGY, 1967. Proceedings. Pergamon Press, 1967. p. 527-543. KNISEL JR., W. G.; RICHARDSON, C. W.; KOESTER, J. H. Sampler of watershed runoff. Agricultural Engineering, v. 22. p. 188-189, 1971. LEOPOLDO, P. R.; CHAVES, J. G.; FRANKEN, W. K. Balanço hídrico: comparação entre solos nús e cobertura florestal na Amazônia Central. In: CONGRESSO BRASILEIRO DE ENGENHARIA AGRÍCOLA DO CONE SUL, Santa Maria, 1992. Anais. v. 2A, p. 606-612. LIKENS, G. E. An experimental approach for the study of ecosystems. Journal of Ecology, v. 73, p. 381-396, 1985. LIKENS, G. E.; BORMANN, F. H.; PIERCE, R. S.; EATON, J. S.; JOHNSON, N. M. Biogeochemistry of a Forested Ecosystem. Berlin: Springer-Verlag, 1977. 146p. L IMA, W. P. Função hidrológica da mata ciliar. In: S IMPÓSIO SOBRE MATA C ILIAR, São Paulo, 1989. Anais. Campinas: Fundação Cargill, 1989. p. 25-42. LIMA, W. P. Impacto Ambiental do Eucalipto. São Paulo: EDUSP, 1993. 301 p. L IMA, W. P.; P OGGIANI , F; V ITAL , A.R.T. Impactos ambientais de plantações florestais sobre o regime hídrico e de nutrientes em bacias hidrográficas. In: C ONGRESSO L ATINO A MERICANO DE CI ÊNCIA DO SOLO, 13, Águas de Lindóia, 1996. Anais. (publicado em CD-ROM). S AMRAJ , J. P.; S HARDA , V. N.; C HINNAMANI , S.; L AKSHMANAN ,V.; H ALDORAI , B. Hydrological behaviour of the Nilgiri Sub-Watersheds as affected Lima et al. n 19 by Bluegum plantations: Part 1 The annual water balance. Journal of Hydrology, v. 103, p. 333-345, 1988. runoff probabilities. Journal of Hydrology, v. 103, p. 347355, 1988. SCARDUA, F. P. Caracterização Hidrológica de uma Microbacia Hidrográfica da Estação Experimental de Ciências Florestais de Itatinga. Piracicaba, 1994, 94 p. Dissertação (M.S.) Escola Superior de Agricultura Luiz de Queiroz, Universidade de São Paulo. THORNTHWAITE, C.W. & MATHER, J. R. The Water Balance. Drexel Institute of Technology. Publications in Climatology, v. 8, n. 1, p.1-86, 1955. SHARDA, V. N.; SAMRAJ, P.; CHINNAMANI, S.; LAKSHMANAN, V. Hydrological behaviour of the Nilgiri SubWatersheds as affected by Bluegun plantations: Part 2 Monthly water balance at different rainfall and VAN LILL, W. S.; KRUGER, S.D.F.J.; VAN WYK, D. B. The effect of afforestation with Eucalyptus grandis Hill exMaiden and Pinus patula Schlecht et Chann on streamflow from experimental catchments at Mokobulann, Transvaal. Journal of Hydrology, v. 48, p. 107-118, 1980. 20 n Small Catchment Hydrology
Download