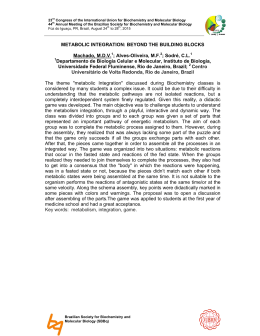
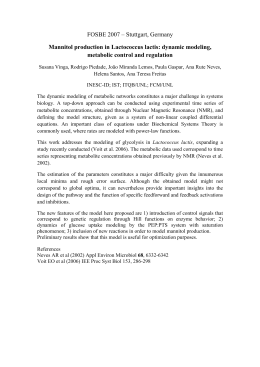
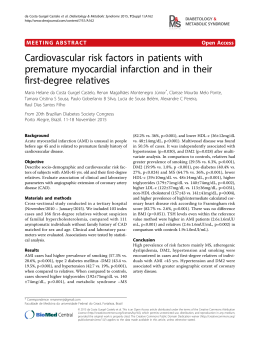
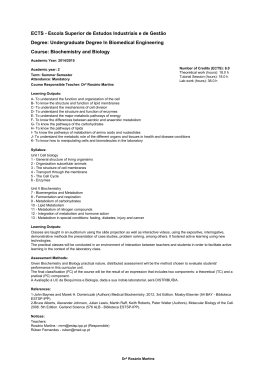
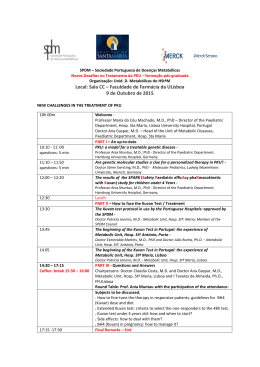
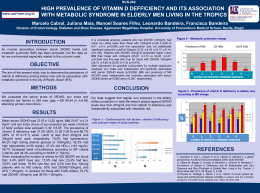
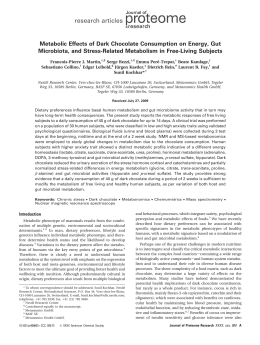
165
Seasonal Changes in Daily Metabolic Patterns of Tegu Lizards
(Tupinambis merianae) Placed in the Cold (17⬚C) and Dark
William K. Milsom1,*
Denis V. Andrade2
Simone P. Brito2
Luis F. Toledo2
Tobias Wang 3
Augusto S. Abe2
1
Department of Zoology, University of British Columbia,
Vancouver, British Columbia V6T 1Z4, Canada;
2
Departamento de Zoologia, Universidade Estadual Paulista,
Rio Claro, São Paulo, Brasil; 3Department of Zoophysiology,
University of Aarhus, Aarhus, Denmark
Accepted 7/17/2007; Electronically Published 1/16/2008
ABSTRACT
Oxygen consumption rate was measured continuously in young
tegu lizards Tupinambis merianae exposed to 4 d at 25⬚C followed by 7–10 d at 17⬚C in constant dark at five different times
of the year. Under these conditions, circadian rhythms in the
rate of oxygen consumption persisted for anywhere from 1 d
to the entire 2 wk in different individuals in all seasons except
the winter. We also saw a progressive decline in standard oxygen
consumption rate (at highly variable rates in different individuals) to a very low rate that was seasonally independent (ranging from 19.1 Ⳳ 6.2 to 27.7 Ⳳ 0.2 mL kg⫺1 h⫺1 across seasons).
Although this degree of reduction appeared to take longer to
invoke when starting from higher metabolic rates, tegu lizards
reduced their metabolism to the low rates seen in winter dormancy at all times of the year when given sufficient time in
the cold and dark. In the spring and summer, tegus reduced
their standard metabolic rate (SMR) by 80%–90% over the
experimental run, but only roughly 20%–30% of the total fall
was due to the reduction in temperature; 70%–80% of the total
fall occurred at constant temperature. By autumn, when the
starting SMR on the first night at 25⬚C was already reduced by
59%–81% (early and late autumn, respectively) from peak summer values, virtually all of the fall (63%–83%) in metabolism
was due to the reduction in temperature. This suggests that the
temperature-independent reduction of metabolism was already
* Corresponding author; e-mail: [email protected].
Physiological and Biochemical Zoology 81(2):165–175. 2008. 䉷 2008 by The
University of Chicago. All rights reserved. 1522-2152/2008/8102-60412$15.00
DOI: 10.1086/524148
in place by autumn before the tegus had entered winter
dormancy.
Introduction
It is well known that metabolic rate cycles dramatically over
the course of the day during the active season in lizards (Kramer
1934; Roberts 1968; Songdahl and Hutchison 1972; Mautz and
Case 1974; Rismiller and Heldmaier 1991; Klein et al. 2006).
While lizards also demonstrate circadian rhythms in thermal
preference and locomotor activity, metabolic rates in many still
show circadian cycles even when temperature and activity remain constant (Kramer 1934; Roberts 1968; Rismiller and
Heldmaier 1991). Tegu lizards appear to be no exception (Klein
et al. 2006). Furthermore, some lizards also exhibit circadian
rhythms in melatonin secretion and metabolism that persist,
at least for several days, under conditions of constant temperature and darkness (Menaker and Wisner 1983; Rismiller and
Heldmaier 1991; Tosini and Menaker 1996; Lutterschmidt et
al. 2003) or following parietalectomy and blinding (Songdahl
and Hutchison 1972).
With their seasonal changes in behavior, many lizards also
exhibit seasonal changes in metabolic rate. While some species
show metabolic acclimation/acclimatization to compensate for
seasonal changes in temperature (Roberts 1968), other species
downregulate physiological and biochemical processes and become dormant. The metabolic rate of tegus, like other lizards
in this latter group, measured at a constant temperature falls
progressively from summer to winter, and the magnitude of
this fall is proportionately less at lower temperatures (Weigmann 1932; Moberly 1963; Mayhew 1965; Gelineo 1967; Bennett and Dawson 1976; Abe 1983, 1993, 1995; de Souza et al.
2004). As a consequence, the effect of temperature on metabolic
rate (the Q10 effect) is progressively reduced from summer to
winter, and thus the metabolic rate of dormant lizards is much
less temperature dependent (Abe 1983, 1993, 1995; de Souza
et al. 2004). Indeed, preparation for dormancy may begin well
before winter, and the loss of temperature sensitivity may occur
in midautumn and precede the general decrease in levels of
metabolism (Gelineo 1967). Other studies, however, report that
the Q10 effect does not change with season (for review, see
Bennett and Dawson 1976) or that Q10 even increases during
winter at higher temperatures in larger animals (Andrade and
Abe 1999). Of particular note is that the effect of temperature
on metabolic rate has been reported to be reduced, unchanged,
or increased during winter all in the same species, Tupinambis
166 W. K. Milsom, D. V. Andrade, S. P. Brito, L. F. Toledo, T. Wang, and A. S. Abe
merianae, in different studies (Abe 1983, 1993, 1995; Andrade
and Abe 1999; de Souza et al. 2004; Toledo et al. 2008).
There are seven species of tegu lizard in the genus Tupinambis, with various distributions throughout South America. The
three most southerly occurring species (Tupinambis duseni,
Tupinambis rufescens, and T. merianae) belong to one clade that
can undergo seasonal dormancy (Köhler and Langerwerf 2000;
Manzani and Abe 2002). One of them, T. merianae, has been
the subject of a variety of studies that have examined patterns
of daily and seasonal change in activity, body temperature, and
metabolic rate (Abe 1983, 1993, 1995; Andrade and Abe 1999;
Andrade et al. 2004; de Souza et al. 2004; Klein et al. 2006;
Toledo et al. 2008).
Tupinambis merianae are commonly found throughout
south/southeastern Brazil and Argentina (Vanzolini et al. 1980;
Avila-Pires 1995; Lopes and Abe 1999). They are active predators during the summer months (the hot, rainy season from
October to April). At this time, they exhibit a pronounced
circadian cycle of changes in activity, body temperature, and
metabolic rate. These animals are diurnal and, in captivity,
usually leave their burrows shortly after sunrise and bask until
their body temperatures reach 35⬚–37⬚C. They remain active
throughout the day and reenter their burrows during the late
afternoon, where they remain inactive with body temperatures
falling throughout the evening and night (Andrade et al. 2004;
C. Sanders, personal observation). Active tegus will remain in
their burrows throughout the day if the weather turns inclement
and cool. During the winter months (the cold, dry season from
May to September), T. merianae enter into dormancy, retreating
permanently into their burrows where they remain inactive and
fast for 3–4 mo (Abe 1995; Andrade et al. 2004).
It is clear that metabolic suppression in reptiles is a complex
phenomenon and is regulated by both endogenous and exogenous factors and that these factors fluctuate on both a daily
and a seasonal basis (Guppy and Withers 1999; de Souza et al.
2004). Given how little is known about these factors and their
interactions, it is not surprising that such wide-ranging changes
in oxygen consumption rate have been reported to occur as a
function of season in different studies of the same species (Abe
1983, 1993, 1995; Andrade and Abe 1999; de Souza et al. 2004;
Toledo et al. 2008). In a companion article (Toledo et al. 2008),
we describe how the standard metabolic rate (SMR) of tegu
lizards is affected by changes in body temperature, body mass,
and season. In this article, we explore two of the proximate
factors involved in inducing metabolic suppression. There are
many factors that may be involved in inducing metabolic suppression in this species, including changes in food and water
availability, temperature, and photoperiod. In this study, we
wanted to examine the effects of season per se on resting metabolic rate in T. merianae. To do so, we placed animals under
conditions of prolonged (at least 1 wk) low temperature (17⬚C)
and darkness, which mimic the situation that tegus experience
when they retreat into burrows at the beginning of the dormancy season (Andrade and Abe 1999). As such, each group
was exposed to different conditions of food and water avail-
ability, temperature, and photoperiod before these changes, and
we could compare the effects of enforced cold and dark on
metabolic rate during the active period versus the seasonally
induced effects of cold and behaviorally selected confinement
to the (dark) burrow during the inactive period. While this
would not reveal the cues that induce seasonal dormancy in
this species, it would indicate whether seasonal changes were
required to induce metabolic suppression or whether burrow
confinement at lower temperatures alone could suppress metabolism regardless of season.
Material and Methods
Animals
All specimens of Tupinambis merianae used in this study were
juvenile animals that had been captive bred at the Jacarezário,
Universidade Estadual Paulista, in Rio Claro, São Paulo state,
southeastern Brazil. Before experimentation, animals were
group housed indoors in plastic boxes (74 cm # 56 cm # 41
cm). During the active season (October to April), the boxes
were equipped with incandescent lights to provide a source of
radiant heat for thermoregulation along with diffuse sunlight
from outside. During the night, box temperature would fall to
ambient temperature (20⬚–25⬚C). During the active season, all
animals were fed two to three times a week with minced meat
supplemented with fruit, minerals, and vitamins. Water was
available ad lib. During the inactive season (May to September),
animals were maintained in constant dark at room temperature
(16⬚–21⬚C) without access to food or radiant heat. In all seasons, animals were fasted for at least 10 d before experimentation, and only individuals that seemed healthy and were not
moulting were used.
Respirometry
Oxygen uptake rates (V̇o2) were measured using a computerautomated, open respirometry setup (TR-RM8, Sable System).
This system was programmed to ventilate eight respirometers
(1.0-L acrylic chambers) with fresh air (200 mL min⫺1 per
chamber) and to sample sequentially from each chamber for
a 5-min period with an oxygen analyzer (PA-1, Sable System;
200 mL min⫺1 flow). In this way, each chamber was sampled
for 5 min every 40 min. The analyzer was calibrated frequently
with gases that had been prepared by a precision gas mixing
pump (model GF-3/MP, Cameron Instruments). Excurrent
flow was passed through a drying column (Drierite) before
entering the gas analyzer. The output from the gas analyzer was
collected on a data acquisition system (DATACAN V, Sable
System). The fractional composition of the incurrent air was
checked regularly by drawing air through an empty chamber.
Experimental Protocol
Four separate experimental runs were performed with different
groups of animals during the active season. Experiments were
Daily and Seasonal Metabolic Depression in Tegu Lizards 167
Figure 1. Relationship between oxygen consumption rate (mL kg⫺1 h⫺1 stpd) and time for the summer group. The vertical dashed line indicates
when the chamber temperature was reduced from 25⬚ to 17⬚C (after the fourth day in the chamber). Open symbols are data collected between
0600 and 1800 hours, while filled circles are data collected between 1800 and 0600 hours the next day. Animals were in constant dark, and
data are presented in this format to indicate, roughly, the normal daytime and nighttime hours. Values are mean Ⳳ SEM; n p 5.
performed in September (spring; n p 8 , body mass 105–158
g, mean p 129 Ⳳ 6 g), February (summer; n p 5 , body mass
340–620 g, mean p 423 Ⳳ 28 g), April (early autumn; n p 7,
body mass 80–155 g, mean p 112 Ⳳ 16 g), and June (late autumn; n p 6, body mass 141–252 g, mean p 172 Ⳳ 5 g). The
tegus were placed inside respirometry chambers of adequate
volumes (0.3–1.5 L) and maintained within a climatic chamber
at 25⬚C in constant dark. Tegus were allowed to acclimate to
this temperature for 4 d before the temperature was reduced
to 17⬚C overnight. Animals were then maintained at this lower
temperature for 7–10 d. One additional group of animals was
run during the winter season in August (winter; n p 7, body
mass 146–440 g, mean p 301 Ⳳ 72 g). Because these animals
were already dormant at 17⬚C, they were placed in the respirometry chambers and immediately placed within a climatic
chamber at 17⬚C in constant dark for 6 d. Metabolic rate was
monitored intermittently (5 min every 40 min for each animal)
throughout all experimental series, and at the end of the series
the animals were removed from the respirometers and returned
to the colony.
The temperatures selected for this study were based on historical records of the mean temperatures measured in the artificial burrows in which the older animals resided year round
(A. S. Abe, unpublished data). Unfortunately, we do not have
access to records of temperatures in natural burrows, but we
believe the design of the artificial burrows was such that the
temperature profiles should mimic those that would be seen
in natural burrows. To illustrate the seasonal change in the
thermal profile of the artificial burrows used by the tegus, in
2003–2004, the mean burrow temperature for two burrows
during August was 19.04⬚ Ⳳ 0.03⬚C, while that during December was 25.05⬚ Ⳳ 0.02⬚C. The burrows are well insulated, and
thus daily temperature fluctuations are well buffered. In general,
daily fluctuations were 4.9⬚ Ⳳ 0.4⬚ in winter and 4.0⬚ Ⳳ 0.2⬚
degrees in summer. Outdoor temperatures for the same months
fluctuated by 18.7⬚ Ⳳ 0.9⬚ degrees in winter (mean night
temperatures p 9.6⬚C, mean day temperatures p 28.3⬚C) and
25.0⬚ Ⳳ 0.9⬚ in summer (mean night temperatures p 18.4⬚C,
mean day temperatures p 42.6⬚C).
Data Analysis and Handling
The SMR was determined from the V̇o2 measurements. The
V̇o2 was calculated from the difference in fractional concentration of oxygen in air entering and leaving each respirometer
during the sampling period. The system was able to yield a
V̇o2 measurement for each respirometer every 40 min. Barometric pressure and chamber temperature were used to convert
the measures to stpd, and values are reported as milliliters per
kilogram per hour stpd. Because circadian variations in me-
168 W. K. Milsom, D. V. Andrade, S. P. Brito, L. F. Toledo, T. Wang, and A. S. Abe
Figure 2. Relationship between oxygen consumption rate (mL kg⫺1 h⫺1
stpd) and time for three individual animals from the summer group
to illustrate the individual variability in response to the protocol. The
vertical dashed line indicates when the chamber temperature was reduced from 25⬚ to 17⬚C (after the fourth day in the chamber). Open
and filled symbols as in Figure 1.
tabolism were present for some animals, and because we had
no way to verify whether there were circadian variations in
activity associated with these, comparisons were made only
between V̇o2 measurements taken during the period in which
metabolism was lowest (usually at night), using a one-way
ANOVA for repeated measures followed by a Tukey test for all
pairwise multiple comparisons. All values are presented as
mean Ⳳ SEM. Differences were considered to be statistically
significant at P ! 0.05.
Results
In Figure 1, the mean oxygen consumption rates of all the
animals recorded during the summer are shown to illustrate
the general protocol. Note that during the first 4 d at 25⬚C in
constant darkness, mean metabolic rate continued to exhibit
circadian peaks at roughly midday to late afternoon and, as a
rule, fell to progressively lower rates during each successive
night. The time of maximal and minimal oxygen consumption
rate shifted slightly each day as the circadian period became
“free running.” In this particular group, circadian peaks in
activity continued to occur for the first few days after the temperature was reduced to 17⬚C. The data for three individual
animals were selected to demonstrate the extent of individual
variability that was seen in this response, and these are presented in Figure 2. In some animals (as in the case of tegu 1),
metabolic rate fell rapidly, reaching low rates by the second
night at 25⬚C. Others (as in the case of tegu 6) showed very
little change in metabolic rate until the chamber temperature
was reduced. These were the extremes, and tegu 3 demonstrates
a response much like the mean for all animals.
Figure 3 presents mean oxygen consumption rates (ⳲSEM)
for each of the five groups for all days at 17⬚C, while Figure 4
presents similar data for three individual animals during the
late autumn. There are noticeable circadian rhythms in the
levels of oxygen consumption rate for all groups except the
winter group, albeit these rhythms are larger in some groups
than others. As can be seen from Figure 4, however, even in a
group where there is a substantial rhythm in the group mean
data, there is much individual variability. Some animals show
no circadian peaks in oxygen consumption rate throughout the
entire period at 17⬚C, some show sporadic peaks, and some
show consistent daily increases in oxygen consumption rate.
Given the low rates of oxygen consumption in these animals,
one or two individuals with such significant daily peaks bias
the group mean data. At least one individual was found in
every group, except the winter group, that continued to show
circadian cycles in oxygen consumption rate under these conditions of constant temperature and dark. It should be remembered, however, that the winter animals had been inactive in
dark boxes at 17⬚C for at least 1 mo before recordings and,
thus, were well acclimatized to these conditions.
The daily minimum levels in the rate of oxygen consumption
for all individuals were used to estimate the effects of time and
temperature on metabolism in each group, and these data are
presented in Table 1. From this table, it can be seen that in
spring and summer, when the resting metabolic rates of the
lizards were high when they were first placed in the chamber,
there was a significant (43%–55%) drop in metabolic rate over
the first 4 d at 25⬚C. In the autumn, when starting metabolic
rates were lower, this decrease was not large. During the first
night that the temperature was reduced from 25⬚ to 17⬚C, there
was an additional 33%–63% fall in metabolic rate. The subsequent additional fall in metabolic rate during the 7 d at 17⬚C
was significant only in the spring and summer. Overall, these
data suggest that while the fall in metabolic rate over the entire
course of a run was almost exclusively due to the change in
temperature in animals in the autumn (early and late), most
of the decrease was due to other factors in the spring and
summer.
The effects of season on the metabolic rates recorded at night
at 17⬚C are also presented in Figure 5. If the metabolic rates
recorded during the first night at 17⬚C are compared, there is
a progressive fall in oxygen consumption rate from 38 Ⳳ 7 mL
kg⫺1 h⫺1 (n p 8) in spring to 22 Ⳳ 6 mL kg⫺1 h⫺1 (n p 7) in
Daily and Seasonal Metabolic Depression in Tegu Lizards 169
Figure 3. Relationship between oxygen consumption rate (mL kg⫺1 h⫺1 stpd) and time for five groups of animals recorded at different times
of the year. In all cases, the chamber temperature was reduced from 25⬚ to 17⬚C during the day before the data shown. Open and filled symbols
as in Figure 1. Values are mean Ⳳ SEM; n p 8, 5, 7, 6, and 7 for spring, summer, early autumn, late autumn, and winter, respectively.
winter. The metabolic rate of the winter group is significantly
lower than that of all other groups. When the metabolic rates
recorded during the second night at 17⬚C are compared, however, the difference is reduced, and by the sixth night it is
completely absent. Thus, if animals remain in the dark and the
cold long enough, their metabolic rates fall to similar levels
regardless of the season.
and Wisner 1983; Rismiller and Heldmaier 1991; Abe 1995; de
Souza et al. 2004). Instead, what we saw was tremendous variability in circadian behavior and a progressive decline in the
oxygen consumption rate to a level that was seasonally independent but that occurred in seasonally specific ways.
Circadian Rhythms in the Rate of Oxygen Consumption
Discussion
On the basis of previous reports in the literature, we anticipated
that with our protocol (4 d at 25⬚C followed by 7–10 d at 17⬚C,
all in constant dark), we would see slow extinction of the circadian rhythms in oxygen consumption rate over many days
accompanied by a relatively rapid decline in nighttime metabolic rate to a constant, seasonally dependent level (Menaker
Numerous studies document daily variations in metabolic rates
in reptiles. Much of this variation, however, is due to diel
variations in body temperature and activity (Kramer 1934; Roberts 1968; Songdahl and Hutchison 1972; Mautz and Case 1974;
Bennett and Dawson 1976; Rismiller and Heldmaier 1991; Klein
et al. 2006). However, metabolic rates may still show circadian
cycles even when temperature and activity remain constant,
170 W. K. Milsom, D. V. Andrade, S. P. Brito, L. F. Toledo, T. Wang, and A. S. Abe
Figure 4. Relationship between oxygen consumption rate (mL kg⫺1 h⫺1 stpd) and time for three individual animals from the late autumn
group to demonstrate the individual variability in metabolic rate seen between individuals of the same group. In all cases, the chamber
temperature was reduced from 25⬚ to 17⬚C during the day before the data shown. Open and filled symbols as in Figure 1.
although the magnitude of the daily change may be reduced
in winter and in any season at lower temperatures (Kramer
1934; Roberts 1968; Rismiller and Heldmaier 1991). Furthermore, some reptiles also exhibit circadian rhythms in melatonin
secretion that persist, at least for several days, under conditions
of constant temperature and darkness (Menaker and Wisner
1983; Underwood 1992; Tosini and Menaker 1996; Lutterschmidt et al. 2003). There is little data documenting the
changes that occur in the diel cycle in metabolism under conditions of constant temperature and darkness, although the
rhythmicity has been reported to persist for varying periods in
several species (Kramer 1934; Roberts 1968; Hicks and Riedesel
1983; Rismiller and Heldmaier 1991; Klein et al. 2006).
In this study, we did not quantify the daily peaks in oxygen
consumption rate or the magnitude of the rhythm, since we
did not control for changes in activity level and cannot say
whether they were activity dependent or independent. On the
basis of observations of others (Rismiller and Heldmaier 1991;
Klein et al. 2006), however, it is likely that most of the daily
peaks in oxygen consumption rate represent activity-dependent
increases in metabolism. What was most striking about the
effects of constant dark and (after the first 4 d) cold was the
tremendous individual variability in the persistence of this
rhythm. In some animals, it was extinguished after the first
day, while in others, it lasted throughout the entire 14 d of the
experiment. In most cases, the rhythm disappeared within the
first week. If the peaks in daily metabolism do reflect daily
cycles of activity, these data suggest that there is large variability
in the tendency of these lizards to become and remain inactive.
Some settle down immediately, some settle down progressively,
and some sporadically become active again from time to time
(see Fig. 4). We cannot say whether these daily peaks were
reduced in winter since our winter animals had already been
dormant at 17⬚C for 1–2 mo before being placed in the chambers. As a result, the winter animals had been in constant dark
and low temperature for a prolonged period before recordings
commenced. Given that this is their normal period of dormancy
where activity is extremely rare, however, the lack of diel
rhythms in metabolism was not surprising.
First 4 d in the Dark at 25⬚C
We saw large progressive nightly falls in metabolism over the
first 4 d of darkness at 25⬚C in spring and summer, the seasons
when SMR was most elevated. These were notably absent in
the autumn. Again, what was striking about our results was
Daily and Seasonal Metabolic Depression in Tegu Lizards 171
Table 1: Mean values of oxygen consumption rate (mL kg⫺1 h⫺1 stpd) for tegu lizards in each season
Night
V̇o2:
1
4
5
6
11
Decrease (%):
N1 r N11
Relative decrease:
N1 r N4
N4 r N5
N5 r N11
Total
Q10:
N4 r N5
Temperature (⬚C)
25
25
25 r 17
17
17
Spring
121
55
33
30
23
Ⳳ
Ⳳ
Ⳳ
Ⳳ
Ⳳ
Summer
25a
14c
6c
2c
2c,d
196
88
33
34
20
Ⳳ
Ⳳ
Ⳳ
Ⳳ
Ⳳ
32
26c
5c
5c
3c,d
Early Autumn
81
75
31
29
28
Ⳳ
Ⳳ
Ⳳ
Ⳳ
Ⳳ
8a
9
3c,d
3c,d
3c,d
Late Autumn
Winter
Ⳳ
Ⳳ
Ⳳ
Ⳳ
Ⳳ
…
…
…
22 Ⳳ 5a
22 Ⳳ 6
38
36
24
21
19
1a,b
1
2c,d
1a,c,d
1c,d
25 r 17
81.0a,c,d
89.8
65.4a
50.0a,b
25 r 25
25 r 17
25 r 17
67.4
22.4
10.2
61.4
31.3
7.3
11.3
83.0
5.7
10.5
63.2
26.3
100
25 r 17
1.85
100
3.24
100
2.89
…
100
1.62
Note. Data taken on the first and last nights of the protocol at 25⬚C, on the night of the switch to 17⬚C, and subsequently on the first
and last nights at 17⬚C. Percent decrease in oxygen consumption rate between the first and last night at 25⬚C (N1–N4), between the last
night at 25⬚C and the first night at 17⬚C (N4–N5), between the first and last full night at 17⬚C (N6–N11), and between the first night at
25⬚C and the last night at 17⬚C (N1–N11). Mean values Ⳳ SEM ; n p 8 , 5, 7, 6, and 7 for spring, summer, early autumn, late autumn, and
winter, respectively.
a
Indicates significant difference from summer values on that night.
b
Indicates significant difference from spring values on that night.
c
Indicates significant difference from night 1 in that season.
d
Indicates significant difference from night 4 in that season.
the large individual variation in the falls that occurred in spring
and summer. While some tegus (such as tegu 6 from the summer group in Fig. 2) maintained a constant nighttime SMR
over this period, most did not. As a general rule, oxygen consumption rate fell progressively following each circadian cycle,
although in some instances it fell to dramatically lower yet stable
levels within 48 h (as in the case of tegu 1 in Fig. 2).
It is difficult to say whether the large falls in nighttime metabolism that occurred over the first 4 d during the spring and
summer were due to initial stress (and hence high starting
metabolic rates) or progressive metabolic suppression. We
could find nothing specific in the literature for comparison
since other studies measured values over the first 24 h either
only in animals that were otherwise maintained under normal
photoperiod (Rismiller and Heldmaier 1991) or in animals that
were housed in the dark for extended times but in which metabolic rates were not measured continuously (Ragland et al.
1981). While several studies have shown that novel environments lead to elevated metabolic rates in reptiles (Snyder 1975;
Bickler and Anderson 1986; Hare et al. 2004; Hopkins et al.
2004), there are no systematic studies indicating how long it
takes to eliminate this effect. It is also possible that progressive
fasting leads to reductions in metabolic rate, and these reductions may be larger in spring and summer, when animals are
typically more active. All animals, however, had been fasted for
10 d before experiments began reducing (but not necessarily
eliminating) the likelihood of this. On the other hand, two lines
of evidence suggest that the reductions observed in this study
may have been true metabolic suppression. The first is that
similar declines in metabolism did not occur over the first four
nights at 25⬚C in the early or late autumn, despite the fact that
all animals in all seasons should have been stressed to the same
extent by our protocol. The second is that the decrease in
metabolic rate that we saw over the first four nights in spring
and summer reduced SMR to the same low levels seen naturally
in the autumn. This would suggest that these lizards are capable
of suppressing metabolism significantly in all seasons but normally do so only in the autumn. Removal of diel changes in
photoperiod and temperature by experimental confinement in
the dark at constant temperature in the spring and summer
seems to elicit the same responses normally triggered by the
physiological, behavioral, and meteorological changes that occur in the autumn (see further discussion below).
Switch from 25⬚ to 17⬚C
The effect of temperature on metabolic rate (the Q10 effect) has
been reported to be progressively reduced from summer to
winter in many species of lizard (Abe 1983, 1993, 1995; Rismiller and Heldmaier 1991; Zari 1999; de Souza et al. 2004).
Indeed, preparation for dormancy may begin well before winter,
and the loss of temperature sensitivity may occur in midautumn
and precede the general decrease in levels of metabolism (Gelineo 1967). Other studies, however, report that the Q10 effect
172 W. K. Milsom, D. V. Andrade, S. P. Brito, L. F. Toledo, T. Wang, and A. S. Abe
Figure 5. Levels of oxygen consumption rate (mean Ⳳ SEM ) recorded in the various groups during different nights over the period that animals
were held at 17⬚C in constant dark. Values are mean Ⳳ SEM ; n p 8 , 5, 7, 6, and 7 for spring, summer, early autumn, late autumn, and winter,
respectively. Asterisk indicates significant difference from summer values; plus sign indicates significant difference from spring values.
does not change with season (for review, see Bennett and Dawson 1976), that the Q10 increases during winter at higher temperatures in larger animals (Andrade and Abe 1999) as a strategy for stimulating arousal for reproduction in the spring, and
that Q10 increases during winter at lower temperatures in some
species as a mechanism to enhance metabolic suppression during dormancy (Zari 1996, 1999). In Tupinambis merianae, the
effect of temperature on metabolic rate has been reported to
be reduced, unchanged, or increased during winter in different
studies, most likely reflecting differences in the size of the animals and the length of the acclimation period (Abe 1983, 1993,
1995; Andrade and Abe 1999; de Souza et al. 2004; for a more
detailed discussion, see Toledo et al. 2008). In this study, Q10
values ranged from 1.62 to 3.24 across the seasons, leading to
30%–60% reductions in SMR. While the decrease was greatest
in summer and early autumn, it was significant in all seasons.
Constant Dark at 17⬚C
As at 25⬚C, we also saw progressive nightly falls in metabolism
over the first few days of darkness at 17⬚C. The falls were
relatively small, however, and occurred in all seasons. We also
found that the oxygen consumption rates measured during the
first night following the reduction of chamber temperature to
17⬚C decreased progressively from spring through autumn, as
did the fall that occurred over the next few days (Fig. 4). Many
studies have documented such seasonal declines in oxygen consumption rate at constant temperature (Moberly 1963; Mayhew
1965; Rismiller and Heldmaier 1991; Zari 1999), and several
studies have documented this trend specifically in tegu lizards
at 17⬚C (Abe 1983, 1993, 1995; de Souza et al. 2004; Fig. 6).
However, since the oxygen consumption rate fell more in the
active season over successive days in constant dark at 17⬚C, the
metabolic rates in all seasons ultimately fell to the same low
values. We interpret this as indicating that this species can
suppress metabolism to the same absolute degree under appropriate conditions regardless of season. Although this degree
of suppression appears to take longer to invoke when starting
from higher metabolic rates during the active season, tegus can
suppress their metabolism to these low levels at any time of
the year if given sufficient time in the cold and dark.
Is This Metabolic Suppression?
This raises two questions: are the temperature-independent and
seasonally dependent reductions in metabolism due to active
suppression, and are the seasonally independent low metabolic
rates seen in this study indicative of dormant animals? By the
end of the six nights at 17⬚C, all groups in our study had an
SMR equivalent to the winter group that had been dormant in
their home boxes for 2 mo, which would suggest that they all
were dormant by that time. The overall reductions in metabolic
rate also compare favorably to values reported in the literature
for metabolic depression in lizards during their inactive season
expressed as a percentage of metabolic rate during their active
season. In a recent review, these reductions have been reported
to range from 25% to 69% for 11 species of temperate and
Daily and Seasonal Metabolic Depression in Tegu Lizards 173
Figure 6. Relationship between oxygen consumption rate and season
at 17⬚C from different studies on Tupinambis merianae. Filled circle,
data from Abe (1995; mean mass p 1,119 g; n p 12); filled triangle,
data from Toledo et al. (2008; mass range 12–3,750 g; n p 25–35);
open triangle, data from this study (mass range 80–620 g; n p 5–8).
Data from de Souza et al. (2004; open diamond; mass range 92–129
g; n p 12) and Andrade and Abe (1999; open circle; mass range 525–
2,140 g; n p 6) for winter animals only are also included for comparison. Note: for comparison, in all cases, the values of oxygen consumption rate have been converted to milliliters O2 per hour normalized to 1 kg body mass using the scaling equations from Toledo
et al. (2008).
tropical lizards (Christian et al. 1999), and our 50%–90% reductions fall within or exceed this range.
It should be noted that dormancy and depression of metabolism appear to be controlled independently in many lizards.
In Phrynosoma, dormancy was reported to develop in response
to decreased photoperiod, while metabolic depression was
largely dependent on falls in temperature (Mayhew 1965). This
was also true for our autumn animals. A fall in SMR under
constant conditions (including constant temperature) provides
the definition for true metabolic suppression (as opposed to
cold-induced torpor) in reptiles (Patterson and Davies 1978;
Gregory 1982), and in this context, if one only looks at the
data for autumn animals, one would conclude that, in winter,
our tegu lizards enter cold-induced torpor. The data when
viewed across the seasons, however, suggest that they slowly
enter a dormant state accompanied by true metabolic
suppression.
It is interesting to note that the net fall in SMR during the
different seasons was invoked in different ways. In the spring
and summer, the animals in our study reduced their SMR by
80%–90% over the experimental run, but only roughly 20%–
30% of the total fall was due to the reduction in temperature;
70%–80% of the total fall occurred at constant temperature.
By autumn, the starting SMR on the first night at 25⬚C was
already reduced by 59%–81% (early and late autumn, respectively) from peak summer values, and now virtually all of the
fall (63%–83%) in metabolism over the experimental run was
due to the reduction in temperature; only 17%–37% of the
total fall occurred at constant temperature. The observation
that, by autumn, the temperature-independent reduction of
metabolism was already in place is consistent with several previous studies (Mayhew 1965; Abe 1983, 1993, 1995; de Souza
et al. 2004; Toledo et al. 2008). However, our data further
suggest that a metabolic decrease equivalent to that induced by
seasonal change can also occur in spring and summer if animals
are confined in the dark. It is not clear whether the seasonal
changes in metabolism and the temperature-independent
changes that can occur during the active season are induced
by similar mechanisms.
The cues that initiate entrance into dormancy or other states
of metabolic suppression in reptiles remain enigmatic (for reviews, see Gregory 1982; Christian et al. 1999). The mechanisms
that underlie seasonal metabolic suppression also remain elusive. Metabolic acclimation/acclimatization may occur at the
ultrastructural level (mitochondrial numbers or cristae density),
the transcriptional or translational level (production of metabolic enzymes), as well as the posttranslational level (allosteric
modulation of existing enzymes). Evidence for alterations at
each of these levels have been demonstrated (Crawford and
Powers 1992; Guderley and St. Pierre 2002; Seebacher et al.
2003). Perhaps most elusive of all, however, are the pathways
that connect the proximate factors inducing states of metabolic
suppression (whether they be environmental or endogenous)
to the ultimate factors altering metabolic flux (whether they be
mitochondrial or cellular) such that the activities of all cells in
the bodies of these animals are regulated in a coordinated
fashion.
Perspective
The picture that is emerging from this and other studies is that
for T. merianae, in spring and summer, the diel series of events
(changing temperature, photoperiod, etc.) elevates metabolism
at any constant temperature. As the autumn approaches, this
effect is reduced (by unknown mechanisms), leading to a seasonal depression of metabolism (inverse acclimatization). This,
combined with the fall in ambient and burrow temperatures,
leads to very low rates of oxygen consumption. This is also
accompanied by a progressive reduction in thermal sensitivity
(Q10) from summer to winter such that the metabolic rate of
dormant lizards becomes relatively temperature independent
(Abe 1983, 1993, 1995; de Souza et al. 2004). This suggests that
metabolism is suppressed to the same minimum level in winter,
regardless of the temperature, an observation that has also been
made on some species of hibernating mammals (echidna: Nicol
174 W. K. Milsom, D. V. Andrade, S. P. Brito, L. F. Toledo, T. Wang, and A. S. Abe
et al. 1992; arctic ground squirrel: Buck and Barnes 2000; marmot: Ortmann and Heldmaier 2000). This has been proposed
to have the selective advantage of maintaining extremely low
metabolic rates even when burrow temperatures rise slightly.
Thus, our data indicate that, by autumn, the metabolic rate
of the tegus is already depressed and the lizards are ready to
enter dormancy, where a further minor temperature-dependent
lowering of metabolism will occur. By the end of the autumn/
beginning of the winter, the final step in the suite of events
leading to dormancy is the behavioral decision to retreat into
the burrow, let body temperature equilibrate with the surroundings, and abandon the daily increases in body temperature associated with active thermoregulation.
Acknowledgments
This research was supported by grants from the Conselho Nacional de Desenvolvimento Cientı́fico e Tecnológico to A.S.A.
and D.V.A., from Fundação de Amparo a Pesquis do Estado
de São Paulo to D.V.A., and from the Natural Sciences and
Engineering Research Council of Canada to W.K.M.
Literature Cited
Abe A.S. 1983. Observations on dormancy in tegu lizards, Tupinambis teguixin (Reptilia, Teiidae). Naturalia 8:135–139.
———. 1993. Effect of the environment on ventilation in reptiles. Pp. 87–93 in J.E.P.W. Bicudo, ed. The Vertebrate Gas
Transport Cascade: Adaptations to Environment and Mode
of Life. CRC, Boca Raton, FL.
———. 1995. Estivation in South American amphibians and
reptiles. Braz J Med Biol Res 28:1241–1247.
Andrade D.V. and A.S. Abe. 1999. Gas exchange and ventilation
during dormancy in the tegu lizard, Tupinambis merianae. J
Exp Biol 202:3677–3685.
Andrade D.V., S.P. Brito, L.F. Toledo, and A.S. Abe. 2004. Seasonal changes in blood oxygen transport and acid-base status
in the tegu lizard, Tupinambis merianae. Respir Physiol Neurobiol 140:197–208.
Avila-Pires T.C. 1995. Lizards of Brazilian Amazonia (Reptilia:
Squamata). Zool Verh 299:1–706.
Bennett A.F. and W.R. Dawson. 1976. Metabolism. Pp. 127–
224 in C. Gans and W.R. Dawson, eds. Biology of the Reptilia.
Vol. 5. Academic Press, London.
Bickler P.E. and R.A. Anderson. 1986. Ventilation, gas exchange,
and aerobic scope in a small monitor lizard, Varanus gilleni.
Physiol Biochem Zool 59:76–83.
Buck C.L. and B.M. Barnes. 2000. Effects of ambient temperature on metabolic rate, respiratory quotient, and torpor in
an arctic hibernator. Am J Physiol 279:R255–R262.
Christian K.A., G.S. Bedford, and T.J. Schultz. 1999. Energetic
consequences of metabolic depression in tropical and temperate-zone lizards. Aust J Zool 47:133–141.
Crawford D.L. and D.A. Powers. 1992. Evolutionary adaptation
to different thermal environments via transcriptional regulation. Mol Biol Evol 9:806–813.
de Souza S.C.R., J.E. Carvalho, A.S. Abe, J.E.P.W. Bicudo, and
M.S.C. Bianconcini. 2004. Seasonal metabolic depression,
substrate utilization and changes in scaling patterns during
the first year cycle of tegu lizards (Tupinambis merianae). J
Exp Biol 207:307–318.
Gelineo S. 1967. Oxygen consumption in lizards on the way
to winter sleep. Bull Acad Serbe Sci 39:51–57.
Gregory P.T. 1982. Reptilian hibernation. Pp. 53–154 in. C.
Gans and F.H. Pough, eds. Biology of the Reptilia. Vol. 13.
Academic Press, London.
Guderley H. and J. St. Pierre. 2002. Going with the flow or life
in the fast lane: contrasting mitochondrial responses to thermal change. J Exp Biol 205:2237–2249.
Guppy M. and P. Withers. 1999. Metabolic depression in animals: physiological perspectives and biochemical generalizations. Biol Rev 74:1–40.
Hare K.M., S. Pledger, M.B. Thompson, J.H. Miller, and C.H.
Daugherty. 2004. Conditioning reduces metabolic rate and
time to steady-state in the lizard Naultinus manukanus (Reptilia: Gekkonidae). Comp Biochem Physiol A 139:245–250.
Hicks J.W. and M.L. Riedesel. 1983. Diurnal ventilatory patterns
in the garter snake, Thamnophis elegans. J Comp Physiol B
149:503–510.
Hopkins W.A., J.H. Roe, T. Philippi, and J.D. Congdon. 2004.
Standard and digestive metabolism in the banded water snake
Nerodia fasciata fasciata. Comp Biochem Physiol 137:141–
149.
Klein W., S.F. Perry, A.S. Abe, and D.V. Andrade. 2006. Metabolic response to feeding in Tupinambis merianae: circadian
rhythm and a possible respiratory constraint. Physiol
Biochem Zool 79:593–601.
Köhler G. and B. Langerwerf. 2000. Tejus: Lebensweise, Pflege,
Zucht. Herpton, Offenbach.
Kramer G. 1934. Der Ruheumsatz von Eidechsen und seine
quantitative Beziehung zur Individuengrosse. Z Vgl Physiol
20:600–616.
Lopes H.R. and A.S. Abe. 1999. Biologia reprodutiva e comportamento do teiú, Tupinambis merianae, em cativero (Reptilia, Teiidae). Pp. 259–272 in T.G. Fang, O.L. Montenegro,
and R.E. Bodmer, eds. Manejo y Conservación de Fauna
Silvestre en América Latina. Editorial Instituto e Ecologı́a,
La Paz, Bolivia.
Lutterschmidt D.I., W.I. Lutterschmidt, and V.H. Hutchison.
2003. Melatonin and thermoregulation in ectothermic vertebrates: a review. Can J Zool 81:1–13.
Manzani P.R. and A.S. Abe. 2002. A new species of Tupinambis
Daudin, 1803 from southeastern Brazil (Squamata, Teiidae).
Arq Mus Nac Rio J 60:295–302.
Mautz W.J. and T.J. Case. 1974. A diurnal activity cycle in the
granite night lizard, Xantusia henshawi. Copeia 1974:243–
251.
Mayhew W.W. 1965. Hibernation in the horned lizard, Phrynosoma m’calli. Comp Biochem Physiol 16:103–119.
Daily and Seasonal Metabolic Depression in Tegu Lizards 175
Menaker M. and S. Wisner. 1983. Temperature-compensated
circadian clock in the pineal of Anolis. Proc Natl Acad Sci
USA 80:6119–6121.
Moberly W.R. 1963. Hibernation in the desert iguana, Dipsosaurus dorsalis. Physiol Zool 36:152–160.
Nicol S., N.A. Andersen, and U. Mesch. 1992. Metabolic rate
and ventilatory pattern in the echidna during hibernation
and arousal. Pp. 150–159 in M.L. Augee, ed. Platypus and
Echidnas. Royal Zoological Society of New South Wales,
Sydney.
Ortmann S. and G. Heldmaier. 2000. Regulation of body temperature and energy requirements of hibernating Alpine marmots (Marmota marmota). Am J Physiol 278:R698–R704.
Patterson J.W. and P.M.C. Davies. 1978. Energy expenditure
and metabolic adaptation during winter dormancy in the
lizard, Lacerta vivpara Jacquin. J Thermal Biol 3:183–186.
Ragland I.M., L.C. Wit, and J.C. Sellers. 1981. Temperature
acclimation in the lizards Cnemidophorus sexlineatus and
Anolis carolinensis. Comp Biochem Physiol 70A:33–36.
Rismiller P.D. and G. Heldmaier. 1991. Seasonal changes in
daily metabolic patterns of Lacerta viridis. J Comp Physiol
B 161:482–488.
Roberts L.A. 1968. Oxygen consumption in the lizard Uta stansburiana. Ecology 49:809–819.
Seebacher F., H. Guderley, R.M. Elsey, and P.L. Trosclair III.
2003. Seasonal acclimatisation of muscle metabolic enzymes
in a reptile. J Exp Biol 206:1193–1200.
Snyder G.K. 1975. Respiratory metabolism and evaporative wa-
ter loss in a small tropical lizard. J Comp Physiol 104:13–
18.
Songdahl J.H. and V.H. Hutchison. 1972. The effect of photoperiod, parietalectomy and eye enucleation on oxygen consumption in the blue granite lizard, Sceloporus cyanogenys.
Herpetologica 28:148–156.
Toledo L.F., S.P. Brito, W.K. Milsom, A.S. Abe, and D.V. Andrade. 2008. Effects of season, temperature, and body mass
on the standard metabolic rate of tegu lizards (Tupinambis
merianae). Physiol Biochem Zool 81:158–164.
Tosini G. and M. Menaker. 1996. The pineal complex and melatonin affect the expression of daily rhythm of behavioural
thermoregulation in the green iguana. J Comp Physiol A
179:135–142.
Underwood H. 1992. Endogenous rhythms. Pp. 229–298 in C.
Gans and D. Crews, eds. Biology of the Reptilia. Vol. 18.
University of Chicago Press, Chicago.
Vanzolini P.E., A.M.M. Ramos-Costa, and L.J. Vitt. 1980. Répteis das Caatingas. Academia Brasileira de Ciências, Rio de
Janeiro.
Weigmann R. 1932. Jahrescyklische Veränderungen im Funktionszustand der Schilddrüse und im Stoffumsatz von Lacerta
vivipara Jacq. Z Wiss Zool 142:491–509.
Zari T.A. 1996. Seasonal acclimatization in resting metabolism
of the Turkish gecko, Hemidactylus turcicus, in Jeddah, Saudi
Arabia. Jap J Herpetol 16:129–133.
———. 1999. Seasonal acclimatization in metabolic rate of the
fan-fingered gecko, Ptyodactylus hasselquistii (Reptilia: Gekkonidae). J Therm Biol 24:137–142.
Download