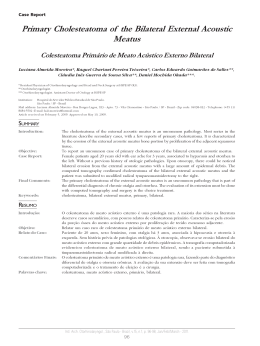
Original Article
Study of the Audio Logical’ Profile of Individuals
Attended in a Brazilian Diagnostic Service
Estudo do Perfil Audiológico de Indivíduos Atendidos em um Serviço de
Diagnóstico Brasileiro
Isabela de Souza Jardim*, Juliana Harumi Iwahashi**, Valéria de Campos Paula***.
* PhD in Science by the University of São Paulo’s Medicine School. Speech therapy.
** Speech therapist with Improvement in Cochlear Implant by the Hospital das Clínicas of the University of São Paulo’s Medicine School.
*** Student of the Advance Course of Clinic Audiology at Hospital das Clínicas of the University of São Paulo’s Medicine School.
Instituition:
Center of Audiology São Paulo.
São Paulo / SP - Brazil.
Mail Adress: Isabela de Souza Jardim - 352, Teodoro Sampaio, St. Cj 151 -São Paulo /SP - Brazil - ZIP: 05406-000 - Phone: (+55 51) 3062-9328 - E-mail: [email protected]
Article received on 11 December 2009. Approved on 24 January 2010.
SUMMARY
Introduction:
Objective:
Method:
Results:
Conclusion:
Keywords:
Hearing loss can affect the health and quality of life of the individual. The finding of the audio logical
profile becomes important epidemiological tool for the explanation of new health policies, effective
prevention measures, aid in medical diagnosis and improvement of techniques for the auditory
rehabilitation.
To evaluate the audio logical profile of the individuals treated in a service of audio logical diagnosis
describing the age, gender, chief complaints and to characterize the audiometric thresholds of individuals
second degree, type and configuration.
A retrospective study, through analysis of medical records of 217 individuals of both genders in the
private sector attended in a Brazilian service of diagnostic audiology between January and June 2009.
For the study were analyzed the complaints following the evaluation of tonal audiometry.
The main complaints were 110 (50.7%) individuals reported tinnitus, 48 (22.1%) dizziness, and 116
(53.4%) dysacusis. The audio logical profile of the individuals was characterized by 36.4% of individuals
with normal hearing, 45.6% with dysacusis bilateral and unilateral 18%. When considering both groups
with dysacusis there was predominance of the sensory neuro type and of mild grade.
The main complaints founded were tinnitus, dizziness, and dysacusis. The Audiometry showed the
predominance of bilateral dysacusis of type sensory neuro and of mild grade for the study constituted
by adults and seniors individuals attended in the sector.
hearing loss, tinnitus, dizziness, hearing, diagnosis.
RESUMO
Introdução:
Objetivo:
Método:
Resultados:
Conclusão:
Palavras-chave:
A perda auditiva pode afetar a saúde e qualidade de vida do indivíduo. O levantamento do perfil
audiológico torna-se importante ferramenta epidemiológica para a definição de novas políticas de
saúde, medidas efetivas de prevenção, auxílio no diagnóstico médico e o aprimoramento de técnicas
para a reabilitação auditiva.
Avaliar o perfil audiológico dos indivíduos atendidos em um serviço de diagnóstico audiológico
descrevendo a idade, sexo, principais queixas além de caracterizar os limiares audiométricos dos
indivíduos segundo grau, tipo e configuração.
Estudo retrospectivo, por meio de análise de prontuários de 217 indivíduos, ambos os sexos, atendidos
no setor privado de um serviço de diagnóstico audiológico brasileiro entre janeiro e junho de 2009.
Para o estudo foram analisadas as queixas seguindo da avaliação da audiometria tonal.
As principais queixas apresentadas foram: 110 (50,7%) indivíduos relataram zumbido, 48 (22,1%) tontura
e 116 (53,4%) disacusia. O perfil audiológico dos indivíduos foi caracterizado por: 36,4% de indivíduos
com audição normal, 45,6% com Disacusia bilateral e 18% unilateral. Ao considerar ambos os grupos
com disacusia, houve predomínio do tipo neurossensorial e do grau leve.
As principais queixas encontradas foram zumbido, tontura e disacusia. A Audiometria demonstrou
predomínio de disacusia bilateral, tipo neurossensorial e de grau leve para o estudo formado por
indivíduos adultos e idosos atendidos no setor.
perda auditiva, zumbido, tontura, audição, diagnóstico.
Intl. Arch. Otorhinolaryngol., São Paulo - Brazil, v.14, n.1, p. 32-37, Jan/Feb/March - 2010.
32
Study of the audio logical’ profile of individuals attended in a brazilian diagnostic service.
INTRODUCTION
According to the estimative of the World Health
Organization, about 25 millions of the individuals or 4, 7%
of the global population presents hearing loss (1). The
hearing loss can be recognized already in a child’ birth or
to be acquired during the life. However, several of these
occurrences can be avoided or softened through preventive
actions and health promotion (2).
In Brazil, that is considered an emergent country, it
is observed a gradual increase with the expectative of
individuals’ life and consequently the population aging (3,
4). Actually, the life expectative in our country is 72,7
years, according to the Social Indicators Synthesis’ data,
exposed by Brazilian Institute of Geography and Statistic
(5). A phenomenon that results in changes on the population
profile, and chronic degenerative diseases of the aging get
an emphasis as cardio vascular alterations, diabetes, and
hearing loss (2, 3).
The presbycusis as a biological phenomenon that
nobody can escape, normally it begins from 20/30 years old
and it can render socially uncomfortable about 40/50 years, it
is the third affection more common in senior individuals (6, 7).
The auditory system is one of the most important to
the development of the process and maintenance of the
oral communication and of the quality of life. A failure in this
system incites damages and a weak hearing loss can bring
problems in the communication (8). Therefore, an audiology
diagnosis concomitant to the premature intervention in the
dysacusis cases is fundamental to soften such derangements.
In this way, the survey audiological profile becomes
an important epidemiological tool to the definition of news
health politics, effective measures of prevention, medical
diagnosis assistance and consequently technical’ upgrading
to the auditory rehabilitation (9, 10).
This work aimed evaluate the audiological profile of
the individuals treated in a private service of audiological
diagnosis describing the age, gender, main complaints and
to characterize the audiometric thresholds of individuals
second degree, type and configuration.
Jardim et al.
In this study were not included the enchiridion of
individuals with intellectual disability or associates
syndromes.
Procedures
The following audiological enchiridion data were
collected:
1. Age; sex; Tinnitus complaint, dizziness, or dysacusis
collected of the initial interview.
2. Auditory thresholds by aerial via of the frequencies of the
250; 500; 1000; 2000; 3000; 4000; 6000 and 8000 Hz.
3. Auditory thresholds by osseous via, for research of the
frequencies of the 500; 1000; 2000; 3000; 4000 Hz.
The auditory thresholds researched was performed
in a cabin treated acoustically using the Itera II Audiometer
of the GN Otometrics mark with headphones TDH-39
model calibrated in 1 September 2008.
The SILMAN & SILVERMAN’S classification was considered
for the analysis of hearing loss type (1997).
In order to the auditory’ classification the Biap
(1997) table was used, in which it considers the aerial via
auditory thresholds average for pure tones of the frequencies
of 500, 1.000, 2.000 and 4.000 Hz, adapted with a
denomination utilized by LLOYD and KAPLAN (1978).
The thresholds’ configuration for hearing loss was
based in the audiometric configuration (SILMAN and SILVERMAN,
1997 - adapted of Carhart, 1945 and LLOYD and KAPLAN
1978) categorizing it in: an ascendant, a horizontal, a
descendant: a weak, an accentuated or in a ramp, “U,” an
upside down “U” or Notch.
Statistical Analysis
The qualitative variables related to the sample
characterization, complaints were estimated through de
percentage of occurrence of its categories, and the
confidence intermissions constituted in 95% (11). The age
and the sex were calculated by descriptive statistics with
confidence intermissions to the average. In the bilateral
dysacusis group was utilized the kappa statistic in order to
evaluate the results’ concordance of the two ears (12).
METHOD
The enchiridion data of 217 individuals were collected
of both sexes treated in the private sector of the Audiology
Center in São Paulo city, in the period between January and
June 2009, before to be conducted by an
otorhinolaryngologist doctor.
RESULTS
Between January and June 2009 were evaluated
217 (100%) adults and seniors individuals being 94 (43,3%)
of the male sex and 123 (56,7%) of the female sex with the
Intl. Arch. Otorhinolaryngol., São Paulo - Brazil, v.14, n.1, p. 32-37, Jan/Feb/March - 2010.
33
Study of the audio logical’ profile of individuals attended in a brazilian diagnostic service.
Jardim et al.
Table 1. Frequencies and percentages of the configuration
in the Normal group.
Configuration
N
%
N-ALT in one ear
15
19,0
N-ALT in both ears
37
46,8
Normal in both ear.
27
34,2
Total
79
100,0
Figure 1. Audiological profile analysis considering the auditory
thresholds percentage within the normality, with unilateral
and bilateral dysacusis - Percentage.
Table 2. Frequencies and percentages of type of dysacusis
in the unilateral group.
Type
N
%
Conductive
4
10,3
Mixed
7
17,9
Neurosensory
28
71,8
Total
39
100
age average of 54,3 years (a pattern deviation of 17,8
years; minimum of 18 and maximum of 103).
Presented complaints analysis
In the attended individuals enchiridion were noticed
the presence of one or more complaints being the mains
noticed in 110 (50,7%) individuals that presented Tinnitus
complaint, 48 (22,1%) of dizziness and 116 (53,4%) with
dysacusis.
Audiological profile analysis
By considering the analysis of the hearing degree of
the studied individuals, taking into account the Biap (1997)
classification adapted of LLOYD & KAPLAN (1978), it was
noticed that 79 (36,4%) individuals presented the average
of the auditory thresholds within the normality. Of these
individuals, 39 (18%) obtained unilateral dysacusis and 99
(45,6%) bilateral dysacusis, according to the represented
values in the Figure 1.
In the unilateral and bilateral dysacusis group were
analyzed the type, degree and the audiometric configuration.
This study analyzed the audiometric configuration
of the Normal group, in order to verify possible auditory
alterations in the adjacent frequencies to the average
formers frequencies.
Analysis of the group with auditory
thresholds within the normality.
The auditory thresholds’ configuration of the nor-
mal group was evaluated due to some individuals
presenting the average of the auditory thresholds within
the normality (auditory thresholds average of the
frequencies of 500, 1.000, 2.000, and 4.000Hz) and
unsettled thresholds in one or more frequencies evaluated.
For the study, it was utilized the “N-ALT” criteria, in other
words, normal without alteration, grouping the
configurations found as an ascendant, weak descendant,
an accentuated descendant in a ramp, notch, in “U” and
in upside down “U”.
The analysis considered N-ALT in one ear, N-ALT
in both ears or normal in both ears, in other words, the
auditory thresholds tested within the normality (Table
1).
Analysis of the group with unilateral
dysacusis
The frequencies and percentages were presented
considering the analysis separated of type and dysacusis
degree. In this study, it was noticed the presence of the
alteration, however without assign which is the affected ear.
Concerning the dysacusis type, 4 (10,3%) individuals
presented a Conductive, 7 (17,9%) a Mixed and, 28
(71,8%) a Neurosensory (Table 2).
Among the individuals with dysacusis, 20 (51,3%) of
them presented a weak degree, 6 a moderate, 2(5,1%) a
moderately severe , 5(12,8%) a severe and, 6 (15,4%) with
an intense degree.
The auditory thresholds’ configuration was observed
Intl. Arch. Otorhinolaryngol., São Paulo - Brazil, v.14, n.1, p. 32-37, Jan/Feb/March - 2010.
34
Study of the audio logical’ profile of individuals attended in a brazilian diagnostic service.
Jardim et al.
Table 3. Frequencies and percentages of the Configuration in the right and left ears in the unilateral group.
Left ear
Right ear
A
DA
DL
DR
E
H
N-ALT Normal
Total
A
1
1
2
4
2,6%
2,6%
5,1%
10,3%
DA
1
1
2
3
7
2,6%
2,6%
5,1%
7,7%
17,9%
DL
1
1
2
2,6%
2,6%
5,1%
DR
1
2
3
6
2,6%
5,1%
7,7%
15,4%
E
1
1
1
3
2,6%
2,6%
2,6%
7,7%
H
1
1
2,6%
2,6%
U
1
1
2,6%
2,6%
X
1
1
2,6%
2,6%
N-ALT
1
2
1
2
1
1
2
10
2,6%
5,1%
2,6%
5,1%
2,6%
2,6%
5,1%
25,6%
Normal
1
3
4
2,6%
7,7%
10,3%
Total
1
4
1
8
3
3
7
12
39
2,6%
10,3%
2,6%
20,5%
7,7%
7,7%
17,9%
30,8% 100,0%
in both ears and the frequency and percentage of the data
interlacement presented in both ears can be noticed in the
Table 3.
Analysis of the group with bilateral
dysacusis.
The distribution of the type, degree, and auditory
thresholds configuration considered the found results in
both ears.
The distribution of the dysacusis type in the bilateral
group in the right and lest ears demonstrated the possibility
of the individuals presented identical types or different
between the ears, as a example, 5 (5.1%) of the individuals
have conductive type dysacusis in both ears. Three (3%)
have a conductive in the right ear and mixed in the left and,
3 (3%) have a conductive type in the right ear and
Neurosensory in the left. The observed value of the kappa
statistic was 0,49 (standard error=0,07), considering a
moderate concordance of the findings of the measures in
both ears (Table 4).
The bilateral dysacusis degree was interpreted
likewise the type, however the kappa statistic value was
Table 4. Frequencies and percentages of Type of Dysacusis
in the bilateral group in the left and right ears.
Left ear.
Left ear.
Conductive Mixed Neurosensory Total
Conductive
5
3
3
11
5,1%
3,0%
3,0%
11,1%
Mixed
7
4
1
12
7,1%
4,0%
1,0%
12,1%
Neurosensory
1
5
70
76
1,0%
5,1%
70,7%
76,8%
Total
13
12
74
99
13,1%
12,1%
74,7%
100,0%
0,38 (standard error of 0,06) pointing out a concordance
almost moderate (Table 5).
In the thresholds’ configuration analysis to the
category of bilateral dysacusis, in the kappa statistic
calculation were gathered the categories related to the
descendant configuration (weak descendant, accentuated
and in a ramp) and the “U” configuration (in “U” and in
upside down “U”). Therefore, it is find the kappa statistic
value equal to 0,03 (standard error=0,10) that indicates
weak concordance between the results in both ears (Table
6).
Intl. Arch. Otorhinolaryngol., São Paulo - Brazil, v.14, n.1, p. 32-37, Jan/Feb/March - 2010.
35
Study of the audio logical’ profile of individuals attended in a brazilian diagnostic service.
Jardim et al.
Table 5. Frequencies and percentages of the dysacusis degree in the bilateral group in the right and left ears.
Right ear
Right ear
Weak
Moderate
Moderately
Acute
Severe
Total
Severe
Weak
26
4
1
4
1
36
26,3%
4,0%
1,0%
4,0%
1,0%
36,4%
Moderate
5
16
6
1
28
5,1%
16,2%
6,1%
1,0%
28,3%
Moderately severe
2
3
3
1
9
2,0%
3,0%
3,0%
1,0%
9,1%
Severe
1
2
2
2
6
13
1,0%
2,0%
2,0%
2,0%
6,1%
13,1%
Acute
3
4
2
2
2
13
3,0%
4,0%
2,0%
2,0%
2,0%
13,1%
Total
37
29
14
10
9
99
37,4%
29,3%
14,1%
10,1%
9,1%
100,0%
Table 6. Frequencies and percentages of the configuration in the bilateral group in the right and left ears.
Left ear
Left ear.
A
DA
DL
DR
E
H
UI
Total
A
5
2
1
1
9
5,1%
2,0%
1,0%
1,0%
9,1%
DA
1
19
5
5
2
2
34
1,0%
19,2%
5,1%
5,1%
2,0%
2,0%
34,3%
DL
1
1
2
2
2
8
1,0%
1,0%
2,0%
2,0%
2,0%
8,1%
DR
8
5
21
1
35
8,1%
5,1%
21,2%
1,0%
35,4%
E
1
1
2
1,0%
1,0%
2,0%
H
2
2
3
7
2,0%
2,0%
3,0%
7,1%
U
1
1
1,0%
1,0%
UI
1
1
1
3
1,0%
1,0%
1,0%
3,0%
Total
7
34
14
32
5
5
2
99
7,1%
34,3%
14,1%
32,3%
5,1%
5,1%
2,0%
100,0%
DISCUSSION
The present study noticed the female sex
predominance in the studied sample, affording to consider
that possibly the women presented major availability to
search medical assistance (13) or major interest in the
treatment (15). However, this data becomes insufficient to
characterize the hearing loss prevalence.
Despite several studies point the impact originated
of the hearing loss in the quality of life there is a larger
diversity in the prevalence findings of the hearing loss in
adult individuals by considering the variables of age, race,
exposition to noises and also diseases associated or tabagism
(1,2,3,4,5,6,7, and 8) in the studied groups.
This study does not reflect the general population
prevalence once it was characterized the audiological
profile only of the patients that looked for medical
evaluation, and needed it audition evaluation.
Patients that looked for an exams service and
audiological diagnosis, frequently presented other otological
Intl. Arch. Otorhinolaryngol., São Paulo - Brazil, v.14, n.1, p. 32-37, Jan/Feb/March - 2010.
36
Study of the audio logical’ profile of individuals attended in a brazilian diagnostic service.
complaints associated to the complaint of dysacusis as
Tinnitus (13,15), dizziness (14,15) and visual alteration
(15). Our study noticed like the main complaints, initially
dysacusis followed by Tinnitus and dizziness.
Despite not to be main complaints, in our study we
have noticed anxiety complaints, hypertension, or diabetes mellitus as factors that induced the individuals to do
audiological evaluation.
BARROS et al. (13) related a major number of cases
with neurosensory hearing loss and with a weak degree in
bilateral alterations. In the research, there was convergence
of the results finding a major number of individuals with a
neurosensory type dysacusis and weak degree (13, 16) to
the bilateral group, with the study cited previously, as well
as to the group with unilateral dysacusis.
In the auditory thresholds’ individuals’ group within
the normality, 19% of the individuals presented unilateral
alteration in high frequencies and 46% bilateral alterations
in high frequencies according to the AGRAWAL et al (8) study
that describes to have found bilateral alteration
predominance in high frequencies.
With the present study, by considering only the
auditory thresholds average of 500, 1000, 2000, and 4000
Hz within the auditory thresholds of normality for intensity
equals or below to 25dBNA, it faced the risk of detection
loss of a subgroup of individuals with alteration in high
frequencies. Therefore, it is proposed the need of
observation of frequencies adjacent in the young adults
individuals’ exams for a effective prevention.
CONCLUSION
The study noticed that the first auditory complaints
pointed by individuals were dysacusis, following by Tinnitus
and dizziness. The audiological profile of the individuals
was characterized for: 36,4% of individuals with normal
hearing, 45,6% with bilateral dysacusis and 18% unilateral.
By considering both groups, there was the type
neurosensory predominance of weak degree.
Jardim et al.
3. Marques ACO, Koslowski L, Marques JM. Reabilitação no
idoso. Rev Bras Otorrinolaringol. 2004, 70(1):806-11.
4. Teixeira AR, Almeida LG, Jotd GP, De Barba MC. Qualidade
de vida de adultos e idosos pós- adaptação de próteses
auditivas. Rev Soc Bras Fonoaudiol. 2008, 13(4):357-61.
5.Instituto brasileiro de Geografia e Estatística. Indicadores.
2008. Disponível em: http://www.ibge.gov.br/home/
estatistica/populacao/condicaodevida/ indicadoresminimos
/sinteseindicsociais2008/default.shtm.
6.Bilton T, Ramos LR, Ebel S, Teixeira LS, Tega LP. Prevalência
da deficiência auditiva em uma população idosa. O mundo
da saúde. 1997, 21(4):218-25.
7. Portmann M, Portmann C. Tratado de Audiometria Clínica.
6ª ed. São Paulo: Roca; 1993.
8. Agrawal Y, Platz EA, Niparko JK. Prevalence of hearing
loss and differences by demographic characteristics among
US adults. Arch Intern Med. 2008, 168(14):1522-30.
9. Lima-Costa MF, Veras R. Saúde pública e envelhecimento.
Cad Saúde Pública. 2003, 19(3):700-1.
10. Lima e Costa MFF, Guerra HL, Barreto SM, Guimarães
RM. Diagnóstico da situação de saúde da população idosa
brasileira: um estudo da mortalidade e das internações
hospitalares públicas. Inf Epidemiol Sus. 2000, 9(1):43-50.
11 Bussab WO, Morettin PA. Estatística Básica, 5a ed. São
Paulo: Editora Saraiva; 2002.
12. Sim J, Wright CC. The Kappa Statistic in Reliability
Studies: Use, Interpretation and Sample Size Requirements.
Physical Therapy. 2005, 85(3):257-68.
13. Coelho CCB, Sanchez TG, Bento RF. Características do
zumbido em pacientes atendidos em serviço de referência.
Arq Int Otorrinolaringol. 2004, 8(3):216- 24.
14. Moreira DA, Bohlsen YA, Momenshon-Santos TM,
Cherubini AA. Estudo do Handicap em pacientes com queixa
de Tontura, associada ou não ao sintoma de Zumbido. Arq
Int Otorrinoringol. 2006, 10(4):270-7.
BIBLIOGRAPHICAL REFERENCES
1. Mathers CD, Smith A, Concha M. Global Burden of hearing
loss in the year 2000.2000. Disponível em: www.who.int/
entity/healthinfo/statistics/ bod_hearingloss.pdf.
15. Morimoto WTM, Medina NH, Guardado NA, Lima MHA,
Pinto AMM, Magnunsson IM. Avaliação visual e auditiva em
adultos e idosos na atenção básica. 2006. Disponível em:
http://www.cve.saude.sp.gov.br/agencia/bepa30_aval.htm.
2.Brasil. Ministério da Saúde. Prevalência da perda auditiva.
Disponível em: portal.saude.gov.br/portal/arquivos/pdf/
manual2.pdf.
16. Mattos LC, Veras RP. A prevalência da perda auditiva em
uma população de idosos da cidade do Rio de Janeiro: um
estudo seccional. Rev Bras Otorrinolaringol. 2007, 73(5):654-9.
Intl. Arch. Otorhinolaryngol., São Paulo - Brazil, v.14, n.1, p. 32-37, Jan/Feb/March - 2010.
37
Download