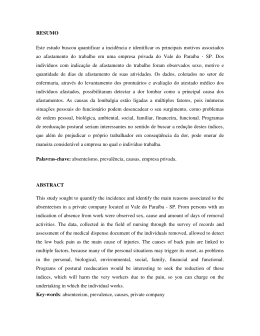
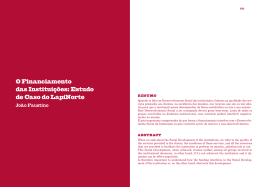
XXXIII ENCONTRO NACIONAL DE ENGENHARIA DE PRODUCAO
A Gestão dos Processos de Produção e as Parcerias Globais para o Desenvolvimento Sustentável dos Sistemas Produtivos
Salvador, BA, Brasil, 08 a 11 de outubro de 2013.
SIMULATION MODELING FOR STAFF
OPTIMIZATION OF A COMMUNITY
CARE CENTRE IN THE CITY OF
TORONTO
DEYVISON TALMO BAIA MEDEIROS (UEPA )
[email protected]
Aline Neves Alencar (UEPA )
[email protected]
Emily Rose Hurren (UofT )
[email protected]
In order to deliver a better service to its clients, a Community Care Centre
in the city of Toronto has the goal of increasing the capacity of its internal
call center in a way that it will be able to handle 100% of the calls that is
currenntly being received. Based on that, this paper will provide some
analysis and information that aims to help the Community Care Centre
achieve its goal. First, supported by a simulation model basically
developed in Excel, this paper will determine the number of staffs required
to meet 100% of the actual amount of calls. Second, it will present a brief
analysis of the consequences (advantages/disadvantages) of the current
goal of answering 100% of calls. Finally, this paper also covers an
alternative way for increasing the live answer rate of the call center which
is to implement a work at home system.
Palavras-chaves: Call center, Community Care Centre, Simulation, Call
answer rate, Microsoft Excel
XXXIII ENCONTRO NACIONAL DE ENGENHARIA DE PRODUCAO
A Gestão dos Processos de Produção e as Parcerias Globais para o Desenvolvimento Sustentável dos Sistemas Produtivos
Salvador, BA, Brasil, 08 a 11 de outubro de 2013.
1.
Introduction
The object of this study is a Community Care Centre (CCC) located in Toronto, ON, Canada,
which is responsible for working with people of various ages to ensure their safety and comfort at
home and to assist with their long-term care planning. The 2010-2011 Quality Report provided
by the organization recognized that in Ontario approximately 10,000 more clients were supported
each month on average compared to the previous year, predicting a large increase in the number
of clients that they will assist in future years. As the number of clients that require support
grows, the Community Care Centre must adapt to ensure that the call centre continues to provide
quality service to all clients who calls in requiring assistance. One important aspect of quality
service that the organization has recognized is having 100% live answer for urgent incoming
calls. On average, 58 urgent calls are received per day, with a current answer rate which
fluctuates throughout the day, but averages to almost 80%.
When generating solutions to help CCC, a scope was defined to ensure the quality that UCC
Workers provide does not deteriorate. Therefore, the solutions focus on increasing productivity
and finding the optimal staffing required to answer 100% of the calls rather than reducing the
time for handling calls, documentation or follow-up. Furthermore, due to the lack of data
available for referrals and notifications the solution is directed only towards the calls aspect of the
centre.
The first solution examines the situation using a simulation model. The data provided by the CCC
was analyzed to determine the arrival rate of calls, average call duration, and the number of
employees required to reach the target service level of 100%.
Additionally, it has been shown in several studies, most notably studies by Stanford University,
Telus and Workopolis, that working from home increases productivity, as well as the employee
morale and satisfaction. Based on these results, the second solution involves implementing a
Work at Home system, since the current technology allows an employee from a call centre to
answer calls exactly as if they are physically in the call
1
XXXIII ENCONTRO NACIONAL DE ENGENHARIA DE PRODUCAO
A Gestão dos Processos de Produção e as Parcerias Globais para o Desenvolvimento Sustentável dos Sistemas Produtivos
Salvador, BA, Brasil, 08 a 11 de outubro de 2013.
2.
Background and current situation
The Community Care Centre (CCC) currently operates with 19 full time staff, who work 35
hours a week, and 5 part time staff, who work 15 hours a week. For the majority of weekdays
from 8:30am to 4:30pm there is an average of 13 Urgent Care Coordinators (UCC). Further, it is
the Triager’s responsibility to create the schedule for the following day and divide the staff to
meet the different roles. One person is always required at the Medical Supply Desk, and two are
required for Urgent Task Notifications. The remaining ten UCC workers are assigned to Calls
and Referrals based on demand for the day, with an average of 4-6 workers on calls at any given
time during daytime hours. During evening hours and weekends 2-3 UCC Workers are assigned
to answer calls. Note that, once the schedule is made the Triager emails a copy to the UCC Team
and only minor changes are made the next day based on any staff changes. Urgent Care
Coordinators are trained in all positions and are able to move from on role to another based on
demand.
Figure 1- Flow of calls at the Community Care Centre
Source: Data collection (2013)
The current flow of the call is modeled in Figure 1. First the Information and Referral Team
assess the call to determine if it requires urgent assistance from an Urgent Care Coordinator. If
the call is deemed urgent, the UCC will live answer the call, if available. Otherwise the call is
2
XXXIII ENCONTRO NACIONAL DE ENGENHARIA DE PRODUCAO
A Gestão dos Processos de Produção e as Parcerias Globais para o Desenvolvimento Sustentável dos Sistemas Produtivos
Salvador, BA, Brasil, 08 a 11 de outubro de 2013.
placed in a queue and will be answered once a UCC Worker becomes available. During the wait
time the call may either be switched to voicemail or dropped.
The “CCC” received 21,389 calls in 2012 from people who needed assistance with long term care
planning. The live answer was identified as an important aspect of quality, and have a current
answer rate of 79.9%. However, they are currently operating at a 42.6% service level with a
target time of 30 seconds. The current handling time for a call is 04:38 (mm:ss), but time is also
required for the documentation and follow up to ensure the client’s needs are met. Also, the
average wait time before switching to voicemail was 03:29 (mm:ss)
From the data provided by the CCC it is clear that there is a higher call volume from 10:00 to
11:00 AM and from 1:30 to 3:00 PM, leading to a higher number of abandoned calls during those
times. In addition, there is a spike in the call volume on Fridays, which can be attributed to the
fact that hospitals are looking to discharge patients before the weekend. Furthermore, almost
50% of dropped calls occur during times when employees are on lunch or a break.
3.
Problem definition
3.1.
Data analysis
Based on the data that was available it was possible to make several inferences about the current
operations of the call centre.
Figure 2 – Calls offered vs. calls missed by time of day in 2012
3
XXXIII ENCONTRO NACIONAL DE ENGENHARIA DE PRODUCAO
A Gestão dos Processos de Produção e as Parcerias Globais para o Desenvolvimento Sustentável dos Sistemas Produtivos
Salvador, BA, Brasil, 08 a 11 de outubro de 2013.
Source: Data Collection (2013)
Figure 2 shows the total number of calls offered which amounts to 21,389 calls annually, and the
number of calls that were handled by the UCC team which came to be 17,080 calls. The blue area
represents the calls missed based on the time of day, which makes up 4,309 calls in total thus
resulting in a 79.9% answer rate. The UCC team receives a very high volume of calls from 10:00
to 11:00 AM and then again from 1:30 to 3:00 PM and it is during this time period that most calls
are abandoned. On the other hand, the call volume is relatively low at the start of each day from
8:00 to 8:30 AM and after 5:00 PM it starts to decrease again. This trend remains the same on
weekdays for all months.
Figure 3 - Calls offerred by day of week in 2012
Figure 2 – Calls Offered by day of week
Source: Data Collection (2013)
Figure 3 displays a repetitive trend that occurs each day of the week. It is clear that there is a
spike in the call volume on Fridays, which can be attributed to the fact that hospitals are looking
to discharge most of their patients before the weekend, who will then require the assistance of the
CCC. As a result, the call volume decreases over the weekend and then gradually increases
through the week.
3.2. Follow-up and documentation analysis
Further data provided by CCC gives an insight on the follow-up calls required and the
documentation process. Currently, the average handling time for a call is approximately 04:38
4
XXXIII ENCONTRO NACIONAL DE ENGENHARIA DE PRODUCAO
A Gestão dos Processos de Produção e as Parcerias Globais para o Desenvolvimento Sustentável dos Sistemas Produtivos
Salvador, BA, Brasil, 08 a 11 de outubro de 2013.
(mm:ss). However, a call can be classified as one of two types. Table 1 below shows the average
times for each type of call.
Table 1 - Average time per type of call (seconds)
Average Handling
Average
Documentation
Average Followup
Average Total
Call Type A
(45.7%)
278
500.2285
-
780.5016
Call Type B
(54.3%)
-
500.2285
507.4286
1007.657
Source: Data Collection (2013)
Call type A consists of a simple phone call followed by a documentation process. Call type B
requires a follow-up call that includes the initial call plus the documentation process which
increases the average total time to handle one client. Based on the data available for the week of
Jan 11 to Jan 17 it was inferred that 54.3% of the calls require follow up annually. This additional
factor significantly impacts the problem since not all follow-ups are answered on the first attempt
resulting in a phone tag situation which results in waste through an inefficient use of time.
3.2.
Shift scheduling
The organization of resources during the day plays a major role in optimizing the percent of calls
answered. Figure 4 shows the number of calls that are missed annually based on every half hour.
The yellow bars represent the number of calls missed during which employees are allowed to
take their 30 minute breaks as well as 60 minute lunch breaks. 2,143 calls are missed during
which employees can take a break. This number makes up 49.7% of the total calls missed
annually.
5
XXXIII ENCONTRO NACIONAL DE ENGENHARIA DE PRODUCAO
A Gestão dos Processos de Produção e as Parcerias Globais para o Desenvolvimento Sustentável dos Sistemas Produtivos
Salvador, BA, Brasil, 08 a 11 de outubro de 2013.
Figure 4 - Calls missed by time of the day in 2012
Source: Data Collection (2013)
4.
Scope
The objective of this report is to propose a solution that will increase the percent of calls
answered from 79.9% to a 100%. The major components of a single call include: call handle
time, documentation process, and follow-up calls. Since all these components are extremely
important to the quality of the service provided by the organization, the goal of the solution that
will be presented is not to reduce the time for each activity. Instead, the solution focuses on
finding the optimal staffing required to answer 100% of the calls. However, due to the lack of
data available for referrals and notifications the solution is directed only towards the calls aspect
of the centre. The result is based on the current average times for handling calls and the weekly
data provided for documentation and follow-up calls.
5.
Solutions
This section will describe the recommended alternative solutions for achieving 100% of calls
answered based on the previous analysis provided in this report.
5.1.
Solution 1: excel model
In recent times the use of simulations has become very popular in the call center industry. This is
due to the fact that call centers are very complex and simulation is a way to model this real world
process without impacting the current operations (HALL, Bill; ANTON, Jon, 1998). This method
6
XXXIII ENCONTRO NACIONAL DE ENGENHARIA DE PRODUCAO
A Gestão dos Processos de Produção e as Parcerias Globais para o Desenvolvimento Sustentável dos Sistemas Produtivos
Salvador, BA, Brasil, 08 a 11 de outubro de 2013.
works very well for this case since it can generate calls the way they actually arrive at the call
center, which can be sporadic. In a recent study, a Hong Kong based call centre was restructured
using simulation techniques. The current operations of the call centre were optimized and
simulated allowing the same number of employees to handle a projected high volume of calls
which is 50% greater than the current volume (HALL, Bill; ANTON, Jon, 1998).
5.1.1. Current state simulation
In order to be able to model a future state of the call center, it is necessary to represent the current
operations. The simulation is built for a week since there isn’t so much variation in data between
the months of the year. Moreover, the simulation assumes that each week in the month is the
same since there is no data provided that shows the variation between each week within a month.
The solution is based on an Excel model in which there are three main variables: the arrival rate
of calls, average call duration, and the number of employees required.
To determine the arrival rate the data collected was adjusted to an Erlang distribution based on
literature review (COKE, 2008). Once adjusted, the parameter alpha and beta of the distribution
were calculated. Then, the function GAMMA.INV in Excel was used to calculate the actual
arrival rate.
The average call duration was calculated by taking a weighted average of call type A and call
type B which equals 903.1656 seconds.
Based on the arrival rate, the call duration and the required service level it is possible to calculate
the number of staff required to answer 100% of the calls.
The model created was validated by inputting values for the arrival rate, average call duration,
service level and target time based on the historical data from 2012 that was provided. The output
of the model was the number of employees required which was then compared to current staffing
levels as shows in table 2. Therefore, it can be concluded that the excel model provides a realistic
view of the current state of operations at the call center.
Table 2 - Numbers of callers required per day of week
Mon
Tue
Wed
Thurs
Fri
Sat
Sun
7
XXXIII ENCONTRO NACIONAL DE ENGENHARIA DE PRODUCAO
A Gestão dos Processos de Produção e as Parcerias Globais para o Desenvolvimento Sustentável dos Sistemas Produtivos
Salvador, BA, Brasil, 08 a 11 de outubro de 2013.
Current average number of callers
4-6
4-6
4-6
4-6
4-6
2-3
2-3
Average number of callers based on
Excel Model
4.56
4.87
5.12
5.42
5.92
2.23
2.46
Source: Authors (2013)
5.1.2. Future state simulation
Given that the excel model has provided a solid baseline to model the current operations it is now
possible to observe how the model reacts to different solutions to reach a 100% answer rate. The
first solution focuses on how the staffing level fluctuates based on the service level provided.
Currently, the call centre has a service level of 42.6% with a target answer time of 30 seconds.
The excel model will display how the staffing level changes as the service level is increased to
70, 80, 90, 95 and 100% with a target time of 20 seconds. The second solution provides an
innovative perspective on how implementing a virtual call center will lead to better service.
5.1.3. Change in staffing level based on service level
In this solution the model focuses on providing the optimal staffing for five different service
levels which are at 70, 80, 90, 95 and 100%. The target time was set at 20 seconds since it’s a
common practice in the industry (LEVIN, 2011). However, to handle 100% of the calls it is
required to have a 100% service level but this may not be a feasible solution in terms of cost. The
objective of providing five different service levels is to show the impact it has on the staffing
which is directly correlated to the cost of running the call center.
Figure 5 shows how the average number of staffing is affected by different service levels based
on the time of day (Refer to Appendix A for more detail). As it can be seen on the figure, a
service level of a 100% requires a much higher number of staff when compared to others.
8
XXXIII ENCONTRO NACIONAL DE ENGENHARIA DE PRODUCAO
A Gestão dos Processos de Produção e as Parcerias Globais para o Desenvolvimento Sustentável dos Sistemas Produtivos
Salvador, BA, Brasil, 08 a 11 de outubro de 2013.
Figure 5 - Optimal staffing required to meet different service levels (70, 80, 90, 95 and 100%)
Source: Authors (2013)
Supported by the graph above, if we compare the difference between 90 to 80% or 80 to 70%
there is only a slight change in the number of staff needed. This is due to the fact that as the
quality of service increases the number of staff required to provide 100% service increases
significantly. Moreover, keeping a 100% service level could lead to potential waste of time of the
staff which results in unnecessary cost. Therefore, it is important to realize the desired balance
between service level, cost, and the quality offered to the clients of the CCC.
5.2.
Solution 2: implementing a work at home system
Another potential solution to increase the live answer rate is allowing UCC Workers assigned to
calls to work from home. Technological advancement has now made working from home for call
centres feasible.
The combination of high speed digital telephone networks and switching
technology allow for calls to be re-routed seamlessly to any location (MITEL, 1999). Therefore,
employees from a call centre can answer calls exactly as if they are physically in the call centre
(MITEL, 1999).
Statistics Canada found that in 2010 8% of employees in the Healthcare and
Social Assistance occupation worked from home (PROUDFOOT, 2010). It has been shown in
several studies that working from home increases productivity, as well as employee morale.
9
XXXIII ENCONTRO NACIONAL DE ENGENHARIA DE PRODUCAO
A Gestão dos Processos de Produção e as Parcerias Globais para o Desenvolvimento Sustentável dos Sistemas Produtivos
Salvador, BA, Brasil, 08 a 11 de outubro de 2013.
One study from the University of Stanford studied call centre employees who were sent to work
from home for a nine month trial period. They found a 13% increase in productivity from those
employees who worked at home, mostly attributed to working more minutes per shift and taking
more calls due to the quieter environment (YING, 2012). When employees work from home they
are likely to take shorter breaks, which would result in a decrease in the number of calls missed
during the day due to breaks for the CCC (YING, 2012). Telus did a similar study, allowing 170
employees from a call centre to work from home for a month. They found an increased
productivity rate of 20%, and 82% of the workers who had the opportunity to work at home said
it led to an increased desire to continue working for Telus.
Employees who work from home tend to have a higher work satisfaction and attitude. This
satisfactions leads to less employee turnover, and therefore saves costs in regards to training new
employees. Furthermore, punctuality at work increases since employees no longer have to
commute. People also take less sick days when working from home since they do not have to
leave the house.
The study from Stanford University found a cost savings of around $2000 per employee per year.
This can be broken down into costs associated with the better performance rate was calculated to
be $375 per employee per year, office cost savings of $1250 per employee, and reduced turnover
savings of $400 per employee per year. A study done by Workopolis found that not only is
working from home economically beneficial to the employer, but also to the employees. They
found that the average Canadian spends 182 hours a year commuting to and from work, and
spends $3000 a year on costs related to working away from home (EL AKKAD, 2011).
One negative association related to working from home is the potential for less ambition for
advancement due to less contact time with team leaders and coworkers. This should not be a
problem, however, since the organization rotates roles and therefore UCC Workers would still be
working in the office when doing referrals and notifications.
In order to implement a virtual call centre where employees are reached at home a call centre
software program must be purchased. Software systems are designed to store data about call
history and allow for inbound and outbound calls to be managed from multiple locations. All
outside locations must have internet access and a telephone system. The average initial cost for
10
XXXIII ENCONTRO NACIONAL DE ENGENHARIA DE PRODUCAO
A Gestão dos Processos de Produção e as Parcerias Globais para o Desenvolvimento Sustentável dos Sistemas Produtivos
Salvador, BA, Brasil, 08 a 11 de outubro de 2013.
setting up employees to work from home ranges from $500 to $1000 per person. An average call
centre has a payback period of four months after implementation of a virtual call centre (SMART
COMMUTE, 2010).
6.
Evaluation
As mentioned before, the percent of service level implemented significantly impacts the number
of staffing required to meet a 100% answer rate. Therefore, it is important to find equilibrium
between the level of quality provided and the cost to provide that service.
Figure 6 shows applying different service levels affects the utilization of staff required to answer
100% of the calls. There is a significant trend that can be observed in the figure for each service
level. On Friday there is a higher level of utilization of staff that occurs due to the high volume of
calls. Whereas on the weekends the call volume decreases significantly therefore, the utilization
of the staff decreases as well.
The downfall of implementing a 100% service level is that it results in 195.19 employee hours of
no work. This number can then be multiplied by the cost/hour of the staff to obtain the cost
incurred to provide this level of service. Whereas, operating at 95% service level will result in
90.32 employee hours of no work which is a significant improvement in terms of cost when
compared to a 100% service level. As the service level is reduced to 90, 80 and 70% the number
of hours of no work goes down to 69.5, 44.91 and 30.11 hours respectively (Refer to Appendix B
for more detail). It is apparent that providing an extremely high quality of service comes with a
great cost and in this case seems to be unreasonable.
11
XXXIII ENCONTRO NACIONAL DE ENGENHARIA DE PRODUCAO
A Gestão dos Processos de Produção e as Parcerias Globais para o Desenvolvimento Sustentável dos Sistemas Produtivos
Salvador, BA, Brasil, 08 a 11 de outubro de 2013.
Figure 6 - Percentage of unutilized staff at different service levels
Source: Authors (2013)
7.
Conclusion
The Community Care Centre presented a live answer goal of 100%, knowing that if this target
was met, the organization would be able to provide outstanding service to their clients by
answering all calls within 20 seconds or less. This is certainly the goal of every call centre, but
even though doing so would delight customers, it is not feasible for a business to function in such
a way. To deliver on a 100% live answer rate in 20 seconds or less would require a staffing
budget which is unreasonable, and would result in waste during non-peak hours for calls.
Therefore, the first solution involves examining the staffing levels required to meet different
service level targets. A balance between the number of additional staff required and the benefit
to the service level provided needs to be considered to optimize the call centre. The second
solution involves implementing a Work at Home system, which has been shown to increase
productivity of call centres and cut costs for employers. The implementation of either solution
would assist in increasing the quality of service provided to clients.
As a matter of suggestion, it is worthwhile to examine if there can be an improvement in the
documentation procedure, thus reducing the time it takes a UCC Worker to effectively answer
and assist a client. One possibility to reduce documentation time, while ensuring that the quality
12
XXXIII ENCONTRO NACIONAL DE ENGENHARIA DE PRODUCAO
A Gestão dos Processos de Produção e as Parcerias Globais para o Desenvolvimento Sustentável dos Sistemas Produtivos
Salvador, BA, Brasil, 08 a 11 de outubro de 2013.
is maintained, is the use of a software technology that converts audio to text. This will allow for
the UCC Worker to orally document the call, and thus save time to answer more calls. Another
way to reduce documentation time is to make it be available online for patients, doctors and
nurses to view and edit. If the time for documentation can be shared with other stakeholders it
will reduce the workload on the workers and enhance the efficiency of the overall process.
Acknowledgment
This work was supported by CNPq, Conselho Nacional de Desenvolvimento Científico e
Tecnológico – Brasil - Brazil. Through the program Science Without Borders.
References
BLOOM, Nicholas; LIANG, James; ROBERTS, John; YING, Zhichun Jenny. Does Working
from Home Work? Stanford University, Dec 18th, 2012. Available on:
<http://www.stanford.edu/~nbloom/WFH.pdf>. Access on Feb 1st, 2013.
CHIN, Gillian; COKE, Jason. Simulation Modeling for Staff Optimization of the Toronto
Emergency Medical Services Call Centre. University of Toronto, Mar. 2008. Available on:
<http://www.mie.utoronto.ca/undergrad/thesis-catalog/files/163.pdf >. Access on Jan 27th, 2013.
EL AKKAD, Omar. Benefits of working from home add up. The Globe and Mail, Oct. 14th,
2011. Available on: <http://www.theglobeandmail.com/report-on-business/small-business/sbdigital/web-strategy/benefits-of-working-from-home-add-up/article557326/>. Access on Jan 30th,
2013.
SMART COMMUTE. Employer Profile, 2010. Available on:
<http://www.smartcommute.ca/en/more-options/telework/case-studies-telus>. Access on Feb 1st,
2013.
HALL, Bill; ANTON, Jon. Optimize your call center through simulation. Call Center
Solutions, 1998. Volume 17, issue 3. Pages 54-59. Available on:
<http://search.proquest.com/docview/208137863?accountid=14771>.
LEVIN, Greg. Service Level - The Indispensable Call Center Accessibility Metric. N.p., 04
July 2011. Available on: <http://www.offcenterinsight.com/1/post/2011/04/service-level-theindispensable-call-center-accessibility-metric.html>. Access on Jan 28th, 2013.
MITEL, Huws. Virtually There: The Evolution of Call Centres. Institute for Employment
Studies, Sept. 1999. Available on: <http://www.employmentstudies.co.uk/pubs/summary.php?id=virtcall>. Access on Jan 27th, 2013.
PROUDFOOT, Shannon. More Canadians Working from Home. National Post, Dec 7th, 2010.
Available on: <http://news.nationalpost.com/2010/12/07/more-canadians-working-from-homereport/>. Access on Jan 28th, 2013.
13
XXXIII ENCONTRO NACIONAL DE ENGENHARIA DE PRODUCAO
A Gestão dos Processos de Produção e as Parcerias Globais para o Desenvolvimento Sustentável dos Sistemas Produtivos
Salvador, BA, Brasil, 08 a 11 de outubro de 2013.
SHARP, Duane. Call Center Operation: Design, Operation, and Maintenance. Elsevier
Science (USA), 2003. Available on: <http://cdn.ttgtmedia.com/searchCRM/downloads/chapterCRM-6-15.pdf>. Access on Jan 24th, 2013.
14
XXXIII ENCONTRO NACIONAL DE ENGENHARIA DE PRODUCAO
A Gestão dos Processos de Produção e as Parcerias Globais para o Desenvolvimento Sustentável dos Sistemas Produtivos
Salvador, BA, Brasil, 08 a 11 de outubro de 2013.
Appendix A: Number of staff for each half an hour of the week, considering different
services level
15
XXXIII ENCONTRO NACIONAL DE ENGENHARIA DE PRODUCAO
A Gestão dos Processos de Produção e as Parcerias Globais para o Desenvolvimento Sustentável dos Sistemas Produtivos
Salvador, BA, Brasil, 08 a 11 de outubro de 2013.
16
XXXIII ENCONTRO NACIONAL DE ENGENHARIA DE PRODUCAO
A Gestão dos Processos de Produção e as Parcerias Globais para o Desenvolvimento Sustentável dos Sistemas Produtivos
Salvador, BA, Brasil, 08 a 11 de outubro de 2013.
17
XXXIII ENCONTRO NACIONAL DE ENGENHARIA DE PRODUCAO
A Gestão dos Processos de Produção e as Parcerias Globais para o Desenvolvimento Sustentável dos Sistemas Produtivos
Salvador, BA, Brasil, 08 a 11 de outubro de 2013.
Source: Authors (2013)
18
XXXIII ENCONTRO NACIONAL DE ENGENHARIA DE PRODUCAO
A Gestão dos Processos de Produção e as Parcerias Globais para o Desenvolvimento Sustentável dos Sistemas Produtivos
Salvador, BA, Brasil, 08 a 11 de outubro de 2013.
Assuming:
D/W = Day of the week
Num_Calls = Average of calls received
N. Staff SL 100 = Number of staff required, considering a service level of 100%
N. Staff SL 95 = Number of staff required, considering a service level of 95%
N. Staff SL 90 = Number of staff required, considering a service level of 90%
N. Staff SL 80 = Number of staff required, considering a service level of 80%
N. Staff SL 70 = Number of staff required, considering a service level of 70%
Appendix B: Comparison between the results obtained per each service level
Service
level
70%
80%
90%
95%
100%
Utilization
average
75%
67%
58%
51%
33%
Over capacity
average
25%
33%
42%
49%
67%
Idle average
(hours)
30.11
44.91
69.50
90.32
195.19
Source: Authors (2013)
19
Download