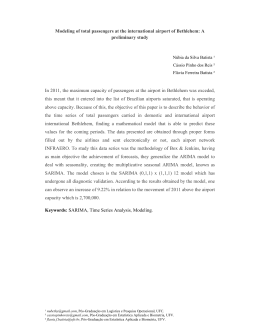
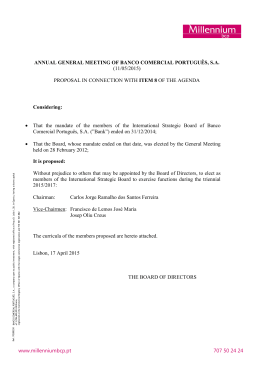
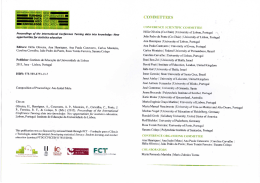
Tourism & Management Studies, 10(1) 2014
Success factors of regional airports: The case of Oporto airport
Fatores de sucesso dos aeroportos regionais: o caso do aeroporto do Porto
Francisco Carballo-Cruz
NIPE and University of Minho, Largo do Paço s/n, 4704-553 Braga, Portugal,
[email protected]
Vânia Costa
Polytechnic Institute of Cávado and Ave, School of Management, Campus do IPCA, 4750-810 Barcelos, Portugal, and Research Group in Economic
Analysis (RGEA), University of Vigo, Spain, [email protected]
Abstract
Resumo
Oporto Airport (OPO) is a success story among European regional
airports. This success is expressed, among other ways, in the rapid
expansion of routes and the strong growth in demand, as well as in the
recognition of the airport’s quality by its users. Over the past decade,
the volume of traffic increased by almost 3.4 million passengers, from
the 2.6 million recorded in 2002 to over 6 million in 2012. In this paper,
we analyse some of the factors that influenced the success of Oporto
Airport, namely the expansion of capacity and improvements to
infrastructure, the increase in the number of routes and the increased
demand in response to the new capacities of this airport-airlines set.
Particular emphasis is given to the role of low cost carriers (LCC) in the
growth of Oporto Airport and to strategies of attracting more traffic.
Some of the main opportunities and challenges that this airport will face
in the coming years are also discussed.
O aeroporto do Porto (OPO) e um caso de sucesso entre os aeroportos
regionais europeus. Esse sucesso tem expressao, entre outras dimensoes, na
rapida expansao da oferta de rotas e no intenso crescimento da procura,
assim como no reconhecimento da qualidade do aeroporto pelos seus
utilizadores. Nos ultimos dez anos, o volume de trafego aumentou mais de
3,4 milhoes de passageiros, passando dos 2,6 milhoes registados em 2002
para mais de 6 milhoes em 2012. Neste artigo analisam-se alguns dos
fatores que influenciaram o sucesso do aeroporto do Porto, nomeadamente
a ampliaçao de capacidade e a qualificaçao da infraestrutura, a expansao do
numero de rotas e a resposta da procura as novas capacidades e valencias
do conjunto aeroporto-companhias aereas. Da-se particular relevo ao papel
das companhias aereas low cost (LCC) no crescimento do aeroporto do
Porto e as estrategias de captaçao de trafego. Sao tambem discutidas
algumas das principais oportunidades e desafios que o aeroporto
enfrentara nos proximos anos.
Keywords: Air transport, airports, low cost carriers (LCC), tourism.
Palavras-chave: Transporte aereo, aeroportos, companhias aereas de
baixo custo (LCC), turismo.
1. Introduction
passengers, there has also been a change in the connectivity
rationale of these airports, which are no longer transport
infrastructures for feeding hubs. Regional airports are the
nodes of a set of overlapped networks with direct connections
between several regions of Europe, to some extent an
alternative to the hub-and-spoke networks that dominate in
some European countries.
Over the last fifteen years air transport has radically changed in
Europe. Since the completion of the liberalisation process in
1997, the growth of low cost carriers (LCC), resulting from their
aggressive pricing policies, completely transformed supply and
significantly boosted demand. Specifically, the intensification of
price competition has stimulated tourist demand for mediumdistance travel to enjoy short breaks or weekends in cities with
tourist attractions. Reduced prices have also induced the higher
travel demand of international students and migrant workers,
who return home more frequently. Finally, low prices have also
given rise to the deviation of business passengers to LCC, who
have gained importance in LCC’s total demand.
Regional airports have a catalytic effect on economic
development and hence are considered by regional and local
authorities to be strategic assets for any region. These
infrastructures are critical for attracting and retaining
investment, for leveraging economic growth and for generating
employment. Specifically, regional airports employ directly
about 500,000 workers and indirectly almost double that (ACI
Europe, 2012). In addition to these impacts, these airports
improve the accessibility levels of the regions in which they are
located, ensuring their connectivity to the rest of Europe and,
therefore, to the rest of the world (Zuidberg & Veldhuis, 2012).
As the LCC sector developed, the airport industry experienced
a profound metamorphosis (Graham, 2008). In general,
airports begin to be managed as dynamic businesses that
compete for airlines and passengers (Forsyth et al., 2010).
Simultaneously, regional airports experienced very significant
growth (Graham, 2013) and compete for passengers with
airports of the main networks. Before the outbreak of LCC,
regional airports were at best entry points of hub-and-spoke
systems of traditional airline companies (full service carriers)
or infrastructures for supporting tourism activities of high
seasonality. Currently, regional airports along with secondary
airports are the basis of the point-to-point business of LCC. Due
to the intense growth of these companies, regional airports are
the most dynamic part of the European airport system, with
growth rates well above the main airports (ACI Europe, 2013).
Oporto Airport, located 11 kilometres north of the city of
Oporto, is the second airport in level of passenger traffic in
Portugal, just after Lisbon (6,050,094 vs. 15,301,176). It is
devoted to international regular traffic for business and
tourism. Oporto Airport has the largest catchment area of
Portuguese airports, as in an area of a 90-minute travel distance
live around four million inhabitants. The hinterland of Oporto
Airport covers the central region of Portugal and the region of
Galicia in Spain. In this case, the low level of supply of Galician
airports and proximity to the border located 95 km from the
airport help improve the attractiveness of Oporto Airport. The
dynamics of this airport are also associated with the
importance of the industrial concentration of the northern
region of Portugal (the largest in the country), the tradition of
migratory workers in the area (to which they travel regularly to
According to ACI Europe (2012), between 2001 and 2010, air
traffic in European regional airports increased by 60%,
exceeding 500 million passengers in 2010. During this period,
international traffic at airports with less than five million
passengers grew by over 80%. In addition to this growth in
37
F. Carballo-Cruz / V. Costa / Tourism & Management Studies, 10(1), 2014, 37-45
visit friends and relatives) and the attractiveness of the city of
Oporto and its surroundings as a tourist destination
(particularly for city breaks).
performance of Oporto Airport in recent years including the
infrastructure renewal and expansion in the number of routes,
analysing in this case the role of LCC in increasing flight
connections. Section Three explains the response of increased
demand after the change in supply conditions and analyses the
interaction between air transport and tourism at the regional
level. Finally, Section Four presents and discusses some of the
opportunities and challenges that Oporto Airport will face in
the coming years.
In 2012, 23 airlines operated at Oporto Airport, which
supported about 58,000 aircraft movements and carried over
6,050,000 passengers and 34,500 cargo tons (ANA, 2013a). The
airport currently enjoys a very significant capacity to absorb
demand. In its maximum capacity, the current supply
conditions allow an increase in the number of passengers by
50% and a growth in the cargo volume of 100%, approximately.
Oporto Airport represents about 20% of the total traffic in
Portuguese airports and almost 18% of LCC traffic in the
country (ANA, 2013a). Over the last twenty years, passenger
volume almost quadrupled from just over 1.6 million
passengers in 1992 to over 6 million in 2012.
2. Supply factors
2.1. Infrastructure renovation
Over recent years, there has been an ambitious expansion and
modernisation of Oporto Airport, designed to increase its
capacity and improve its operations. In 1999 the airport had a
capacity of 14 movements per hour and about three million
passengers per year. The main constraints of Oporto Airport in
the late nineties were related to the capacity constraints of the
check-in and baggage handling system, the shortage of parking
places, the inadequacy of the operational lay-out of the areas of
aircraft manoeuvre, handicapped accessibility and capacities of
some sectors, and the small size of available spaces for the
development and expansion of new functions.
Portuguese airports, including Oporto Airport, are managed by
one operator, ANA – Airports of Portugal. As a result of the
budgetary difficulties of the Portuguese economy and in order
to achieve the privatisation objectives included in the
Programme of Economic and Financial Assistance, resulting
from the bailout of the country in 2011, the government
decided to privatise ANA. The airport operator was privatised
in December 2012. The French infrastructure manager Vinci
acquired ANA by €3,080 million and will manage Portuguese
airports over a period of 50 years.
In response to these weaknesses and the favourable trend in
demand, the airport operator decided to expand Oporto
Airport’s supply. The enlargement and qualification of supply
were enshrined in the 2000 Master Plan (ANA, 2000), in which
was defined a medium and long term strategy, operationalised
in three well-defined stages. The first one proposed to increase
the installed capacity to 6 million passengers per year, the
second to 11 million and the third to 15 million. Seven years
later, in the 2007 Master Plan (ANA, 2007b), an increase in
capacity to fifteen million passengers – which is the maximum
volume of demand technically admissible in the airport’s
current location – remained the objective in terms of supply
expansion.
The objectives of this work are: i) to describe the case of Oporto
Airport in various aspects because it can be considered a
success within regional airports in Europe; ii) to analyse the
factors that contributed to this success, both from the supply
and the demand side, and iii) to discuss the challenges that the
infrastructure will face in the near future to consolidate and
strengthen its position in the airport market. The methodology
used is case study. Oporto Airport is a very interesting case
because it is a regional airport that combines different types of
traffic, business (~45%), tourism (~30%) and visiting friends
and relatives (VFR) (~20%), posing consequently great
challenges in the definition and implementation of its strategy.
In the context of this case study, we carried out a comprehensive
collection of airport information, a detailed analysis of the
gathered data, an assessment of the current situation using
comparative elements and a projection of future scenarios, in
order to anticipate the main challenges of Oporto Airport in the
medium and long term.
Between 2000 and 2006, a large investment in the expansion
and upgrading of Oporto Airport was carried out. This
investment exceeded €400 million; 375 million were devoted to
construction work and around 25 million to preparation work
(see Table 1). This investment was financed with ANA’s own
resources (43%), loans from the European Investment Bank
(41%), other loans (10%) and EU funding from the European
Regional Development Fund – ERDF (6%).
The structure of the paper is as follows. Section Two
summarises the supply factors that contributed to the good
Table 1 – Investment and financing of Oporto Airport expansion (€)
Sources of financing
Investment
Total
ANA
European
Investment Bank
European Regional
Development Fund
Other bank
loans
%
Construction work
375,044,920
142,114,835
168,000,000
24,930,085
40,000,000
92.2%
Preparatory work
26,300,984
26,300,984
6.5%
Expropriations
5,591,893
5,591,893
1.3%
406,937,797
174,007,712
Total cost
168,000,000
24,930,085
40,000,000
100%
Source: Tribunal de Contas (2009).
After the expansion, the airport has a maximum annual capacity
of 9 million passengers and 60 thousand cargo tons and of 20
aircraft movements per hour (ANA, 2012c). Enlarging and
qualifying the airport entailed a supply increase of its various
facilities. Table 2 shows the level of supply of several valences
of the airport before and after the expansion.
38
F. Carballo-Cruz / V. Costa / Tourism & Management Studies, 10(1), 2014, 37-45
Table 2 – Capacity increase at Oporto Airport
2007
2000
Capacity (3 million passengers/year)
- 25 check-in positions
- 9 boarding gates
- 9 conventional gates
- 0 telescopic bridges
- 15 aircraft parking positions
- 1,000 parking spaces
- 14 movements/hour
- Average turn-around time: 60 minutes
- 1,200 passengers/hour
Capacity (9 million passengers/year)
- 60 check-in positions
- 23 boarding gates
- 14 conventional gates
- 9 telescopic bridges
- 35 aircraft parking positions
- 2,500 parking spaces
- 20 movements/hour
- Average turn-around time: 30 minutes
- 2,200 passengers/hour
Source: Adapted from ANA (2000) and ANA (2007b).
The expansion and general improvement of airport facilities
resulted in a more efficient operation for companies and a
greater level of comfort and general service for passengers.
Based on the results of satisfaction surveys conducted in a large
number of airports around the world by ACI-Airport Council
International, Oporto Airport received several distinctions in
the ASQ-Airport Service Quality awards. In 2006, Oporto
Airport was considered the third best airport in Europe and the
third in the world in the category of two to five million
passengers. In the following year it was voted the best airport
in Europe. In 2008, 2009, 2010 and 2011, it remained in the top
three in Europe. It was considered the second best European
airport in 2010 and the third best in the remaining three years.
Since 2006, ANA has had agreements with its business partners
(handling agents, airlines and the Foreigners and Borders Service)
for quality commitments, which are formalised through Service
Level Agreements (SLA). These agreements establish quality
objectives for different service processes that are critical to airport
operations – which are regularly monitored – and clarify the
responsibilities of each business partner. Overall, results show
higher evaluations than the level agreed for every SLA (see Figure
1). The assessment of airport passenger satisfaction has been
measured through regular surveys. Results translate into a level of
satisfaction – in the range 0-5 – of 4.08 in 2010, 4.07 in 2011 and
4.08 in 2012, revealing the highest degree of satisfaction among
Portuguese airports in 2010 and 2011 and the second highest in
2012 (ANA, 2013b).
Figure 1 – Service level agreements (SLA)
1,20
1.04 1.06
1.05 1.05
1.03 1.02
Check-in
Security
Boarding
1.10 1.11
1.07 1.05
1,00
0.98
1.04
1.02 1.01
0,80
0,60
0,40
0,20
0,00
IATA Summer 2011
Border
Landing
IATA Summer 2012
Luggage
Equipment
Agreed Level
Source: ANA (2013b).
2.2. Expansion of routes: The role of LCC
the region of Galicia in Spain, as well as good prospects for
passenger growth in specific demand segments such as
tourism, business and VFR. Secondly, the availability of a
renewed infrastructure with overcapacity, which allows airlines
quick and flexible operations without having to deal with
traditional supply constraints (slots availability, quick
turnarounds and enough capacity to accommodate large
demand growths). Thirdly, although LCC do not enjoy
significant advantages in terms of airport charges, airport
services offer competitive prices. Fourthly, there exists a
relatively autonomous management focused on improving
efficiency levels. Fifthly, there are good road accesses and
sufficient parking spaces at reduced prices, as well as decent
links to public transport networks, in particular to coach and
metro services. And lastly, there was a relatively low level of
competition with a relatively dominant air operator, before the
entry of LCC.
Another factor that explains traffic growth is the attraction of
low cost airlines. Generally, LCC airports seek to enable these
companies to reduce costs and exploit economies of density
through the intensive use of aircraft (Pitt & Brown, 2001).
According to Warnock-Smith and Potter (2005), the choice of
airports by LCC is based, primarily, on the size of the catchment
area, secondly, on the availability of slots and, thirdly, on
reduced turnaround times and low congestion levels. The next
factor in order of importance is reduced airport charges. Other
factors identified as relevant, albeit less important, are positive
prospects for business and tourist traffic, the awareness of
airport management of the importance of keeping costs low and
the existence of high levels of competition with other airports,
good road access and sufficient spare capacity to accommodate
demand growths.
In the case of Oporto Airport, the existence of some of these
factors has allowed a quick development of LCC business.
Firstly, the possibility of increasing its catchment area to the
south, to the central region of the country, and to the north, to
Services supply at Oporto Airport increased significantly since
the entry of LCC. According to Almeida (2011), the increase in
routes and frequencies offered by LCCs resulted in major
changes in air transport, inducing a change in demand
39
F. Carballo-Cruz / V. Costa / Tourism & Management Studies, 10(1), 2014, 37-45
behaviour and a positive effect on the development of other
activity sectors, such as tourism. Low cost airlines started
operations in Oporto Airport in 2004, with the entry of Air Berlin,
linking Oporto via Palma to several European destinations. In that
year, Air Berlin carried just over 13,000 passengers, representing
0.5 % of the total airport traffic (Caballero, Losada & Marrana,
2006). In 2005, Ryanair started flying from Oporto, with
connections to London-Stansted and Frankfurt-Hanh,
transporting almost 250,000 passengers, representing 7.5% of
the Oporto Airport demand. In 2006, Ryanair added three new
destinations: Paris-Beauvais (daily flights), Dublin (daily flights)
and Liverpool (three flights per week). The number of passengers
carried that year reached approximately 525,000. This growth
allowed Ryanair to reach second place in the ranking of airlines
with operations at Oporto Airport, with a market share of 15.3%.
In 2006, Hapag-Lloyd Express (HPX) began operating in Oporto,
with connections to Cologne and Stuttgart (three flights per week
in each case).
services. Ryanair’s bet on Oporto Airport derives from the
fulfilment of some of the requirements that the company
considers fundamental to operating at a given airport.
According to Barrett (2004), the criteria for Ryanair to consider
an airport as low cost friendly are to have lower airport charges,
an aircraft turnaround time of 25 minutes, simple terminals,
services that allow for quick check-in, good commercial
facilities (catering and shops), adequate connections by road
and no executive class or business lounges.
An operational base consists of an airport where an airline
locates aircrafts, crew and support operational services
(Graham & Shaw, 2008). The choice of airports for this function
is mostly based, especially in the case of LCC, on logistics and on
the possibility of maximising the use of aircrafts, as well as on
the existence of incentives and other types of benefits
associated with operating at the airport (Alderighi, Cento,
Nijkamp & Rietveld, 2007). Despite the potential advantages of
this management option, the installation of an operational base
implies generally significant investment (Coombs, 2011),
particularly because it involves the allocation of exclusive
aircrafts to meet the expected supply levels.
In 2007, there was a large increase in the number of low cost routes
in Oporto Airport. EasyJet, Brussels Airlines, Transavia and Clickair
joined the three companies already operating at the airport.
EasyJet connected Oporto to Geneva and Basel, while Brussels
Airlines, Transavia and Clickair connected Oporto with the airports
of Brussels-BRU, Barcelona-El Prat and Paris-Orly, respectively.
That year, Ryanair flew to 13 destinations, while HPX increased one
destination over its previous year’s supply (Hamburg).
Ryanair’s base at Oporto, which began operating in September
2009, was the first one in Portugal and the thirty-third in
Europe Ryanair currently has operating bases outside Europe,
namely in Morocco. The Oporto base entailed an investment of
€146 million and the allocation of three aircrafts. In the first full
year after opening (2010), the number of passengers increased
by over 40% in relation to the previous one (2009). The number
of passengers carried by Ryanair almost doubled from 2009 to
2011 (1,193,705 vs. 2,268,713). Three years after opening, the
base had five aircrafts, flying to 33 international destinations,
with the exception of Faro.
From 2009 onwards, the LCC operating in Oporto Airport are
Air Belin, Brussels Airlines, EasyJet, Ryanair and Transavia. The
23 destinations offered in 2007 by these companies doubled in
2012, reaching 46. The airline with the largest operation at
Oporto Airport in 2012 was Ryanair, which offered 33 routes,
well above EasyJet with six routes, and Transavia with four
routes. The other two LCC only flew to one destination in each
case. In 2007, the 54 routes of Oporto Airport offered 5,950,000
seats, 29% of which on low cost carriers. In 2012, from the
7,875,000 seats offered in the 81 routes of the airport, nearly
51% were supplied by LCC.
Ryanair’s increase in supply since its entry into Oporto Airport
has been very significant. In 2006, when it flew to only five
destinations (Figure 2), the number of seats offered was
625,000 (12.1% of the seats offered in the airport). In 2012,
when it operated 33 direct connections (Figure 3), the seats
offered exceeded 2,770,000 (35.2% of the seats offered in the
airport).
The opening of Ryanair’s operational base in Oporto Airport
was a big jump from the supply standpoint. This supply
expansion resulted in a very strong demand growth of Ryanair
Figure 2 –Ryanair routes at Oporto Airport
2006
Figure 3 –Ryanair routes at Oporto Airport
2012
Source: Caballero et al. (2006).
Source: www.ryanair.com/pt.
Agreements with airlines have driven the expansion and
consolidation of flights supply in Oporto Airport. These
agreements are a factor of the utmost importance to attracting
airlines, especially LCC, since they prefer airport operators (and
hence airports) that show flexibility and willingness to
negotiate on costs. These agreements between the airport
40
F. Carballo-Cruz / V. Costa / Tourism & Management Studies, 10(1), 2014, 37-45
operator and the airlines may have different modalities
(Graham & Dennis, 2007). It may be only a discount on airport
charges or may involve the sharing of risks, based on the
number of passenger arrivals (Graham, 2013). They may also
imply the coverage of new services’ marketing costs or, in
general, the costs of launching new routes (Starkie, 2012). In
addition to the direct subsidies granted by airport operators, in
some countries such as Spain, agreements may also include
subsidies from public authorities (Castillo-Manzano, LopezValpuesta & Gonzalez-Laxe, 2011).
component which is specifically designed to promote the
supported route. Data provided by Turismo de Portugal via the
press reveal that in the first four years in place, the programme
supported 23 routes of LCC (Ryanair [18] and EasyJet [5]), 10
of traditional airlines (TAP [3] and SATA [7]) and 10 of hybrid,
charter or regional airlines (Jet2 [4], Tui Fly [2], Sky Europe [1],
Aer Lingus [1], Aigle Azur [1] and Thomson Fly [1]). Twentythree routes were supported in Faro, ten in Madeira, five in
Lisbon, four in Ponta Delgada and one in Porto Santo. The 43
supported routes benefit from a funding of €13.3 million and
handled 1,630,000 passengers, representing an average
support per passenger of €8.15 (ANA, 2013b).
In Portugal these agreements are part of a programme to promote
routes launched in late 2007, called Initiative.pt – Developing
Tourism and Aviation. This programme covers all Portuguese
airports, as the airport operator manages all the airfields of the
country. Initiative.pt combines support based on the number of
passenger arrivals with promotional grants, and it is funded by the
airport operator and public and parapublic entities.
In March 2012, the second phase of Initiative.pt, called
Initiative.pt 2.0, was launched. This stage involves an
investment of €15 million and the financing of one million and
a half passengers during the three years of the programme.
According to ANA (2013b), Initiative.pt 2.0 will provide
financial and logistic support to 60 routes and will fund the
opening of 45 new routes, the extension of three routes during
the winter period and a frequency increase in other two. In
2012, under this programme, 28 new routes were created – six
of these in Oporto Airport – and 60 received financial and
logistic support, 10 of these at Oporto Airport (see Figure 4).
During the first four years in place, Initiative.pt supported 43
routes, with an investment of over €13 million. The funding of
this programme is ensured by ANA (40%), Turismo de Portugal
(30%) and several regional agencies of tourism promotion
(20%) (ANA, 2013b). The programme is intended primarily for
the creation of new routes and the increase of frequencies in
routes considered under-served. The support for airlines
adopts, in many cases, a model of co-investment with a variable
component based on passenger arrivals and a fixed marketing
Figure 4 – New routes and routes with support from Initiative.pt 2.0 in 2012
70
60
60
50
40
20
28
23
30
13
11
10
6
10
12
6
0
0
Lisbon
Oporto
Faro
New routes in 2012
Madeira
3
4
Azores
Total
Routes supported by Initiative 2.0
Source: ANA (2013b).
to growth, particularly in 2007 and 2008. In contrast, in 2009,
there was a traffic stagnation, in line with what happened in all
European markets, coinciding with the most depressed period
of the economic and financial crisis, which began in 2008. From
2010 onwards, air traffic went back to a positive trend, with
average growth rates of 7.5% per year. In 2012 there was a
record number of airport users, slightly surpassing six million
passengers.
3. Demand response
From the demand point of view, four different periods in Oporto
Airport may be identified: the first one from 1990 to 1999, the
second one from 2000 to 2003, the third one from 2004 to 2009
and the fourth from 2010 to 2012 (see Figure 5). The first
period is characterised by steady growth, which accelerated in
1998 and 1999. The decline and stagnation of traffic mark the
second period. The third period is characterised by the return
Figure 5 – Traffic evolution at Oporto Airport
Source: Adapted from ANA (2012a), ANA (2012d) and INAC (2010).
41
F. Carballo-Cruz / V. Costa / Tourism & Management Studies, 10(1), 2014, 37-45
From the completion of the airport expansion in 2006, LCC
growth accelerated considerably, reaching 1,250,000
passengers in 2007 (700,000 in 2006), almost 2,000,000 in
2009 and over 3,350,000 in 2012. The main impact of the
entrance of LCC, in terms of traffic composition, was the
stagnation of Full Service Carriers (FSC) passenger volumes –
2.5 million passengers per year since 2006. LCC traffic
increased as long as the status quo in FSC traffic allowed the first
to progressively increase its market share at the airport, rising
from 9.5% in 2006 to 31% in 2007 and to 43.5% in 2009 (see
Figure 6). In 2011, LCC traffic exceeded, for the first time, half
of Oporto Airport’s traffic and in 2012 reached a market share
slightly higher than 55%.
Figure 6 – Traffic evolution at Oporto Airport by type of operator
7.000.000
6.000.000
5.000.000
4.000.000
3.000.000
2.000.000
1.000.000
0
2005
2006
2007
2008
2009
FSC and other commercial flights
2010
LCC
2011
2012
Source: Adapted from ANA (2006); ANA (2007a); ANA (2008); ANA (2009); ANA (2010); ANA (2011a); and ANA (2012a).
The academic literature on air transport concludes that the
most important factor in choosing airlines is the price of the
ticket, particularly in the case of LCC. According to the results of
a comparative study conducted by O’Connell and Williams
(2005), 80% of low cost passengers choose an airline based on
price. Other studies conclude that, although the price is the
most important factor, there are other factors influencing the
choice, such as proximity to the airport (Martínez-García &
Royo-Vela, 2010). Ryan and Birks (2005) also point out two
important factors in users’ choice: the availability and cost of
hotel facilities and the availability and affordability of parking
spaces. In the case of Oporto Airport, the absence of competing
airports within a very broad geographical area and the
existence of good road accessibility and (cheap) parking
availability may be, jointly with LCC low prices, important
factors for explaining the intense traffic growth of recent years.
The main markets of Oporto Airport are France, Spain, Portugal,
Germany, the UK, Switzerland, Italy, Belgium and Luxembourg.
In 2012, the fifteen destinations with larger demand accounted
for 65.7% of total airport traffic (see Table 3). Besides the
strong concentration of demand in a limited number of
destinations, Oporto Airport has an important market
concentration by operators.
Table 3 – Oporto Airport top destinations
Destination
Passengers
%
Airlines
Paris-Orly
585,336
9.8%
Aigle-Azur, TAP Portugal, Transavia
Geneva
405,201
6.8%
EasyJet, Swiss, TAP Portugal
Madrid
398,083
6.6%
Air Nostrum LAM, Ryanair, TAP Portugal
Lisbon
393,292
6.6%
TAP Portugal
Frankfurt
325,455
5.5%
Lufthansa
Barcelona
286,457
4.8%
Ryanair, TAP Portugal
Paris-Beauvais
246,194
4.1%
Ryanair
Funchal
226,920
3.8%
TAP Portugal, Transavia
London-Gatwick
223,309
3.7%
EasyJet, TAP Portugal
London-Stansted
212,470
3.6%
Ryanair
Paris-Charles de Gaulle
143,502
2.4%
EasyJet, TAP Portugal
Faro
133,568
2.2%
Ryanair
Frankfurt-Hahn
126,619
2.1%
Ryanair
Brussels-Charleroi
113,029
1.9%
Ryanair
Source: Adapted from ANA (2012d).
In 2012 the most important companies, according to the
number of carried passengers, were Ryanair, EasyJet and TAP
Portugal (see Figure 7). By 2010, TAP Portugal was the main
carrier at the airport. From that year onwards, Ryanair led the
ranking of carried passengers. In 2011, Ryanair transported
1,678,872 passengers, surpassing TAP Portugal just by 41,334
passengers. In 2012, the distance between both companies
widened extraordinarily, surpassing 2.1 million passengers. In
2012, Ryanair had 37.8% of the airport market share and 68.2%
of the LCC market share (ANA, 2012d). In that year, TAP saw its
Oporto Airport market share drop for the fifth consecutive year,
from nearly 40% in 2008 to just 27.6%.
42
F. Carballo-Cruz / V. Costa / Tourism & Management Studies, 10(1), 2014, 37-45
Figure 7 – Main carriers traffic share
100%
80%
Lufthansa
60%
Transavia
40%
EasyJet
TAP
20%
Ryanair
0%
2000
2005
2009
2012
Source: Adapted from INAC (2010) and ANA (2012d).
The growing presence of low cost carriers in Oporto Airport has
changed the profile of its users. The comparison of passenger
characteristics in 2004 and 2012 reveals significant differences.
During this period, the presence of women increased (30.9% in
2004 to 48.5% in 2012) and the same happened with people
under 30 (26.1% in 2004 to 44.2% in 2012). Furthermore, the
weight of passengers with higher education degrees decreased
(44.1% in 2004 to 33.0% in 2012) (ANA, 2011b; ANA, 2012b).
Regarding reasons for travelling, the changes are also very
significant. There was a significant loss of business passengers,
whereas a considerable increase in tourist and VFR traffic was
felt. There was also a strong growth of users residing abroad,
namely tourists and Portuguese immigrants (58.4% in 2004
and 89.9% in 2012).
Oporto Airport has boosted tourism growth in the city and the
northern region as a whole. Leisure passengers of Oporto
Airport fly mostly on LCC, specifically 65% in 2012.
Despite the changed conditions of supply, the main tourist
markets in the North remain the same as one decade ago. In
2012 France (32%), Spain (26%), the UK (10%), Germany
(8%), Switzerland (8%), Italy (7%) and the Netherlands (4%)
were the main origin countries of tourists in the region (INE,
2013a). In 2012 the number of overnight stays of tourists from
the main markets represented approximately 44% of all
overnight stays in the region (INE, 2013b).
That same year, 41% of tourists slept only in Oporto, 39% in the
North, mainly in the cities of Braga, Guimaraes and Viana do
Castelo, and 20% in Oporto and other northern cities of
Portugal (IPDT, 2012a, 2012B, 2012c and 2012d). According to
the same source, in 2012 tourists spent about €626 during their
stay, which corresponds to an average daily expense of €84.2.
The attractiveness of any tourist destination depends on its
natural resources, local culture and man-made infrastructure
(Bieger & Wittmer, 2006). Within the latter, transport
infrastructures, especially regional airports, are very
important, as they are a gateway for tourism (Robertson, 1995).
The availability of low cost routes at airports of this type is
critical to the enhancement of tourism, given that, according to
Donzelli (2010), LCC not only attract traffic from FSC but also
generate new demand. According to Skeels (2005), 59% of LCC
passengers are new consumers who would not travel if this
alternative were not available, and only 37% are switchers
(changed from FSC to LCC). The increased supply of LCC in
The determination of the direction of causality between growth
in LCC supply and tourism growth is a complex subject. It is a
feedback process that ultimately benefits all stakeholders. In
this case, passengers carried by LCC via Oporto Airport and
foreign tourists from northern Portugal follow a parallel trend
that confirms the existence of some kind of interaction between
both phenomena (see Figure 8).
Figure 8 – Overnight stays of foreigners in the North and LCC passengers at Oporto Airport
5.000.000
4.500.000
4.000.000
3.500.000
3.000.000
2.500.000
2.000.000
1.500.000
1.000.000
500.000
0
2006
Sleeps in the North of Portugal
2009
2012
Passengers carried by LCCs
Source: Adapted from ANA (2007a), ANA (2010), ANA (2012d), INE (2007), INE (2010) and INE (2013b).
4. Opportunities and challenges
will boost airport demand in the coming years. The demand for
city breaks has been growing consistently. Between 2007 and
2011, the number of overnight stays in the Oporto region
increased by 16.5%, exceeding 2,750,000. Hotel capacity
accompanied the increase in demand and in the same period
Despite the rapid growth of recent years, Oporto Airport still
has room to grow. The city of Oporto and the North of Portugal
are consolidating as a multiproduct tourist destination which
43
F. Carballo-Cruz / V. Costa / Tourism & Management Studies, 10(1), 2014, 37-45
the number of beds increased by 15.5%. The cultural heritage
of Oporto and the surrounding region, as well as the progressive
improvement of its tourist infrastructure, are the major assets
of the destination. This growing tourist attractiveness, in 2013,
resulted in Oporto and the Douro Valley being considered the
Best European Destination by the Lonely Planet. Also within the
tourism sector, cruise tourism is a segment which has proved
very dynamic in recent years. Over the past five years, Oporto
has witnessed a growing number of small-scale cruises and
cruisers in the Leixoes port. Between 2007 and 2012, the
number of passengers on these small-scale cruises practically
multiplied by five, exceeding 75,000. The completion of the
passenger station in the cruise terminal scheduled for late 2013
will further boost this tourist segment. In this context, it is
extremely important that Oporto will likely become a point of
boarding and/or departing for cruises. If that happens, cruises
would ensure additional traffic to Oporto Airport.
airports is not problematic and that the cessation of operations
due to lack of “favourable” conditions is part of its business
model. One way to mitigate this problem, at least partially, may
involve the establishment of competitive conditions for
attracting new airlines, including other LCC, by the airport
manager. This will increase the supply of routes and
destinations and promote higher levels of competition in the
airport.
Another source of growth for Oporto Airport is traffic with
origin or destination in Galicia. The lack of coordination of the
three Galician airports has limited the growth of their flight
supply and prevented the consolidation of low cost routes.
Additionally, the radial model of route management of some
airlines with Madrid-Barajas as a hub airport severely punishes
Galician passengers in their trips to European destinations.
These drawbacks, together with the crisis in Spain, have
resulted in an 18% decrease in the combined traffic of the three
Galician airports since 2007, which lost in cumulative terms
more than 850,000 passengers, 575,000 of which at Vigo
airport. In the same period, Oporto Airport increased its traffic
by over 52%, gaining cumulatively over 2,000,000 passengers.
It is worth noting in this regard that, in 2007, the combined
traffic of the three Galician airports exceeded by almost
750,000 passengers the traffic in Oporto (4,722,935 vs.
3,988,388), while, in 2012, it was lower by nearly 2,200,000
passengers (3,868,787 vs. 6,050,094). The attractiveness of
Oporto Airport for Galician passengers is growing. According to
airport management, in 2012 over 700,000 Galician passengers
used Oporto Airport, representing 12% of total traffic. The
outlook for growth in this market segment is very positive,
considering the good road access and the increasing provision
of public transport, linking several Galician cities and Oporto
Airport directly.
ACI Europe (2012). How regional airports link people, places and
products. Brussels: Airports Council International.
Besides opportunities for traffic growth and business
development, Oporto Airport faces important challenges. The
recent privatisation of the Portuguese airport manager poses
significant challenges both at political and regulatory levels.
The airports’ system went from a public monopoly to a private
monopoly, now owned by Vinci, a French infrastructure
operator. The underlying management model hampers the
implementation of individual commercial policies and
promotes cross subsidisation between airports so as to meet
public service obligations or support individual growth
strategies within the system. This way, certain airports may be
favoured over others, depending on the requirements of the
airlines with greater bargaining power or on operators’ shortterm performance. Political actors in the North should follow
the developments of ANA’s operation and management model
and airport regulation model, particularly as far as the
determination of airport fees is concerned.
ANA (2010). Relatório Anual de Estatística de Tráfego 2009. Lisboa: ANA
Aeroportos de Portugal.
The management of the high dependence on LCC, namely on
Ryanair, in the supply and demand of this airport, deserves
particular attention by the airport operator. Ryanair supplies
over 35% of airport seats and carries nearly 40% of airport
passengers. These large market shares ascribe Ryanair strong
market power and, therefore, great bargaining capacity to
obtain favourable agreements with the airport manager. This
poses significant risks in the future, especially since Ryanair has
shown in the past that the closure of its activity in certain
ANA (2013a). Relatório de Gestão e Contas 2012. Lisboa: ANA
Aeroportos de Portugal.
Ackowledgement
The first author acknowledges the financial support of FEDER funds
through the Operational Programme for Competitiveness Factors –
COMPETE and National Funds through FCT – Foundation for Science
and Technology within the Project PTDC/SEN-TRA/108522/2008.
References
ACI Europe (2013). Supportive & fully aligned EU policy required for
regional airports. Brussels: Airports Council International.
Alderighi, M., Cento, A., Nijkamp, P., & Rietveld, P. (2007). Assessment
of new hub-and-spoke and point-to-point airline network
configurations. Transport Reviews, 27(5), 529-549.
Almeida, C. R. (2011). The new challenges of tourism airports: The case
of Faro airport. Tourism & Management Studies, 7, 109-120.
ANA (2000). Plano Diretor Aeroporto Francisco Sá Carneiro 2000.
Lisboa: ANA Aeroportos de Portugal.
ANA (2006). Relatório de Gestão e Contas 2005. Lisboa: ANA Aeroportos
de Portugal.
ANA (2007a). Relatório Anual de Estatística de Tráfego 2006. Lisboa:
ANA Aeroportos de Portugal.
ANA (2007b). Plano Diretor Aeroporto Francisco Sá Carneiro 2007.
Lisboa: ANA Aeroportos de Portugal.
ANA (2008). Relatório Anual de Estatística de Tráfego 2007. Lisboa: ANA
Aeroportos de Portugal.
ANA (2009). Relatório Anual de Estatística de Tráfego 2008. Lisboa: ANA
Aeroportos de Portugal.
ANA (2011a). Relatório Anual de Estatística de Tráfego 2010. Lisboa:
ANA Aeroportos de Portugal.
ANA (2011b). Perfil do Passageiro de 2011. Lisboa: ANA Aeroportos de
Portugal.
ANA (2012a). Relatório Anual de Estatística de Tráfego 2011. Lisboa:
ANA Aeroportos de Portugal.
ANA (2012b). Caracterização do Perfil do Passageiro e Consumidor –
Verão IATA 2012. Lisboa: ANA Aeroportos de Portugal.
ANA (2012c). Infrastructure – Aeroporto Francisco Sá Carneiro. Lisboa:
ANA Aeroportos de Portugal.
ANA (2012d). Relatório de Tráfego, Dezembro de 2012 – AerOporto do
Oporto. Lisboa: ANA Aeroportos de Portugal.
ANA (2013b). Relatório de Sustentabilidade 2012. Lisboa: ANA
Aeroportos de Portugal.
Barrett, S. (2004). The sustainability of the Ryanair model. International
Journal of Transport Management, 2(2), 89-98.
Bieger, T. & Wittmer, A. (2006). Air transport and tourism: Perspectives
and challenges for destinations, airlines and governments. Journal of Air
Transport Management, 12, 40-46.
44
F. Carballo-Cruz / V. Costa / Tourism & Management Studies, 10(1), 2014, 37-45
Caballero, A., Losada, A. & Marrana, J. (2006). O Sistema Aeroportuário
do Eixo Atlântico. Vigo: Biblioteca dos Estudos Estratégicos, Eixo
Atlântico.
Ryanair (2013). Figura de rotas. Retrieved October, 12, 2013, from
http://www.ryanair.com/pt/destinos-a-baixo-preco
Starkie, D. (2012). European airports and airlines: evolving
relationships and the regulatory implications. Journal of Air Transport
Management, 21, 40-49.
Castillo-Manzano, J., Lopez-Valpuesta, L. & Gonzalez-Laxe, F. (2011). The
effects of the LCC boom on the urban tourism fabric: The viewpoint of
tourism managers. Tourism Management, 32(5), 1085-1095.
Coombs, T. (2011). Challenging times for airport investors: Trends in
airport traffic. Journal of Air Transport Management, 5(4), 306-310.
Skeels, J. (2005). Is airport growth a necessity or a luxury? Overall view
of market growth. Report Presented to ACI Annual Congress 2005,
Munich.
Donzelli, M. (2010). The effect of low-cost air transportation on the local
economy: Evidence from Southern Italy. Journal of Air Transport
Management, 16, 121-126.
Tribunal de Contas (2009). Auditoria temática às derrapagens em obras
públicas: Ampliação do AerOporto Francisco Sá Carneiro. Relatorio de
Auditoria nº 06/2009 AUDIT Processo 07/07, Lisboa.
Forsyth, P., Gillen, D., Müller, J. & Niemeier, H.-Martin. (2010). Airport
Competition: The European Experience. Surrey, UK: Ashgate Publishing, Ltd.
Warnock-Smith, D. & Potter, A. (2005). An exploratory study into
airport choice factors for European low-cost airlines. Journal of Air
Transport Management, 11(6), 388–392.
Graham, A. (2008). Managing Airports: An International Perspective (3d
Ed.). Oxford: Elsevier Butterworth-Heinemann.
Zuidberg, J. & Veldhuis, J. (2012). The role of regional airports in a future
transportation system. SEO-report nr. 2012-05. Retrieved September,
14, 2013, from http://www.seo.nl/en/page/article/the-role-ofregional-airports-in-a-future-transportation-system/.
Graham, A. (2013). Understanding the low cost carrier and airport
relationship: A critical analysis of the salient issues. Tourism
Management, 36, 66-76.
Graham, A. & Dennis, N. (2007). Airport traffic and financial
performance: a UK and Ireland case study. Journal of Transport
Geography, 15(3), 161-171.
Article history:
Submitted: 12 June 2013
Accepted: 30 November 2013
Graham, B. & Shaw, J. (2008). Low-cost airlines in Europe: reconciling
liberalization and sustainability. Geoforum, 39(3), 1439-1451.
INAC (2010). Evolução do Transporte Aéreo no AerOporto Francisco Sá
Carneiro (1990-2009). Lisboa: Instituto Nacional de Aviaçao Civil.
INE (2007). Anuário Estatístico da Região Norte 2006. Lisboa: Instituto
Nacional de Estatística.
INE (2010). Anuário Estatístico da Região Norte 2009. Lisboa: Instituto
Nacional de Estatística.
INE (2013a). Estatísticas do Turismo 2012. Lisboa: Instituto Nacional de
Estatística.
INE (2013b). Dormidas por País de Residência e Meses – TOP 10. Lisboa:
Instituto Nacional de Estatística.
IPDT (2012a). Perfil dos Turistas do Oporto e Norte Portugal 1º trimestre
de 2012. Oporto: Instituto de Planeamento e Desenvolvimento do
Turismo.
IPDT (2012b). Perfil dos Turistas do Oporto e Norte Portugal 2º trimestre
de 2012. Oporto: Instituto de Planeamento e Desenvolvimento do
Turismo.
IPDT (2012c). Perfil dos Turistas do Oporto e Norte Portugal 3º trimestre
de 2012. Oporto: Instituto de Planeamento e Desenvolvimento do
Turismo.
IPDT (2012d). Perfil dos Turistas do Oporto e Norte Portugal 4º trimestre
de 2012. Oporto: Instituto de Planeamento e Desenvolvimento do
Turismo.
O’Connell, J., & Williams, G. (2005). Passengers’ perceptions of low cost
airlines and full service carriers: A case study involving Ryanair, Aer
Lingus, Air Asia and Malaysia Airlines. Journal of Air Transport
Management, 11(4), 259-272.
Martínez-García, E. & Royo-Vela, M. (2010). Segmentation of low-cost
flights users at secondary airports. Journal of Air Transport
Management, 16(4), 234-237.
Pitt, M. & Brown, A. (2001). Developing a strategic direction for airports
to enable the provision of services to both network and low-fare
carriers. Facilities, 19(1/2), 52-60.
Robertson, J. A. W. (1995). Airports and economic regeneration. Journal
of Air Transport Management, 2, 81-88.
Ryan, C. & Birks, S. (2005). Passengers and low cost flights: evidence
from the Trans-Tasman routes. Journal of Travel and Tourism
Marketing, 19(1), 15-27.
45
Baixar