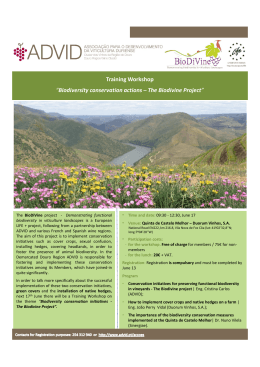
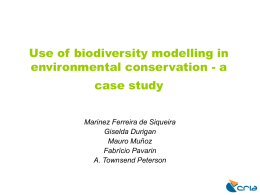
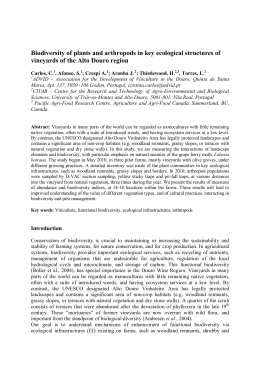
Diversity and Distributions, (Diversity Distrib.) (2008) 14, 78–86 Blackwell Publishing Ltd BIODIVERSITY RESEARCH Biodiversity surrogate groups and conservation priority areas: birds of the Brazilian Cerrado Míriam Plaza Pinto1,†, José Alexandre Felizola Diniz-Filho2*, Luis Mauricio Bini2, Daniel Blamires3,4 and Thiago Fernando L. V. B. Rangel1,5 1 Programa de Pós-Graduação em Ecologia e Evolução, ICB, Universidade Federal de Goiás, Goiânia, GO, Brazil, 2Departamento de Biologia Geral, ICB, Universidade Federal de Goiás, Goiânia, GO, Brazil, 3Programa de Pós-Graduação em Ciências Ambientais, Universidade Federal de Goiás, Goiânia, GO, Brazil, 4Unidade Universitária de Quirinópolis, Universidade Estadual de Goiás, Avenida Brazil Qd. 03, Lt. 01 s/n°. Conjunto Hélio Leão, 75860000 Quirinópolis, GO, Brazil, 5Department of Ecology and Evolutionary Biology, University of Connecticut, 75 North Eagleville Road, Unit 3043, Storrs, CT 06269-3043, USA *Correspondence: José Alexandre Felizola Diniz-Filho, Departamento de Biologia Geral, ICB, Universidade Federal de Goiás, Goiânia, GO, Brazil. E-mail: [email protected] †Present address: Programa de Pós-Graduação em Ecologia, Laboratório de Vertebrados, Departamento de Ecologia, Universidade Federal do Rio de Janeiro, C.P. 68020, 21941-590 Rio de Janeiro, RJ, Brazil ABSTRACT The choice of surrogates of biodiversity is an important aspect in conservation biology. The quantification of the coincidence in the spatial patterns of species richness and rarity between different groups and the vulnerability of groups are different approaches frequently considered to accomplish this task. However, a more appropriate approach is to verify the efficiency of priority networks selected using information from one group of organisms to capture the biodiversity of other groups. Using a deconstructive approach, the main purposes of this study were to evaluate the performance of some orders and families of birds in the Cerrado biome (a savanna-like biome) as surrogates of other bird groups, in a pairwise analysis, and to investigate the characteristics of these groups that predict the efficiency in representation of other groups. We used biogeographical data on bird orders or families with more than 10 species that occur in the Brazilian Cerrado. The best surrogate group was the Thamnophilidae. Moreover, this group is not the most specious, favouring further survey efforts that are necessary to verify the conservation value of areas at suitable scales. The majority of the species from this family are dependent on forest habitats, one of the characteristics that most influenced representativeness level, probably due to the spatial distribution of these habitats throughout the Brazilian Cerrado. Beta diversity patterns of the different groups also affected representativeness, and our analyses showed that the networks selected by a surrogate group will be more effective in the representation of other groups of species if their patterns of beta diversity (not richness) are correlated. Keywords Beta diversity, biodiversity, birds, efficiency, representativeness, reserve selection. INTRODUCTION Selection of priority areas for conservation can be defined as an optimization problem with the purpose to represent all the conservation targets cost-effectively (Cabeza & Moilanen, 2001). Nowadays, the optimization reserve selection problem is frequently solved using algorithms based on the concept of complementary (Margules et al., 1988; Howard et al., 1998; Araújo & Williams, 2000), which is a ‘measure of the extent to which an area, or set of areas, contributes unrepresented features to an existing area or set of areas’ (Margules & Pressey, 2000). At broad spatial scales, complementarity analyses can be useful to establish a first approximation of priority areas for conservation within the new framework of ‘conservation biogeography’ (Whittaker et al., 2005). However, data for species’ distributions 78 are frequently incomplete (Rondinini et al., 2006), and this problem have been recently called ‘Wallacean shortfall’ (see Tognelli, 2005; Whittaker et al., 2005; Bini et al., 2006). Good range data are frequently available only for a few species, so that it is common in conservation to use the information of a given group of species or conservation focal group as surrogate of biodiversity patterns in other (generally taxonomic defined) groups of species (Simberloff, 1998; Caro & O’Doherty, 1999; Andelman & Fagan, 2000; Moreno et al., 2007). The choice of these surrogates may be based on variable criteria, ranging from small groups of flagship or umbrella species up to patterns at higher levels in the biological hierarchy, such as species assemblages, habitat types, and landscape features (Margules & Pressey, 2000; Andelman & Fagan, 2000). Even though surrogate groups are frequently used, the criteria used to select them are not clearly justified (Araújo, 1999; Caro & O’Doherty, 1999; Tognelli, 2005). DOI: 10.1111/j.1472-4642.2007.00421.x © 2007 The Authors Journal compilation © 2007 Blackwell Publishing Ltd www.blackwellpublishing.com/ddi Biodiversity surrogate groups and priority areas The most common way to identify possible surrogate taxa is via the quantification of the relationships among the spatial patterns of species richness and rarity for different groups (Howard et al., 1998; van Jaarsveld et al., 1998; Lamoreux et al., 2006; Moreno et al., 2007). However, a high correlation may be not a sufficient evidence to judge the effectiveness of a taxon to indicate the relative conservation value of different areas regarding other groups of organisms (Su et al., 2004). On the other hand, if the groups studied have congruent patterns of complementarity, the priority areas selected by a group (surrogate, or focal) will result in an efficient representation of other target groups (Howard et al., 1998). Thus, a more appropriate test is to verify to what extent the network of priority areas selected using information for one group captures of the diversity of other taxonomic groups (Howard et al., 1998; Cabeza & Moilanen, 2001; Kati et al., 2004a). In this work, data on extents of occurrence of bird species in the Cerrado biome (recognized as a biodiversity hotspot by Myers et al., 2000) were used to select networks of priority areas based on the concept of complementarity. Following a ‘deconstructive’ approach (sensu Marquet et al., 2004), Cerrado birds were divided in 29 taxonomic groups (orders, and families in the case of Passeriformes). Biodiversity surrogates have different meanings depending on the author consulted (Caro & O’Doherty, 1999; Moreno et al., 2007). Here we verified how a network selected for a given focal group represented the species of other groups (targets), by means of an analysis of ‘cross-taxon congruence in patterns of complementarity’ (Howard et al., 1998). In a second step, we evaluated which characteristics of the focal groups tested can better explain their efficiency in representation of conservation targets. Table 1 Bird species richness in the Brazilian Cerrado according to the group order, and within the order Passeriformes, according to family. Classification based on Sibley & Monroe (1990). Groups that have more than 10 species (italicized) were tested as surrogate groups. Number of cells in the networks selected for each group is also shown. Order Struthioniformes Tinamiformes Craciformes Galliformes Anseriformes Piciformes Galbuliformes Trogoniformes Coraciiformes Cuculiformes Psittaciformes Apodiformes Trochiliformes Strigiformes Columbiformes Gruiformes Ciconiiformes Passeriformes METHODS Data A grid of 181 cells with a spatial resolution of 1° (Diniz-Filho et al., 2006; Pinto et al., 2007) was established, covering the area corresponding to the Brazilian Cerrado (Brazil, 1999), a biome located at the central region of this country. The ranges of 723 bird species that breed in this area (Silva, 1995) were mapped at the grid. Distribution maps used in this study were published in several sources (see Appendix S1 in Supplementary Material). Next, a presence/absence matrix of the 723 species in the 181 grid cells was constructed. Species were separated by orders and families following the classification of Sibley & Monroe (1990) (Table 1). Reserve selection Optimization routines based on the concept of complementarity (Vane-Wright et al., 1991; Cabeza & Moilanen, 2001) were applied to select networks of priority areas for each order that contained more than 10 species in the Cerrado list (Tinamiformes, Anseriformes, Piciformes, Galbuliformes, Cuculiformes, Psittaciformes, Trochiliformes, Strigiformes, Columbiformes, Gruiformes, and Ciconiiformes). Networks selected for groups with one, two, or three (until 10) species would be too small and therefore certainly inefficient to represent other bird groups. Our Total Family Tyrannidae Thamnophilidae Furnariidae Formicariidae Vireonidae Corvidae Muscicapidae Sturnidae Certhiidae Hirundinidae Passeridae Fringillidae Number of species 1 16 8 2 11 35 18 8 8 14 32 5 36 31 18 15 59 132 54 64 6 7 4 5 2 12 7 2 114 726 Number of cells selected 3 3 4 3 2 4 4 2 3 2 2 7 5 5 3 6 results were not affected by the exclusion of these small groups due to the pairwise approach that we followed (see below). For the Passeriformes, we used a higher taxonomic resolution, and families that contained more than 10 species were used (Tyrannidae, Thamnophilidae, Furnariidae, Certhiidae, Fringillidae). The Passeriformes were divided into families due to the large number of species in this order. Complementarity solutions were also obtained for all 723 bird species in the region as well. The simulated annealing algorithm in the SSM (Site Selection Module) routine of the software was used to find minimal networks that represent each species at least once (Possingham et al., 2000; see also Andelman et al., 1999). Two hundred runs and 10,000,000 iterations for each run were performed. There are multiple combination of cells that satisfy a given representation goal. Thus, we retained the first 100 solutions of SSM with the same smallest number of cells (‘near optimal solutions’). The relative importance of each cell was established using the © 2007 The Authors Diversity and Distributions, 14, 78–86, Journal compilation © 2007 Blackwell Publishing Ltd 79 M. P. Pinto et al. frequency in which it occurs in the alternative networks. This is an estimate of the irreplaceability of the cell (see Meir et al., 2004), measuring the likelihood of a given cell to ensure achievement of a set of conservation targets (Ferrier et al., 2000; Meir et al., 2004; Diniz-Filho et al., 2006). Measuring efficiency of bird groups We used the first 100 best networks (i.e. with minimum number of cells selected) established by SSM for each bird group to measure the efficiency of those networks in representing the diversity of other groups (those not used in the reserve selection process) and of all birds (Howard et al., 1998; Reyers et al., 2000; Moore et al., 2003; Kati et al., 2004b). So, each bird group is, at the same time, a focal group (when its network is being used to evaluate the representation of other bird groups) and a target group (sensu Hammond, 1995). The relative number of species of each target group that occurred in each of the 100 networks selected based on a focal group (number of species represented in the network/total number of species of that group) was used to evaluate the efficiency of this group. Thus, Rij was then defined as the mean efficiency of the network selected for the group i in representing the species of group j. Subsequently, the mean representation efficiency of surrogate group i (Ri) was estimated considering the mean of Rij values calculated for the different k groups. Characteristics of the surrogate groups In order to evaluate the characteristics of the potential focal groups that influenced their efficiency, the following variables were obtained for each bird group: total richness (in Cerrado), mean geographical range size (mean number of cells over all the species of a given group), mean body size (body length, data obtained from several sources, see Appendix S1 in Supplementary Material), proportion of species dependent on open habitats, proportion of species independent on specific habitats, and proportion of species dependent on forest habitats (following the classification scheme proposed by Silva, 1995). We also obtained, for each bird group, the estimate of beta diversity β given by [(R/αmax.) – 1]/[N – 1] (Harrison et al., 1992; Blackburn & Gaston, 1996) – being R the total number of species in the group, α the mean number of species in each cell, and N the number of cells. We evaluated different beta diversity indices, but only this one was used in the multiple regression models because all β measures were highly correlated with each other. Multiple regression models, obtained using the software (Spatial Analysis in Macroecology, Rangel et al., 2006), were used with the purpose of quantifying the relationships between these measures and the mean efficiency (Ri). Model selection procedures (see MacNally, 2000; Burnham & Anderson, 2002) were used to choose the most parsimonious explanations for efficiency, based on Akaike’s Information Criterion (AICc, second-order AIC, which is necessary for a small sample sizes). As recommended by Burnham & Anderson (2002; p. 71), AICc differences (∆i) were calculated over all candidate models in the set. Models plausibility decrease with increasing ∆i and therefore this quantity offers the level of empirical support 80 for a given model (see Burnham & Anderson, 2002; p. 70). Finally, ∆i values were also used to compute Akaike’s weight of each model (wi), which provides evidence that the model is actually the best explanatory model. These values of wi are usually standardized by their sum across all models evaluated, so they are dependent on the set of models used. An important advantage of using model selection criteria is that they permit inferences from more than one model, what is not possible when other traditional methods (i.e. fit maximization and null hypothesis testing) are used. In addition, model selection is especially valid for making inferences from observational data, when data are collected from complex systems (Johnson & Omland, 2004), as in our case. Patterns of beta diversity Jaccard’s similarity index (Legendre & Legendre, 1998) was used to measure similarity between the cells. The complement of this index shows how the places are different in term of species composition (Moore et al., 2003) and can also be loosely interpreted as a complementarity measure. Then, a symmetric matrix of the Jaccard’s coefficients (181 rows and 181 columns) was obtained for each group. The Mantel’s r coefficient for matrix comparison (Manly, 1997; Legendre & Legendre, 1998) was used to correlate these Jaccard pairwise matrices and to quantify how much the pattern of change in species composition between cells was correlated in the different groups. The patterns of associations among matrices (Mantel’s r) were synthesized by a dendrogram (; Legendre & Legendre, 1998). A polygonal relationship appears between pairwise Mantel’s correlation and efficiency, as well as between pairwise richness correlation and efficiency (see Results below). These relationships were tested using the software (Gotelli & Entsminger, 2006), with 5000 permutations. The basic idea of the routine to test for constraint envelopes in the ‘macroecology’ module of is to calculate the dispersion (σ2) among number of points counted in each quadrant of the bivariate 2-D space and compare this dispersion with a null distribution of this statistics constructed after data randomization. RESULTS Spatial variation in bird richness The spatial pattern in richness for all the birds that occur in the Cerrado (Fig. 1a) shows an increasing gradient from the northeast to the western region of the biome. The mean pairwise correlation between the richness of different bird groups was 0.34. The maximum value of correlation was found between the total bird richness and Tyrannidae richness (r = 0.97, P < 0.0001), and the minimum value was found between Galbuliformes and Gruiformes (r = –0.44, P < 0.0001; see Appendix S2 in Supplementary Material). Complementarity solutions and irreplaceability The networks selected for each group had different number of cells and spatial configurations (Table 1), as a consequence of the © 2007 The Authors Diversity and Distributions, 14, 78–86, Journal compilation © 2007 Blackwell Publishing Ltd Biodiversity surrogate groups and priority areas Figure 1 Spatial patterns in species richness of birds that reproduce in the Cerrado (a) and spatial patterns of irreplaceability (b) for all the birds from Cerrado, estimated as the frequency in which cells appeared in the 100 minimum solutions by SSM. different patterns of spatial distribution of species. The networks selected to represent all the birds from the Cerrado contained 15 cells. Eight of them occurred in all of the 100 solutions, being then completely irreplaceable (Fig. 1b). Efficiency The networks efficiencies of the different groups in representing the other bird groups (Rij) and all the bird diversity are shown in Table 2. The Tyrannidae, Thamnophilidae, Furnariidae, and Fringillidae represented on average more than 90% of all the birds species (a ‘subgroup to group’ approach; see Table 2). The networks selected for the Tinamiformes, Anseriformes, Galbuliformes, Cuculiformes, Strigiformes, Columbiformes, Gruiformes, Ciconiiformes, and Certhiidae were not efficient in representing all species of none of the bird groups. The following subgroups were 100% efficient in representing other subgroups (in parenthesis) diversity: Piciformes (Cuculiformes and Strigiformes), Psittaciformes (Strigiformes), Trochiliformes (Cuculiformes), Tyrannidae (Strigiformes, Gruiformes, and Certhiidae), Thamnophilidae (Cuculiformes and Strigiformes), Furnariidae (Cuculiformes and Strigiformes), and Fringillidae (Strigiformes). The variables more correlated with average efficiency (Ri) were proportion of species dependent of forest habitats (r = 0.8322; P = 0.0001), beta diversity (β, r = 0.7225; P = 0.0016), and mean range size (r = –0.7199; P = 0.0017). Among all the models estimated to predict the average efficiency of the subgroups (Table 3), the three best ones according to AIC values were those that included (i) richness and proportion of species dependent on forest habitats (wi = 0.378); (ii) richness, beta diversity, and proportion of species dependent on forest habitats (wi = 0.160); and (iii) richness, mean range and propor- tion of species dependent on forest habitats (wi = 0.111). In this case, the wi value is the evidence power of a given model (Burnham & Anderson, 2002), and in Table 3 only those models with wi higher or equal to 0.01 were presented. The importance of the different explanatory variables, estimated by the average wi of the models in which the variable was included, is presented in Table 4. Richness was the variable with the highest average wi. Despite the positive non-linear relationship between richness and mean efficiency (Fig. 2), networks selected for groups not so rich can be as efficient as those selected for the richest group. The highest correlation between the matrices of Jaccard’s coefficients was registered between Fringillidae and Tyrannidae (Mantel’s r = 0.93), and the lowest between Cuculiformes and Figure 2 Correlation between the richness and the mean efficiency (r = 0.57; P = 0.02) of the surrogate groups along the 16 bird groups tested as surrogate groups in Brazilian Cerrado. © 2007 The Authors Diversity and Distributions, 14, 78–86, Journal compilation © 2007 Blackwell Publishing Ltd 81 M. P. Pinto et al. Table 2 Efficiency of the different surrogate groups (first column) in relation to the other groups. (A) Tinamiformes, (B) Anseriformes, (C) Piciformes, (D) Galbuliformes, (E) Cuculiformes, (F) Psittaciformes, (G) Trochiliformes, (H) Strigiformes, (I) Columbiformes, (J) Gruiformes, (L) Ciconiiformes, (M) Tyrannidae, (N) Thamnophilidae, (O) Furnariidae, (P) Certhiidae, and (Q) Fringillidae. Ri indicates the average efficiency of each surrogate group over all the other groups. We must read, for example, ‘the network of the Tinamiformes (A) represent, in average, 0.80 (80%) of the Anseriformes’ (B) diversity. Numbers in bold indicate efficiencies higher than 90%. Surrogate group A B C D E F G H I J L M N O P Q Ri A B C D E F G H I J L M N O P Q 1.00 0.63 0.81 0.81 0.62 0.92 0.77 0.67 0.80 0.47 0.86 0.85 0.85 0.86 0.77 0.87 0.80 1.00 0.82 0.79 0.74 0.81 0.89 0.80 0.78 0.81 0.73 0.91 0.82 0.83 0.80 0.83 0.87 0.56 1.00 0.83 0.66 0.83 0.73 0.65 0.77 0.50 0.76 0.92 0.94 0.90 0.75 0.94 0.77 0.38 0.94 1.00 0.75 0.92 0.67 0.68 0.75 0.27 0.69 0.97 0.99 0.91 0.87 0.98 0.92 0.72 1.00 0.95 1.00 0.94 1.00 0.91 0.91 0.73 0.90 0.93 1.00 1.00 0.94 0.95 0.67 0.59 0.75 0.75 0.66 1.00 0.81 0.67 0.69 0.53 0.59 0.89 0.88 0.82 0.72 0.87 0.84 0.73 0.82 0.83 0.73 0.85 1.00 0.78 0.79 0.67 0.75 0.92 0.85 0.87 0.81 0.86 0.98 0.88 1.00 0.98 0.94 1.00 0.98 1.00 0.98 0.81 0.96 1.00 1.00 1.00 0.98 1.00 0.94 0.87 0.94 0.93 0.82 0.94 0.94 0.90 1.00 0.79 0.91 0.94 0.94 0.94 0.92 0.97 0.93 0.98 0.93 0.90 0.82 0.93 0.93 0.87 0.91 1.00 0.84 1.00 0.93 0.93 0.87 0.92 0.99 0.93 0.97 0.98 0.94 0.98 0.98 0.97 0.99 0.93 1.00 0.98 0.97 0.98 0.98 0.98 0.86 0.63 0.90 0.88 0.76 0.87 0.86 0.76 0.82 0.54 0.80 1.00 0.93 0.91 0.84 0.93 0.76 0.30 0.90 0.83 0.74 0.85 0.78 0.66 0.70 0.25 0.66 0.95 1.00 0.91 0.79 0.93 0.76 0.58 0.84 0.80 0.64 0.81 0.83 0.64 0.72 0.49 0.64 0.93 0.94 1.00 0.74 0.90 0.84 0.60 0.92 0.93 0.80 0.91 0.83 0.80 0.79 0.56 0.75 1.00 0.92 0.91 1.00 0.89 0.81 0.69 0.85 0.84 0.75 0.88 0.87 0.76 0.81 0.62 0.74 0.95 0.94 0.91 0.81 1.00 0.85 0.67 0.89 0.87 0.76 0.90 0.86 0.77 0.81 0.60 0.77 0.94 0.93 0.91 0.84 0.92 Figure 3 Correlation between the Mantel’s r and the efficiency of each bird group (a) and the correlation between richness correlation between groups and the efficiency of each bird group (b). The first figure contains a non-random pattern according to 5000 randomizations in (see text for details). Anseriformes (0.25). The average correlation was equal to 0.59 (see Appendix S3 in Supplementary Material). The relationship between Mantel’s r and mean efficiency created a significant envelope (Fig. 3a), with the points distributed in the left superior part of the graph. Dispersal of points in this 2-D space (σ2) was equal to 108 (P = 0.029 with 5000 randomizations in ECOSIM). Then, when the similarity between cells (Jaccard) differs between the groups compared (i.e. there is a low Mantel’s r), the efficiency can be low or high. When the groups have similar patterns of beta diversity (high Mantel’s r), the network selected for one group will represent most of the diversity of the other group. However, no relationship between richness correlation 82 (correlation between species richness of a pair of groups) and mean efficiency appears, with σ2 = 33.3 (P = 0.249 with 5000 randomizations) (Fig. 3b). Thus, in this case, high correlations between groups’ richness do not indicate that one will be a good surrogate for the other. DISCUSSION In this study, few groups showed coincident patterns in species richness. In any case, congruence in species richness may be an inadequate measure of the value of these groups as surrogates (Howard et al., 1998; Reyers et al., 2000). Measuring the ability of © 2007 The Authors Diversity and Distributions, 14, 78–86, Journal compilation © 2007 Blackwell Publishing Ltd Biodiversity surrogate groups and priority areas Table 3 Regression models evaluating mean efficiency of the surrogate groups. Only the models with wi ≥ 0.01 are included. Predictors: (1) richness, (2) mean range, (3) mean body size, (4) meta diversity (β), (5) proportion of species dependent on open habitats, (6) proportion of species independent of specific habitats, and (7) proportion of species dependent on forest habitats. Horizontal lines separated the different models. Bold values indicate the highest wi values. Predictors R2 Intercept Standardized beta Beta P AICc ∆ wi 7 0.692 0.676 0.832 0.321 0.000 −85.652 4.180 0.047 1 2 0.727 0.960 0.463 −0.643 0.001 −0.002 0.008 0.000 −83.904 5.928 0.020 1 7 0.811 0.656 0.360 0.729 0.001 0.289 0.014 0.000 −89.832 0.000 0.378 2 7 0.705 0.752 −0.178 0.693 0.000 0.275 0.475 0.014 −82.672 7.160 0.011 3 7 0.736 0.767 −0.275 0.652 −0.002 0.258 0.170 0.005 −84.442 5.390 0.026 4 7 0.751 0.664 0.332 0.624 23.198 0.247 0.081 0.004 −85.956 3.876 0.054 1 2 5 0.793 0.949 0.441 −0.453 −0.323 0.001 −0.001 −0.141 0.007 0.019 0.077 −83.959 5.873 0.020 1 2 7 0.833 0.755 0.375 −0.235 0.540 0.001 −0.001 0.214 0.011 0.242 0.019 −87.386 2.446 0.111 1 3 7 0.821 0.702 0.323 −0.136 0.650 0.000 −0.001 0.258 0.036 0.447 0.002 −86.277 3.555 0.064 1 4 7 0.840 0.650 0.308 0.226 0.602 0.000 15.794 0.239 0.032 0.170 0.002 −88.106 1.726 0.160 3 4 7 0.781 0.731 −0.199 0.281 0.526 −0.001 19.664 0.208 0.306 0.145 0.021 −83.058 6.774 0.013 1 3 4 7 0.844 0.683 0.287 −0.095 0.209 0.556 0.000 0.000 14.629 0.220 0.051 0.581 0.224 0.009 −83.217 6.615 0.014 1 2 4 7 0.842 0.693 0.327 −0.097 0.173 0.554 0.000 0.000 12.068 0.219 0.041 0.713 0.437 0.011 −82.979 6.853 0.012 a network selected by using data from a group (potentially surrogate) in representing the biodiversity in other taxa may be a more appropriate measure of the efficiency of that group as a surrogate (Howard et al., 1998; Reyers et al., 2000; Kati et al., 2004b). Thus, the networks selected by some bird groups (Tyrannidae, Thamnophilidae, Furnariidae, and Fringillidae) were very efficient for the representation of other groups or for the representation all the birds considered. These groups encompass species with high proportion of species dependent on forest habitats and with high beta diversity. On the other hand, the networks of the groups with large ranges were less efficient. Probably, the identification of the characteristics that predicts a good surrogate group was the main message of this study. Following this line of reasoning, among all the models, the one that considered richness and proportion of species dependent on forest habitats had the highest Akaike weight. A model that includes richness is important due to the larger number of cells that are needed to represent all the species of the richer groups (Grenyer et al., 2006). Consequently, networks with more areas will better represent bird groups’ diversity than smaller networks (see Fig. 2). The proportion of species dependent on forest habitats was an important predictor of surrogacy, although explanation for this result is not straightforward. Another model with relatively high Akaike weight incorporated richness, beta diversity, and the proportion of species dependent on forest habitats as explanatory variables. Beta © 2007 The Authors Diversity and Distributions, 14, 78–86, Journal compilation © 2007 Blackwell Publishing Ltd 83 M. P. Pinto et al. Table 4 Measure of the importance of different variables (summing the wi values of all the models that include the variable). Number of models where the variable was included is indicated in the third column. Predictors: (1) richness, (2) mean range, (3) mean body size, (4) beta diversity (β), (5) proportion of species dependent on open habitats, (6) proportion of species independent of specific habitats, and (7) proportion of habitat dependent on forest habitats. Variable Importance Number of models 1 2 3 4 5 6 7 0.80 0.21 0.14 0.27 0.04 0.02 0.93 19 19 18 18 8 7 18 diversity is a measure that reveals spatial changes in species composition (Blackburn & Gaston, 1996). This measure is directly related to the complementarity concept. A high beta diversity value indicates cells with different species compositions and high complementarity values (Moore et al., 2003), and larger networks are necessary to represent all the species of the surrogate group. The last model with a relatively high Akaike weight is the one that incorporates richness, mean range, and proportion of species dependent on forest habitats. Surrogate groups formed by species with small ranges and with low coincidence of their ranges (Ryti, 1992; Williams et al., 2000, 2006; Tognelli, 2005) will have larger networks with high irreplaceable values. In general, these characteristics are related to each other because groups with high beta diversity are also composed by species with restricted ranges that are not spatially coincident. Ensuring reservation of the regions harbouring these species will also capture diversity in species with widely distributed and with overlapping ranges. Beyond the positive relationship found between richness and efficiency, high levels of efficiency were found not only for very rich surrogate groups (Fig. 2). The efficiency of the Thamnophilidae, with 54 species, was as high (0.9261) as the one of the Tyrannidae (0.9433), which contains 132 species. Thus, the Thamnophilidae is tentatively suggested here as the best surrogate group to represent all other Cerrado bird groups, since inventory efforts for this group will be smaller than other groups with higher species richness, and most of the species of this group are dependent on forest habitats (83%), an important characteristic of surrogate groups as well. A high similarity in the patterns of spatial turnover in species composition was found only for some groups (e.g. Fringillidae and Tyrannidae). Different patterns in beta diversity of groups affect negatively the efficiency in the representation (Sætersdal et al., 2003). The relationship found between the similarity in the pattern of beta diversity between groups and the efficiency of the surrogate groups (Fig. 3a) corroborates this affirmation. On the other hand, a group richness may be highly correlated with other group richness, but the first group is not necessarily a good surrogate for the second one, as demonstrated in the relationship 84 between richness correlation between groups and efficiency (Fig. 3b). We found in this study that reserve networks of one surrogate group will be more efficient in representing species of other groups if their spatial patterns of beta diversity are highly correlated. Thus, our analyses showed that richness correlations should be used cautiously when the purpose is to identify surrogate groups and that, in this case, spatial patterns of beta diversity are a more important attribute. Efficiency in representation was probably overestimated because we used range data (Rondinini et al., 2006). Thamnophilidae was the best surrogate group in our evaluation. Survey efforts that are necessary to verify the conservation value of areas at suitable scales should be concentrated in surrogate groups. But surrogate groups can be constituted not just of similar taxonomic species, but also of species that share important characteristics that explain efficiency. ACKNOWLEDGEMENTS We thank José Ferrer-Paris and two anonymous reviewers for many comments that improved the manuscript. MPP/DB and JAFDF/LMB are supported by doctoral and researcher CNPq fellowships, respectively. TFLVBR is supported by a CAPES/ Fulbright fellowship. This project is part of a PRONEX program of CNPq and SECTEC-GO (proc. 23234156). REFERENCES Andelman, S.J. & Fagan, W.F. (2000) Umbrellas and flagships: efficient conservation surrogates or expensive mistakes. Proceedings of the National Academy of Sciences USA, 97, 5954– 5959. Andelman, S., Ball, I., Davis, F. & Stoms, D. (1999) SITES v. 1.0: An analytical toolbox for designing ecoregional conservation portfolios. Technical report, The Nature Conservancy. http:// www.biogeog.ucsb.edu/projects/tnc/toolbox.html. Araújo, M.B. (1999) Distribution patterns of biodiversity and the design of a representative reserve network in Portugal. Diversity and Distributions, 5, 151–163. Araújo, M.B. & Williams, P.H. (2000) Selecting areas for species persistence using occurrence data. Biological Conservation, 96, 331–345. Bini, L.M., Diniz-Filho, J.A.F., Rangel, T.F.L.V.B., Bastos, R.P. & Pinto, M.P. (2006) Challenging Wallacean and Linnean shortfalls: knowledge gradients and conservation planning in a biodiversity hotspot. Diversity and Distributions, 12, 475– 482. Blackburn, T.M. & Gaston, K.J. (1996) The distribution of bird species in the New World: patterns in species turnover. Oikos, 77, 146–152. Brasil (1999) Ações prioritárias para a conservação da biodiversidade do Cerrado e Pantanal. MMA/Funatura/Conservation International/Biodiversitas/Unb. Brasília, DF, Brazil. Burnham, K.P. & Anderson, D.R. (2002) Model selection and multimodel inference: a practical information-theoretic approach. Springer, New York. © 2007 The Authors Diversity and Distributions, 14, 78–86, Journal compilation © 2007 Blackwell Publishing Ltd Biodiversity surrogate groups and priority areas Cabeza, M. & Moilanen, A. (2001) Design of reserve networks and the persistence of biodiversity. Trends in Ecology & Evolution, 16, 242–248. Caro, T.M. & O’Doherty, G. (1999) On the use of surrogate species in conservation biology. Conservation Biology, 13, 805 –814. Diniz-Filho, J.A.F., Bini, L.M., Pinto, M.P., Rangel, T.F.L.V.B., Carvalho, P. & Bastos, R.P. (2006) Anuran species richness, complementarity and conservation conflicts in Brazilian Cerrado. Acta Oecologica, 29, 9–15. Ferrier, S., Pressey, R.L. & Barrett, T.W. (2000) A new predictor of irreplaceability of areas for achieving a conservation goal, its application to real-world planning, and a research agenda for further refinement. Biological Conservation, 93, 303–325. Gotelli, N.J. & Entsminger, G.J. (2006) EcoSim: Null model software for ecologists. Version 7. Acquired Intelligence Inc. & Kesey-Bear. Jericho, VT 05465. http://garyentsminger.com/ ecosim.htm. Grenyer, R., Orme, C.D.L., Jackson, S.F., Thomas, G.H., Davies, R.G., Davies, T.J., Jones, K.E., Olson, V.A., Ridgely, R.S., Rasmussen, P.C., Ding, T.-S., Bennett, P.M., Blackburn, T.M., Gaston, K.J., Gittleman, J.L. & Owens, I.P.F. (2006) Global distribution and conservation of rare and threatened vertebrates. Nature, 444, 93–96. Hammond, P.M. (1995) Practical approaches to the estimation of the extent of biodiversity in speciose groups. Biodiversity – measurement and estimation (ed. by D.L. Hawksworth), pp. 119–136. Chapman & Hall, London. Harrison, S., Ross, S.J. & Lawton, J.H. (1992) Beta diversity on geographic gradients in Britain. Journal of Animal Ecology, 61, 151–158. Howard, P.C., Viskanic, P., Davenport, T.R.B., Baltzer, M., Dickinson, C.J., Lwanga, J.S., Matthews, R.E. & Balmford, A. (1998) Complementarity and the use of indicator groups for reserve selection in Uganda. Nature, 394, 472–475. van Jaarsveld, A.S., Freitag, S., Chown, S.L., Muller, C., Koch, S., Hull, H., Bellamy, C., Kruger, M., Endrody-Younga, S., Mansell, M.W. & Scholtz, C.H. (1998) Biodiversity assessments and conservation strategies. Science, 279, 2106–2108. Johnson, J.B. & Omland, K.S. (2004) Model selection in ecology and evolution. Trends in Ecology & Evolution, 19, 101–108. Kati, V., Devillers, P., Dufrêne, M., Legakis, A., Vokou, D. & Lebrun, P. (2004a) Hotspots, complementarity or representativeness? Designing optimal small-scale reserves for biodiversity conservation. Biological Conservation, 120, 471–480. Kati, V., Devillers, P., Dufrêne, M., Legakis, A., Vokou, D. & Lebrun, P. (2004b) Testing the value of six taxonomic groups as biodiversity indicators at a local scale. Conservation Biology, 18, 667–675. Lamoreux, J.F., Morrison, J.C., Ricketts, T.H., Olson, D.M., Dinerstein, E., McKnight, M.W. & Shugart, H.H. (2006) Global tests of biodiversity concordance and the importance of endemism. Nature, 440, 212–214. Legendre, P. & Legendre, L. (1998) Numerical Ecology, 2th edn. Elsevier, Amsterdam. MacNally, R. (2000) Regression and model-building in conservation biology, biogeography and ecology: The distinction between – and reconciliation of – ‘predictive’ and ‘explanatory’ models. Biodiversity and Conservation, 9, 655–671. Manly, B.F.J. (1997) Randomization, bootstrap and Monte Carlo methods in biology. Chapman & Hall, London. Margules, C.R., Nicholls, A.O. & Pressey, R.L. (1988) Selecting networks of reserves to maximise biological diversity. Biological Conservation, 43, 63–76. Margules, C.R. & Pressey, R.L. (2000) Systematic planning for biodiversity conservation. Nature, 405, 243–253. Marquet, P., Fernández, M., Navarrete, S.A. & Valdovinos, C. (2004) Diversity emerging: towards a deconstruction of biodiversity patterns. Frontiers of biogeography: new directions in the geography of nature (ed. by M.V. Lomolino and L.R. Heaney), pp. 191–209. Sinauer, Sunderland, Massachusetts. Meir, E., Andelman, S. & Possingham, H.P. (2004) Does conservation planning matter in a dynamic and uncertain world? Ecology Letters, 7, 615–622. Moore, J.L., Balmford, A., Brooks, T., Burgess, N.D., Hansen, L.A., Rahbek, C. & Williams, P.H. (2003) Performance of sub-Saharan vertebrates as indicator groups for identifying priority areas for conservation. Conservation Biology, 17, 207–218. Moreno, C.E., Pineda, E., Escobar, F. & Sánchez-Rojas, G. (2007) Shortcuts for biodiversity evaluation: a review of terminology and recommendations for the use of target groups, bioindicators and surrogates. International Journal of Environment and Health, 1, 71–86. Myers, N., Mittermeier, R.A., Mittermeier, C.G., Fonseca, G.A.B. & Kent, J. (2000) Biodiversity hotspots for conservation priorities. Nature, 403, 853–858. Pinto, M.P., Mathias, P.C., Blamires, D., Diniz-Filho, J.A.F. & Bini, L.M. (2007) Selecting priority areas to conserve psittacines in the Brazilian cerrado: minimizing human-conservation conflicts. Bird Conservation International, 17, 13–22. Possingham, H., Ball, I. & Andelman, S. (2000) Mathematical methods for identifying representative reserve networks. Quantitative methods for conservation biology (ed. by S. Ferson and M. Burgman), pp. 291–306. Springer, New York. Rangel, T.F.L.V.B., Diniz-Filho, J.A.F. & Bini, L.M. (2006) Towards an integrated computational tool for spatial analysis in macroecology and biogeography. Global Ecology and Biogeography, 15, 321–327. Reyers, B., van Jaarsveld, A.S. & Krüger, M. (2000) Complementarity as a biodiversity indicator strategy. Proceedings of the Royal Society of London Series B, Biological Sciences, 267, 505–513. Rondinini, C., Wilson, K.S., Boitani, L., Grantham, H. & Possingham, H.P. (2006) Tradeoffs of different types of species occurrence data for use in systematic conservation planning. Ecology Letters, 9, 1136–1145. Ryti, R.T. (1992) Effect of focal taxon on the selection of nature reserves. Ecological Applications, 2, 404–410. Sætersdal, M., Gjerde, I., Blom, H.H., Ihlen, P.G., Myrseth, E.W., Pommeresche, R., Skartveit, J., Solhøy, T. & Aas, O. (2003) Vascular plants as a surrogate species group in complementary site selection for bryophytes, macrolichens, spiders, carabids, staphylinids, snails, and wood living polypore fungi in a northern forest. Biological Conservation, 115, 21–31. © 2007 The Authors Diversity and Distributions, 14, 78–86, Journal compilation © 2007 Blackwell Publishing Ltd 85 M. P. Pinto et al. Sibley, C.G. & Monroe, B.L. Jr (1990) Distribution and taxonomy of birds of the world. Yale University Press, New Haven and London. Silva, J.M.C. (1995) Birds of Cerrado region, South America. Steenstrupia, 21, 69–92. Simberloff, D. (1998) Flagships, umbrellas, and keystones: is singlespecies management passé in the landscape era? Biological Conservation, 83, 247–257. Su, J.C., Debinski, D.M., Jakubauskas, M.E. & Kindscher, K. (2004) Beyond species richness: community similarity as a measure of cross-taxon congruence for coarse-filter conservation. Conservation Biology, 18, 167–173. Tognelli, M.F. (2005) Assessing the utility of indicators groups for the conservation of South American terrestrial mammals. Biological Conservation, 121, 409–417. Vane-Wright, R.I., Humphries, C.J. & Williams, P.H. (1991) What to protect? Systematics and the agony of choice. Biological Conservation, 55, 235–254. Whittaker, R.J., Araújo, M.B., Jepson, P., Ladle, R.J., Watson, J.E.M. & Willis, K.J. (2005) Conservation biogeography: assessment and prospect. Diversity and Distributions, 11, 3–23. Williams, P.H., Burgess, N. & Rahbek, C. (2000) Flagship species, ecological complementarity and conserving the diversity of mammals and birds in sub-Saharan Africa. Animal Conservation, 3, 249–260. 86 Williams, P., Faith, D., Manne, W., Sechrest, W. & Preston, C. (2006) Complementarity analysis: mapping the performance of surrogates for biodiversity. Biological Conservation, 128, 253–264. SUPPLEMENTARY MATERIAL The following supplementary material is available for this article: Appendix S1 Bibliographic sources used to generate the distribution maps and body length information. Appendix S2 Pearson’s correlation coefficients among species richness. Appendix S3 Dendrogram from an clustering upon the Mantel’s r estimated between the Jaccard matrices of the different groups. This material is available as part of the online article from: http://www.blackwell-synergy.com/doi/abs/10.1111/j.14724642.2007.00421.x (This link will take you to the article abstract). Please note: Blackwell Publishing is not responsible for the content or functionality of any supplementary materials supplied by the authors. Any queries (other than missing material) should be directed to the corresponding author for the article. © 2007 The Authors Diversity and Distributions, 14, 78–86, Journal compilation © 2007 Blackwell Publishing Ltd
Download