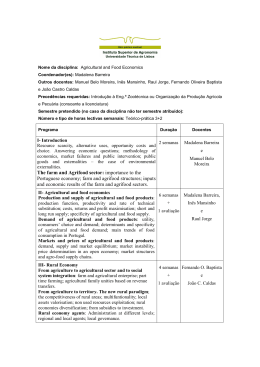
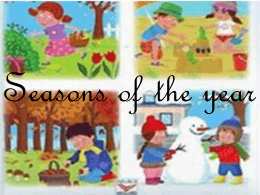
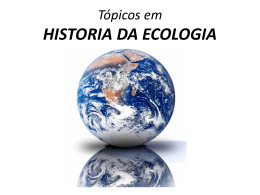
 Anais do I Simpósio Internacional de Ecologia
35 anos de Pós-graduação em Ecologia no Brasil
23 a 26 de outubro de 2011, São Carlos – SP, Brasil. A QUALITATIVE APPROACH TO ASSESS THE IMPACT OF PESTICIDE
USE ON ECOSYSTEM SERVICE OF POLLINATION
Adriano Souza; Gustavo Marques Figueiredo Leite; Isabela G. de Sá; Paulo Salles
Pós-Graduação em Ecologia, Universidade de Brasília
[email protected]
RESUMO
Pouca atenção tem sido dada à importância dos polinizadores e do serviço que
prestam para manter o meio ambiente e atender necessidades humanas de alimentos
e matérias primas. O serviço prestado pelos polinizadores nativos é valioso, mas a
abundância de abelhas nativas vem diminuindo devido à intensificação da agricultura e
à utilização de pesticidas. O objetivo deste modelo é demonstrar o papel da
polinização e polinizadores como prestadores de serviços do ecossistema na
produção agrícola e como o controle de pragas baseados em pesticidas afetam este
importante serviço ecológico. O modelo foi construído com técnicas de raciocínio
qualitativo, utilizando-se o software DynaLearn (www.dynalearn.eu). Nesta abordagem
de modelagem, destacam-se representações qualitativas de funções matemáticas
capazes de tornar explícitas relações causais, e a abordagem composicional, segundo
a qual fragmentos semi independentes de modelo são automaticamente combinados
para construir modelos de simulação progressivamente mais complexos. De maneira
geral, simulações com o modelo mostram o efeito da remoção da cobertura florestal
em ambientes naturais perto de terras agrícolas, nas quais se usam pesticidas no
controle de pragas, tal que a diminuição do número de árvores e aumento do uso de
pesticidas afetarão diretamente a quantidade de polinizadores.São demonstradas
situações em que a redução do número de abelhas pode, eventualmente, levar todo o
sistema ao colapso e se tornar incapaz de produzir. Este modelo pode ser usado como
como ferramenta de apoio à tomada de decisão ou a planejamento estratégico, para
fins educacionais, ou ser reutilizado para criar composicionalmente modelos de
simulação em que a polinização é parte de fenômenos mais complexos.
ABSTRACT
Little attention has been given to the importance of pollinators and the service they
provide in maintaining the environment functioning and human needs for food and raw
materials. The service provided by native pollinators is valuable but the abundance of
native bees has been declining due to agricultural intensification and pesticide use. The
goal of this model is to demonstrate the role of pollination and pollinators as ecosystem
services providers in agricultural production and how the plague control based on
pesticides affects this important ecological service. The model was built using
Qualitative Reasoning techniques, and implemented in the DynaLearn workbench
software (www.dynalearn.eu). In this modelling approach the main features include
qualitative representations of mathematical functions that render explicit causal
relations, and the compositional modelling, in which quasi independent model
fragments are automatically combined to build up simulation models of increasing
complexity. Simulations with the model show the effects of forest cover removal in
natural environments near agricultural lands, and the use of pesticides to pest control
on the amount of pollinators. Situations are shown in which reduction in the amount of
bees lead the whole system to collapse and no longer be able to produce, as well as
situations in which conservationist measures contribute for the bee populations to
increase and, as a consequence, the production also increases. This model can be
used as a reference model for stakeholders to use as decision making or strategy
planning tool, for educational purposes, or be re-used to compositionally create other
simulation models in which pollination is part of more complex phenomena.
920 Anais do I Simpósio Internacional de Ecologia
35 anos de Pós-graduação em Ecologia no Brasil
23 a 26 de outubro de 2011, São Carlos – SP, Brasil. INTRODUCTION
Little attention has been given to the importance of pollinators and the service they
provide in maintaining the environment functioning and human needs for food and raw
materials. Recent biodiversity inventory suggests that about 90% of all flowering plants
depend on birds, bats, insects, and other animal species to assist in delivering the
pollen they need to produce seeds, and pollinators are essential for about 35% of
global crop production (Klein et al., 2006). At least one-third of the crops used for
human needs rely on animal pollinators for successful reproduction. The annual value
of this ecological service is estimated to be US$ 40 billion.
For decades, biologists have been worried about declining populations of both wild and
domesticated pollinators. Many factors contribute to pollinator disappearance, including
habitat loss, climate change, introduction of exotic species, and the spread of diseases,
but one of the most important threats is the indiscriminate use of pesticides that
eliminate beneficial species along with the pests they are intended to target.
A great deal of attention has been focused recently on honey bees. The service
provided by native pollinators is valuable to humanity but the abundance of native bees
has declined due to agricultural intensification and pesticide use. These insects not
only make honey, but they play a vital role in fertilizing crops. In fact, their importance
spreading pollen is worth at least 100 times the value of the honey they make. Beepollinated foods include squash, tomatoes, peppers, apples, and pears. For instance,
California almond industry alone is worth $2 billion annually and relies on over 1 million
honey bees hives for cross-pollination (Ratnieks and Carreck, 2010). Some farmers
pay commercial beekeepers to bring hives to their fields to pollinate crops (Klein et al.,
2006). The increase in US agricultural yield and quality production achieved through
pollination by honey bees alone - was $9.3 billion in 1989 and was $14.6 billion in 2000
(a 36.3 percent increase) (Morse and Calderone, 2000).
Education, among other things, is required to change this situation and increase
awareness on the importance of ecosystem services. Allen-Wardell et al. (1998)
identified the need for focussing at primary, secondary, and higher education levels to
show how pollination services benefit society. The goal of the model described in this paper
is to demonstrate the role of pollination and pollinators as ecosystem services providers in
agricultural production and how the use of enemies control based on pesticides affect this
important ecological service.
The key issues and concepts involving in pollination process are the following: (1)
Pollination is an important process that involves the transfer of pollen among flowers
mediated by the wind, the water and animals, mostly insects. (2) Pollinator
disappearance can be caused by habitat loss, climate change, and introduction of
exotic species, the spread of diseases and the use of pesticides. (3) As farmers use
pesticides to fight pests in agriculture, they involuntarily kill pollinators and, because of
that, they cause a decrease in their own production. (4) After a certain level of
pollinator loss, agriculture enters in serious trouble, with significant productivity
reduction and low revenue.
MODELLING APPROACH AND IMPLEMENTATION
The model was built using Qualitative Reasoning techniques, which has been
successfully used to model ecological systems (see the special issue of Ecological
Informatics on Qualitative Reasoning, volume 4, issues 5-6, pages 261-412,
November-December 2009). The ontology provided by the Qualitative Process Theory
(QPT) (Forbus, 1984) was used to describe processes as a mechanism that drives the
921 Anais do I Simpósio Internacional de Ecologia
35 anos de Pós-graduação em Ecologia no Brasil
23 a 26 de outubro de 2011, São Carlos – SP, Brasil. dynamics of the system. An important advantage of Qualitative Reasoning consists of
the ability to capture both systems’ structural and behavioural information, including the
notion of causality.
To implement the model it was used the DynaLearn workbench software
(www.dynalearn.eu), which is currently being tested and evaluated. DynaLearn
provides 6 different modelling environment or layout so called learning spaces (LS),and
each of them has different number of QPT modelling primitives of increasing
complexity (Liem et al., 2009). In the most complex learning space (LS6), it has
basically the same reasoning functionalities as Garp3 (Bredeweg et al., 2009; visit
www.garp3.org). Concepts that can be reusable knowledge are captured in model
fragments. These model fragmentas are further combined by means of a technique
called compositional modelling (Falkenhainer and Forbus, 1991). DynaLearn provides
two different types of causal modelling primitives: direct influences (I+ and I–) and
proportionalities (P+ and P–), allowing for representation of feedback loops. A more
detailed discussion can be found in Salles et al. (2010).
Model ingredients
To define what elements should be considered to include or exclude from the model is
a fundamental step of modelling process. That depends on granularity, refinement and
goals of the model. In this modelling approach the main ingredients used to build
DynaLearn models are: entities (objects of the system modelled); quantities (variables
of each entity) and quantity spaces (a range of possible qualitative values of each
quantity). In Table 1 there is a description of model ingredients selected for the model.
Table 1. Entities, quantities and quantity spaces involved in the Introduction of non-native spp
model.
Entity
Quantity
Quantity Space
Investment
{Zero, Low, Medium, High}
Agricultural production
{Zero, Low, Medium, High}
Revenue
{Zero, Low, Medium, High}
Pesticide use
{Zero, Low, Medium, High}
Ecological service
Deforestation rate
Pollination
{Zero, Plus}
{Zero, Plus}
Native bee
Number of
{Zero, Low, Medium, High}
Number of
{Zero, Low, Medium, High}
Seed mortality
{Zero, Plus}
Seed
{Zero, Low, Medium, High}
Human activity
Plant
922 Anais do I Simpósio Internacional de Ecologia
35 anos de Pós-graduação em Ecologia no Brasil
23 a 26 de outubro de 2011, São Carlos – SP, Brasil. RESULTS AND DISCUSSION
Scenarios and simulations
Scenarios represent initial situations, including configurations of the system of interest,
and initial values of the quantities. The most complete scenario in this work is shown in
Figure 1.
Investiment
Zlmh
High
Medium
Low
Zero
Takes benefit from
Provided by
Human population
Human population
Ecological service
Ecological service
Human activity
Human activity
Pollination
Ecosystem
Ecosystem
Has
Zp
Plus
Zero
Agricultural production
Zlmh
Deforestation rate
High
Medium
Zp
Pesticide use
Low
Plus
Zero
Zlmh
Zero
High
Medium
Low
Zero
Revenue
Is composed of
Plant
Tree
Native bee
Native bee
Zlmh
High
Medium
Low
Zero
Is composed of
Number of
Number of
Zlmh
High
Medium
Low
Zero
Zlmh
High
Medium
Low
Zero
Seed
Zlmh
High
Medium
Low
Zero
Seed mortality
Zp
Plus
Zero
Figure 1. Scenario “Sce02 High agricultural production effects” with initial values.
The full simulation of this scenario presents a behaviour graph with 10 states (Figure
2). This simulation shows the effect of forest cover removal and increased use of
pesticides. The path selected in this simulation pass through following states: [2 → 3 →
4 → 5 → 6 → 7 → 8 → 9 → 10]. A diagram showing the causal dependencies in the
model is in the Figure 3.
1
2
4
6
8
3
5
7
9
10
Figure 2. State graph – sce02 high agricultural production effects.
Figure 3 shows that due to pesticide use and reduction in the number of trees, the
number of native bees decreases affecting indirectly the pollination ecosystem service,
which is related with number of bees by direct proportionality [P+(Pollination, Number
of)]. Despite they are not related by proportionalities, reduction in pollination leads to
decrease the number of seeds [I+(Seed, Pollination)], because the last one is the result
of difference between amount of fecunded seeds (Pollination) and the amount of dead
seeds (Seed mortality). Reduction in number of bees leads the number of fecunded
seeds to change in the same direction [P+(Pollination, Number of (bees))], that on the
other hand determine agricultural production and revenue to decrease.
923 Native bee
Anais do I Simpósio Internacional de Ecologia
35 anos de Pós-graduação em Ecologia no Brasil
23 a 26 de outubro de 2011, São Carlos – SP, Brasil. Ecological service
Number of
Human activity
Pollination
Pesticide use
Seed
Revenue
Tree
Seed mortality
Investiment
Agricultural production
Deforestation rate
Number of
Figure 3. Causal model from State 10 – sce02 high agricultural production.
The value history diagram obtained from the simulation of this scenario can be seen in
Figure 4. The reduction in number of fecunded seeds is propagated to revenue,
investment and agricultural production by qualitative proportionalities [P+(Revenue,
Seed), P+(Investment, Revenue), P+(Agricultural production, Investment)], making
these variables to achieve their smallest value - Zero - in the last state.
Reduction in agricultural production cause pesticide use and deforestation rate
[P+(Pesticide use, Agricultural production), P+(Deforestation rate, Agricultural
production)] to be reduced, closing the feedback cycle in state 10 in which use of
pesticide, deforestation and agricultural production tend to Zero value, which allow
reestablishment of number of bees to Medium value.
The model shows an explicit representation of causes and effects involved in
pollination and its impact on agricultural production improving the understanding of how
the system works. As Allen-Wardell et al. (1998) pointed out, there is a need of better
understanding the relationships among pollinator diversity, pollinator abundance, and
changes in crop yields.
An important remark made by Kremen et al. (2002) is that restoring pollination services
for agriculture could also benefit wild plants and thereby promote conservation of
biodiversity across the agro-natural landscape. Adding these informations into the
model can affect the entire system and may be a starting point to demonstrate for
farmers and stakeholders the importance of conservation of natural areas, restore the
degraded lands, and how to manage the system to conserve biodiversity and
ecosystem services.
924 Anais do I Simpósio Internacional de Ecologia
35 anos de Pós-graduação em Ecologia no Brasil
23 a 26 de outubro de 2011, São Carlos – SP, Brasil. Human activity: Revenue
Native bee: Number of
High
High
Medium
Medium
Low
Low
Zero
Zero
2
3
4
5
6
7
8
9
2
10
3
4
5
6
7
8
9
10
Human activity: Investiment
Ecological service: Pollination
High
Plus
Medium
Zero
2
3
4
5
6
7
8
9
Low
10
Zero
2
3
4
5
6
7
8
9
10
Tree: Number of
Human activity: Agricultural production
High
2
3
4
5
6
7
8
9
Medium
High
Low
Medium
Zero
Low
Zero
10
2
3
4
5
6
7
8
9
10
Tree: Seed mortality
Human activity: Deforestation rate
Plus
Plus
Zero
2
3
4
5
6
7
8
9
Zero
10
2
Tree: Seed
3
4
5
6
7
8
9
10
Human activity: Pesticide use
High
High
Medium
Medium
Low
Low
Zero
2
3
4
5
6
7
8
9
Zero
10
2
3
4
5
6
7
8
9
10
Figure 4. Value history diagram for simulation of Scen02 high agricultural productivity
effects.
CONCLUSION
The model is relatively simple, but shows the effects of the use of pesticides on natural
pollinators. Simulations present increasingly more details the consequences of killing
bees: eventually, the whole system may collapse and no longer be able to produce.
This model can be used as a reference model for stakeholders to use as decision
making or strategy planning tool, for students to learn about ecosystem services, or to
be re-used in order to create models in which pollination is part more complex
phenomena. Currently the model is being improved in order to include more details to
the simulation, and to better explore the effects of conservation measures to
recompose ecosystem services.
925 Anais do I Simpósio Internacional de Ecologia
35 anos de Pós-graduação em Ecologia no Brasil
23 a 26 de outubro de 2011, São Carlos – SP, Brasil. ACKNOWLEDGEMENT
We are grateful to Dynalearn Project (co-funded by the EC within FP7, Project
no.231526; visit www.DynaLearn.eu).
REFERENCES
Allen-Wardell, G.; Bernhardt, P.; Bitner, R.; Burquez, A.; Buchmann, S.; Cane, J.; Cox,
P.A.; Dalton, V.; Feinsinger, P.; Ingram, M.; Inouye, D.; Jones, C.E.; Kennedy, K.;
Kevan, P.; Koopowitz, H.; Medellin, R. and Medellin-Morales, S. 1998. The Potential
Consequences of Pollinator Declines on the Conservation of Biodiversity and Stability
of Food Crop Yields. Conservation Biology. 12(1): 8–17.
Bredeweg, B.; Linnebank, F.; Bouwer, A. and Liem, J. 2009. Garp3 — Workbench for
qualitative modelling and simulation. Ecological Informatics, 4 (5-6), 263-281.
Falkenhainer, B. and Forbus, K. 1991. Compositional Modeling: Finding the Right
Model for the Job. Artificial Intelligence, 51(1-3): 95-143.
Forbus, K.D. 1984. Qualitative process theory. Artificial Intelligence. 24: 85 – 168.
Klein, A.M.; Vaissière, B.E.; Cane, J.H.; Steffan-Dewenter, I.; Cunningham, S.A.;
Kremen, C. and Tscharntke, T. 2006. Importance of pollinators in changing landscapes
for world crops. Proceedings of the Royal Society B 3721, 27 Oct, 2006.
Kremen, C.; Williams, N.M. and Thorp, R.W. 2002. Crop pollination from native bees at
risk from agricultural intensification. PNAS. 99(26): 16812–16816.
Liem, J., Beek, W. and Bredeweg, B. 2010. Differentiating Qualitative Representations
into Learning Spaces. In: de Kleer, J. and Forbus, K.D. (eds.). 24th International
Workshop on Qualitative Reasoning (QR’10), pages 37-46, Portland, Oregon, USA, 810 August 2010.
Morse, R. A., and N.W. Calderone. 2000. The value of honey bees as pollinators of
U.S. crops in 2000. Pollination 2000. Cornell University, Ithaca, New York.
Ratnieks, F.L.W and Carreck, N.L. 2010. Clarity on Honey Bee Collapse? Science. 37:
152-153.
Salles, P.; Sá, I.; Leite, G.; Silva, P.; Souza, A.; Wilhelms, L.; Resende, M. 2010.
University of Brasilia: Basic Topics and Models. DynaLearn, EC FP7 STREP project
231526, Deliverable D6.2.1.
926
Download