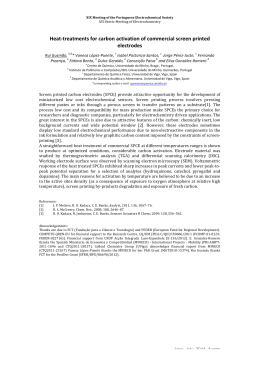
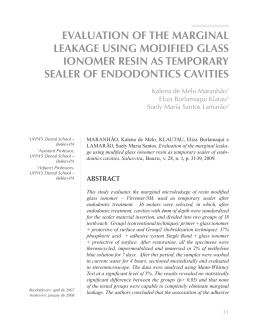
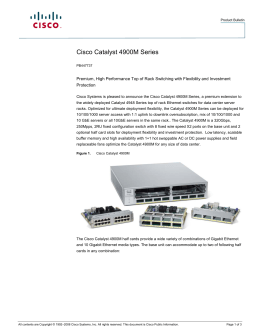
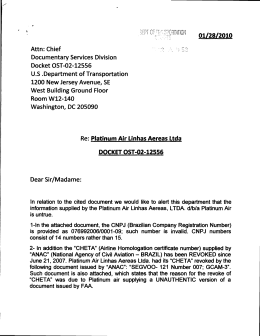
Int. J. Electrochem. Sci., 8 (2013) 5621 - 5634
International Journal of
ELECTROCHEMICAL
SCIENCE
www.electrochemsci.org
Current Density Maximization in Palladium-Based Gas
Diffusion Electrode in Proton Exchange Membrane Fuel Cell
Rafael Nogueira Bonifácio*, Almir Oliveira Neto and Marcelo Linardi.
Hydrogen and Fuel Cell Center, Nuclear and Energy Research Institute - IPEN/CNEN - SP. Av. Prof.
Lineu Prestes, 2242, Cidade Universitária, 05508-000 São Paulo - SP, Brazil.
*
E-mail: [email protected]
Received: 19 February 2013 / Accepted: 17 March 2013 / Published: 1 April 2013
In this study the influence of polymeric ionomer concentration on the performance of gas diffusion
electrode containing Pd/C as a substitute for usual Pt/C electrodes in PEMFC was verified. Values
between 56 and 59 % of ionomer related to the mass of the catalyst layer resulted in the highest current
densities. It was found that the optimum value was strongly dependent on the work potential and
temperature. Current density values of 214 mA.cm-2 were obtained at 500 mV, 85 °C and 1 atm for
MEAs with Pd/C on both electrodes of PEMFC. With commercial Pt/C only on the cathode side, a
value of 745 mA.cm-2 was reached. For comparison, platinum anodes running under the same
conditions showed only 13.9 % higher performance than palladium, indicating that improvements in
the synthesis method can enhance the performance for palladium getting to be similar to platinum on
the hydrogen oxidation reaction. Indeed, these results proved that, from an economic point of view, it
is feasible to apply palladium on anodes to replace platinum, although an adequate assessment of
durability is still to be investigated.
Keywords: Nafion, Polymeric ionomer concentration, Membrane Electrode Assembly (MEA),
Catalytic Layer, Palladium catalyst, Cost reduction, Proton Exchange Membrane Fuel Cell (PEMFC).
1. INTRODUCTION
Proton exchange membrane fuel cells (PEMFC) are devices that generate electricity in a very
efficient way, oxidizing a fuel directly. Supplying the cell with hydrogen or alcohols [1-3] would lead
to a large reduction in greenhouse gas (GHG) emissions and also in fuel consumption [4-6]. Despite
the demonstration of prototypes, catalysis is still a great impediment to PEMFC large-scale
implementation [5] because platinum-based catalysts, which are state of the art, are very expensive.
Moreover, platinum reserves are small regarding large-scale production requirements [6-10], which
Int. J. Electrochem. Sci., Vol. 8, 2013
5622
has aroused interest in alternative catalysts [5]. As alternative, palladium and its alloys have been
widely studied [6-14], being favorable in terms of cost and nature reserves when compared to platinum
[6-7,11,14-15]. However, palladium gas diffusion electrodes (Pd-GDE) have shown performances
between only 12 and 32 % of those compared to platinum in most publications [6-7,12,14-16]. This
fact makes their use unattractive, despite the relative lower cost, and their implementation unfeasible
until now.
Bonifacio et al. [17] have shown that palladium carbon supported catalyst (Pd/C) can reach
performances around 83 % compared to those using platinum for the hydrogen oxidation reaction
(HOR), under the same operating conditions. This performance level exceeds all studies verified in the
literature [6-7,10,12,14-16]. Figure 1 shows these previous results in a diagram of current densities at
500 mV versus temperature for MEAs, with anodes and cathodes prepared with combinations of
platinum and palladium electrodes.
Figure 1. Diagram of current density versus temperatures at 500 mV of MEAs prepared with Pt/Pt,
Pd/Pt, Pd/Pt and Pd/Pd (anode/cathode) electrodes, with 35 % of mass ionomer related to
catalyst layer. Active-areas of 5 cm², anode 0.4 mg metal per cm², supplied with 160 mL.min-1
H2 at 1 atm, cathodes 0.4 mg metal per cm ², supplied with 80 mL.min-1 at 1 atm. Both reactive
gases saturated with high pure water [17].
However, these performances were obtained at IPEN using standardized, previously
determined conditions for the preparation of membrane electrodes assemblies (MEAs) with
commercial platinum catalyst (Pt/C) [4,18]. The literature [2,10,19] reports that the modification of
parameters such as the mass of polymer ionomer applied on the catalyst layer (C.L.) [2,10,19] is able
to enhance the performance of MEAs, thus motivating this study. In that sense, adjustment of the C.L.
structure was carried out in order to obtain higher electrode performance, using Pd/C catalyst.
Int. J. Electrochem. Sci., Vol. 8, 2013
5623
It is well known [2,19] that the operation of the MEA occurs efficiently through the
maximization of a triple phase reaction on the interfaces among electrode material, reactants and the
polymeric electrolyte. The polymeric ionomer on the C.L. therein has the function of connecting the
metal sites of catalysts to the membrane, and it also has the function of retaining moisture by keeping
the membrane and the C.L evenly moistened, favoring the MEA performance [2,19]. If the percentage
of mass ionomer (% M.I.) in the C.L. is below an optimum value, the performance will decrease, due
to failures in proton conductivity in the bulk of the electrode. In addition, if % M.I. in the C.L. is above
the optimum value, a performance decrease will occur, due to limitations imposed in the mass
transport of fuel cell reactants and products. Therefore, it is very important to use the correct mass
ionomer quantity to obtain the best electrode performance[2,10,19]. According to ALCAIDE et al [10],
this adjustment allows better utilization of metallic particles. This results in greater overall efficiency
of fuel cells, thus allowing the reduction of the amount of metals applied and, therefore, the reduction
of costs[1,5,10].
According to Sasikumar [19] et al several authors have already studied the relationship between
catalyst and ionomer. These authors obtained values between 30 and 36 % M.I. as the best formulation
[19]; however, their experiments have not considered a wide operating temperature range. Alcaide et
al[10] set the content of Nafion ionomer to 30 % by mass in cathodes with platinum (Pt/C) and studied
the variation between 10 and 40 % M.I. in anodes with palladium (Pd/C) and with platinum and
palladium equal atomic alloy (PtPd/C 50:50) [10], but the experiments were conducted only at 80º C.
Sasikumar et al [19], studying platinum electrodes with different metal and support (carbon) ratios,
found that the Nafion mass ionomer of maximum performance is not constant [19]. Finally, Gasteiger
et al [5] warn, "It is inappropriate to assume that quite different catalysts are equally affected by the
experimental conditions." This statement explains questionable results reported from such
comparisons.
In the present work the percentage of mass ionomer (% M.I.) was studied between 20 and 70 %
relative to the mass of the catalyst layer. Experiments were conducted between 25 and 100 °C,
allowing comparisons of best performances of each composition, independent of the operational
conditions.
2. EXPERIMENTAL PART
Pd/C catalyst with 20 %wt. metal was prepared by sodium borohydride reduction method [16]
and adequately characterized in previous work [17], showing FCC crystal structure, a mean particle size
of 4.4 nm, presence of some agglomerates and the synthesis method efficiency that resulted in metallic
loading of 19.88 %.
Initially a cathodic electrode was prepeared using Pt/C commercial from BASF Company with
35 % M.I. For comparison Pt/C catalysts prepared by borohydride method were also utilized. The
catalysts were characterized by transmission electron microscopy in order to obtain images that
allowed the estimation of the average particle size.
Int. J. Electrochem. Sci., Vol. 8, 2013
5624
This catalyst and the suitable Nafion D520 solution quantities were mixed by ultrasound and
then applied to GDL by hand painting. Firstly, values between 30 and 70 % M.I. were used, varying 5
by 5 %wt. to find the range of higher performance. After those experiments a variation of 1 in 1%
among the values obtained was made. By the membrane electrode assemblies (MEAs) preparation,
Nafion 115 membrane and gas diffusion layer (GDL) called MF15 (IPEN Patent PI 1106530-3) were
used. For each MEA composition until tree assemblies were evaluated. In all experiments MEAs were
evaluated in single cell experiments using pure H2 and O2 at 1 atm with temperatures between 25 and
100 °C.
3. RESULTS AND DISCUSSION
The % M.I. adjustment was initiated ranging from 20 to 70 % with increments of 5 %. Figure 2
shows the current densities at 500 mV, obtained at each 5 °C interval, between 25 and 100 °C
operating temperatures.
Figure 2. Current densities obtained at 500 mV with Nafion ionomer, ranging from 20 to 70 % M.I.
with increments of 5 %wt. The electrodes active-areas were 5 cm ², with metal load of 0.4
mg.cm-² on each of them. Anodes were supplied with 160 mL.min-1 H2 1 atm and cathodes
with 80 mL.min-1 1 atm, both reactive gases saturated with high pure water.
Observing Figure 2, it can be seen that different ionomer concentrations significantly affect the
performance of the electrode. It can also be seen that the best performance occurs between 55 and
60 % M.I. A reduction of performance occurs outside these values. Comparing the curves with 55 and
60 % M.I. one can observe different profiles of current density variations over the temperature range
Int. J. Electrochem. Sci., Vol. 8, 2013
5625
studied. These variations are probably associated with the transition in which the amount of ionomer
ceases to be adequate, becoming excessive and resulting in polarization by mass transport, due to the
higher water accumulation that occurs with increasing temperature. This observation is coherent with
the literature [2,10,19]. Another important conclusion from Figure 2 is that above 90 ºC the cell
performance falls. Upon opening the cell, it was observed that this fact was due to water accumulation.
Looking for better understandings of the observed transition, without forgetting the desired maximum
performance, experiments between 55 and 60 % M.I. and MEAs with 62 and 64 % M.I. were also
evaluated. Figure 3 shows the performance of electrodes with Nafion concentration between 55 and 64
% M.I.
Figure 3. Current densities at 500 mV obtained with mass ionomer ranging from 55 to 60 % M. I. and
62 and 64 % M.I. for comparison. The electrodes active-areas were 5 cm ², with metal load of
0.4 mg.cm-² on each of them. Anodes were supplied with 160 mL.min-1 H2 1 atm and cathodes
with 80 mL.min-1 1 atm, both reactive gases saturated with high pure water.
From Figure 3 it can be seen that the performance peak of the MEA, with compositions ranging
from 56 to 59 % M.I. was higher than the previous one. It is worth noting that the differences in weight
of Nafion ionomer applied from the electrodes with 56 to others, with 57 and 59 % M.I., are only 106
and 333 micrograms of ionomer per square centimeter. Although small, these differences resulted in
MEA with higher current densities at different temperatures, below 55 ºC for MEAs with 57 % M.I.,
above 75 °C for MEAs with 56 % M.I. and between 60 and 75 °C in the case of MEAs with 59 % M.I.
One can conclude that the ionomer concentration can be used for a specific configuration of the
desired working temperature for a PEMFC system, according to specific applications. A maximum
performance value of 214 mA.cm-2 at 85 °C to 56 %.M.I. was reached.
Analyzing the different performances it is clear that with M.I. values ranging from 56 to
57 %, the point of maximum electrode performance decreases from 85 ºC to 50 ºC. With 58 % M.I. a
Int. J. Electrochem. Sci., Vol. 8, 2013
5626
performance loss can be noticed in comparison to 56 and 57 % M.I., which can result from losses by
mass transport. However, MEAs with 59 % M.I. presented a quite different behavior, with a broad
range of temperatures without great variations in performance. Since the experiments were duly
repeated to ensure reproducibility of the results, it is believed that the change in the profile of the
curves with different compositions is related to each microstructure formed. The performance decrease
at 58 % M.I. and the further increase with 59 % M.I. must be attributed to several factors, among
which protons transport, flow of reactants and water accumulation may be mentioned [2,10]. To verify
the raised hypothesis, samples of each MEA were analyzed by scanning electron microscopy (SEM).
Electrodes micrographs obtained of 56, 57, 58 and 59 % M.I. are shown in Figure 4 for compositions.
(a1)
(b1)
(c1)
Int. J. Electrochem. Sci., Vol. 8, 2013
5627
(d1)
(a2)
(b2)
(c2)
Int. J. Electrochem. Sci., Vol. 8, 2013
5628
(d2)
Figure 4. Scanning electron micrographs (SEM) of electrodes with (a) 56 % M.I., (b) 57 % M.I., (c)
58 % M.I. (d) 59 % M.I., all with magnifications of (1) 500 and (2) 3,000 times.
Some difficulties in this analysis were attributed to the cut of the samples and their interaction
with the electron beam. Above 20 keV, the beam heated the sample and deformed the Nafion
membrane, as can be seen at the bottom of Figure 4c2. This limited the experiment to low beams
energies, impeding the acquisition of images with good resolution at magnifications up to 3,000 times.
However, within what was possible to visualize by these images, the increase in mass of ionomer
between 56 and 58 % slightly reduces the porosity of the C.L. as expected[19]. This can be seen by
comparing Figures 4 (a), (b) and (c).
MEAs with 59 % M.I. have so low porosity that SEM images show only a uniform structure on
the C.L., which is better visualized at the left side of Figure 4d2. This supports the hypothesis that the
concentration of ionomer causes reduction on porosity and a transition in the C.L. structure, which
seems to happen above 58 % M.I.
Since electrodes with 59 % M.I. have no apparent porosity, it is quite probable that mass
transport occurs through the carbon support micropores. This possible explanation is consistent with
the performance decrease that occurs above 65 ºC, when the drag of steam from humidifiers and the
accumulation of water from reaction increase with temperature. The same effect seems to happen in
electrodes with 57 and 58 % M.I. Apparently the mass transport by micropores of carbon support only
operates efficiently when the macropore structure of C.L. is blocked. However, a better assessment of
this behavior is beyond the aim of this work. Figure 5 presents a comparison between the open circuit
potentials (O.C.P.) of electrodes between 55 and 60 % M.I.
By means of Figure 5 it can be seen that the O.C.P. curves have the same behavior observed in
the diagrams of current density at 500 mV. An increase is observed between 55 and 57 % M.I., with a
smaller value at 58 % M.I., a further increase at 59 % M.I. and a slight decrease at 60 % M.I. This is
consistent with the C.L. structural changes discussed in Figures 3 and 4. From Figure 5, the difficulty
caused by the excess of water can also be seen as the temperature increases, blocking the flow of
reagents in the electrode electrolyte interface [2]. Variables in the electrodes preparation, such as the
hot pressing and the dynamic of conducting the polarization curves, may also interfere in O.C.P., but
Int. J. Electrochem. Sci., Vol. 8, 2013
5629
all of these can be properly standardized. Figure 6 shows the polarization curves of electrodes with 56,
57, 58 and 59 % M.I. with best performance conditions.
Figure 5. Open circuit potential of electrodes prepared with mass ionomer ranging from 55 to 60 %
M.I. The electrodes active-areas were 5 cm ², with metal load of 0.4 mg.cm-² on each of them.
Anodes were supplied with 160 mL.min-1 H2 1 atm and cathodes with 80 mL.min-1 1 atm, both
reactive gases saturated with high pure water.
Figure 6. Polarization curves of electrodes prepared with mass ionomer ranging from 56 to 59 % M. I.
in their best performance conditions. The electrodes active-areas were 5 cm ², with metal load
of 0.4 mg.cm-² on each of them. Anodes were supplied with 160 mL.min-1 H2 1 atm and
cathodes with 80 mL.min-1 1 atm. Both reactive gases were saturated with high pure water.
Int. J. Electrochem. Sci., Vol. 8, 2013
5630
By means of Figure 6 one can observe that electrodes with 57 and 59 % M.I. have shown better
performance, when compared to 56 and 58 % M.I., from the beginning of the polarization curve until
about 550 mV. At this point, electrodes with 56, 57 and 59 % M.I. present the same current densities,
and below this potential the behavior starts to reverse gradually. This is consistent with the results
displayed in Figures 3 and 5. These differences are related to polarization by mass transport as already
discussed. Thus, in this situation, the catalyst layer with 56 % M.I. performs better for having larger
pores, compared to the others, resulting in fewer performance losses. However, since the cell potential
operation range is located between 500 and 700 mV, a selection between 56, 57, and 59 % M.I. must
be made, according to the operating temperature and also to the applied potential.
Comparing electrodes using the same catalyst eliminates this variable. Thus, once the
humidification system inserts additional moisture in the unit cell, by an increase in temperature, it was
found that the variation in Nafion ionomer content on the catalyst layer interferes in cell performance
and modifies the necessity of membrane hydration, establishing an "equilibrium point," in which more
or less water is required to achieve efficient proton transport. Whereas a time period is necessary for a
power module to achieve its maximum performance and since a wider range of working temperature
facilitates its control, anodes with 59 % M.I. were selected for comparison with the results obtained in
previous work[17], as shown in Figure 7.
Figure 7. Current densities at 500 mV of electrodes prepared with anodes of Pd/C with 59 % M.I. and
cathodes of Pt/C with 35 % M.I., compared to the results obtained[17] using electrodes of
platinum or palladium with 35 % M.I. in all combinations, as shown. The electrodes activeareas were 5 cm ², with metal load of 0.4 mg.cm-² on each of them. Anodes were supplied with
160 mL.min-1 H2 1 atm and cathodes with 80 mL.min-1 1 atm, both reactive gases saturated
with high pure water.
Int. J. Electrochem. Sci., Vol. 8, 2013
5631
From Figure 7 it can be seen that the performance obtained with Pd/C on anodes C.L. with
59 % M.I. is far superior to that obtained with 35 % M.I. for MEAs with palladium electrodes and for
MEAs with cathode using commercial Pt/C prepared with 35 % M.I. ( according to standardized Pt/C
commercial C.L. composition[4,18]). A gain of 27 % was obtained in the current density, and the value
of 745 mA.cm-2 at 95 ºC was achieved using Pd/C 59 % M.I. versus 586 mA.cm-2 for commercial
Pt/C. At room temperature the current densities obtained were, respectively, 418 and 179 mA.cm -2,
which means a gain of 133 % in performance. Considering the fact that using Pd/C on both electrodes
the current density obtained was only 214 mA.cm-2, the necessity of alloying in cathodes is evident.
To prove the activity of palladium catalyst for the hydrogen oxidation reaction (H.O.R.)
compared to platinum, Pt/C was synthesized on the same support (Vulcan XC72) with the same metal
load (20 %wt.), using the same method, reduction via sodium borohydride, and used in anode
preparation. Figure 8 shows the difractograms of Pt/C and Pd/C catalysts synthesized.
Figure 8.X-ray diffractogram of Pd/C and Pt/C catalysts.
Analyzing Figure 8 one might see the characteristic pattern of palladium and platinum facecentered cubic (fcc) structure on planes (111), (200), (220) and (311), with peaks corresponding to
2θ = 40,10º, 46,40º, 68,1º and 82,0º for palladium and 2θ = 40º, 47º, 67º and 82º for platinum and also
a broad peak at about 25º in 2θ, associated with the Vulcan XC72 support in both cases. Figure 9
shows the Transmission electron microscopy (TEM) and particle size distribution of Pt/C (Figure 9a)
and Pd/C (Figure 9b) catalyst, for comparison.
Int. J. Electrochem. Sci., Vol. 8, 2013
5632
(a)
(b)
Figure 9. Transmission electron microscopy and particle size distribution of (a) Pt/C and (b) Pd/C
catalysts.
From Figure 9 it can be seen that metal particle distribution on carbon support was more
homogeneous and efficient by the platinum catalyst synthesis than by the palladium catalyst synthesis
regarding particle size, resulting in lower agglomerates concentration and mean particle size of 3.8 and
4.4 nm, respectively. The Pt/C system was used in anodes preparation with 59 % M.I. in MEAs with
commercial Pt/C at cathode side, according to the standard used [4,18]. Figure 10 shows a comparison
of performances, obtained at 500 mV.
Given that this last evaluation secured equality in synthesis method, support material and C.L
structure, the only remaining variables are the particles of platinum or palladium, and their
distributions, acting on the H.O.R. By means of Figure 10 the current density of 865 mA.cm -2 at 90 °C
for Pt/C versus 745 mA.cm-2 for Pd/C can be observed, a difference of 13.9%. Also from Figure 9, the
average particle size obtained by the method employed was lower for Pt/C than Pd/C, so a part of this
difference of 13.9% can most likely be attributed to the higher palladium agglomerates concentration,
with a consequent loss of exposed surface area. A result closer to platinum electrode might thus be
obtained from improvements in the synthesis method, resulting in an increase of palladium surface
exposure to the reaction
Int. J. Electrochem. Sci., Vol. 8, 2013
5633
Figura 10. Current densities at 500 mV of MEAs prepared with anodes of Pt/C and Pd/C synthesized,
using 59 % M.I. and cathodes of Pt/C with 35 % M.I., compared to the results obtained[17]
using electrodes of platinum or palladium with 35 % M.I. in all combinations, as shown. The
electrodes active-areas were 5 cm ², with metal load of 0.4 mg.cm-² on each of them. Anodes
were supplied with 160 mL.min-1 H2 1 atm and cathodes with 80 mL.min-1 1 atm, both reactive
gases saturated with high pure water.
Since the price of palladium is between 20 and 35 % of that of platinum [4,8], it can be
concluded that, from the economic point of view, the application of Pd/C catalyst in replacement of
Pt/C in the anodes is feasible, whereas the evaluation of the durability of MEAs prepared with Pd/C
catalyst is still necessary. Before concluding it is worth noting that an electrode evaluation in a narrow
temperature range would not have allowed the comparison among the best conditions of each one of
them, and most of the results of this work could not be observed.
4. CONCLUSIONS
This study confirmed the importance of using an appropriate ratio between polymeric ionomer
and catalyst for achievement of electrodes with high current densities. For Pd/C 20% wt. containing
electrodes, a transition performance profile associated with C.L. structure was found. This transition
occurs between 55 and 60 % M.I. It also was found that fine adjustment of ionomer polymer mass
between 56 and 59 % M.I. allows the obtaining of different porosities in the catalyst layer, interfering
in the mass transport, resulting in different current densities. It was observed that the differences
Int. J. Electrochem. Sci., Vol. 8, 2013
5634
among these formulations can be seen over all polarization curves studied. Starting from the open
circuit potential, such adjustments must be made, depending on the operating temperature and
potential, to obtain high values of current density. A current density value of 214 mA.cm-2 was
obtained at 85 °C for MEAs with Pd/C on both electrodes, reaching 745 mA.cm-2 with Pt/C
commercial on cathode side. This result proved the necessity of alloying on the cathode side. It was
also found that platinum anodes produced under the same conditions and with bigger surface areas
exposed showed performance only 13.9 % higher than that with palladium, indicating that
improvements in the synthesis method can result in similar performance at H.O.R. Thus, from an
economic point of view it is feasible to apply palladium to replace platinum in PEMFC anodes.
However, an adequate assessment of durability still has to be properly addressed.
ACKNOWLEDGMENTS
To The Foundation for Research Support of the State of São Paulo (FAPESP 2010/10028-1) for the
financial support, to the Energy and Nuclear Research Institute – IPEN/CNEN-SP for the
infrastructure, especially the laboratories of the Center for Fuel Cell and Hydrogen (CCCH) and the
microscopy lab at the Center for Science and Materials Technology (CCTM).
References
M. Linardi, Economia e energía, 66 (2008) 15.
M. Linardi, ArtLiber ed., São Paulo, 2010.
H. Wendt, M. Götz, M. Linardi, Quim. Nova. 23 (2000) 538-546.
R. N. Bonifacio, R. Cuenca, M. Linardi. Quím. Nova, 34 (2011) 96.
H. A. Gasteiger, S. S. Kocha, B. Sompalli, F. T. Wagner, Applied Catalysis B: Environmental, 56
(2005) 9.
6. E. Antolini, S. C. Zignani, S. F. Santos, E. R. Gonzalez, Electrochimica Acta, 56 (2011) 2299.
7. M. Shao, J. Power Sources, 196 (2011) 2433.
8. C. Bianchini, P. K. Shen, Chem. Rev. 109 (2009) 4183.
9. E. Antolini, Energy Environ. Sci., 2 (2009) 915.
10. 10.F. Alcaide, G. Álvarez, P. L. Cabot, O. Miguel, A. Querejeta, Int. J. Hydrogen Energy, 35
(2010) 11634.
11. Zhou, Zhi-min; Shao, Zhi-Gang; Qin, Xiao-Ping; Chen, Xu-Guang; Wei, Zi-Dong; Yi, Bao-Lian;
Int. J. Hydrogen Energy, 35 (2010) 1719.
12. R. Rego, M. C. Oliveira, F. Alcaide, G. Alvarez, Int. J. Hydrogen Energy, 37 (2012) 7192.
13. G. F. Alvarez, M. Mamlouk, S. M. S. Kumar, K. Scott, J. Appl. Electrochem, 41 (2011) 925.
14. M. Mougenot, A. Caillard, P. Brault, S. Baranton, C. Coutanceau, Int. J. Hydrogen Energy, 36
(2011) 8429.
15. J. Zhao, A. Sarkar, A. Manthiram, Electrochimica Acta, 55 (2010) 1756.
16. R. S. Henrique, R. F. B. Souza, J. C. M. Silva, J. M. S. Ayoub, R. M. Piasentin, M, Linardi, E. V.
Spinacé, M. C. Santos, A. O. Neto, Int. J. Electrochem. Sci., 7 (2012) 2036.
17. R. N. Bonifacio, A. O. Neto, M. Linardi. Int. J. Electrochem. Sci., 8 (2013) 159.
18. A. B. Andrade, M. L. M. Bejorano, E. F. Cunha, E. Robalinho, M. Linardi. J. Fuel Cell Sci. and
Technology, 6 (2009) 1.
19. G. Sasikumar, J.W. Ihm, H. Ryu. J. Power Sources 132 (2004) 11.
1.
2.
3.
4.
5.
© 2013 by ESG (www.electrochemsci.org)
Download