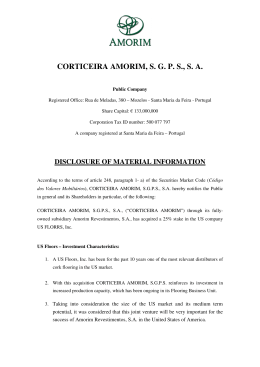
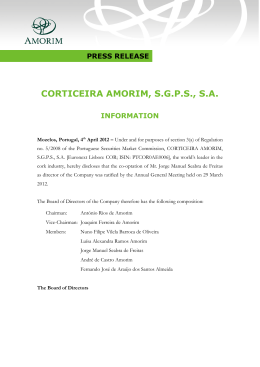
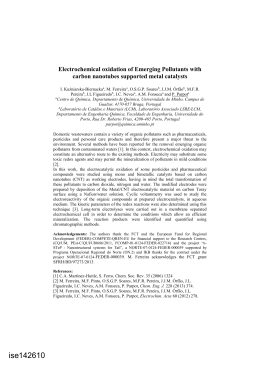
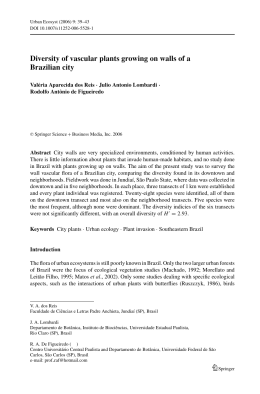
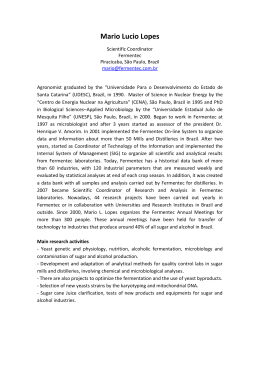
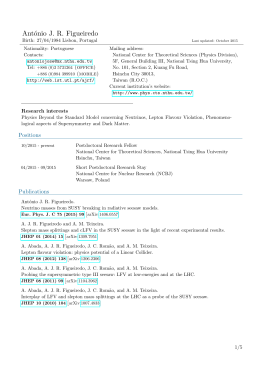
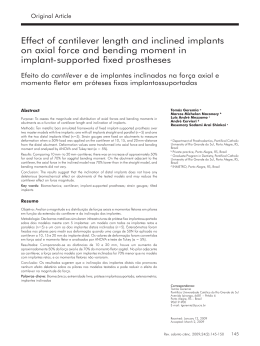
Continuity lines in the axial system
Lucas Figueiredo and Luiz Amorim
Universidade Federal de Pernambuco, Brazil
[email protected], [email protected]
Abstract
This paper presents a linear representation of the built environment called “continuity
line”. A continuity line is the aggregation of several axial lines to represent an urban
path in its longest extension, respecting a maximum sinuosity previously defined. It is
based on two main arguments: first, that the notion of continuity is already embedded in
the axial system; and second, that the continuity lines reinforce the relationship between
configurational properties and the hidden geometry of the axial maps.
1. Introduction
The aim of this paper is to discuss the axial representation of spatial configuration. We
start by examining the limitations of the axial model, to propose a new linear representation of the built environment, called “continuity line”. Its aim is to minimise the impact
of representing long lines of movement as single axial lines, and curved and sinuous paths
as a series of fragmented lines of sight. This is possible through the aggregation of axial
lines to represent an urban path in its maximum extension. The interest of this study is,
therefore, to improve the axial system, without challenging its fundaments. Finally, we
propose a new taxonomy for urban grids, fundamentally based on the geometrical nature
of the grid itself, which emerges from the process of axial aggregation.
Space syntax has emerged from the field of morphological studies with a particular
rapport: social attributes are deeply embedded in spatial configuration, which, in turn,
through its own laws, interfere in the mechanisms of social reproduction (Hillier and
Hanson, 1984). Space syntax makes use of techniques to describe the spatial configuration
in order to understand to what extent and in which conditions the social and spatial
attributes are related. One of its main descriptive tools derives from bi-dimensional plans,
the axial representation of the continuous lines of movement and sight that covers an
entire spatial system.
The axial representation, and the measures derived from it, has been proven to be
successful to study the social and cultural roles of space, particularly for the evaluation of
the impact of spatial configuration on pedestrian and vehicular movement patterns, levels
of co-presence and co-awareness, which have also proven to be relevant for the analysis of
urban sites and buildings, and the evaluation of design proposals. Indeed, many designers
of today take all the knowledge and expertise of space syntax community to the drawing
board as an important tool for design decision-making.
Recent studies, however, have revealed some limitations of the axial representation
(Peponis et al, 1997; Turner, 2001; Asami et al, 2003; Dalton, 2001; Thomson, 2003),
even though acknowledging its robustness, mostly in its association to the analysis of
movement patterns and the probabilistic correlation between configuration and the pattern
162
Lucas Figueiredo and Luiz Amorim
Figure 64: Three axial representations of the same curved path
of encounters. The most relevant critiques that came up to support the central argument
of this paper, however, refer to the inadequacy of the axial model to best represent curved
and sinuous paths and, at the opposite direction, long axial lines.
Despite being presented as an objective procedure, the construction of an axial map
is widely open to individual interpretation, particularly when representing curved and
sinuous paths (Figueiredo, 2004; Figueiredo and Amorim, 2004). In this sensitive case,
the number of axial lines that covers the entire sub-system may vary according to the
researcher’s interpretation (Figure 64), leading to mistakes, even committed by experienced scholars. As the standard syntactic measures are topological, any variation in the
map changes the pattern of space-to-space relationship, therefore compromising the result of the analysis. There are recent attempts to derive axial maps automatically from
bi-dimensional drawings (Batty and Rana, 2002), but they have high computational costs
and are still at a preliminary stage.
The axial representation of continuous curved and sinuous paths offers another difficulty. The common sense tells us that these paths are often recognised as a continuous
line of movement, despite being formed by a sequence of lines of sight. The standard axial
representation breaks these continuous lines into a set of short sequential axial lines, misrepresenting important inherent global properties of the spatial system. The Manhattan
Paradox is a classic example of this misrepresentation that is often referred to in the literature (Dalton, 2001). Indeed, the standard axial representation is not able to recognise the
importance of Broadway within the configuration of the regular grid of the Isle of Manhattan, New York, unless if Broadway is described as a single axial line. This “straightening”
procedure has been used lately to represent axial components of a super grid, such as
freeways, and curved and sinuous paths, but without a theoretical framework to support
when and how the simplification of the axial map can or should be done.
The last important limitation of the axial system to be brought to debate is the
generation of long lines. It is common to find in large and complex urban systems long
and straight avenues with kilometres of extension that cross large portions of the grid.
Because of their length, these long axial lines tend to be highly connected and integrated.
These “straight paths” are lines of movement but are not exactly lines of sight, because
“you can never see completely down its length at any point” (Dalton, 2001, p.3). When
these long axial lines are compared to long curved and long sinuous paths that offer similar
conditions for long journeys within the grid, an important distortion of the axial model
becomes evident: non-straight paths are broken into a sequence of short lines, therefore
their importance is misled and further minimised by the presence of long and highly
connected straight lines.
Continuity lines in the axial system
163
1.1. Recent advances
Substantial contributions have been made to refine the axial system and to overcome its
limitations. Turner (2001) and Dalton (2001), for example, take the act of navigation in
and the perception of the built environment as a key argument to calibrate the axial model.
They suggest that when people navigate in spatial systems, slight changes of direction
are not necessarily perceived; hence, the angle of intersection between axial lines should
be taken into account to adjust the model. The “angular analysis”, then, measures the
topological relation between two lines as a fractional value, proportional to the angle of
intersection between them. This procedure does not modify the axial map, but tries to
minimise the differences between straight and curved and sinuous paths by modifying the
calculation of some syntactic variables.
Thomson (2003), on the other hand, suggests the use of the “generalisation” principle
used in cartography, which takes objects that share certain properties, such as width or direction, and “generalise” or “group” them to form single entities. “This principle describes
the tendency for smoothly connected elements to be naturally ’grouped’ and perceived as
single objects (...) these objects were termed strokes, prompted by the notion of a curve
segment drawn in one smooth movement” (Thomson, 2003, p.3). Therefore, he proposed
the idea of replacing axial lines with linear strokes as a basic spatial representation. Within
this framework, curved or sinuous paths are represented as a single “linear stroke”.
In another direction, several studies try to improve the axial system by adding new
variables, such as metric distances (Salheen, 2003) or the third dimension (Asami et al,
2003). Asami and colleagues argue that the topography of the site should be taken into
account in the axial model, because axial lines are often projections of undulating paths.
Therefore, such lines should be broken when the lines of sight are broken. This simple
evidence has a fundamental implication to the core of our argument: the standard axial
model already represents undulating paths at the vertical planes as single lines of movement. Hence, why not represent curved and sinuous paths at the horizontal plane as single
and continuous lines, too?
2. The continuity lines
If space syntax descriptions are derived from representations of how an observer perceives
the built environment, then curved and sinuous paths could be described as continuous
lines of movement if, and only if, they were recognised as a single spatial unit. Our experience in navigating urban systems tells us that there are several situations in which these
paths are immediately recognised as single lines of movement, such as costal or riverside
streets; paths rounding an obstacle, such as a hill; or curved and sinuous paths that cross
open spaces, such as a park lawn. These quasi-linear paths are perceived by an observer
as a continuous line of movement, as no other choice of movement is offered. These kind
of paths can be called first-order “continuity lines” (Figueiredo, 2004, Figueiredo and
Amorim, 2004).
Within dense urban environments, however, lines of sight are frequently obstructed and
other choices for roaming around or reaching a destination are at hand. For this reason,
these quasi-linear paths become less evident. This is why the notion of “change of direction” is a strong fundament in the axial representation. In these situations, second-order
“continuity lines” may emerge from a more abstract knowledge of the built environment
constructed through movement, or from a concrete knowledge constructed by experiencing
164
Lucas Figueiredo and Luiz Amorim
Figure 65: LEFT: Angle of continuity. RIGHT: Approximation margin
it through time.
Hillier has already suggested that “at the most elementary level, people move in lines,
and tend to approximate lines in more complex routes” (Hillier, 1996, p. 153). If this is the
case, the notion of “lines of movement” seems to be more relevant to the exploration of the
urban grid, than the notion of “lines of sight”. While in movement, an observer may miss
details of the environment while trying to concentrate on his own path, as Turner (2001)
and Dalton (2001) suggest, and may not perceive slight changes of direction as changes of
spatial units - axial lines. The standard axial representation already accepts this approach
at least in two cases: (a) long axial lines are markedly lines of movement, more than lines
of sight; and (b) axial lines representing undulating paths are lines of movement, but are
not always lines of sight.
If such descriptions are accepted as valid representations of lines of movement, the axial
system should accept other types of long paths to be constructed through movement. It
seems that there are two ways for overcoming these distortions of the axial model. The
first one is to create rules to break axial lines into short segments, concentrating the
model on the local properties of the system (Asami et al, 2003), and then improving the
methodology to understand how such segments may work together.
The second possible description is by aggregating the axial lines to represent curved
and sinuous paths, reproducing with more accuracy our experience while immersed in spatial systems. These “continuity lines” (Figueiredo, 2004, Figueiredo and Amorim, 2004),
emerge from the generalisation of the axial map reinforcing the global properties of the
system. This process of aggregation, as proposed here, takes several axial lines to represent an urban path in its maximum extension, respecting a maximum sinuosity previously
defined, ignoring certain changes of direction, as demonstrated below.
2.1. Rules to create continuity lines
The implementation of the aggregation process is based on the angle between the linear continuation of an axial line and the “real” continuation provided by another axial
line closer to one of its extremities. This angle of intersection is called “angle of continuity” (Figure 65 left). If an axial line has more than one intersecting line close to one of
its extremities, the line that has the smallest angle of continuity is chosen as the “best
continuation” for aggregation. However, standard axial maps are freely drawn and intersecting lines do not always share the same intersecting point, creating several “trivial
Continuity lines in the axial system
165
Figure 66: Approximation margin
rings” (Hillier and Hanson, 1984, p. 102). As a result, the aggregation procedure has to
implement an approximation margin that ignores small distances between intersections
to correctly choose the best continuation (Figure 65 right). This margin can be defined
by measuring some trivial rings of the map. This procedure works recursively for both
extremities, starting from the longest to the shortest lines, with the interest to create the
longest, but also the straightest paths available.
The aggregation procedure was implemented as a module for Mindwalk (Figueiredo,
2005), a computer program that works with both axial and continuity maps, and tested on
a significant set of 22 axial maps, diverse in size and configurational properties (Figueiredo,
2004, p. 74). The map set included several types of urban grids, from several cities from
Brazil, Europe and EUA. Each axial map was gradually processed by changing the angle
of continuity from 5 to 60 degrees, with an increment of 5 degrees per time, generating 12
different continuity maps. All syntactic variables were calculated for all maps to observe
the changes of the configurational properties during the aggregation process (Figure 66).
Preliminary tests reveal that the most adequate angle of continuity is a function of
the geometry of the grid itself and how the axial maps were originally drawn. Axial maps
which were drawn to represent curved and sinuous paths as few axial lines, required wider
angles because the changes of direction were slightly abrupt. On the other hand, detailed
maps, which represented such paths as many axial lines, required narrower angles and the
continuity lines emerged naturally from the maps.
In fact, a standard value may not be necessary since the aggregation procedure can
be customised to achieve, empirically, the angle of continuity that best represents the
most important quasi-linear paths of each system. Nevertheless, for comparative studies,
a standard value must be used. At the current stage of the research, the preliminary
results suggest the angle of 35 degrees (Figueiredo, 2004, p. 56) as a maximum angle of
continuity, based on the fact that wider angles may characterise changes of directions and
that, within the set, the most relevant sinuous and curved paths emerged within the limit
of 35 degrees.
Despite this current limitation, the aggregation procedure implemented in Mindwalk
(Figueiredo, 2005) has a linear computational time; reduces the number of spatial entities
(lines), simplifying the axial maps; and eliminates the distinction between long lines and
166
Lucas Figueiredo and Luiz Amorim
curved or sinuous paths, as demonstrated below. The software was designed to read any
existent axial map (if exported as a drawing exchange file - DXF), but it can also be
adapted to create continuity maps from GIS databases that generate road-centrelines, as
the angular analysis proposed by Dalton et al (2003).
3. The emergence of curved and sinuous paths
When axial maps are gradually aggregated, continuity lines emerge from their grids revealing long curved and sinuous paths (Figure 66), which seem to assume similar position
in the configuration as the pre-existing long axial lines. As a result, a clearer hierarchy
based on line length become apparent, mainly within organic grids, but also within regular
grids. Such effects lead to the investigation of the relationship between metric (length)
and topological (configurational) properties.
3.1. The hidden geometry of the axial and continuity maps
Hillier (2001) studied the axial maps of 58 cities from four different parts of the world
and found clear geometric and syntactic differences between them, such as the length of
the axial lines, the angle of incidence of their intersections and significant configurational
properties. However, despite these differences, there were powerful invariants, “which seem
to go across cultures and even across scales of settlements” (Hillier, 2001, p. 6). The most
surprising of all was the distribution of lengths of the axial lines. Indeed, axial maps of
cities contain a large number of short lines and a small number of very long lines, forming
approximately a logarithmic distribution (Figure 67). Therefore, although the axial system
is topological and relational, it also captures a metric dimension that is expressed as a
hierarchy of line lengths.
This kind of distribution of a property, or an event, is found in a wide range of phenomena and frequently obeys scale laws (Capra, 1996). In urban morphology, this distribution
have also been studied through fractal geometry (Sobreira, 2001; Salingaros, 2003), revealing that there is always a large number of common properties and events that rapidly
become a small number of rare ones. Long lines are special because they are the top of an
invariant hierarchy that can be found in any axial map. Is such hierarchy of lengths reflected in the configurational properties? To answer this question, the correlation between
length and syntactic variables of the analysed sample was calculated (Table 68), first, for
the standard axial maps, and second, after they being grouped at an angle of aggregation
of 35 degrees, for the continuity maps.
Table 68 shows the correlation between line lengths and three syntactic measures,
representing three distinct scales: connectivity, integration radius-radius and global integration (Rn). The mean connectivity presents a better correlation with line length than
integration, both radius-radius and Rn, because integration is also a measure of centrality
and high values become concentrated into a central core, which may contain lines of several
lengths. The “centrality effect” also resulted in very low correlations for medium and large
maps, as the maps presented in Figure 67. However, the mean of the entire set (Table 68)
shows that the metric dimension has a considerable influence over the syntactic analysis,
since long lines are often highly connected. Therefore, when a curved and sinuous path is
broken, its place in the metric hierarchy is lost and a rare event (a long path) becomes a
set of common and unimportant events (short lines).
Continuity lines in the axial system
Figure 67: Four axial maps and its distributions of lengths
167
168
Lucas Figueiredo and Luiz Amorim
Figure 68: Correlation between line length and syntactic variables (Source: Figueiredo,
2004, p. 76)
Continuity lines in the axial system
169
Long paths are, indeed, rare events that emerge within complex urban systems. They
are at the top of an invariant hierarchy found in any urban grid, connecting entire subsets
of connected short paths. The continuity line captures correctly the place of the curved
or sinuous paths in this hierarchy, also minimising the centrality effect over the measure
of integration. As a result, the continuity maps built with a maximum angle of 35 degrees
show a different picture (Table 68), where the mean correlation between the length and
syntactic variables has a slight, but a noteworthy increase. The effects were significant for
organic maps, such as Arapiraca, Brazil and Samsun, Turkey, but practically unnoticeable
for more regular grids, such as Brası́lia, for which some correlations have even decreased
in few cases.
4. A new taxonomy of urban grids
The gradual aggregation of axial lines with the implementation of different angles of continuity revealed that different types of urban grids respond differently to the aggregation
process, following a simple general rule: the more regular the grid is, less affected it will
be. However, it was observed that on a scale from highly deformed to highly ordered
grids, there is a variety of arrangements that are differently affected by the aggregation
process. Grids that are mostly composed of small axial lines intersected at obtuse angles,
respond differently to those that have sinuous paths that connect extreme sectors of cities.
It seemed natural to explore these properties to generate a new taxonomy of urban grids;
an instrument that could be able to describe more precisely the nature of the urban grid
and to give objective descriptions to expressions like organic or regular.
To achieve this objective, a set of measures was proposed to characterise continuity
maps, which are not exactly “syntactic” measures, as they have a geometrical basis. The
first developed measure, called “sinuosity” (Figueiredo, 2004, p. 65), consists of the sum
of all continuity angles for a continuity line, measured in radians or degrees, or zero for
an axial line. It describes the degree of “bending” of a single continuity line (Thomson,
2003, p. 8). As a “mean sinuosity” value could not characterise the whole system, because
continuity maps have a large number of axial lines and such mean would not be consistent,
the percentage of continuity lines within the map was proposed to measure the effect of
the aggregation procedure on the whole map. This measure is achieved by dividing the
number of continuity lines by the total number of lines (axial and continuity) in the map.
Continuity lines, however, are formed by a different number of segments, which means
that not only the number of continuity lines in the map is important, but also the number
of aggregated axial lines. Therefore, a better measure called “aggregation degree” was
proposed to characterise continuity maps (Figueiredo, 2004, p. 66). The aggregation degree
is the number of aggregated axial lines (segments of continuity lines) divided by the
number of segments in the continuity map (axial lines and aggregated axial lines), i.e. the
percentage of axial lines that were aggregated.
The aggregation degree is a useful measure to describe the geometrical nature of the
grid, as it is a function of the angle of incidence between the axial lines that compose the
system. Therefore, depending on the continuity angle used to generate the continuity map,
the aggregation degree will vary accordingly. Highly irregular grids will tend to present
high aggregation degrees with narrow angles of continuity, whereas regular grids will only
present high values with wider angles. These differences between urban grids become clear
when a wide angle of continuity, such as 60 degrees, is used. The axial maps of organic
170
Lucas Figueiredo and Luiz Amorim
Figure 69: A new taxonomy of urban grids(Source: Figueiredo, 2004, p. 79-80)
Continuity lines in the axial system
171
grids or grids with many curved or sinuous paths have nearly 50% of their axial lines
aggregated. On the other hand, highly regular grids have an aggregation degree of less
than 5%.
Table 69 presents the classification of the analysed sample according to the aggregation
degree for a maximum continuity angle of 60 degrees. The set is classified in four different
levels (highly regular, regular, irregular and highly irregular grids) according to the pattern
of distribution of the aggregation degree within the sample. What becomes evident is the
effectiveness of the measure to identify different types of grid composition. For example,
Guará is a planned town, part of the urban system that form the Brazilian Federal District,
which was designed as a simple hierarchical repetition of geometric enclosed elements - the
housing districts. This curious orthogonal urban patchwork is only broken by a sinuous
central circulation system, which group the only non-orthogonal set of lines. Ann Arbor, a
university city in Michigan, USA, on the other hand, has a regular grid at its centre that,
by a historical process of extension, deformation and consolidation (Adhya and Amorim,
2005), presents today a complex and deformed urban fabric at its periphery. The high levels
of aggregation degree are a function of these curved paths that form the recent residential
developments, which constitute a large percentage of the axial lines of the system. In these
extreme cases, the degree of aggregation is able to distinguish the very nature of their grids,
but further development is needed to establish a standard classification process, which will
be only possible with the study of a larger sample of urban grids.
5. Final remarks
This paper aimed at introducing a new technique for the linear representation of urban
grids. The continuity line is part of a new generation of descriptive techniques that consolidates the efforts to refine the axial representation. Its contribution resides on establishing a
theoretical and technical framework for the adequate representation of curved and sinuous
paths.
We may conclude by saying that continuity maps are indeed significantly different from
axial maps. They present a more dispersed integration core, which is excessively concentrated in axial maps, expressing more clearly the distributiveness character of accessibility
within the grid, particularly in highly deformed grids, and highlighting the importance
of curved and sinuous paths as alternative routes for long journeys within city grids.
Such findings have significant implication on the study of vehicular movement patterns,
which are associated to journeys that make use of long or extended paths (Figueiredo and
Amorim, 2004).
We may also add that the aggregation degree of a continuity map also provides a useful
and interesting taxonomy for the classification of urban grids (Figueiredo, 2004, p. 66),
which is yet to be fully explored. The preliminary results presented here point out the
effectiveness of the continuity model to describe the geometrical nature of urban grids.
It may also throw light on how an invariant hierarchy, like the length of the axial lines,
emerges from a complex urban system, creating a sort of a fractal logic of space.
Acknowledgements
This research was supported by the Conselho Nacional de Desenvolvimento Cientı́fico e
Tecnológico - CNPq
172
Lucas Figueiredo and Luiz Amorim
Figure 70: A new taxonomy of urban grids
Continuity lines in the axial system
173
The authors would like to thank Edja Trigueiro and Edmilza Borges (Universidade
Federal do Rio Grande do Norte), Frederico de Holanda (Universidade de Brası́lia), Guilherme Varela (Universidade Federal de Pernambuco), Anirban Adhya and Fusun Erkul
(University of Michigan) among many others, who have kindly granted access to their
researches on urban morphology.
Continuity lines can also be identified through angular analysis. In this case, if the
angle of continuity is smaller than the maximum angle adopted, the topological distance
between the two lines is zero, or one, otherwise. This procedure differs from aggregation
because it does not create new “spatial unities” and, depending on the implementation,
it may identify many “continuations” for the same line.
Literature
Adhya, A., Amorim, L. (2005) From Annarbour to A2: a morphological genesis of the
City of Ann Arbor, USA, in: Proceedings of the Fifth Space Syntax International
Symposium, Delft, Delft University of Technology.
Asami, Y. et al (2003) Introducing the third dimension on Space Syntax: application
on the historical Istanbul, in: Hanson, J. (ed.) Proceedings of the Space Syntax Fourth
International Symposium, 2,London, University College, p. 48.01-48.18. London.
Batty, M., Rana; S. (2002) Reformulating space syntax: the automatic definition and
generation of axial lines and axial maps, Centre for Advanced Spatial Analysis, Working Paper Series, p. 58.
Capra, F. (1996) The web of life: a new scientific understanding of living systems, New
York, Anchor Books.
Dalton, N. (2001) Fractional configuration analysis and a solution to the Manhattan
problem, in: Peponis, J., Wineman, J., Bafna, S. (eds.), Proceedings of the Space
Syntax Third International Symposium, Atlanta, Georgia Institute of Technology, p.
26.01-26.13.
Dalton, N.; Peponis, J.; Conroy, R. (2003) To tame a TIGER one has to know its
nature: extending weighted angular integration analysis to the description of GIS
road-centerline data for large scale urban analysis, in: Hanson, J. (ed.), Proceedings
of the Space Syntax Fourth International Symposium, London,University College
London, 2, p. 65.01-65.
Figueiredo, L. (2004) Linhas de Continuidade no Sistema Axial, Unpublished MSc
Dissertation, Recife, Universidade Federal de Pernambuco.
Figueiredo, L. (2005) Mindwalk: a Java based software for spatial analysis, Proceedings of the F ifth Space Syntax International Symposium, Delft, Delft University of
Technology.
Figueiredo, L., Amorim, L. (2004) Continuity lines: aggregating axial lines to predict
vehicular movement patterns, Proceedings of the Third Great Asian Streets Symposium, Singapore, National University of Singapore (forthcoming).
Hillier, B., Hanson J. (1984) The Social Logic of Space,Cambridge, Cambridge University Press.
Hillier, B. (1999) The common language of space: a way of looking at the social, economic and environmental functioning of cities on a common basis, Journal of Environmental Science, 11(3), p. 344-349.
174
Lucas Figueiredo and Luiz Amorim
Hillier, B., (1996) Space is the Machine, Cambridge: Cambridge University Press.
Hillier, B., (2001) A theory of the city as object: or how spatial laws mediate the
social construction of urban space, in: Peponis, J., Wineman, J., Bafna, S. (eds.),
Proceedings of the Space Syntax Third International Symposium, Atlanta, Georgia
Institute of Technology, p. 02.1-02.28.
Peponis, J. et al, (1997) On the generation of linear representation of spatial configuration, Major, M., Amorim, L., Dufaux, F. (eds.), Proceedings of the Space Syntax
First International Symposium, London, University College London, 3, p. 41.0141.18.
Salingaros, N. A. (2003) Connecting the fractal city, available at:
http : //www.math.utsa.edu/sphere/salingar/connecting.html.
Sobreira, F., Gomes, M. (2001) Urban Fragmentation: Spatial scaling laws in spontaneous settlements, in: Peponis, J., Wineman, J., Bafna, S. (eds.), Proceedings
of the Space Syntax Third International Symposium, Atlanta, Georgia Institute of
Technology, p. 39.01-39-10.
Salheen, M. A. (2003) An application of universal distance using Space Syntax analysis, in: Hanson, J. (ed.), Proceedings of the Space Syntax Fourth International
Symposium, London, University College London, Vol. 1, p. 36.01-36.14.
Steadman, P. (1983) Architectural Morphology, Cambrige, Cambridge University
Press.
Thomson, R. C. (2003) Bending the axial line: smoothly continuous road centre-line
segments as a basis for road network analysis, in Hanson, J. (ed.), Proceedings of the
Space Syntax Fourth International Symposium, London, University College London,
Vol. 2, p. 50.01-50.10.
Turner, A. (2001) Angular analysis, in: Peponis, J., Wineman, J., Bafna, S. (eds.),
Proceedings of the Space Syntax Third International Symposium, Atlanta, Georgia
Institute of Technology, p. 30.01-30.13.
Download