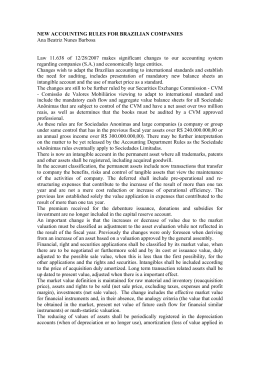
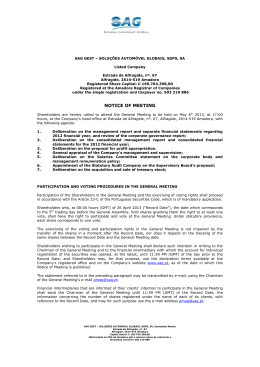
Annual Report and Accounts 2010 2 Annual Report and Accounts 2010 Table of Contents 03 GOVERNING BODIES MANAGEMENT REPORT OF THE BOARD OF DIRECTORS 2010 FISCAL YEAR 05 1 – Company Overview 07 2 – Macroeconomic Background 08 10 14 14 17 17 17 3 – Business Activity 3.1 – Overview 3.2 – Operations Area 3.3 – Technical Area 3.4 – Information Systems and Telematics Area 3.5 – Administrative abd Financial Area 3.6 – Human Resources 3.7 – Quality Management System 3.8 – Health, Hygiene and Safety at Work 3.9 – Social Responsibility 19 4 – Economic and Financial Review 25 5 – Payables to the State and Other Public Agencies 25 6 – Conclusion 25 7 – Outlook for 2011 26 8 – Acknowledgements 26 9 – Proposed net profit allocation 28 FINANCIAL STATEMENTS 2010 FISCAL YEAR 36 NOTES 52 LEGAL CERTIFICATION OF ACCOUNTS 54 AUDIT REPORT Annual Report and Accounts 2010 Governing Bodies Shareholders Meeting Chairman: Dr. José Luciano Vaz Marcos Secretary: Dr. António José André Martins Board of Directors Chairman: Dr. António Manuel Pereira Caldas Castro Henriques Directors: Dr. Armindo Luís Pinho Martins Dr. Fernando Jorge Salas Nogueira Dr.ª Ana Paula Sá Ribeiro Eng.º António José Marques Martins Graça Eng.º Nuno Miguel Ribeiro Pereira de Sousa Eng.º Filipe Boaventura da Silva Rego Eng.º Javier Villalobos Giménez Eng.º Borja Santamaria Mariscal Company Secretary: Dr. António José André Martins Audit Commitee Main Auditor: Mariquito, Correia & Associados, SROC Represented by: Dr. António Francisco Escarameia Mariquito Alternate member: Dr. José Martins Correia Main Departments Chief Executive Officer (CEO): Eng.º Marcos Levi Sampaio Caetano Ramalho Finance, Administrative Services and Human Resources Department Chief Financial Officer (CFO): Dr. Vladimir Alexandre Grangeia Vieira da Ponte Technical Department Chief Technical Officer (CTO): Eng.º José Armando Amoreira Godinho Simões Operation and Maintenance Department Chief Operation Officer (COO): Eng.ª Joana Isabel Maia Cabral 3 MANAGEMENT REPORT OF THE BOARD OF DIRECTORS 2010 FISCAL YEAR Annual Report and Accounts 2010 5 Management Report of the Board of Directors Dear Shareholders, In legal and statutory terms, we hereby submit to you the Annual Report and Accounts for the 2010 Fiscal Year. 1 – Company Overview SCUTVIAS – Autoestradas da Beira Interior, S.A., with head office in Lisbon (Praça de Alvalade, nº 6 – 13 º Esquerdo), was established on July 28, 1999, its main business purpose being the activity developed within the concession of the designing, planning, and construction or increase of the number of lanes, funding, maintenance, and operation, under a shadow toll arrangement (SCUT), of the motorways and related roadways in Beira Interior (Portugal), named as “SCUT da Beira Interior” concession. On September 13, 1999, the Portuguese State and Scutvias entered into a Concession Agreement. Scutvias was identified as the entity receiving the concession “SCUT of Beira Interior”. Said agreement established the concession term of 30 years, among other aspects, as well as other provisions regarding payments, warranties, liabilities, funding, and other matters regarding company business activity. Project SCUTVIAS comprises two clearly different stages, i.e. the Pre-Operating Period, which ran from the beginning of the Concession to the 31st of December, 2004, including both the investment period and the initial period after its conclusion, in which revenues were established based on availability, and the Operating Period, beginning on the 1st of January, 2005, and extending up to 2029, during which the Concessionaire’s revenues are determined on the basis of traffic levels. Therefore, the 2010 fiscal year falls within the Operational Period. This Operational Period is characterised by the focus of the Concessionaire’s activity on Operations and Maintenance activities. In this stage, the Concessionaire will recover its investment through the operation of the concession’s infrastructures. Strategic Component Mission Scutvias’ mission is to efficiently manage the concessioned road infrastructure, ensuring its road transport flow and safety, and contributing for the economic, social, and cultural development of Beira Interior, creating shareholder value and strengthening the adequate conditions for its collaborators. 6 Annual Report and Accounts 2010 Vision To place Scutvias as a Concessionaire offering a quality service to the Community, which shows a performance based on the partners’ and users’ trust, and is focused on profitability and sustainability. Values Efficiency – Strict performance of all procedures associated to the Concessionaire, thus ensuring productive efficiency, a better use of all available resources, and cost control. Focus on the User / Grantor – The Organisation is guided by the aim to serve users, minding their wellbeing, comfort, and safety, thus ensuring the fulfilment of the Concession Agreement. Team Spirit – To communicate, to share, to inform, to accept partnerships, to understand individual work as part of a whole. Sustainability – To manage its activities according to the principles of sustainable development, on economic, social, and environmental terms, resorting to innovation, training, and potential development of its human resources, and regard for ethics. Strategic Aims: To increase traffic levels To increase procedural efficiency To increase efficiency in the use of assets Annual Report and Accounts 2010 7 A23 Concession The SCUT of Beira Interior comprises motorway A23 between Abrantes and Guarda, and it is composed by the following stretches and substretches: Stretch Sub-Stretch Abrantes Oeste - Abrantes Este Abrantes/Mouriscas Gardete / Castelo Branco Castelo Branco / Alcaria Alcaria / Belmonte (Teixoso) 7,3 Total - Abrantes / Mouriscas 12,1 -OURISCAS-A½áO 8,4 'AVIáO%NVENDOS 6 8,2 Envendos - Gardete 5,6 Total - Mouriscas / Gardete 28,2 Gardete - Riscada 4,8 Riscada - Fratel 4,5 &RATEL0ERDIGáO 5,4 0ERDIGáO!LVAIADE 4,8 Alvaiade - Sarnadas / Retaxo 11,4 Sarnadas / Retaxo - Castelo Branco Sul 4,4 Castelo Branco Sul - Hospital 5,7 Hospital - Castelo Branco Norte 3,7 Total - Gardete / Castelo Branco 44,7 Castelo Branco Norte - Alcains 7,9 Alcains - Lardosa 8,1 Lardosa - Soalheira 4,7 Soalheira - Castelo Novo 5,8 #ASTELO.OVO&UNDáO 7,8 &UNDáO!LCARIA 4,2 Total - Castelo Branco / Alcaria 38,5 !LCARIA#OVILHá3UL 6,6 #OVILHá3UL#OVILHá.ORTE 5,8 #OVILHá.ORTE"ELMONTE3UL 9,1 Total - Alcaria / Belmonte (Teixoso) 21,5 Belmonte Sul - Belmonte Norte 8,5 Belmonte Norte - Benespera Belmonte (Teixoso) / Guarda 4,8 Abrantes Este - Mouriscas -A½áO'AVIáO Mouriscas / Gardete Extension (km) 9 Benespera - Guarda (2) 9,6 Guarda - Pinhel 5,4 Total - Belmonte (Teixoso) / Guarda 32,5 Extensão Total (Km) 177,5 Notes: 1 – Includes Tunnel of Gardunha (2,3 km) n)NCLUDES4UNNELSOF2AMELAAND"ARRACáO The structure also includes 3 Aiding and Maintenance Centres, 1 main one (Lardosa), and 2 secondary ones (Envendos and Caria), in addition to 5 Service Areas: s!BRANTES3! s6ILA6ELHADE2DáO3! s#ASTELO"RANCO3! s&UNDáO3! s'UARDA3! 8 Annual Report and Accounts 2010 Concession Map Annual Report and Accounts 2010 9 2 – Macroeconomic Background The world’s economy has registered a more favourable development in 2010, and the process of economic recovery is expected to continue moderately throughout 2011. The price for raw materials has significantly increased, and had an impact on the evolution of inflation rates in general, and on emerging economies in particular. Global financial conditions have improved, along with a reduction of the volatility in financial markets. The “ghost” of foreign aid actions for economic stabilisation and support of the respective financial systems still hovers over several European States, and namely over Portugal. This fact, arising from the fears regarding debt sustainability, the difficulties of budgetary consolidation, and investors’ scepticism regarding the potential for future economic growth, causes considerable difficulties in obtaining funding for the Portuguese economy, and the consequent incentive to reduce indebtedness both within the public sector and private sector, and to limit expenses. In Portugal, and after the GDP’s growth in about 1.2% in relation to the previous year, the return to a recession environment is expected in 2011, regardless of the positive contribution of foreign net demand. In the following years, the return to a more normalised context of growth shall in good measure depend upon the reach and success of the correction measures which have been implemented. GDP in Volume Quarter IV Qtr. 07 IV Qtr. 08 IV Qtr. 09 IV Qtr. 10 Portugal 2.4 -2.0 -1.0 1.2 Eurozone 2.2 -2.1 -2.1 2.0 Source: Bank of Portugal According to estimates, the real term GDP registered identical variations of 2.0% and 2.1% in the fourth quarter of 2010, in the Euro Area (EA) and in the European Union (EU27), accordingly, which is compared with the 1.9% and 2.2% rates observed in the previous quarter. In Portugal, according to the latest estimates, the GDP has shown an identical variation of 1.2% in volume, in the fourth quarter of 2010 (1.4% in the third quarter). The contribution of goods and services exports for the GDP identical variation was slightly inferior to what the previous quarter revealed, and private consumption slowed down. The business activity indicator worsened in the fourth quarter of 2010, thus bringing the previous rising tendency to a halt. However, this indicator became stable in December. The private consumption indicator slightly slowed down in the fourth quarter of 2010, as a result of the negative contribution of the regular consumption component. However, it accelerated in December. In that same quarter, the GFCF indicator showed a less intense reduction, thus reflecting the positive evolution of the transport components, as well as the machinery and equipments components. In December, this indicator registered a less emphatic decrease as opposed to November. Regarding the international trade of goods, the fourth quarter of 2010 witnessed identical nominal growths of imports and exports, of 10.3% and 15.8% (5.2% and 15.1% in the third quarter), accordingly. On the other hand, the economic climate indicator decreased in the fourth quarter of 2010. 10 Annual Report and Accounts 2010 In 2010, the Consumer Price Index (CPI) registered an average variation rate of 1.4% (-0.8% in 2009). Excluding energy and unprocessed food (indicator of core inflation), the respective annual average variation rate was practically unchanged, keeping at 0.3% in 2010 (0.4% in 2009). In December, the identical monthly variation of the CPI was 2.5%, surpassing the one verified in the two previous months by 0.2 pp, while the variation of the core inflation indicator was set at 0.9%, less 0.2 pp than in November. In December, the prices of components of goods and services of the CPI showed an identical growth of 3.4% and 1.2% (3.0% and 1.2% in November), accordingly. The difference between the Harmonised Consumer Price Index (HCPI) of Portugal and the EA decreased 0.1 pp in December, falling at 0.2 pp. IPC Evolution % 4,0 3,5 3,0 2,5 2,0 1,5 1,0 0,5 0,0 -0,5 -1,0 -1,5 Jan-07 Feb-07 Mar-07 Apr-07 May-07 Jun-07 Jul-07 Aug-07 Sep-07 Oct-07 Nov-07 Dec-07 Jan-08 Feb-08 Mar-08 Apr-08 May-08 Jun-08 Jul-08 Aug-08 Sep-08 Oct-08 Nov-08 Dec-08 Jan-09 Feb-09 Mar-09 Apr-09 May-09 Jun-09 Jul-09 Aug-09 Sep-09 Oct-09 Nov-09 Dec-09 Jan-10 Feb-10 Mar-10 Apr-10 May-10 Jun-10 Jul-10 Aug-10 Sep-10 Oct-10 Nov-10 Dec-10 -2,0 Eurozone Portugal In the fourth quarter of 2010, the unemployment rate was 11.1%, plus 1.0 pp than in the identical quarter, a new maximum for the series initiated in 1998. Employment went from an identical variation of -1.1% in the third quarter of 2010 to -1.5% in the fourth quarter. Unemployment Rate Area IV Qtr. 07 IV Qtr. 08 IV Qtr. 09 IV Qtr. 10 Portugal 7.8 7.8 9.8 11.1 Eurozone 7.3 8.0 9.7 10 Source: Bank of Portugal In short, the implicit framework of these previsions indicates a slight and timid recovering of the global economy. In any case, there are some factors which behave somewhat unpredictably, and which may condition such a recovery. On this level, we believe that the behaviour of fuel prices and interest rates are decisive variables in this process, and that together with the budgetary austerity measures, they will most probably lead to a situation of economic recession in Portugal. As expected, macroeconomic circumstances have influenced the behaviour of the national road sector. Actually, traffic performance is a direct function of economic growth. Therefore, the year 2010 showed a tendency for stagnation. On the other hand, the profile for inflation directly influences the road tariffs to be applied. Therefore, the latter will not be subject to any updating in the year 2011. Annual Report and Accounts 2010 11 3 – Business Activity 3.1 – Overview Similarly to its previous year, the year 2010 was characterised by the world economic and financial crisis, which had deep consequences in the national road sector, namely as regards traffic levels. On the other hand, and reaching the highest point of a long process, the Portuguese State defined the options regarding the Sector’s funding, choosing to apply the User Pays principle in Road Concessions which had until now been user cost free. Regarding our Concession, the toll fee collection system shall enter into force on April 15, 2011, in compliance with the Council of Minister’s Resolution n.º 75/2010. Another fact characterising the 2010 fiscal year, were the deep changes introduced to the accounting system, arising from the implementation of the Accounting Standardisation System (SNC) in general, and from Interpretation 12 of the International Financial Reporting Interpretations Committee (IFRIC12) – Service Concession Agreements, in particular. The adverse macroeconomic reality led us to take adjustment measures allowing to mitigate the former’s effects. The adequacy capacity shown by the operational structure surpassed expectations, and allowed to minimise the economic effects ensuing from the traffic scenario, which fell short of what was expected. Regarding measures aiming at a greater operational flow, the highlight is the outsourcing of civil maintenance and conservation operations, and consequently the changes of the organisational structure and a reduction of the number of organisation collaborators. Throughout the 2010 fiscal year, the Concessionaire fulfilled its contractual obligations, ensuring the operation and maintenance of A23, in conformity with the provisions of the Concession Agreement. We must also highlight the continuous efforts to strengthen the providing of a quality service near the users. To that effect, we have strived to ensure a greater support and proximity to the users, through the existing communications network, mobile teams – working 24 hours a day, 365 days a year – SOS stations, and variable message signs. As usual, Scutvias cooperated with local public and private entities, aiming to contribute to the development of Beira Interior. To this end, we have been privileging the support to local institutions, namely higher education institutions, and the preferential recruitment of local companies. A deep involvement with the theme of Road Safety justifies the need to continue to develop countless awareness campaigns regarding road safety and citizenship issues near the younger local, either directly or in cooperation with other entities. To this regard, we highlight the developed Road Safety Campaign, which is an absolute demonstration that the cooperation and meeting of wills between private initiative and State institutions and bodies, is both desirable and advantageous. Scutvias therefore thanks the district governors of Castelo Branco, 12 Annual Report and Accounts 2010 Guarda, and Santarém, as well as the district authorities of the National Republican Guard for their participation and commitment. Lastly, we must also mention that we have sought to maintain a constructive and mutual understanding conduct in our institutional relationship with the Grantor (the Portuguese State), and its formal representative (IniR), as well as with the Financing Banks. 3.2 – Operations Area Scutvias’ intervention and operation area comprises 178 Km of motorway, and includes the regular maintenance and surveillance of 28 motorway junctions, 8 tunnel galleries, 69 Km of national/municipal roads on A23 access points, 118 cattle passes, and 100 Km of motorway parallel routes, as well as controlling the five service areas in the Concession. The facilities of the Lardosa Servicing and Maintenance Centre carry out all monitoring and control of the traffic counting and classification equipment, of the optic fibre network, SOS telecommunications, VARIABLEMESSAGESIGNSVIDEOSURVEILLANCEEQUIPMENTSANDTUNNELEQUIPMENTS"ARRACáO2AMELAAND Gardunha I and II). The Operation Area is responsible for front-office functions near the Grantor and the Users, and comprises the User Assistance Service, and the IT and Toll Service. 3.2.1. User Assistance Service The User Assistance Service’s main concern is the users’ well being, comfort and safety. Proving just that, more than 700.000 kilometres were driven providing assistance, aiding with accidents, and other incidents, the average time of assistance performance being 21 minutes. Mobile Assistence Km - 2010 70000 60000 50000 40000 30000 20000 10000 0 Jan. 10 Feb. 10 Mar. 10 Apr. 10 May. 10 Jun. 10 Jul. 10 Aug. 10 Sep. 10 Oct. 10 Nov. 10 Dec. 10 Total Monthly/Km The global aim set for the year 2010 continued to focus on patrolling efficiency and effectiveness. To that effect, we used the setting of regular routes, and specific routes for periods with great traffic, such as Easter, summer, Christmas, and New Year’s Eve, as well as in adverse climate situations. However, Annual Report and Accounts 2010 13 and since it holds an exceptional quality, we must include the exclusive patrolling made during a major repair on the Stretch Castelo Branco Soalheira, which resulted in an addition of about 42.266 km, as well as the patrolling made to PK 50,4 work of art (Mouriscas Overcrossing), which was being a target for criminal acts related to stone throwing onto the road, and which resulted in 2.387 kilometres. Performance Categorization: TYPE Regarding performances, we highlight the fact that the average user contact time showed a slight increase regarding the previous year, the reason being an increase of the number of assistance situations in specific periods of a greater traffic flow, such as Easter, summer, Christmas, and New Year’s Eve, as well as adverse climate situations. As regards the road cleaning item, there was a decrease related to the inclusion of this task in the maintenance contracts. Type Average Time Contact User 2010 2009 2 999 3 233 00:21:21 00:20:43 Total Surveys 2 345 2 004 Answered Surveys 2 118 1 372 Unansweres Surveys 219 632 344 230 Performance Time CCT 00:12:47 00:16:36 Travel Time MV 00:13:28 00:11:49 Performance Time Accidents 01:13:21 01:21:05 Lane Cleaning 2 854 6 033 Infrastructure Surveillance 2 098 1 948 Road Surveillance 409 538 Other Services 1 280 1 349 Total 9 974 13 331 Performance 2010 1200 1000 800 600 400 200 0 Jan. 10 Feb. 10 Mar. 10 Apri. 10 May. 10 Jun. 10 Jul. 10 Aug. 10 Sep. 10 Oct. 10 Nov. 10 Dec. 10 Assistence Accidents Lane Cleaning Infrastructure Surveillance Road Surveillance Other Services During the year 2010, we also initiated support missions regarding road inspection, road safety awareness, and road safety, together with the three Traffic Secondments of the National Republican Guard (Santarém, Castelo Branco and Guarda), as well as with the Local Administration Offices of Santarém and Castelo Branco. In addition to such actions, there was also a Road Safety Campaign with the theme “ON THE ROAD? I COMPLY”, which began in April and comprised several initiatives from its beginning, including awareness actions taking place in service areas, in the assistance provided to users, and which peaked with the survey taking place on the last weeks of the year. This project is expected to end in February 2011, with the corresponding submission of results. 14 Annual Report and Accounts 2010 3.2.2 – Road Accidents ITEMS 2010 Number of Accidents In 2010, there were 344 accidents in the Concession, 64 of them with victims resulting in 2 dead, 15 seriously wounded, and 88 light wounded. As opposed to 2009, there was an increase in the number of accidents (+113 accidents) and in the number of victims. The explication is based on the change of the classification criteria of the accidents as collision with object and collision with animal. As regards the number of victims, the criteria also changed, a 30 day follow-up of the victims now being necessary. 2009 344 231 Vehicle Loss os Control 224 175 Collision 72 56 Run Over 0 0 Collision with animal 16 0 Collision with object 32 0 Total victims 105 100 Light wounded 88 91 Seriously wounded 15 9 Deceased Accidents with victims 2 0 64 73 Accidents without any victims 280 158 I Accidents 9.34 9.49 I Total Accidents 50.21 33.72 The accident categorization and analysis allow for the conclusion that the 2010 data worsened in comparison with the year 2009. The Accident Rate shows a slight improvement compared to 2009, resulting from the decrease in accidents with victims, while the complete Accident Rate suffered an increase. Accidents Trend 350 300 250 200 150 100 50 0 2005 2006 Accidents 2007 2008 2009 Accidents without victims 2010 Accidents with victims 3.2.3 – Concession Traffic Stretch During the year 2010, the traffic volume had a positive global growth, reaching 108.43 million vehicles, corresponding to a 10.574 vehicles/km AADT, which is a global increase of about 0.26% compared to 2009. We must point out that there was a decrease in the year’s second semester. Traffic registered by the end of July showed an identical variation of -1.36%. On the other hand, there was a recovery in comparison with 2009, especially in the northern stretches. Variation Abrantes / Mouriscas 0.4% Mouriscas / Gardete -0.5% Gardete / Castelo Branco -0.2% Castelo Branco / Alcaria 0.7% Túnel da Gardunha 0.4% Alcaria / Belmonte (Teixoso) 0.6% Belmonte (Teixoso) / Guarda 0.2% Total 0.2% Annual Report and Accounts 2010 15 The unfavourable economic environment influenced the traffic volume. Therefore, there was a very slight increase in the traffic volume in comparison with the previous year. Traffic Evolution 1 950 000 1 900 000 1 850 000 Accumulated AADT 1 800 000 1 750 000 1 700 000 1 650 000 1 600 000 1 550 000 1 500 000 1 450 000 1 400 000 Jan Feb Mar 2004 Apr May 2005 Jun Jul Aug 2008 2007 2006 Sep Oct Nov 2009 Dec 2010 In February 2010, there was a new traffic study made, called Forecast 2010. The chart bellow shows the comparative analysis of the average real traffic of 2010, with the forecast of the new traffic study, and bands 1 and 2 of the base case. It should be noted that global compliance level, in terms of global actual traffic volume for 2010, corresponds to 97.5% of Forecast 2010, a value well above the value issuing from the comparison with the original traffic study. Traffic 2010 30 000 25 000 20 000 15 000 10 000 5 000 0 Abrantes Mouriscas Mouriscas Gardete Actual 2010 Gardete Castelo Branco Castelo Branco Alcaria Forec 2010 Túnel da Gardunha Band 2 Band 1 + Band 2) which shows a compliance level of just 67.6%. Alcaria Belmonte (Teixoso) Band 1 Belmonte (Teixoso) Guarda 16 Annual Report and Accounts 2010 Given the structure of the band receipts, which was initially applied in 2005, this deviation does not have a directly proportional relation with traffic originated revenues. As we may verify in chart down, and considering the values for the upper limits and tariffs inherent to the different bands for this year, the whole of Band 1 has been fulfilled, with a weight of 89% of all the payments under the Basic Case. Also, about 23% of the feasible revenues under Band Income Simulation – 2010 Band 2 were achieved. The sum of the values of both bands amounts to about 140 000 91.9% of the reference turnover of the 120 000 Basic Case. 100 000 80 000 Forecast 2010 estimates different revenues under Band 2. In this way, Band 1 is also fulfilled, and about 82.75% of the feasible revenue in Band 2 is achieved. The sum of the values of both bands amounts to about 99.44% of the whole of the turnover considered in Forecast 2010. 60 000 40 000 20 000 0 Basic Case Band 1 Band 2 Forec 2010 Forec 2010 Band 1 Forec 2010 Band 2 Actual Actual Band 1 Actual Band 2 3.3 – Technical Area Following the internal restructuring process, there was an outsourcing of most of the activities related to civil maintenance, both regular and extraordinary. As regards management systems, there was a continued implementation of the geo-referenced inventory system. This application, which works together with the already implemented applications, namely the applications for work of art management, pavement management, and inspection management, will allow for the gradual development of more and better information on the infrastructure status, and consequently the methodical development of an important planning support and decision-making tool. Regarding planning, we must mention the adjustment made to the Major Repairs plan. There was a development of activities needed to ensure the road’s quality and safety through external specialised autonomous teams. In the year 2010, Scutvias continued to supervise and manage the concession’s sensitive areas, namely pavements, slopes, works of art, signalling, and environmental markers - air, water and noise. Following these proceedings, we highlight the most relevant interventions: s#OMPLETIONOFTHEDRAININGREHABILITATIONWORKSCENTRALDIVIDERANDSIDEEDGELINESINTHE3OALHEIRA Stretch, which began in the end of 2009; s-AINTENANCEINTERVENTIONSINTHEDILATATIONJOINTSOFSEVERALWORKSOFART s0AVEMENT REPAIRS IN THE 3TRETCHES -OURISCAS'ARDETE 'ARDETE#ASTELO "RANCO AND 3UBSTRETCH Benespera/Guarda, and subsequent repainting of the road marks; s%XECUTIONOFTHESTSTAGEOFPAVEMENTIMPROVEMENTINTHE3TRETCH#ASTELO"RANCO3OALHEIRA4HE 2nd stage of the works is planned for the year 2011; s2EPLACEMENTOFTHESIGNALLINGEQUIPMENTNAMELYSIDEINFORMATIONSIGNSWHICHWERENONCOMPLIANT with the established parameters; s)NTERVENTIONSTOREPLACETHESTABILITYOFSOMEOFTHEEXCAVATIONSLOPES Annual Report and Accounts 2010 17 Among the regular activities developed by this sector, we may highlight the repair of accident damage, the repair of old pavement cracks, drainage material and slope cleaning, trimming of roadside vegetation, ongoing maintenance works, and adequate road signalling in areas subject to traffic restrictions. Regarding the conservation of vegetation, and in addition to ongoing regular works, there was also a ground clearing of about 360.000 sq m of roadside slopes. 3.4 – Information Systems and Telematics Area We have joined the IT and Toll Service (SIP) with the Electromechanical Installation Service (SIE) to form the Systems and Telematics Service (SST), aiming to improve internal proceedings, especially regarding their flexibility and fluidity. There has been an optimisation of the allocation of preventive and corrective maintenance tasks associated to each system, to the existing resources. Therefore, the Systems and Telematics Service (SST) is responsible for managing the contracts with outside suppliers, namely the Tunnel Maintenance Contract and the Shadow Toll and Road Telematics Maintenance Contract, for the maintenance of electrical, electromechanical and lightning systems, the maintenance and management of internal information systems, shadow toll systems, road tunnel systems, and road telematics subsystems (PMV; Weather Stations, SOS, CCTV), as well as for system development and Service Desk. In order to assess the proper functioning of the Shadow Toll System (SPV) and according to the Quality Control Plan, several verification inspections are carried out throughout the year. Such inspections compare real time vehicle count and classification with SPV’s records. The following table shows the results of said verification inspections, which were carried out by Scutvias throughout 2010: Year Period N.º of Verifications N.º of Vehicles N.º Video Minutes Verif. % Category Errors % Class Errors % Counting Errors 0.03% 2010 1.º Quarter 432 57 127 12 960 0.33% 1.61% 2010 2.º Quarter 400 56 028 12 000 0.29% 1.54% 0.04% 2010 3.º Quarter 362 55 505 10 950 0.65% 1.52% 0.20% 2010 4.º Quarter Accumulated 2010 Errors acknowledge by EP 392 55 096 11 030 0.50% 1.68% 0.06% 1586 223 756 46 940 0.44% 1.59% 0.08% 5.0% 12.0% 1.0% The analysis of this parameter, which embodies the Grantor’s satisfaction indicator, indicates that the results are similar to those of previous years, and far below the limit established by the Concession Agreement. The information systems continue to receive Scutvia’s special attention, since they are considered to be one of the strategic pillars of its action. Therefore, a great part of developed projects especially focus on information systems. 18 Annual Report and Accounts 2010 Projects developed throughout the year: Road Infrastructure Inventory and Management System of Scutvia’s Concession – With the purpose of providing Scutvias with detailed and updated information on the whole of the infrastructure and equipment installed throughout concession A23, the 2nd stage of the Road Infrastructure Inventory and Management System has been developed and implemented. This stage’s aim was to make inspection records by element, and to obtain reports. Data Centre Recast – The solution found to avoid interruptions in the several telematics systems (Shadow Toll, SOS and Tunnels), focused in the elimination of the identified hot spots, and in creating a basic technological infrastructure which allows keeping up with business needs, swiftly and with low investing. Server Virtualisation – The servers supporting the following systems have been replaced: Shadow Toll, Tunnels, SOS, Road Telematics, Document Management, Intranet, and file sharing. The applied solution was based on server virtualisation, i.e. 1 physical server enables the performance of numerous virtual servers, which bears several advantages, namely an increase of system availability, and a decrease of energy consumption. Control Dampers – Aiming to reduce energy consumptions, there was an installation of control dampers in several road junctions. Tunnel Equipment Maintenance Contract 2011 – There was an invitation to tender for Tunnel Equipment Maintenance. Thus, the contract to be in force in 2011, will allow for a reduction of the external costs regarding tunnel equipment maintenance, a greater rationalisation of internal resources, and a greater service level and ability to respond, through the implementation of contractual SLA’s (Service Level Agreements). Road Maintenance and Telematics Contract 2011 – There was an invitation to tender for the Preventive and Corrective Maintenance of Road Telematics Equipment. Thus, the contract to be in force in 2011, will allow for a reduction of the external costs regarding the maintenance of road telematics equipment and systems, a greater rationalisation of internal resources, and a greater service level and ability to respond, through the implementation of contractual SLA’s (Service Level Agreements). EasyWay Annual Forum – Scutvias participated in the Organising Committee of the EasyWay Annual Forum, which took place from the 16th to the 18th of November of 2010. The project deals with the European-wide implementation of ITS throughout the main corridors of the Trans-European road network (TERN), in 21 of European Union Member States. This project will be developed by national road authorities and operators, in cooperation with public and private partners, and will be supported by the European Commission. (RTE-T Program). SST (Surveys) – Operationalisation of the application for online surveys. It is used to upload the results of the surveys made following the road safety campaign carried out during 2010. Annual Report and Accounts 2010 19 3.5 – Administrative and Financial Area Among the many facts taking place in the year 2010, the following should be highlighted: s2ESERVE"ANK!CCOUNT-ANAGEMENT%)"2ESERVE!CCOUNT"ANKS2ESERVE!CCOUNTAND,IQUIDITY Reserve Account), in conformity with contractual obligations; s$RAFTINGANDAPPROVALBYTHE&INANCING"ANKSOFTHEBIANNUAL&ORECASTS!PRILAND/CTOBER s$RAFTINGAND!PPROVALOFTHE/PERATION-AINTENANCE"UDGETFOR s&OLLOWUPOFTHERENEWALPROCEEDINGSFORTHE)NSURANCE0ORTFOLIO All activities in this area progressed normally, with the management of suppliers, invoicing to the Grantor and to the clients, fulfilling of the contractual obligations with the Grantor and the Banks (financial information, Forecasts, etc.), information to the shareholders, reduction of Support Guarantees, management of VAT refunds, etc. During the year 2010, the Company continued to be advised and supported by legal counsel regarding several types of Contracts (Concession, Labour, Services, and Leases). We would like to highlight the Management of several Insurance Policies, namely All Risks (Industrial multi-risk), Terrorism and Sabotage, CAR/EAR (Works and Installations), Public Liability/Operation, Work and Vehicle Accidents. Regarding administrative proceedings, a new evaluation system was implemented, based on the fulfilling of pre-set aims. In relation to the above, new rules were set for the awarding of the Performance Award. The latter is a direct function of the worker’s evaluation. We should also highlight the implementation of a new ERP, which enabled the framing of the recent changes stemming from the new accountancy rules, on the one hand, and promoted a greater interaction with other already developed computer applications, namely the application of document management (document filing and digital work-flow), on the other hand. Regarding the fleet, the rationalisation in resource management persists, which enabled a cost reduction. 3.6 – Human Resources Area During the fiscal year of 2010, there was a staff reduction of 26 workers, laid off due temporary employment contract suspension. On the other hand, within the scope of the internal restructuring, there was an integration of SIE workers in the SST, which contributed for the ongoing improvement of our internal proceedings. The underlying Human Resources activities proceeded, particularly as regards Training Management, considering the different levels and aims intended for each group of workers. 20 Annual Report and Accounts 2010 3.6.1 – Staff On the 31st of December, 2010, Scutvias, S.A. employed a total of 56 hired personnel, and 1 employee temporarily assigned by the Shareholders, acting as Assistant CEO. 3.6.2 - SCUTVIAS, S.A. Staff Scutvias Staff General Directors Chief Executive Officer 1 Technical Area (assigned by the Shareholders) 1 Directors Operations Director 1 Maintenance Director 1 Administrative and Financial Director 1 Remainder Personnel Non-Specialised Personnel 10 Semi-Specialised Personnel 15 Specialised Personnel 17 Middle Management 6 Senior Management 4 Total – Scutvias Staff 57 Evolution Summary 2004 2005 2006 2007 2008 2009 2010 Officers Assigned by Shareholders 7 7 6 6 4 1 1 Other Assigned Staff 3 3 1 1 0 0 0 Hired Personnel 91 99 100 100 94 88 56 Total 101 109 107 107 98 89 57 3.6.3 – Composition of the Staff Of the total 56 Scutvias employees, 40 are male and 16 are female. The average employee age is 37 for men and 38 for women. Educational Structure Men Women Total Basic Education 1 0 1 Secondary Education 30 12 42 Professional Development 0 0 0 Higher Education 9 4 13 Others 0 0 0 Total 40 16 56 Annual Report and Accounts 2010 21 3.6.4 – Absenteeism Rate Regarding the Absenteeism Rate, the review of the period 2006-2008 shows a fall in 2007 (2.16% to 0.9%). There is a slight increase to 1.06% in 2008, and a significant increase in 2009 to 4.45%. As regards 2010, there is an increase to 5.57%. When analysing the motives leading to the above rate, we concluded that the most significant causes were parental leaves, and mainly long term absences due to illness, together with other small duration leaves, and absences of a general character. 3.6.5 - Training Regarding the training policy, and similarly to previous fiscal years, we continued to favour it, both internally and on the outside, its purpose being to enable workers to acquire and develop new skills. Regarding Training Actions provided by specialised outside agents, we highlight the following themes: Discussion on Economy and Development Portugal Acolhe Programme - Portuguese Cross-Border Roads Issue Datrex II Forum Berlin Workshop 2010 ITS Portugal 2010 International Relations 16th World Road Meeting “Sharing the Road” RVCC (Skill Acknowledgement, Validation, and Certification) Accounting and Administration Secretariat Road Pavement, Materials, Dimensioning, and Development Project Road Safety – Its Implementation in the Work’s Development Easyway Annual Forum 2010 3HOWn2OOM,LED)LUMINA½áO EXPO RH (HR EXPO) – 9ª Edition Management Simulator &RUMDE)NOVA½áOE.ORMALIZA½áO)NNOVATIONAND3TANDARDISATION Forum) Certified Accountant Complaints’ Management Financial Management for Executive Staff Primavera Application – Accounting Module Primavera Application – Payroll Processing English Civil Engineering English I Attorneyship English II Pavement Designing and Rehabilitation 30 workers participated in these Actions, amounting to 1.720 hours. The ongoing internal training actions amounted to 1.126 hours of training and involved 35 employees, comprising the following themes: Telematic Applications Document Scanning and Filing, Financial Journals Miscellaneous (internal and outside) Document Drafting Road Surveillance (Miscellaneous Document Drafting) Accounting Basics Interpersonal Relations Tunnel Management System Client Service Management 22 Annual Report and Accounts 2010 3.7 – Quality Management System Scutvias owns a Quality Management System (SGQ) certified by ISO 9001:2000 in May 2005, and renewed in June 2009 by ISO 9001:2008. The SGQ is part of Scutvias’ Management Model. The SGQ is based on 3 fundamental orientations: Client (Grantor / User) satisfaction, ongoing improvement, and process approach. Throughout 2010, the Quality Management System was perfected towards a formal system, and as a systematization aiming to a better management. In 2010, we set actions to increase activity and proceedings efficacy and efficiency, in such a way as to benefit the organisation, users, and the Grantor. 2010 quality aims and indicators were set according to the Balanced Scorecard management model for the deconstruction of vision and strategy into financial perspectives, internal proceedings, learning, and Growth and Innovation. The Quality Management System monitored aims and indicators with monthly frequency, for a good follow-up of proceeding performance. Such monitoring led to the conclusion that not all goals were achieved. This conclusion was followed by the respective review to set and implement improvement measures. As for User satisfaction regarding the provided service, the goals were achieved. 3.8 – Health, Hygiene, and Safety at Work Regarding Health, Hygiene, and Safety at Work, and in addition to the activities ensuing from the strict compliance with the Law, we wish to highlight the following activities: s!SSESSMENTOFSAFETYANDHEALTHCONDITIONSATWORKSPECIFICALLYASSESSMENTOFTHELIGHTINGOFTHE head office, and of safety and health conditions at the head office’s workplaces; s/NSITESUPERVISIONOFALLONGOINGANDISOLATEDMAINTENANCEACTIVITIES s3AFETYCOORDINATIONOFTHEWORKSFORh$RAINAGE)MPROVEMENTIN#ONCESSION!vANDh)MPROVEMENT and Paving of Stretches in Concession A23”; s3AFETYMONITORINGOFWORKEQUIPMENT s$EVELOPMENTOFSPECIFICINTERNALTRAININGACTIONSREGARDING3AFETYAND(EALTHAT7ORKh0ERFORMANCE Rules for Risk Prevention in the Activities Carried Out in the Concession”, as well as the development of specific training actions for contractors working in Concession A23; s!IMINGTOINTEGRATETRAINEESOF.%2#!"S3AFETYAND(EALTHAT7ORKCOURSEINTHECONTEXTOFTHE labour market, Scutvias enabled a practical traineeship in a work context. s4HERISKSWEREASSESSEDANDCLASSIFIEDFORALLACTIVITIESTAKINGPLACEINTHE#ONCESSIONANDTHEWAY in which to control them was planned, according to the Simplified Evaluation Method. Annual Report and Accounts 2010 23 s7ASTE -ANAGEMENT AND COMPILING OF ELEMENTS FOR THE )NTEGRATED 7ASTE 2ECORDING OF THE Portuguese Environment Agency (SIRAPA), and respective dispatch to the Portuguese Environment Agency (APA). s0ROMOTION OF GOOD ENVIRONMENTAL PRACTICE IN WASTE SORTING AT PRODUCTION SITES AND RESPECTIVE adequate routing for recovery, recycling, and final destination. 3.9 – Social Responsibility Road safety has always been one of the pillars of Scutvias performance, which is why we are committed to the European Road Safety Charter. In this strategic context, we have launched a new campaign during 2010, within this scope: Road Safety Campaign The Road Safety Awareness Campaign, with the mascot “Topas”, which reaches the younger population – future users of the A23 –, took place from April to the end of December, 2010. The campaign deals with the use of seatbelt, excess speeding, and consumption of alcoholic drinks. It involved the Local Administration Offices of Santarém, C. Branco and Guarda, and racing pilot Francisco Carvalho (the campaign’s godfather). In addition to the service areas, the campaign was THESTRONGESTIN!BRANTES#ASTELO"RANCO&UNDáO#OVILHáAND'UARDA This campaign is not unique. In previous years, Scutvias organised other campaigns, namely Securarte Project, and the Auto Simulator, which targeted the younger population, as well as a daily presence in local radios. Trying to reach a greater proximity regarding the populations using A23, we launched a bimonthly publication, “Autoestradas da Beira Interior” (“Motorways of Beira Interior”), and we produced a (bilingual) institutional film for the Grantor. These actions are joined by the continuity of other measures taken in previous years, namely the study visits to the Lardosa Assistance and Maintenance Centre. Also aiming at a greater regional proximity, we associated ourselves to the event DINOEXPO “Dinossáurios invadem o Geopark” (“Dinosaurs invade Geopark”), a joint organisation of the Dutch company Creatures & Features and of Geopark Naturtejo, which was held at NERCAB Exhibitions Centre, in Castelo Branco, from the 27th of March throughout the end of October, 2010. The cooperation reinforcement between Higher Education institutions and the business sector has enabled undeniable contributions to both parties, both with protocols established with the University of Beira Interior, and with the Polytechnic Institute of Castelo Branco. Through Scutvias’ activity and following a policy of proximity with the region where it is implemented, we continued to organise actions in partnership with public and private entities for the development of the Beira interior Region; an example of just that is the Beira Interior Music Festival; we brought together 5 schools and 1 classical music association, with the support of the Local Administration of the Castelo Branco district, and with the participation of the mayors where the concerts took place: Vila 6ELHADE2DáO#ASTELO"RANCOAND'UARDA 24 Annual Report and Accounts 2010 In an environmental and ecological perspective, we highlight the third year of the Forestation Project for the Junctions belonging to the Castelo Branco District, which involved the following state entities: Local Administration of the Castelo Branco District, Civil Protection, Police Forces (GNR), and students from the region’s schools. We aim at making youngsters aware of the need to preserve the environment, and at showing the compatibility of a road structure and the environmental cause. The evaluation of the last 3 years results in 41 schools which were rallied and involved, with the participation of 2.851 students between the ages of 6 and 16. 6.000 trees were planted in the 14 chosen junctions between Gardete and Belmonte Norte. The trees were from that region and were incorporated into their habitat: stone pine, cork oak, and strawberry tree. As regards corporate social responsibility, Scutvias has been associating itself to several social causes. The “Aldeias de Crianças SOS” (“SOS Children Villages”) are an extremely worthy social project, which deserve our greatest affection, consideration, and support. This support became formal through the protocol signed on the 2nd of May, 2010, and embodies the sponsorship of Casa Nossa Senhora da Vitória. Also within the scope of social patronage, last Holidays we supported some voluntary organisations. 4 – Economic and Financial Review Review of Results In the 2010 fiscal year, the company had a Net Profit of about EUR 10 Million, which makes for a Sale Profitability (Net Result / Provision of Services) of 8.78%. Unit. Euros Income and Gains Financial Statements 2010 Value 2009 Weight % Value 10/09 Weight % Var.% Sales and services provided 114 268 296.24 100.00 112 154 093.27 100.00 1.89 Supplies and services received -18 090 554.50 -15.83 -5 312 459.91 -4.74 240.53 Expenses with Personnel -2 025 545.53 -1.77 -2 523 257.41 -2.25 -19.72 Other Income and Gains 607 949.05 0.53 483 994.28 0.43 25.61 -441 444.15 -0.39 -725 328.98 -0.65 -39.14 94 318 701.11 82.54 104 077 041.25 92.80 -9.38 -33 766 872.33 -29.55 -33 692 112.81 -30.04 0.22 60 551 828.78 52.99 70 384 928.44 62.76 -13.97 Other Expenses and Losses Earnings before depreciation, financing expenses and taxes Depreciation and amortisation expenses/reversals Operating Profit (before financing expenses and taxes) Received interests and similar income 1 118 949.50 0.98 1 188 297.20 1.06 -5.84 Borne interests and similar expenses 45 440 619.89 39.77 49 304 536.68 43.96 -7.84 16 230 158.39 14.20 22 268 688.96 19.86 -27.12 -6 192 137.97 -5.42 -5 606 523.31 -5.00 10.45 10 038 020.42 8.78 16 662 165.65 14.86 -39.76 Earnings before taxes Income tax for the period Period’s net profit Annual Report and Accounts 2010 25 The Personnel Income Tax absorbs 5.42% of the latter. Therefore, the effective tax rate is 38.15% over the Earnings Before Taxes. The Earnings Before Taxes (RAI) represents approximately 14.20% of the Provision of Services, which indicates the large weight of the financial role in the Concessionaire’s Accounts, when compared to the Operating Income (52.99%). In fact, the Net Funding Structure comprises approximately 38.79% of the Provision of Services. The relation between the EBITDA (82.54% of the Provision of Services) and the Operating Profit (52.99% of the Provision of Services) shows the large weight of Fiscal Year Depreciation in the company’s structure. Income and Profit Review Income and Profits amounted to about EUR 116.0 Million, which represents an increase of 1.91% when compared to 2009. Unit. Euros Income and Gains Review Income and Gains 2010 Value 2009 Weight % Value 10/09 Weight % Var.% 114 268 296.24 98.51 112 154 093.27 98.53 Band 1 110 046 860.04 94.87 106 151 479.74 93.26 3.67 Band 2 3 176 181.50 2.74 4 980 052.85 4.38 -36.22 Provision of Services 1.89 Band revenues Service Areas Award Fees 145 861.56 0.13 145 861.56 0.13 Monthly Values 899 393.14 0.78 876 699.12 0.77 2.59 Other Income and Gains 607 949.05 0.52 483 994.28 0.43 25.61 Accident Compensations 494 358.71 0.43 381 159.13 0.33 29.70 Previous period corrections 62 555.11 0.05 78 723.07 0.07 -20.54 Other supplementary income 34 758.62 0.03 1 243.45 0.00 2 695.34 Assistance in A23 3 895.61 0.00 4 329.24 0.00 -10.02 Earnings in Tangible Assets 3 090.85 0.00 1 208.92 0.00 155.67 Received cash discounts 2 937.40 0.00 7 329.03 0.01 -59.92 21.15 0.00 1 887.47 0.00 -98.88 Exchange gains Others Received interests and similar income Income and Gains Total 6 331.60 0.01 8 113.97 0.01 -21.97 1 118 949.50 0.96 1 188 297.20 1.04 -5.84 115 995 194.79 100.00 113 826 384.75 100.00 1.91 The Provision of Services in general and Revenues per Band in particular, were influenced by the contractually established increase of the upper limit of Band 1 of traffic. On the other hand, the increase in traffic levels (TMDAE) by 0.2% had a slight positive influence. Band Receipts are responsible for 97.61% of all Income and Profits, and correspond to the valuation of road traffic in the Concession. As regards Income and Profits, we also highlight the Revenues of Service Areas and Interests, with 0.91% and 0.96%, accordingly, of the total of Income and Profits. 26 Annual Report and Accounts 2010 Expenses and Losses Review Expenses and Losses amounted to approximately EUR 99.8 Million. This value represents an increase of 8.96% against the 2009 EUR 91.6 Million. Unit. Euros Expenses and Losses Review 2010 Expenses and Losses Value 2009 % Value 10/09 Var.% % Operating Expenses and Losses 20 557 544.18 20.60 8 561 046.30 9.35 140.13 Received supplies and services 18 090 554.50 18.13 5 312 459.91 5.80 240.53 2 025 545.53 2.03 2 523 257.41 2.76 -19.72 441 444.15 0.44 725 328.98 0.79 -39.14 Depreciation and amortisation expenses/reversals 33 766 872.33 33.85 33 692 112.81 36.80 0.22 Borne interest and similar expenses 45 440 619.89 45.55 49 304 536.68 53.85 -7.84 Total of Expenses and Losses 99 765 036.40 100.00 91 557 695.79 100.00 8.96 Expenses with personnel Other expenses and losses Operational Expenses and Losses amounted to EUR 20.6 Million (20.60% of all Expenses and Losses), which represents an increase of EUR 12 million when compared to the 2009 EUR 8.6 Million. This accruement is explained by the increase in Supplies and Services Received, under Maintenance and Repairs. Unit. Euros Received Supplies and Services Review Received Supplies and Services Maintenance and repairs 2010 Value 2009 % Value 10/09 Var.% % 15 667 904.48 86.61 2 473 665.35 46.56 Specialised Works 902 814.32 4.99 1 169 004.13 22.00 533.39 -22.77 Insurance 461 522.12 2.55 570 539.24 10.74 -19.11 -18.46 Electricity 259 899.72 1.44 318 724.46 6.00 Fuel 183 810.22 1.02 172 353.23 3.24 6.65 Rentals and Leases 161 535.56 0.89 200 795.09 3.78 -19.55 Lagal Department and Notary Public 2 150.32 104 946.76 0.58 4 663.63 0.09 Communication 94 639.43 0.52 103 035.21 1.94 -8.15 Fees 89 295.94 0.49 99 847.99 1.88 -10.57 Materials 55 291.65 0.31 86 408.85 1.63 -36.01 Advertising and publicity 49 712.10 0.27 38 315.28 0.72 29.74 Travels and stays 32 387.50 0.18 44 066.01 0.83 -26.50 Cleaning, hygiene and comfort 15 520.91 0.09 17 741.55 0.33 -12.52 Water 3 736.15 0.02 2 842.42 0.05 31.44 Other RSS 7 537.64 0.04 10 457.47 0.20 -27.92 18 090 554.50 100.00 5 312 459.91 100.00 240.53 Total of Received Supplies and Services However, Costs with Personnel and Other Expenses and Losses have decreased when compared to 2009. Depreciation, which is responsible for 33.85% of the total Expenses and Losses, showed a variation of 0.22% when compared to 2009, and according to the investments which were made during the fiscal year. The interest charges, corresponding to 45.55% of the total Expenses and Losses, show a -7.84% variation when compared to 2009, according to the debt repayments made during the fiscal year. Annual Report and Accounts 2010 27 Balance Sheet Review Scutvias has the typical asset structure of a motorway concession operator. In fact, Intangible Assets make up for to 82.82% of the Balance Sheet. Considering the contractual demands ensuing from the Project Finance agreement, Scutvias is required to maintain a high level of cash availability to guarantee the performance of its obligations near the Banking Syndicate and the EIB. Such Cash Availability makes up for 9.88% of the Balance Sheet. Unit. Euros Items Balance Sheet Review 2010 Value 2009 % Assets Value % Assets ASSETS Non current assets Tangible fixed assets Intangible assets Deferred tax receivables 662 343.21 0.09 628 143.22 0.08 628 536 460.98 82.82 662 063 481.25 83.30 11 386 609.83 1.50 11 066 611.96 1.39 640 585 414.02 84.40 673 758 236.43 84.78 Current Assets Clients State and other public agencies Other accounts receivable Deferrals Cash flow and bank deposits Total Assets SHAREHOLDERS’ EQUITY LIABILITIES Shareholders’ Equity Paid-in capital 86 076.97 0.01 167 617.39 0.02 103 303.71 0.01 101 504.62 0.01 42 844 355.08 5.65 39 117 571.90 4.92 347 566.37 0.05 297 469.41 0.04 10.23 74 992 688.14 9.88 81 316 049.64 118 373 990.27 15.60 121 000 212.96 15.22 758 959 404.29 100.00 794 758 449.39 100.00 49 200 000.00 6.48 49 200 000.00 6.19 7 202 534.99 0.91 0.43 Other shareholders’ capital instruments Mandatory reserves 3 851 455.52 0.51 3 451 163.28 Other reserves 7 043 939.10 0.93 3 863 347.34 0.49 Retained earnings -2 144 504.34 -0.28 -10 800 825.29 -1.36 Net profit for the period 10 038 020.42 1.32 16 662 165.65 2.10 Total Shareholders’ Equity 67 988 910.70 8.96 69 578 385.97 8.75 LIABILITIES Non current liabilities Received financing Bank loans 544 218 163.42 71.71 586 185 875.91 73.76 Shareholders’ loans 23 680 352.01 3.12 16 477 817.02 2.07 Deferred tax payables 17 813 523.21 2.35 17 630 307.89 2.22 Other accounts payable - Derivatives 41 405 853.94 5.46 44 266 447.83 5.57 627 117 892.58 82.63 664 560 448.65 83.62 Current liabilities Suppliers 254 474.50 0.03 313 872.90 0.04 2 388 367.17 0.31 820 583.56 0.10 Bank Loans 41 350 671.14 5.45 40 696 555.90 5.12 Interest on Bank Loans 10 136 848.63 1.34 10 739 286.42 1.35 766 008.72 0.10 1 177 777.56 0.15 Other accounts payable 3 349 857.63 0.44 1 119 303.65 0.14 Deferred liabilities 5 606 373.22 0.74 5 752 234.78 0.72 State and other public agencies Received financing Interest on Shareholders’ Loans 63 852 601.01 8.41 60 619 614.77 7.63 Total Liabilities 690 970 493.59 91.04 725 180 063.42 91.25 Total Shareholders’ Equity and Liabilities 758 959 404.29 100.00 794 758 449.39 100.00 28 Annual Report and Accounts 2010 Regarding Debt Receivable (5.65% of Assets), we highlight the Income and Profit related to Band Receipts, which due to contractual proceedings is not invoiced until January of the following year. Deferred tax receivables, related to the Swap’s Mark-to-Market variations, make up for 1.50% of the Balance Sheet. Shareholders’ equity make up for EUR 68.0 Million, approximately 8.96% of the Balance Sheet. In its composition, we highlight the Paid-in Capital, EUR 49.2 Million, making up for 6.48% of the Balance Sheet. Regarding Liabilities, Scutvias carries great levels of bank funding (77.15% of the Balance Sheet), mainly used in funding the construction of Motorway Stretches. The first repayment of principal was made in January, 2006. Also regarding Funding, we highlight the interest recognised during the fiscal year, which will be paid in March and April, 2011 (1.34% of the Balance Sheet). Payables to shareholder, regarding Shareholder’s Loans and interest’s thereon, make up for 3.22% of the Balance Sheet, approximately. The Other Payables – Not Current item regards the value of market-to-market contracted interest rate Swap, and makes up for 5.46% of the Balance Sheet. The Other Current Payables component amounts to 0.44% of the Balance Sheet. Deferred tax payables, which are essentially related to the Swap value of Intangible Assets, make up for 2.35% of the Assets. Ratios 2010 2009 Total Net Assets Indicators 758 959 404,29 794 758 449,39 Liabilities 690 970 493,59 725 180 063,42 Shareholders’ Equity 67 988 910,70 69 578 385,97 Turnover 114 268 296,24 112 154 093,27 EBITDA 94 318 701,11 104 077 041,25 EBITDA margin EBIT EBIT margin Net Profit for the Period 82,54% 92,80% 16 230 158,39 22 268 688,96 14,20% 19,86% 10 038 020,42 16 662 165,65 Net profit/Turnover 8,78% 14,86% Return on Equity 14,76% 23,95% 12,43% 13,10% 43 804 892,75 50 354 278,46 91,04% 91,25% 8,41% 7,63% 8,96% 8,75% 212,80% 216,30% 1,085 1,090 (Net profit/Shareholders’ equity) Return on Assets (EBITDA/Assets) Cash-flow (Net profit + Depreciation + Provisions) Debt-asset ratio (Liabilities / Assets) Short-term Debt Ratio (Current liabilities / Assets) Equity/Assets Ratio Shareholders’ Equity/Net Assets Interest Coverage [(EBITDA) / Interest Expenses] Fixed Assets Coverage [(Shareholders’ Equity + Non Current Liabilities)/Non Current Assets] Annual Report and Accounts 2010 29 5 – Payables to the State and other Public Agencies In accordance with the applicable legislation, we hereby state that Scutvias – Autoestradas da Beira Interior, S.A. is not in default regarding payment of any amounts owed to the State or Other Public Agencies. 6 – Conclusion Similarly to its previous year, the year 2010 was characterised by a deep economical and financial crisis, with considerable repercussions on society and on companies. The traffic performance throughout the year closely mirrors the difficulties faced by Portugal. In fact, light traffic indicates a loss of family available income, with the ensuing repercussions in consumption, whereas heavy traffic indicates economic stagnation. The year 2010 was also characterised by the political decision to introduce tolls fees to SCUT (User Cost Free) Concessions, in the inland. Due to the above, Scutvias had the need to readjust its organisation, therefore ensuring the sustainability of its business activity. Similarly to what happened in 2009, it is gratifying to see that such challenges have led the Organisation to show a great ability to adjust and to commit to the need to increase efficiency and efficacy levels. 7 – Outlook for 2011 The fiscal year of 2011 shall be the seventh year of the Operating Period and the Concession’s twelfth anniversary. All forecasts indicate that the year 2011 will be a year of economic recession, driven by budgetary austerity measures, by an increase in fuel prices, and by an increase in interest rates. On the other hand, everything indicates that the year 2011 will also be characterised by the introduction of toll fees in A23, which would entail deep changes in our business model. In these circumstances, we prudently face next year, aware that the management measures introduced during 2009 and 2010 must be maximized and complemented by further measures. Therefore, 2011 will be characterised by the furthering of the operational adjustment policy, to ensure an increase of internal proceedings efficiency, and of the Organisation’s productivity and competitiveness. Scutvias’ major strategic guidelines shall not change, without prejudice of occasional adjustments which may be called for. 30 Annual Report and Accounts 2010 Thus, our commitment to a cordial institutional relationship based on the uncompromised defence of the Company’s rights, and governed by equity, integrity and honesty criteria, continue to be a part of our key to success. Regarding our critical proceedings, we shall continue our quest for excellence and accuracy, so that we may ensure efficiency and profitability. Scutvias shall maintain a quality policy, which ensures user satisfaction, as well as the satisfaction of the Grantor and other stakeholders. To this end and similarly to previous years, we shall continue to focus on training. Following its large-scale introduction in 2009 and 2010, the increase of company employees’ educational level shall be one of our most important measures. Within the framework of social responsibility followed from the Concession’s beginning, Scutvias shall continue to promote road safety, among other measures. 8 – Acknowledgements The Board of Directors expresses its full recognition, and thanks all Entities which continue to grant us their confidence, namely the Portuguese State as Grantor and guarantor of the rights of Portuguese users, the Ministry of Public Works, Transport and Communications, the Ministry of Finance and Public Administration, the IniR Instituto Nacional de Infra – Estruturas Rodoviárias I.P. (Road Sector Regulatory Authority), EP-Estradas de Portugal S.A., the Financial and Banking Institutions and the Suppliers, all those who supported us in this Project, and who support us in its development. We thank the External Auditor (Deloitte & Associados, SROC, S.A.) and Statutory Auditor (Mariquito, Correia & Associados, SROC) for their accuracy, counselling, and monitoring. We thank all our workers for their permanent commitment and understanding. 9 – Proposed net Profit Allocation The Board of Directors proposes that the EUR 10,038,020.42 Net Profit of the 2010 fiscal year be allocated as follows: Mandatory Reserve ............................................ Dividends ........................................................... EUR 501,901.02 EUR 9,536,119.40 Lisbon, March 24, 2011. The Board of Directors FINANCIAL STATEMENT 32 Annual Report and Accounts 2010 Balance Sheets as at December 31, 2010 and 2009 Amounts expressed in EUR Items Notes 2010 2009 ASSETS Non Current assets Tangible fixed assets 7 662 343.21 628 143.22 Intangible Assets 8 628 536 460.98 662 063 481.25 Deferred tax receivables 11 11 386 609.83 11 066 611.96 640 585 414.02 673 758 236.43 35 814 699.54 Current assets Clients 9 39 221 430.11 State and other public agencies 12 103 303.71 101 504.62 Other accounts receivable 10 3 709 001.94 3 470 489.75 Deferrals 13 347 566.37 297 469.41 Cash and bank deposits 4 74 992 688.14 81 316 049.64 118 373 990.27 121 000 212.96 758 959 404.29 794 758 449.39 Total Assets SHAREHOLDERS’ EQUITY LIABILITIES Shareholders’ Equity Paid-in Capital 6 49 200 000.00 49 200 000.00 Other instruments of shareholders’ equity 14 0.00 7 202 534.99 Mandatory Reserve 14 3 851 455.52 3 451 163.28 Other reserves 14 7 043 939.10 3 863 347.34 Retained earnings -2 144 504.34 -10 800 825.29 Net profit of the fiscal year 10 038 020.42 16 662 165.65 Total Shareholders’ Equity 67 988 910.70 69 578 385.97 LIABILITIES Non current liabilities Received funding 6 e 17 567 898 515.43 602 663 692.93 Deferred tax payables 11 17 813 523.21 17 630 307.89 Other accounts payable 18 41 405 853.94 44 266 447.83 627 117 892.58 664 560 448.65 254 474.50 313 872.90 Current Liabilities Suppliers State and other public agancies 12 2 388 367.17 820 583.56 6 e 17 52 253 528.49 52 613 619.88 Other accounts payable 18 3 349 857.63 1 119 303.65 Deferrals 13 5 606 373.22 5 752 234.78 63 852 601.01 60 619 614.77 Total Liabilities 690 970 493.59 725 180 063.42 Total Shareholders’ Equity and Liabilities 758 959 404.29 794 758 449.39 Received funding This annex is part of the balance sheet as at December 31, 2010. The Certified Accountant The Board of Directors Annual Report and Accounts 2010 Income Statement Classified by Nature Of Fiscal Years Ended on December 31st, 2010 and 2009 Amounts expressed in EUR Income and Expenses Notes 2010 2009 Sales and services provided 19 114 268 296.24 112 154 093.27 Supplies and services received 20 -18 090 554.50 -5 312 459.91 Costs with Personnel 21 -2 025 545.53 -2 523 257.41 Other income and gains 22 607 949.05 483 994.28 Other espenses and losses 23 -441 444.15 -725 328.98 Earnings before depreciation, financing expenses and taxes 7e8 Depreciation and amortisation expenses/reversals Operating Profit (before financing expenses and taxes) 94 318 701.11 104 077 041.25 -33 766 872.33 -33 692 112.81 60 551 828.78 70 384 928.44 Received interests and similar income 24 1 118 949.50 1 188 297.20 Received interests and similar expenses 24 45 440 619.89 49 304 536.68 16 230 158.39 22 268 688.96 -6 192 137.97 -5 606 523.31 10 038 020.42 16 662 165.65 0.20 0.34 Earnings before taxes Income tax for the fiscal year 11 Net profit of the fiscal year Basic Earnings per Share 27 This annex is an integral part of the income statement by nature for the Fiscal Year ended on December 31, 2010. Income Statement Classified by Functions Of Fiscal Years Ended on December 31st, 2010 and 2009 Statements of Changes in Shareholders’ Equity Notes Amounts expressed in EUR Balance on January 1, 2009 Transition Adjustments Paid-in Capital 49 200 000.00 28 – Other instruments of shreholders’ Equity Mandatory Reserves Other Reserves – 2 850 001.05 -17 171 449.16 – Restated Opening Balance 49 200 000.00 Allocation of 2008 Net Profit: – – – Retained Earnings Total Shareholders’ Equity Period’s net profit 729.64 12 023 244.64 46 902 526.17 – 10 703 137.49 -10 801 554.93 – -98 417.44 – 2 850 001.05 -6 468 311.67 -10 800 825.29 12 023 244.64 46 804 108.73 601 162.23 11 422 082.41 – -12 023 244.64 – Fair Value Swap Variations – – -1 090 423.40 – – -1 090 423.40 Accessory Capital – 7 202 534.99 – – – – Period’s Net Profit – – – – 16 662 165.65 16 662 165.65 Balance on December 31, 2009 – 49 200 000.00 7 202 534.99 3 451 163.28 7 202 534.99 3 863 347.34 -10 800 825.29 16 662 165.65 69 578 385.97 Allocation of 2009 Net Profit: – – 400 292.24 Establishment of Shareholders’ Loans – -7 202 534.99 – _ – – -7 202 534.99 Fair Value Swap Variations – – – 3 180 591.76 – – – – – Period’s Net Profit Balance on December 31, 2010 49 200 000.00 – 3 851 455.52 – – 8 656 320.95 -16 662 165.65 -7 605 552.46 – 10 038 020.42 10 038 020.42 7 043 939.10 -2 144 504.34 10 038 020.42 67 988 910.70 This annex is an integral part of the income statement by nature for the Fiscal Year ended on December 31, 2010. The Certified Accountant 3 180 591.76 The Board of Directors 33 34 Annual Report and Accounts 2010 Cash Flow Statement Of Fiscal Years Ended on December 31st, 2010 and 2009 Amounts expressed in EUR Activities Notes 2010 2009 Receipts from clients 133 203 415.92 116 642 382.28 Payments to suppliers -15 586 355.66 -2 763 312.17 OPERATING ACTIVITIES: Payments to personnel Cash flows generated by operations Income tax payment Other payments related to the operating activity Operating activities cash flows (1) -1 373 482.90 -1 512 383.11 116 243 577.36 112 366 687.00 -4 266 577.78 -4 741 664.86 -23 535 441.50 -5 686 796.10 88 441 558.08 101 938 226.04 879 365.88 987 792.79 -389 013.91 -875 500.46 490 351.97 112 292.33 INVESTMENT ACTIVITIES: Receipts related to: Interest and similar income Payments regarding: Tangible fixed assets Investment activities cash flows (2) FINANCING ACTIVITIES: Payments regarding: Received Loans -41 313 597.25 -37 198 888.69 Interest and similar expenses -46 589 581.94 -54 481 345.72 Dividends Financing activities cash flows (3) -7 352 092.36 -9 244 691.67 -95 255 271.55 -100 924 926.08 -2 825 734.83 Variation in reserve accounts 1 957 319.78 Variation in cash and its equivalents (5) = (1) + (2) + (3) + (4) -4 366 041.72 -1 700 142.54 Cash and its equivalents at the beginning of the fiscal year 9 443 595.03 11 143 737.57 5 077 553.31 9 443 595.03 Cash and its equivalents at the end of the fiscal year 4 This annex is an integral part of the income statement by nature for the Fiscal Year ended on December 31, 2010. The Certified Accountant The Board of Directors ANNEX 36 Annual Report and Accounts 2010 Annex 1. Introductory Note Amounts expressed in EUR SCUTVIAS – Autoestradas da Beira Interior, S.A., with head office in Lisbon (Praça de Alvalade, n.º 6 – 13.º Esquerdo), was established on July 28, 1999, its main business purpose being the activity developed within the concession of the designing, planning, and construction or increase of the number of lanes, funding, maintenance, and operation, under a shadow toll arrangement (SCUT), of the motorways and related roadways in Beira Interior (Portugal), named as “SCUT da Beira Interior” concession. As result from the invitation to tender issued by the Portuguese Gouvernment and regulated by DecreeLaw nº 267/97, a Concession Agreement as signed by the Portuguese State and the Company in September 1999, establishing among other issues, a 30 year concession period, as well as other provisions regarding payments, guarantees, responsibilities, funding, and other issues regarding the Company’s business activity. The Ministry of Finance is responsible for supervising the Company’s compliance with its financial and economic obligations under the Concession Agreement, whereas the Ministry of Public Works, Transport and Housing is responsible for supervising all other obligations. The Concession has two completely different stages: (i) the Pre-Operating Period, which ran from the beginning of the Concession to the 31st of December, 2004, and (ii) the Operating Period, beginning on the 1st of January, 2005, and extending up to 2029. The Pre-Operating stage was characterised by strong investments (construction, planning, consulting, technical assistance, insurance, inspection of the works, among others), by tests made to the whole of the motorway’s structure and by administrative revenues (operating and investment grants). In January, 2005, SCUTVIAS entered the Concession’s Operating Period, in which revenues effectively correspond to the valuation of the motorways’ traffic circulation according to the tariffs established by the Concession Agreement. This date also corresponds to the effective start date of the Company’s business. In the fiscal year of 2010, the Portuguese State decided to have toll fees introduced in A23 by the 15th of April, 2011, through the Council of Minister’s Resolution n.º 75/2010. The above decision entails changes in the current concession agreement. Therefore, we are currently negotiation with the Portuguese State. 2. Accounting Benchmark for the Financial Statements The attached financial statements were drafted within the framework of legal provisions currently in force in Portugal, effective for the fiscal years beginning from the 1st of January, 2010, and established in Decree-Law n.º 158/2009, of July 13, 2010, as well as according to the conceptual structure, accounting rules and financial reporting (“NCRF”), and interpretation rules (“NI”) accordingly established in notices 15652/2009, 15655/2009 and 15653/2009, of September 7, 2009, which together form the Accounting Standardisation System (“SNC”). Hereinafter, the above set of rules and interpretations are the “NCRF”. Annual Report and Accounts 2010 37 Until December 31, 2009, and for the fulfilment of the trade legislation in force, the Company drafted, approved and published finacial statements, according to the accounting principles generally accepted in Portugal until said date, and established in the National Plan of Accounts, the Accounting Guideline, and remainder supplementary legislation known as “POC” (Official Accounting Plan), which were revoked by the above legal documents. The balance sheet of December 31, 2009, the income, cashflow, and shareholder equity statements, as well as the corresponding attached notes regarding the fiscal year ended on December 31, 2009, and shown for comparison purposes, were adjusted according to the NCRF. The adjustments entered into force on January 1, 2009, the same date of the transition, and were made according to the provisions of NCRF 3 – Adopting the accounting and financial reporting rules for the first time. The disclosure demanded by the NCRF 3, and regarding the transtiion to the NCRF, are presneted in Note 28. The effect of the adjustments related to the adoption of the NCRF, which took place on January 1, 2009, was registered under retained earnings, as established by the NCRF 3. 3. Main Accounting Policies Presentation backgrounds: The attached financial statements were drafted based on the assumption that the operations shall continue, from the Company’s accounting records, which are ket according to the NCRF in force on the date of the financial statements drafting. Except regarding the valuation of derivatives, the financial statements were drafted according to the historical cost convention. The main accounting policies adopted to draft the financial statements were the following: A) Intangible Assets Intangible asseste comprise: (i) expenses borne in implementing the Quality System, paid off on a straight-line basis, during a period of three years, (ii) costs incurred in with the concession agreement, paied to the Portuguese State, paid off on a straight-line basis, during the concession period, and (iii) the right associated to the concession agreement, the cost of which corresponds to the value paid to the Grantor, accrued with the expenses borne directly with the infrastructure’s construction, to be paid-off by the end of the concession period. The effect of any change to these estimates is prospectively recognised in the financial statements. B) Tangible Fixed Assets Acquired tangible fixed assets are recorded at cost. Depreciation is calculated on a straight-line monthly basis, according to the following estimated periods of service life: Years Basic equipment Transport equipment 5 to 8 4 Administrative equipment 3 to 10 Other tangible assets 4 to 10 38 Annual Report and Accounts 2010 C) Impairment of tangible and intagible assets In each reporting date, we make a review of the carrying amounts of the Company’s tangible fixed assets and intagible assets, aiming to determine if there is any indicator of their impairment. If there is such an indicator, we proceed to make an estimation of the respective assets’ recoverable amount, in order to determine the size of the impairment loss (if such is the case). When it is not possible to determine the recoverable amount of a single asset, an estimate is made of the recoverable amount of the cash-generating unit that asset belongs to. The asset’s or the cash-generating unit’s recoverable amount consists in the larger between (i) the fair value without the selling costs and (ii) the use value. In determining the use value, estimated future cash flows are deducted using a before taxes deduction rate which mirrors market expectations regarding money’s time value, and the specific risks of assets ou de cash-generating unit, regarding which future cash-flow estimations had not been adjusted. Everytime the carrying amount of the asset or the cash-generating unit is higher than its recoverable amount, we recognise a loss by impairment. The loss by impairment is immediately recorded in the statements under “Losses by impairment”. The reversal of losses by impairment, already recognised in previous fiscal years, is recorded when there is evidence that the recognised losses by impairment no longer exist, or have diminished. The reversal of loss by impairment is recognised in the statements under “Reversal of losses by impairment”. The reversal of an impairment loss is made up to the limit of the amount which would be recognised (free of depreciation) should there not have been a loss. D) Accrual basis of accounting The Company records its income and expenses according to the accrual basis of accounting, by which they are recognised when they occur, regardless of the moment in which they are received or paid. Differences between the amounts received and the amounts paid and the respective revenues and expenses, are recorded under the headings of other accounts receivable or accounts payable (Notes 10 and 18). E) Balance sheet classification According to the NCRF, the Company classifies as “non current” all assets marketable and and liabilities receivable after one year. F) Vehicle Rental Vehicle rental agreements are classified as operating leases, since they do not entail the substancial transference of all risks and advantages inherent in the respective assets to the lessee. Tangible fixed assets, and mainly vehicles, which are used under these agreements, as well as the ensuing liabilities, are not in the attached balance sheet. The respective rental fees are recorded as fiscal year expenses (Note 26). G) Income tax The income taxe corresponds to the sum of current taxes with deferred taxes. Current taxes and deferred taxes are recorded under profits and losses, except when they are related with items directly recorded under shareholder equity. In such cases, current taxes and deferred taxes are both recorded under shareholder equity. Annual Report and Accounts 2010 39 Current taxes correspond to the value due on the basis of the fiscal year’s taxable profit. The taxable profit differs from the accounting result, since it excludes several costs and earnings which will only be deductible or taxable in other fiscal years. The taxable profit also excludes costs and earnings which will never be deductible nor taxable, according to the fiscal rules in force. Deferred taxes represent the temporary differences between asset and liability values for accounting purposes, and the values thereof for taxation purposes. Deferred tax receivable and deferred tax payables are calculated and annualy valuated using taxation rates that are expected to be in force when the temporary differences are reversed. Deferred tax payables are recognised for all temporary taxable differences. Deferred tax receivables are recorded only when there is reason to believe that there will be sufficient future fiscal profits to use them. On the date of each balance sheet, there is a re-assessment of the temporary underlying differences in deferred tax receivables, to identify deferred tax receivables not previously recorded due to the non-fulfilment of the conditions for their recording and/or to reduce the amount of the deferred tax receivables recorded on the basis of a current expectation for future recovery. H) Financial assets and liabilities Financial assets and liabilities are recognised in the balance sheet when the Company becomes part of the corresponding contractual provisions. Financial assets and liabilities at cost or at amortised cost Financial assets and liabilities are valuated at cost or at amortised cost, after possible accumulated impairment losses, when: s4HEYAREINCASHORHAVEASETMATURITYDATEAND s4HEYARELINKEDTOASETORDEFINABLEPROFITAND s4HEYARENOTORDONOTINCORPORATEADERIVATIVEFINANCIALINSTRUMENT The amortised cost corresponds to the amount in which a financial asset or liability is valuated in the initial recognition, minus repayments of principal, plus or minus the cumulative depreciation, using the effective interest rate method, of any difference between that initial amount and the maturity amount. The effective interest rate is the rate discounting the exact future payables or receivables estimated in the financial asset or liability net carrying amount. Financial assets and liabilities at cost or at amortised cost include: s#LIENTS s/THERACCOUNTSRECEIVABLE s3UPPLIERS s/THERACCOUNTSPAYABLE s2ECEIVEDFUNDING Derivatives It is the Company’s policy to resort to derivative financial instruments to hedge financial exposures, particularly interest rates variations. Derivative financial instruments are valuated at fair value. The recognition method thereof depends on the nature and aim of the contract. 40 Annual Report and Accounts 2010 Hedge accounting The possibility to use a derivative financial instrument as a hedging instrument is governed to the provisions in NCRF 27, namely regarding its documentation and effectiveness. Fair value variations of derivative instruments known as “fair value” hedge are recognised as a financial profit (loss) of the period, as well as the changes in the fair value of the assets or liabilities exposed to such a risk. Fair value variations of derivative instruments known as “cash flow” hedge are recognised under “Other reserves” in their effective component, and under financial profit (loss) in their non-effective component. The values recorded under “Other Reserves” are transferred to financial profit (loss) of the period in which the hedged item also has an effect on profit (loss). The accounting of the hedging is dicontinued when the hedged instrument reaches maturity, when it is sold or exercised, or when the hedge ceases to fulfill the requirements demanded by the NCRF 27. Trading Changes in the fair value of derivative financial instruments which are contracted for financial hedging purposes in accordance with the Company’s risk management policies, but do not comply with the provisions of NCRF 27 in order to qualify for hedge accounting, are recorded in the income statement for the period in which they occur. Financial assets impairement Financial assets classified under “at cost or at amortised cost” are subject to impairment testes in each report date. Such financial assets are in impairment when there is objective evidence that their estimated cash flows are affected as a result of one or more events ocurred after their initial recognition. For financial assets valuated at amortised cost, the recognisable loss by impairment corresponds to the difference between the asset’s carrying amount and the current value of future new cash flows estimated to be discounted at the original effective rate interest. For assets valuated at cost, the impairment loss to be recognised corresponds to the difference between the asset’s carrying amount and the best estimate of the asset’s fair value. Impairment losses are recorded in profit (loss), under “Impairment losses”, in the period they are determined. Subsequently, if the impairment loss’ amount decreased and should such a decrease be objectively related to an event occurring after the recognition of the loss, the latter should be reversed in results. The reversal should be made up to the limit of the amount which would be recognised (amortised cost) if the Loss had not been initially registered. The reversal of loss by impairment is recorded in the statements under “Reversal of losses by impairment”. Annual Report and Accounts 2010 41 Derecognition of financial assets and liabilities The Company only derecognises financial assets when the contractual rigths to their cash flows expire, or when it transfers to another entity all significant risks and benefits related to their possession. Transfered financial assets of which the Company holds some significant risks and benefits are derecognised, provided control over them has been granted. The Company only derecognises liabilities when the respective obligation is settled, cancelled, or when it expires. Critical value judgements and main uncertainties sources regarding estimates The drafting of the attached financial statements entailed value judgements and estimates, and several presupositions affecting the reported amounts of assets and liabilities, as well as the amounts of the period’s income and expenses. The underlying estimates and presupositions were determined on the basis of the best knowledge existing on the date of approval of the financial statements of ongoing events and transactions, as well as on the experience of past and/or current events. However, some situations may occur in subsequent periods which are not considered in these estimates because they were not forseable on the date of approval. Any estimate changes subsequent to the financial statements date shall be prospectively corrected For this reason, and given the associated uncertainty level, the effective results of the transactions at issue may differ from the their respective estimates. J) Events subsequent to the Balance Sheet date The events subsequent to the balance sheet date providing additional information on conditions existing on the date of the balance sheet (“adjustable events”) are mirrored on the financial statements. The events subsequent to the date of the balance sheet providing information on conditions ocurring after the date of the balance sheet (“non adjustable events”) are revealed in the financial statements if they are deemed relevant. 4. Cash and Cash Equivalents On December 31, 2010 and 2009, this item regards cash, and ordinary deposits and short-term deposits in a financial institution, bearing interest at the normal market rates for similar operations. Its composition was as follows: Components Cash Ordinary Deposits 2010 2009 2 007.72 2 006.98 4 981 359.19 1 441 588.05 Short-term Deposits Reserve Accounts: Debt Service Reserve – Commercial Banking 42 439 121.23 43 724 572.98 Debt Service Reserve – EIB 27 476 013.60 28 147 881.63 69 915 134.83 71 872 454.61 Checking Accounts Cash Availabilities in the Balance Sheet 94 186.40 8 000 000.00 74 992 688.14 81 316 049.64 42 Annual Report and Accounts 2010 Reserve accounts in the form of ordinary deposits or shor-term deposits ensue from financing contract terms and from the concession agreement, which require the maintenance of deposits equivalent to 5/3 of the next dept service. Due to the terms of the Company Agreement and the Concession Agreement, which include limitations on funding and investing, and taking into consideration that the Debt Service Reserve Accounts may be moved to those purposes, Scutvias considers all of its balances to be cash and cash equivalents 5. Accounting Policies, Changes in Estimates and Errors In the fiscal year ended on December 31, 2010, there were no changes in the accounting policies in relation to those used to draft the financial information regarding the fiscal year of 2009, attached for comparison pusposes, nor were there any significat errors regarding previous fiscal years recorded. 6. Group Companies and Related Parties On December 31, 2010 and 2009, the Company’s share capital was fully subscribed and paid up, and consisted of 49.200.000 shares with the nominal value of one Euro per share. It was held by the following entities: Shareholders Amount % Holding )NTEVIASn3ERVI½OSE'ESTáO3! 16 399 999.00 33.33 ES Concessões 10 937 708.00 22.23 Global Via Infraestruturas. S.A. 10 931 146.00 22.22 Alves Ribeiro. S.A. 10 931 146.00 22.22 Soares da Costa Concessões, S.G.P.S. Total 1.00 49 200 000.00 100.00 Remuneration of key management personnel Remunerations of the Company’s key management personnel in the fiscal years ended on December 31, 2010 and 2009 were as follows: Board of Directors 2010 2009 144 270 144 270 Annual Report and Accounts 2010 43 Transactions with shareholders and related parties Throughout the fiscal years of 2010 and 2009, the following transactions with shareholders took place: December 31, 2010 BALANCES Shareholders and Related Parties TRANSACTIONS Received Financing Non Current (Note 17) Received Financing Current (Note 17) Current accounts payable Current accounts receivable Interest Borne (Note 24) Supplies and Services )NTEVIASn3ERVI½OSE'ESTáO3! – – 254 321.18 7 893 450.27 628 062.67 – ES Concessões – 38 792.60 169 615.30 5 264 405.98 418 876.00 32 060.00 – 32 060.00 172 558.69 5 261 247.64 418 624.70 32 060.00 1 362.20 61 480.10 169 513.53 5 261 247.64 418 624.70 107 060.00 0.04 48 090.00 Global Via Infraestructuras, S.A. Alves Ribeiro, S.A. Soares da Costa Concessões, S.G.P.S. – 58 188.90 0.02 0.48 -2.n-ANUTEN½áODE2ODOVIAS.ACIONAIS3! (a) – 2 475 817.45 – – – 14 597 980.79 1 362.20 2 666 339.05 766 008.72 23 680 352.01 1 884 188.11 14 817 250.79 Total $URINGTHEFISCALYEAROF3CUTVIASENTEREDINTOASERVICESUPPLYCONTRACTWITH-2.n-ANUTEN½áODE2ODOVIAS.ACIONAIS S.A., for the conservation and maintenance of A23. The contract ends in December, 2013 (Note 20). a) December 31, 2010 BALANCES Shareholders and Related Parties Current accounts payable Current accounts receivable TRANSICTIONS Received Financing Current (Note 17) Received Financing Non Current (Note 17) Interest Borne (Note 24) Supplies and Services )NTEVIASn3ERVI½OSE'ESTáO3! – – 372 051.83 5 492 605.42 997 721.30 – Sopol Concessões S.G.P.S. – 16 488.00 291 922.13 3 663 202.23 665 413.71 91 560.00 Global Via Infraestructuras, S.A. – 50 380.00 247 984.94 3 661 004.52 665 014.49 32 060.00 Alves Ribeiro, S.A. 1 362.20 79 321.69 265 818.63 3 661 004.52 665 014.49 182 060.00 Soares da Costa Concessões, S.G.P.S. 7 442.81 20 610.00 0.03 0.33 0.06 48 090.00 Total 8 805.01 166 799.69 1 177 777.56 16 477 817.02 2 993 164.05 353 770.00 On December 31, 2010 and 2009, the liabilities item non current “Received Funding” includs shareholder loans, in the proportion of their participations in Company capital. Although the loans have no defined repayment date, the Board of Directors considers that they are not repayable in the short term. They are therefore recorded under non current liabilities. The item “Received Funding” of current assets records the interests on the loans, which are calculated at na annual rate of 11%. 44 Annual Report and Accounts 2010 7. Changes in Tangible Assets During the fiscal years ended on December 31, 2010 and 2009, the changes in tangible fixed assets and respective accumulated depreciation was as follows: December 31, 2010 Tangible Assets Buildings and Other Constructions Basic Equipment Transport Equipment Current Administrative Other tangible tangible fixed Equipment fixed assets assets Total Gross Assets Opening balance – 186 334.79 131 391.82 Acquisitions – 23 900.00 69 394.40 Disposals – – Transfers – – – 210 234.79 195 615.67 Opening balance – 121 151.36 55 457.19 452 329.89 Depreciation of the fiscal year – 12 858.52 25 070.15 Disposals – – -4 928.08 – 134 009.88 – 76 224.91 Closing balance 617 059.57 1 125 376.58 14 839.20 2 075 001.96 2 582.66 274 294.53 – – -5 170.55 – -14 839.20 – 772 110.38 1 163 582.44 2 582.66 2 344 125.94 817 920.30 – 1 446 858.74 92 198.48 109 724.92 – 239 852.07 – – – -4 928.08 75 599.26 544 528.37 927 645.22 – 1 681 782.73 120 016.41 227 582.01 235 937.22 2 582.66 662 343.21 140 211.61 38 205.86 -5 170.55 – – 14 839.20 Accumulated depreciation Closing balance Net assets December 31. 2009 Tangible Assets Buildings and Other Constructions Basic Equipment Current Administrative Other tangible tangible fixed Equipment fixed assets assets Transport Equipment Total Gross Assets Opening Balance 884 803 720.51 181 366.36 52 600.12 566 013.54 955 915.38 Restatement adjustments (Note 28) -884 803 720.51 – – – – Restated opening balance – 181 366.36 52 600.12 566 013.54 955 915.38 23 388.75 1 779 284.15 Acquisitions – 14 219.50 81 833.10 101 709.58 219 586.51 14 839.20 432 187.89 Disposals – – -3 041.40 – – – -3 041.40 Transfers – – – – 23 388.75 -23 388.75 – Write-offs – -9 251.07 – -50 663.55 -73 514.06 – -133 428.68 – 186 334.79 131 391.82 617 059.57 1 125 376.58 14 839.20 2 075 001.96 Opening balance 182 194 822.96 119 759.93 48 255.54 452 959.28 797 110.89 – 183 612 908.60 Restatement adjustments (Note 28) -182 194 822.96 – – – – – – Restated opening balance – 119 759.93 48 255.54 452 959.28 797 110.89 – 1 418 085.64 Depreciationj of the fiscal year – 10 642.50 9 818.64 49 551.48 94 113.02 – 164 125.64 Disposals – – -2 616.99 – – – -2 616.99 Write-offs – -9 251.07 – -50 180.87 -73 303.61 – -132 735.55 – 121 151.36 55 457.19 452 329.89 817 920.30 – 1 446 858.74 – 65 183.43 75 934.63 164 729.68 307 456.28 14 839.20 628 143.22 Closing balance 23 388.75 886 583 004.66 – -884 803 720.51 Accumulated depreciation Closing balance Net assets Annual Report and Accounts 2010 45 8. Changes in Intangible Assets During the fiscal years ended on December 31, 2010 and 2009, the changes in intangible assets and respective accumulated depreciation was as follows: December 31, 2010 Concession Agreement Intangible Assets Other intangible assets Total Gross Assets Opening balance 694 587 604.43 1 470 009.06 696 057 613.49 – – – 694 587 604.43 1 470 009.06 696 057 613.49 33 479 122.58 515 009.67 33 994 132.25 33 479 123.73 47 896.53 33 527 020.26 66 958 246.31 562 906.20 67 521 152.51 627 629 358.12 907 102.86 628 536 460.98 Acquisitions Closing balance Accumulated amortisation Openingt balance Amortisation of the fiscal year Closing balance Net assets December 31, 2009 Concession Agreement Intangible Assets Other intangible assets Total Gross Assets Opening Balance – 1 479 309.06 1 479 309.06 Restatement adjustments (Note 28) 694 587 604.43 -9 300.00 694 578 304.43 Restated opening balance 694 587 604.43 1 470 009.06 696 057 613.49 Acquisitions Closing balance – – – 694 587 604.43 1 470 009.06 696 057 613.49 – 466 145.03 466 145.03 33 479 122.58 48 864.64 33 527 987.22 Accumulated amortisation Opening balance Amortisation of the fiscal year Closing balance Net assets 33 479 122.58 515 009.67 33 994 132.25 661 108 481.85 954 999.39 662 063 481.25 On December 31, 2010, the total financial costs capitalised under Intagible Assets amounted to EUR 241.883.040 Euros during the construction period. 46 Annual Report and Accounts 2010 9. Clients On December 31, 2010 and 2009, the “Clients” had the following composition: Clients 31/12/2010 Clients current account 31/12/2009 86 076.97 167 617.39 39 135 353.14 35 647 082.15 39 221 430.11 35 814 699.54 Clients by income increase Band revenues (a) Total (a) Clients by increase in revenue - “band receipts”. This item corresponds to traffic revenue values of the fiscal year ended on December 31, 2010, and which were invoiced and received during the fiscal year ending on December 31, 2011. 10. Other Accounts Receivable On December 31, 2010 and 2009, “Other Accounts Receivable” recorded the following composition: Other Accounts Receivable 31/12/2010 31/12/2009 Current: Debtors by income increase Interests receivable 407 119.97 Service areas Other debtors Total 195 022.13 72 517.09 71 862.19 3 229 364.88 3 203 605.43 3 709 001.94 3 470 489.75 11. Income Tax According to the legislation in force, income tax returns are subject to review and correction by the fiscal authorities during a four year period (five years for Social Security), except in the case of tax losses or when tax benefits have been granted, or when there are pending inspections, complaints or claims, in which case the deadlines are extended or suspended, depending on the circumstances. Therefore, the Company’s tax returns regarding the years 2007 through 2010 may still be reviewed. The Company’s Administration considers that any possible corrections to the above tax returns, resulting from the reviews/inspections by the fiscal authorities, will bear no significant effect on the financial statements of December 31, 2010. The Company is subject to the IRC – Corporate Income Tax at 25% rate, which is usually increased by a Municipal Surcharge up to 1.5%. However, in accordance with circular letter n.º 0201302008 of March 27, Scutvias is free of Municipal Surcharge, since about 90% of its employees work in the Castelo Branco district, which is exempt from such a surcharge. Furthermore, from January 1, 2010 taxable profits exceeding EUR 2 million are subject to a state surcharge of 2.5% rate, under Article 87 A of the CIRC (Corporate Income Tax Code). Annual Report and Accounts 2010 47 In the terms of Article 88 of the CIRC, the Company is also subject to autonomous taxation on a range of charges, at the rates established in said Article. In the table bellow, the autonomous taxation corresponds to Tax Adjustments. The tax rate reconciliation for the fiscal year ended on December 31, 2010 and 2009 may be shown as follows: Expenses with Income Taxes Earnings before taxes 31/12/2010 31/12/2009 16 230 158.39 22 268 688.96 Nominal income taxes uo to 12.500€ 12.5% 12.5% Nominal income taxes over 12.500€ 25.0% 25.0% 4 055 977.00 5 567 172.24 Tax exemptions or reductions -5 197.99 -6 507.00 Other net situations 19 015.21 97 104.98 13 817.00 90 598.00 Expected tax Permanent differences 25.0% 25.0% 3 454.25 22 650.00 Depreciation not accepted for tax purposes 2 834 314.21 2 834 314.21 Variations change of legal measures 2 910 469.26 – 5 744 783.00 2 834 314.00 Nominal income taxes Temporary differences: Nominal income taxes Adjustments to collection – autonomous taxation 25.0% 25.0% 1 436 196.00 708 578.50 11 976.42 14 758.70 499 718.98 — Temporary differences -1 579 815.46 -708 578.50 Adjustment of tax rate 1 763 030.78 – 1 600.00 1 942.87 6 192 137.97 5 606 523.31 Adjustments to collection – state surcharge 2010 (art. 87.º A CIRC) Variations in deferred taxes Other net situations Income tax for the fiscal year Effective tax rate Current tax Deferred tax occurring in the fiscal year 38.15% 25.18% 4 429 107.19 3 976 763.57 1 763 030.78 1 629 759.74 6 192 137.97 5 606 523.31 48 Annual Report and Accounts 2010 Deferred Taxes The changes in deferred tax assets in the fiscal years ended on December 31, 2010 and 2009 were the following: 31/12/2010 Deferred Taxes Balance 01/01/2009 Deferred tax receivables 31/12/2009 Deferred tax payables Deferred tax receivables Deferred tax payables – – – – Derecognition of pre-operating earnings – – – 4 228 618.18 Derecognition of pre-operating costs – – – -2 034 147.88 Cancellation of already capitalised major repairs – – – -1 276 012.97 Cancellation of the Amortisation of Major Repairs – – – 383 615.99 Derecognition intangible assets – – – -2 325.00 Depreciation not accepted for tax purposes – – – 14 700 799.83 Transition adjustments (Note 28): Effect on profit and losses: Effect on reserves: Differences following fair value valuations: Interest Rate Swap – – 10 703 137.49 – 11 066 611.96 17 630 307.89 10 703 137.49 16 000 548.15 Derecognition of pre-operating costs – – – -272 872.80 Recalculation of amortisation initial investment – – – 2 887 086.71 Derecognition of earnings re-balance – – – -87 125.40 Cancellation of already capitalised major repairs – – – -286 781.44 Derecognition of pre-operating earnings – – – 98 031.23 Depreciation not accepted for tax purposes – – – -708 578.56 Effect tax rate change: – – – – SNC Variations – 363 808.66 – – Depreciation not accepted for tax purposes – 1 399 222.12 – – Recognition 1/5 tax variations SNC – -800 379.05 – – Depreciation not accepted for fiscal effects – -779 436.41 – – – – 363 474.47 – – 183 215.32 363 474.47 1 629 759.74 319 997.87 – – – 319 997.87 – – – 11 386 609.83 17 813 523.21 11 066 611.96 17 630 307.89 Restated Opening Balance Effect on profit and losses: State amd other current public agencies: Effect on reserves: Differences following fair value valuations: Interest Rate Swap Effect on reserves: Differences following fair value valuations: Interest Rate Swap Closing Balance Annual Report and Accounts 2010 49 12. State and other Public Agencies On December 31, 2010 and 2009, the items “State and Other Public Agencies” had the following composition: State and other Public Agencies Assets 31/12/2010 Liabilities Assets 31/12/2009 Liabilities Corporate income tax Tax estimate (Note 11) – 4 429 107.19 – Recognition Deferred Taxes – 1 579 815.46 – – Payments on account – -3 619 512.99 – -3 127 080.60 Tax Withholding at Source – -199 639.56 – -244 346.92 171 696.31 Tax withholding at source on third parties’ income Valued added tax Social Security contributions Balance 3 976 763.57 – 167 620.84 – 103 303.71 – 101 504.62 – – 30 976.23 – 43 551.20 103 303.71 2 388 367.17 101 504.62 820 583.56 13. Deferrals On December 31, 2010 and 2009, “Deferrals” had the following composition: Deferrals 31/12/2010 31/12/2009 Assets Fee letters 291 767.52 279 200.87 Insurance 54 261.95 8 402.78 Others 1 536.90 9 865.76 347 566.37 297 469.41 Arbitration proceedings (a) 2 860 052.98 2 860 052.98 Service areas (b) 2 746 320.24 2 892 181.80 5 606 373.22 5 752 234.78 Total Liabilities Total (a) – Arbitration Proceedings Following the execution of contracts established between Scutvias and Galp, Scutvias charged the latter with a series of penalties and interests on arrears. The fairness of the above measure will be judged by the Court. The overall amount of said penalties and interets on arrears is EUR 2.860.052,98 (Note 29). (b) – Service Areas The amounts received under the concession agreements for the service areas of Abrantes, Castelo "RANCOAND&UNDáO#EPSAARERECORDEDASINCOMERECOGNISEDASRESULTSINALINEARFASHIONDURING the concession period. 14. Capital and Reserves Other instruments of shareholders’ equity: Following the deliberation of the Shareholders’ Meeting, there was a transfer of EUR 7.202.535 from Accessory Capital to Loans, in proportion with the Share Capital. 50 Annual Report and Accounts 2010 Allocation of 2009 net profit: Following the deliberation of the Shareholders’ Meeting of March 31, 2010, the net profit of the fiscal year ended on December 31, 2009, was allocated as follows: Mandatory Reserve ............................................. EUR 400,292.24 Dividends ........................................................... EUR 7,605,552.56 Mandatory Reserve – Trade legislation establishes that at least 5% of the annual net profit be allocated to the mandatory reserve, until the latter reaches at least 20% of the share capital. This reserve may not be distributed unless the company is liquidated. However, it may be used to cover losses after all other reserves have been used up, or it may be incorporated into the share capital. Other Reserves – This item indicates: (i) the effect of the variations seen in the market value of the derivative contracted to cover cash flows arising from the received funding, and deducted from tax effects (deferred) (Note 18 a), (ii) free reserves, available for distribution, according to the deliberation of the Shareholders’ Meeting of March 31, 2009. 15. Average Personnel Number During the fiscal years ended on December 31, 2010 and 2009, the average number of employees was 57 and 89, accordingly. 16. Garantees Provided On December 31, 2010, the Company had outstanding bank guarantees totalling EUR 6.467.369,41 in favour of the Portuguese State, as provided for in the concession agreement. On the same date, the Company had provided bank guarantees in the amount of EUR 249.662.128,34 to the European Bank of Investment, as provided for in the financing contract. The bank entities involved in providing said bank guarantees are the same as those involved in the syndicated bank loan. Since there has been a change in the electric power supplier, the guarantees the Company had provided to EDP were canceled. Annual Report and Accounts 2010 51 17. Received Funding On December 31, 2010 and 2009, “Received Funding” recorded the following composition: Received Financing 31/12/2010 31/12/2009 Non Current: Bank Financing European Investment Bank 305 229 000.00 317 767 749.96 Banking Syndicate 238 989 163.42 268 418 125.95 Other Financing Shareholders’ Loans (Note 6) 23 680 352.01 16 477 817.02 Total non current financing 567 898 515.43 602 663 692.93 European Investment Bank 12 538 750.00 12 538 750.00 Banking Syndicate 28 811 921.14 28 157 805.90 Current: Bank Financing Financing Expenses Shareholders’ Loan Interests (Note 6) Loan Interests Total current financing Total 766 008.72 1 177 777.56 10 136 848.63 10 739 286.42 52 253 528.49 52 613 619.88 620 152 043.92 655 277 312.81 Bank Institutions: On December 31, the item for medium and long term loans included the funding received from the European Bank of Investment and the bank syndicate, for the construction of the concession’s motorway. Thus: Line Interest Rate 1.st Rep of Principal Last Rep of Principal Banking Syndicate Euribor 6 months indexed Variable Interest Rate First Quarter of 2006 First Quarter of 2019 European Investment Bank 6.43% fixed Variable Interest Rate Second Quarter of 2007 First Quarter of 2024 The Company provided bank guarantees to the EIB (European Investment Bank) in the amount of EUR 249,662,128.34, equal to 78.56% of the outstanding loan (Nota 16). This guarantee will be gradually reduced in proportion to the reduction of the cover and the repayment of the outstanding principal. The Company provides no bank guarantees to the banking syndicate to cover the loan facility. 52 Annual Report and Accounts 2010 The principal of this loan will be repaid by 2024, as per the table below (nominal values): Loan Facility (*) Fiscal Year (*) EIB 2011 28 811 921.14 12 538 750.00 2012 29 512 979.53 12 538 750.00 2013 29 779 787.93 17 375 125.00 2014 30 368 816.09 20 957 626.00 2015 31 171 576.99 20 957 626.00 2016 32 165 684.52 21 047 188.00 2017 33 361 205.44 21 136 750.00 2018 34 719 594.83 22 480 188.00 2019 17 909 518.15 24 361 000.00 2020 – 27 943 500.00 2021 – 29 555 625.00 2022 – 32 600 750.00 2023 – 36 004 125.00 2024 – 18 270 747.00 Total 267 801 084.62 317 767 750.00 Based on the Repayment Plan by Facility Agent (Millenium BCP) Under the financing agreements, the Company is also subject to compliance with Financial Covenant Ratios. The latter may not fall bellow minimum values, under penalty of the Company becoming liable for contractual non-fulfilling. Ratio Description Minimum Annual Debt Service Cover Ratio excluding Cash (Cash Flow available for Debt Service) / Debt Service 1.05 x Loan Life Cover Ratio - of the Current Value of [(Cash Flow available for Debt Service + Balance of Reserve Accounts except Liquidity Reserve and Debt Service Reserve) / Debt Service] 1.15 x On December 31, 2010, the Company is in compliance with the requirements. Shareholders’ Loans: On December 31, 2010, the item for medium and long term loans included the funding received by the shareholders in the amount of EUR 23,680,352.00, in proportion with the Share Capital (Note 6). Annual Report and Accounts 2010 53 18. Other Accounts Payable On December 31, 2010 and 2009, “Other Accounts Payable” recorded the following composition: Other Accounts Payable: 31/12/2010 31/12/2009 Non current: Hedging derivatives (a) Balance 41 405 853.94 44 266 447.83 41 405 853.94 44 266 447.83 2 578 236.84 152 270.15 244 126.49 316 218.73 54 219.72 55 134.49 Current: Creditors for increase in expenses: Supplies and services received Costs with Personnel Taxes Investment suppliers Creditors Balance 66 366.40 91 386.89 406 908.18 504 293.39 3 349 857.63 1 119 303.65 (a) - Swap This item regards the market value, on December 31, 2010, of the interest rate swap acquired by the Company, under which the variable interest rates of funding arrangements is exchanged for a fixed interest rate, thus covering the cash flows related to said financing arrangements. Since that after October 1, 2008, the formal requirements provided in IAS 39 concerning the relationship and cover effectiveness documentation were met, this arrangement became then known as Cover of Cash Flow. Consequently, after October 1, 2008, the variations in this instrument’s market value were recognised in “Other Reserves” since the hedging is deemed fully effective. 19. Provision of Services per Activity The “provisions of services” during the fiscal year ended on December 31, 2010 and 2009, were as follows: Services Rendered 31/12/2010 Traffic 113 223 041.54 Service areas Total 31/12/2009 111 131 532.59 1 045 254.70 1 022 560.68 114 268 296.24 112 154 093.27 54 Annual Report and Accounts 2010 20. Supplies and Services Received In the fiscal year ended on December 31, 2010, “Supplies and services received” were as follows: Supplies and Services Received Maintenance and repairs (a) 31/12/2010 31/12/2009 15 667 904.48 2 473 665.35 Specialised Works 902 814.32 1 169 004.13 Insurance 461 522.12 570 539.24 Electricity 259 899.72 318 724.46 Fuel 183 810.22 172 353.23 Rents and leases 161 535.56 200 795.09 Legal department and notary public 104 946.76 4 663.63 Communication 94 639.43 103 035.21 Fees 89 295.94 99 847.99 Materials 55 291.65 86 408.85 Advertising and publicity 49 712.10 38 315.28 Travels and stays 32 387.50 44 066.01 Cleaning, hygiene and comfort 15 520.91 17 741.55 Water 3 736.15 2 842.42 Other RSS 7 537.64 10 457.47 18 090 554.50 5 312 459.91 Total (a) – Maintenance and Repairs This item regards the value of the contract signed during the year 2010 for the maintenance and repairing of A23 (Note 6). 21. Costs with Personnel During the fiscal year ended on December 31, 2010 and 2009, “costs with personnel” were as follows: Costs with Personnel Personnel remuneration (Note 15) Charges on remunerations 31/12/2010 31/12/2009 1 606 213.85 2 043 753.05 322 862.21 422 516.26 Indemnities 62 902.72 5 000.00 Insurance 25 066.85 34 743.43 Training Total 8 499.90 17 244.67 2 025 545.53 2 523 257.41 Annual Report and Accounts 2010 55 22. Other Income and Profits During the fiscal year ended on December 31, 2010 and 2009, “other income and profits” were as follows: Other Operating Income and Gains Accident compensations 31/12/2010 31/12/2009 494 358.71 381 159.13 Corrections regarding previous periods 62 555.11 78 723.07 Other supplementary income 34 758.62 1 243.45 Assistance in A23 3 895.61 4 329.24 Tangible assets expenses 3 090.85 1 208.92 Received cash discounts 2 937.40 7 329.03 21.15 1 887.47 Foreign exchange gains Others Total 6 331.60 8 113.97 607 949.05 483 994.28 23. Other Expenses and Losses During the fiscal year ended on December 31, 2010 and 2009, “other expenses and losses” were as follows: Other Operating Expenses and Losses Taxes 31/12/2010 31/12/2009 305 679.33 519 971.17 Bank fees and expenses 66 668.87 69 185.27 Donations 20 626.96 21 340.00 Contributions 9 455.00 1 510.00 Foreign exchange losses 1 457.41 616.92 Penalties and fines Correction of previous fiscal years Other operating expenses Total 322.71 541.43 0.05 76 306.75 37 233.82 35 857.44 441 444.15 725 328.98 24. Interests and other Income and Similar Expenses During the fiscal year ended on December 31, 2010 and 2009, interests and similar expenses were as follows: Financing expenses 31/12/2010 31/12/2009 Interests borne Bank financing Shareholders’ Loan interests (Note 6) Other financing expenses Total 41 232 190.96 43 902 516.15 1 884 188.09 2 993 164.05 43 116 379.05 46 895 680.20 2 324 240.84 2 408 856.48 45 440 619.89 49 304 536.68 56 Annual Report and Accounts 2010 During the fiscal year ended on December 31, 2010 and 2009, interests and similar income were as follows: Interest Income 31/12/2010 31/12/2009 Received interests Financial institutions deposits 1 118 949.50 1 188 297.20 Total 1 118 949.50 1 188 297.20 25. Disclosure Required by Law Fees received by the Statutory Auditor The total fees of the fiscal years ended on December 31 2010 and 2009 regarding the services provided by the Statutory Auditor amounted to EUR 19.000,00 regarding both fiscal years. 26. Financial Commitments Entered into and not Included on the Balance Sheet Concession Agreement The Concession Agreement, signed in September, 1999, with the Portuguese State, establishes a set of obligations, namely regarding payments, guarantees, liabilities, funding, and other operating, financial, and legal issues, which the Board of Directors believes are being fulfilled. Operating Leases On December 31, 2010, the Company kept leases for operating vehicles, the value of which amounted to EUR 137.823,02 in the fiscal year ended on that date, and was recorded under “Supplies and services received”. Also on that date, the Company’s liabilities regarding future rental fees are scheduled as follows: Operating Leases Up to 1 year 78 674.37 Between 1 year and 5 years 38 823.62 117 497.99 27. Earnings per Share Earnings per share for the fiscal years ended December on 31, 2010 and 2009 were as follows: Earnings per share Net profit of the fiscal year Shares outstanding Basic Earnings per Share 31/12/2010 31/12/2009 10 038 020.42 16 662 165.65 49 200 000 49 200 000 0.20 0.34 Annual Report and Accounts 2010 57 28. First Time Adoption of Accounting and Financial Reporting Rules As mentioned in Note 2, the Company adopted the NCRF, as of January 1, 2010. The financial information regarding 2009, attached for comparison purposes, was restated to comply with NCRF requirements. The transition adjustments, which also took effect on January 1, 2009, were made according to the NCRF 3 – First time adoption of accounting and financial reporting rules, and were recorded as retained earnings, as established by said rule. SNC establishes that when the NCRF do not answer user needs as regards the handling of certain situations in an accounting perspective, they should firstly resort to the IFRS as adopted by the European Union, and secondly to the IFRS not yet adopted by the European Union. In this context, the interpretation made by the International Accounting Standards Board (“IASB”) ragarding this theme and established in IFRIC 12 – Service Concession Agreements (“IFRIC12”), is applicable to public service concessions in general, and to Scutvias’ case in particular. This interpretation was issued by the IASB in November, 2006, to apply to fiscal years beginning on or after January 1, 2008. Its adoption by the European Union only occurred in March, 2009, and its mandatory application was established for fiscal years beginning on or after January 1, 2010. Therefore, the main accounting policies stemming from the adoption of the NCRF and IFRIC 12 are the following: – Up until the adoption of the NCRF, the capitalisation of costs and earnings incurred into in the pre-operating stage of concessionaire companies was generally accepted in Portugal. According to the NCRF, specifically NCRF 6 – Intangible Assets (“NCRF 6”), the capitalisation of startup or pre-operating costs is not allowed. – On the terms of the IFRIC 12, the infrastructure is not to be recognised as a tangible fixed asset belonging to the operator. The latter only has the right to use the infrastructure to provide a (public) service, on the grantor’s account. Therefore, Scutvias proceeded to record an intangible asset related to the right of operating the infrastructure in return for the payments and other considerations for that purpose. The resulting intagible asset will be reduced by depreciation throughout the concession period. – Insofar some of the items belonging to the intagible asset were being repaid in a shorter term than the concession term, its service life will be changed by the end of the concession period (September, 2029). – According to the IFRIC 12, any interventions in the infrastructure which do not correspond to a initial investment in construction, expansion, or capacity increase, shall not be capitalised when they are made, insofar as they result from a contractual obligation. The entailed cost will thus become an operating cost. – Most financial assets and liabilities, which include accounts receivable and accounts payable, are valuated according to the amortised cost. The application of this criteria is shown in its valuation, at each moment, by the corresponding discounted value (when it is feasible and demandable on the medium and long term), which is updated according to an effective interest rate. – Extraordinary profit (loss) – the NCRF do not provide for extraordinary costs and earnings. 58 Annual Report and Accounts 2010 Consequently, the values previously shown in the “extraordinary” items of the financial and cash flow statements were re-classified according to their corresponding nature. – According to the NCRF 25, there are new deferred taxes on the SWAP’s fair value recorded under the company’s financial liabilities ando on the depreciation generated by intangible assets, the deductibility of which is not acceted for fiscal effects. On January 1, 2009, the effects on the Balance Sheet of the conversion of the financial statements drafted according to the “POC” for restated financial statements, in conformity with the SNC in force on January 1, 2010, were detailed as follows: January 1, 2009 NCRF conversion adjustments NCRF conversion reclassification -3 569 587.98 -699 039 171.94 361 336.14 1 013 164.03 -9 300.00 694 587 604.43 695 591 468.46 – 10 703 137.49 – 10 703 137.49 703 983 260.09 7 124 249.51 -4 451 567.51 706 655 942.09 Clients 471 116.68 – 40 028 316.65 40 499 433.33 State and other public agencies 111 062.09 – – 111 062.09 40 874 609.31 – -40 028 316.65 846 292.66 Balance Sheet POC NCRF Non current assets Tangible fixed assets Intangible assets Deferred tax receivables 702 970 096.06 Current Assets Other accounts receivable Deferrals Cash and bank deposits Total assets 8 439 022.93 -8 136 591.51 – 302 431.42 80 190 457.35 – – 80 190 457.35 130 086 268.36 -8 136 591.51 – 121 949 676.85 834 069 528.45 -1 012 342.00 -4 451 567.51 828 605 618.94 49 200 000.00 – – 49 200 000.00 2 850 001.05 – – 2 850 001.05 -17 171 449.16 10 703 137.49 – -6 468 311.67 Shareholders’ Equity Paid-in Capital Mandatory Reserves Other reserves Retained earnings 729.64 -10 801 554.93 – -10 800 825.29 Period’s net profit 12 023 244.64 – – 12 023 244.64 Total Shareholders’ Equity 46 902 526.17 -98 417.44 – 46 804 108.73 629 295 749.09 – 23 680 352.01 652 976 101.10 – 16 000 548.15 – 16 000 548.15 29 846 388.97 – 12 966 160.99 42 812 549.96 659 142 138.06 16 000 548.15 36 646 513.00 711 789 199.21 615 055.42 – – 615 055.42 2 408 814.38 LIABILITIES Non current liabilities Other received funding Deferred tax payables Other accounts payable Current Liabilities Suppliers State and other public agencies 2 408 814.38 – – Shareholders/partners 10 271 792.08 – -10 271 792.08 – Received funding 34 785 571.43 – 16 437 829.04 51 223 400.47 Other accounts payable 55 539 547.33 _ -42 812 549.96 12 726 997.37 Deferrals 24 404 083.58 -16 914 472.71 -4 451 567.51 3 038 043.36 128 024 864.22 -16 914 472.71 -41 098 080.51 70 012 311.00 Total Liabilities 787 167 002.28 -913 924.56 -4 451 567.51 781 801 510.21 Total Shareholders’ Equity and Liabilities 834 069 528.45 -1 012 342.00 -4 451 567.51 828 605 618.94 Annual Report and Accounts 2010 59 On December 31, 2009, the effects on the Balance Sheet of the conversion of the financial statements drafted according to the POC for restated financial statements, in conformity with the SNC in force on January 1, 2010, were detailed as follows: December 31. 2009 Balance Sheet NCRF conversion adjustments NCRF conversion reclassification 658 423 831.99 7 755 060.60 -665 550 749.37 628 143.22 964 299.39 – 661 099 181.86 662 063 481.25 POC NCRF Non current assets Tangible fixed assets Intangible assets – 11 066 611.96 – 11 066 611.96 659 388 131.38 18 821 672.56 -4 451 567.51 673 758 236.43 Clients 167 617.39 – 35 647 082.15 35 814 699.54 State and other public agencies 101 504.62 – – 101 504.62 39 117 571.90 – -35 647 082.15 3 470 489.75 8 041 936.01 -7 744 466.60 – 297 469.41 Deferred tax receivables Current Assets Other accounts receivable Deferrals Cash and bank deposits Total Assets 81 316 049.64 – – 81 316 049.64 128 744 679.56 -7 744 466.60 –0.00 121 000 212.96 788 132 810.94 11 077 205.96 -4 451 567.51 794 758 449.39 Shareholders’ Equity Paid-in Capital 49 200 000.00 – – 49 200 000.00 Other instruments of shareholders’ equity 7 202 534.99 – – 7 202 534.99 Mandatory Reserves 3 451 163.28 – – 3 451 163.28 Other reserves -7 203 264.62 11 066 611.96 – 3 863 347.34 Retained earnings 729.64 -10 801 554.93 _ -10 800 825.29 8 005 844.70 8 656 320.95 – 16 662 165.65 60 657 007.99 8 921 377.98 – 69 578 385.97 586 185 875.91 – 16 477 817.02 602 663 692.93 – 17 630 307.89 – 17 630 307.89 17 637 760.89 – 26 628 686.94 44 266 447.83 603 823 636.80 17 630 307.89 43 106 503.96 664 560 448.65 Suppliers 313 872.90 – – 313 872.90 State and other public agencies 820 583.56 – – 820 583.56 Received funding 40 696 555.90 – 11 917 063.98 52 613 619.88 Other accounts payable 56 142 871.59 – -55 023 567.94 1 119 303.65 Deferrals 25 678 282.20 -15 474 479.91 -4 451 567.51 5 752 234.78 123 652 166.15 -15 474 479.91 -47 558 071.47 60 619 614.77 Total Liabilities 727 475 802.95 2 155 827.98 -4 451 567.51 725 180 063.42 Total Equity and Liabilities 788 132 810.94 11 077 205.96 -4 451 567.51 794 758 449.39 Period’s net profit Total Shareholders’ Equity LIABILITIES Non current liabilities Other received funding Deferred tax payable Other accounts payable Current Liabilities 60 Annual Report and Accounts 2010 On January 1, 2009, the transition date, and December 31, 2009, the reconciliations between the shareholder’s equity according to the POC and the SNC were as follows: Shareholders’ Equity Reconciliation 01/01/2009 31/12/2009 Shareholders’ equity according to previous accounting banchmark 46 902 526.17 Derecognition of pre-operating costs -8 136 591.51 -7 744 466.60 Derecognition of pre-operating earnings 16 914 472.71 15 822 981.51 Derecognition of previously capitalised repairs -5 104 051.93 -6 251 315.31 Cancellation of amortisation related to capitalised repairs 1 534 463.95 2 262 244.84 Derecognition of intangible investments Change of the intangible assets’ service life by the end of the concession 60 657 007.99 -9 300.00 -9 300.00 – 11 753 431.07 – -348 501.60 5 198 993.22 15 485 073.91 -1 299 748.32 -3 638 086.62 Depreciation not accepted for tax purposes -14 700 799.83 -13 992 221.27 Fair Value Swap 10 703 137.49 11 066 611.96 Cancellation of earnings financial re-balancing Current fiscal effect Deferred Tax Establishment: Complete adjustment to shareholders’ equity Shareholders’ equity according to NCRF -98 417.44 8 921 377.98 46 804 108.73 69 578 385.97 The reconciliation of the net profit of the fiscal year ended on December 31, 2009, according to the POC and SNC is as follows: Reconciliation of Reported Earnings According to the previous accounting banchmark Derecognition of pre-operating costs Derecognition of pre-operating earnings Derecognition of earnings re-balance Change of the intangible assets’ service life by the end of the concession Derecognition of repairs capitalised within the period 31/12/2009 8 005 844.70 392 124.91 -1 091 491.20 -348 501.60 12 481 074.33 -1 147 125.75 10 286 080.69 Current Fiscal Effect -2 338 338.30 Deferred Tax Establishment: Depreciation not accepted for tax purposes Total effect According to NCRF 708 578.56 8 656 320.95 16 662 165.65 Annual Report and Accounts 2010 61 Arising from the indicated adjustments, the statements of the fiscal year ended on December 31, 2009, restated according to the SNC, is as follows: December 31. 2009 Income and Expenses Sales and services provided POC NCRF conversion NCRF conversion adjustments reclassification NCRF 113 245 584.47 -1 091 491.20 – 348 501.60 -348 501.60 – – Supplies and services received -4 165 334.16 -1 147 125.75 – -5 312 459.91 Costs with personnel -2 523 257.41 Operating grants 112 154 093.27 -2 523 257.41 – – Other income and gains 390 761.97 – 93 232.31 483 994.28 Other expenses and losses -939 498.86 392 124.91 -177 955.03 -725 328.98 Earnings before depreciation. financing expenses and taxes 106 356 757.61 -2 194 993.64 -84 722.72 104 077 041.25 Depreciation and amortisation expenses/reversals -46 173 187.14 12 481 074.33 – -33 692 112.81 Operating profit (before financing expenses and taxes) 60 183 570.47 10 286 080.69 -84 722.72 70 384 928.44 1 199 503.43 – -11 206.23 1 188 297.20 -49 374 518.77 – 69 982.09 -49 304 536.68 Received interests and similar income Borne interests and similar expenses Extraordinary profit (loss) -25 946.86 – 25 946.86 – Earnings before taxes 11 982 608.27 10 286 080.69 – 22 268 688.96 Income tax for the fiscal year -3 976 763.57 -1 629 759.74 – -5 606 523.31 Net profit for the fiscal year 8 005 844.70 8 656 320.95 – 16 662 165.65 29. Other Information Legal proceedings brought by third parties and brought against third parties On December 31, 2010, the Company was involved in a number of lawsuits brought against it by third parties, and some lawsuits brought by the Company against third parties. Regarding these proceedings, considering the experience arising from previous years and the data known on this date, legal counsel believes that there are strong probabilities of winning the cause in the actions set against the Company. Accordingly, the Board did not create any provisions for legal suits in progress. Arbitration Proceedings On December 31, 2010, we were preparing the arbitation proceedings which will settle pending issues regarding the execution of the contracts established between Scutvias and Galp regarding the Service !REAOF6ILA6ELHADE2DáOANDTHE3ERVICE!REAOF'UARDA These proceedings, essentialy stemming from different interpretations of the concession agreements, will be subject to an arbitration ruling. A decision is expected to be issued during the year 2011. Therefore, under this proceedings, Galp wishes to be compensated for several expenses globally amounting to 639.906,35 Euros. Also following the execution of contracts established between Scutvias and Galp, Scutvias charged the latter with a series of penalties and interests on arrears. The fairness of the above measure will also be 62 Annual Report and Accounts 2010 judged by said Arbitral Tribunal. The overall amount of said penalties and interets on arrears is EUR 2.860.052,98. Scutvias strongly believes that the Arbitral Tribunal’s decision will be favourable, and that it therefore has the right to be compensated for said amount. It is because of such a conviction that said amount was recognised as a receivable asset. In any case, and given the issue’s complex nature, it is completely impossible to determine the probabilities of success. Therefore, and to be prudent, we chose not to represent this amount as an income of the 2010 fiscal year. Certified Accountant The Board of Directors LEGAL CERTIFICATION OF ACCOUNTS AND AUDIT REPORT 64 Annual Report and Accounts 2010 Certificação Legal das Contas Introduction 1. We have examined the annual financial statements of SCUTVIAS – AUTOESTRADAS DA BEIRA INTERIOR, S.A., comprising the balance sheet as at 31 December 2010, (which reflects a total of EUR 758.959.404 and total shareholders’ equity of EUR 67.988.911, including a net profit of EUR 10.038.020), the income statement by nature, the statement of cash flows and the statement of changes in equity for the year then ended, and the respective notes. Responsibilities 2. The Board of Directors is responsible for the preparation of financial statements which give a true and fair view of the Company’s financial position, the results of its operations, the changes on its equity and its cash flows. This responsibility also extends to the adoption of appropriate accounting policies and criteria, as well as the maintenance of a proper internal control system. 3. Our responsibility is to express a professional and independent opinion based on our audit of the above-mentioned financial statements. Scope 4. Our audit was carried out in accordance with the Auditing Standards (“Normas Técnicas e Directrizes DE2EVISáO!UDITORIAvISSUEDBYTHE0ORTUGUESE)NSTITUTEOF3TATUTORY!UDITORS/RDEMDOS2EVISOres Oficiais de Contas”), which require the audit to be planned and performed with the objective of obtaining reasonable assurance about whether the financial statement are free of material misstatement. To this end, our audit included: – examining, on a test basis, evidence to support the amounts disclosed in the financial statements and assessing of the reasonableness of estimates, based on judgements and criteria defined by the Board of Directors, used in their preparation; – assessing the appropriateness of the accounting policies adopted and their disclosure, taking into account the circumstances; – verification of the applicability of the going concern principle; and – a consideration of the adequacy of the overall presentation of the financial statements. 5. Our examination also included the verification of the accordance of the financial information enclosed in the Board of Directors’ Report with the financial statements. 6. We believe that the audit performed by us provides an acceptable basis for expressing our opinion. Annual Report and Accounts 2010 65 Opinion 7. In our opinion, the above mentioned financial statements give, in all material respects, a true and fair view of the financial position of SCUTVIAS – AUTOESTRADAS DA BEIRA INTERIOR, S.A. as at 31 December 2010, the results of its operations, the changes on its equity and its cash flows for the year then ended, in accordance with the accounting principles generally accepted in Portugal. Emphasis 8. Without affecting the opinion expressed in the previous paragraph, we would like to call your attention to the following: 8.1 As disclosed in Note 2 to the financial statements, the Company has adopted for the first time in 2010 the new Portuguese accounting framework (SNC), including the corresponding accounting and financial reporting standards (NCRF). In the transition process of the previously adopted accounting standards (POC) to the NCRF, the Company followed the requirements set forth in NCRF n&IRSTTIMEADOPTIONOFTHE.#2&h!DOP½áOPELAPRIMEIRAVEZDAS.#2&vBEINGTHEBTRANSITION date reported to 1 January 2009, so that the financial information referring to that date and to 2009, previously presented in accordance with the POC, was restated to the NCRF, for comparative purposes. In Note 26 is disclosed the required information regarding the transition process into the NCRF. Report on Other Legal Requirements 9. It is also our opinion that the information included in the Board of Directors’ Report is consistent with the annual financial statements. Linda-a-Pastora, 28 March 2011 MARIQUITO, CORREIA & ASSOCIADOS, SROC Represented by: António Francisco Escarameia Mariquito – ROC 66 Annual Report and Accounts 2010 Audit Report Introduction 1. We have examined the financial statements of SCUTVIAS – Autoestradas da Beira Interior, S.A. (“the Company”), which comprise the balance sheet as of 31 December 2010, that presents a total of 758,959,404 Euros and shareholders’ equity of 67,988,911 Euros, including a net income of 10,038,020 Euros, the statements of profit and loss by nature, of changes in shareholders’ equity and of cash flows for the year then ended and the corresponding notes. Responsibilities 2. The preparation of financial statements that present a true and fair view of the financial position of the Company and the results of its operations, changes in shareholders’ equity and its cash flows, as well as the adoption of adequate accounting principles and criteria and the maintenance of appropriate systems of internal control are the responsibility of the Company’s Board of Directors. Our responsibility is to express a professional and independent opinion on these financial statements, based on our examination. Scope 3. Our examination was performed in accordance with the auditing standards (“Normas Técnicas e as Directrizes de Revisão/Auditoria”) issued by the Portuguese Institute of Statutory Auditors (“Ordem dos Revisores Oficiais de Contas”), which require that the examination be planned and performed with the objective of obtaining reasonable assurance about whether the financial statements are free of material misstatement. This examination included verifying, on a test basis, evidence supporting the amounts and disclosures in the financial statements and assessing the significant estimates, based on judgements and criteria defined by the Board of Directors, used in their preparation. This examination also included assessing the adequacy of the accounting principles used and their disclosure, taking into consideration the circumstances, verifying the applicability of the going concern concept and assessing the adequacy of the overall presentation of the financial statements. We believe that our examination provides a reasonable basis for expressing our opinion. Annual Report and Accounts 2010 67 Opinion 4. In our opinion, the financial statements referred to in paragraph 1 above, present fairly, in all material respects, the financial position of SCUTVIAS – Autoestradas da Beira Interior, S.A. as of 31 December 2010, and the results of its operations, changes in shareholders’ equity and its cash flows for the year then ended, in conformity with generally accepted accounting principles in Portugal. Emphasis 5. As disclosed in Note 2 to the financial statements, the Company adopted for the first time in 2010, THENEWGENARALLYACCEPTEDACCOUNTINGPRINCIPLESFOR0ORTUGALh3ISTEMADE.ORMALIZA½áO#ONTABIL¤Stica” or “SNC”), including its conceptual corresponding accounting and financial reporting standards (“NCRF”) and presentation requirements. In this first time adoption the Company followed the requirements of NCRF 3 – First time adoption of accounting and financial reporting standards, with transition date set at 1 January 2009. Consequently, financial information for 2009 that had been previously presented in accordance with previous gaap has been restated to NCRF for comparative purposes. Lisbon, 24 March 2011 DELOITTE & ASSOCIADOS, SROC S.A. Represented by Carlos Alberto Ferreira da Cruz SCUTVIAS - AUTOESTRADAS DA BEIRA INTERIOR, S.A. Head Office: Praça de Alvalade, 6 - 13.º - 1700-036 Lisboa – Phone: 217 826 200 – Fax: 217 826 190 Share Capital: 49,200,000€ – VAT: 504 611 917 Registed at the Lisbon Registry of Companies under n.º 11342
Download