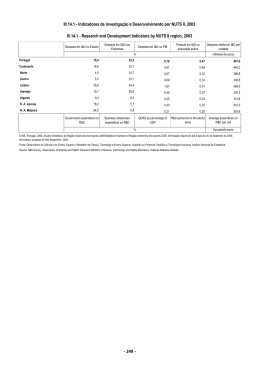
III.14.1 - Indicadores de Investigação e Desenvolvimento (I&D) por NUTS II, 2004 e 2005
III.14.1 - Research and Development (R&D) Indicators by NUTS II, 2004 e 2005
Despesa em I&D no PIB
Despesa em I&D nas
Empresas
Despesa em I&D no
Estado
Pessoal em I&D na
população activa
2005
2004
%
Portugal
Despesa média em I&D
por unidade
milhares de euros
0,77
38,5
14,6
0,46
551,2
Continente
0,80
39,1
14,1
0,47
554,6
Norte
0,66
39,8
4,9
0,32
472,8
Centro
0,64
37,5
5,0
0,34
373,6
Lisboa
1,10
39,7
21,1
0,89
741,0
Alentejo
0,45
41,5
12,8
0,25
418,5
Algarve
0,23
4,0
9,6
0,21
366,5
R. A. Açores
0,41
1,4
21,5
0,31
377,2
R. A. Madeira
0,24
13,5
55,8
0,23
GERD as percentage of
GDP
Business enterprises
expenditure on R&D
Government expenditure
on R&D
2004
R&D personnel in the
labour force
473,5
Average expenditure on
R&D per unit
2005
%
thousands euros
© INE, Portugal, 2007, Anuário Estatístico da Região Autónoma dos Açores 2006/Statistical Yearbook of Região Autónoma dos Açores 2006. Informação disponível até 30 de Setembro de 2007. Information
available till 30th September, 2007.
Fontes: DSIECT - Direcção de Serviços de Informação Estatística em Ciência e Tecnologia / GPEARI – Gabinete de Planeamento, Estratégia, Avaliação e Relações Internacionais / Ministério da Ciência,
Sources: R&D Survey, Directorate of statistical information on S&T / Office for Planning, Strategy, Assesment and International Relations of the Portuguese Ministry for Science, Technology and Higher
- 253 -
III.14.2 - Investigação e Desenvolvimento (I&D) por NUTS II, 2005 (continua)
III.14.2 - Research and Development (R&D) by NUTS II, 2005 (to be continued)
Unidade: N.º
Unit: No.
Pessoal em I&D (Equivalente a Tempo Integral)
Por sector de execução
Total
Portugal
Empresas
Estado
Ensino superior
Instituições privadas sem fins lucrativos
25 728
6 133
4 533
11 680
3 381
Continente
25 089
6 082
4 336
11 410
3 261
Norte
6 418
1 743
414
3 115
1 145
Centro
4 659
1 291
333
2 488
547
Lisboa
12 622
2 776
3 361
4 945
1 540
Alentejo
957
237
205
492
24
Algarve
434
34
25
370
5
R. A. Açores
347
2
46
185
115
R. A. Madeira
291
50
151
86
5
R&D personnel (Full Time Equivalent)
Total
Sector of performance
Business enterprises
Government
Higher education
Private non-profit institutions
© INE, Portugal, 2007, Anuário Estatístico da Região Autónoma dos Açores 2006/Statistical Yearbook of Região Autónoma dos Açores 2006. Informação disponível até 30 de Setembro de 2007. Information
available till 30th September, 2007.
Fontes: DSIECT - Direcção de Serviços de Informação Estatística em Ciência e Tecnologia / GPEARI – Gabinete de Planeamento, Estratégia, Avaliação e Relações Internacionais / Ministério da Ciência,
Tecnologia e Ensino Superior, Inquérito ao Potencial Científico e Tecnológico Nacional; INE, Inquérito ao Emprego; OCDE, Principais Indicadores de Ciência e Tecnologia, 2007 (1).
Sources: R&D Survey, Directorate of statistical information on S&T / Office for Planning, Strategy, Assesment and International Relations of the Portuguese Ministry for Science, Technology and Higher
Education; Statistics Portugal, National Employment Survey; OECD, Main Science and Technology Indicators (MSTI), 2007 (1).
Nota: Os totais apresentados podem não corresponder à soma das parcelas por razões de arredondamento automático.
Notes: Totals may not add due to rounding.
- 254 -
III.14.2 - Investigação e Desenvolvimento (I&D) por NUTS II, 2005 (continuação)
III.14.2 - Research and Development (R&D) by NUTS II, 2005 (continued)
Despesa em I&D
Unidades de
investigação
Por sector de execução
Total
Empresas
Estado
Ensino
superior
Instituições privadas
sem fins lucrativos
N.º
Portugal
Por fonte de financiamento
Empresas
Estado
Ensino
superior
Instituições privadas
Estrangeiro
sem fins lucrativos
milhares de euros
2179
120 1112
46 2015
17 5552
42 5187
13 8357
43 5612
66 3000
1 2091
3 3960
5 6448
Continente
2123
117 7484
46 0188
16 6249
41 5078
13 5968
43 4696
64 4213
1 2047
3 2555
5 3973
Norte
608
28 7452
11 4461
1 4060
11 6033
4 2897
10 6359
15 5966
5867
9524
9736
Centro
499
18 6420
6 9937
9280
8 9524
1 7678
5 8778
11 3483
2989
2486
8685
Lisboa
869
64 3908
25 5836
13 5667
17 7782
7 4623
25 3411
34 0143
2466
1 9470
2 8417
Alentejo
112
4 6877
1 9434
6013
2 0780
650
1 5647
2 4890
551
1059
4730
Algarve
35
1 2827
519
1229
1 0958
121
501
9731
174
15
2406
R. A. Açores
30
1 1317
164
2436
6705
2012
343
8868
44
1219
842
R. A. Madeira
26
1 2311
1663
6867
3404
377
573
9919
-
186
1633
R&D expenditure
R&D units
Sector of performance
Total
Business Governme Higher
enterprises
nt
education
Financing source
Private non-profit
institutions
No.
Business Governmen Higher
enterprises
t
education
Private non-profit
institutions
Foreign
funds
thousands euros
© INE, Portugal, 2007, Anuário Estatístico da Região Autónoma dos Açores 2006/Statistical Yearbook of Região Autónoma dos Açores 2006. Informação disponível até 30 de Setembro de 2007. Information
available till 30th September, 2007.
Fontes: DSIECT - Direcção de Serviços de Informação Estatística em Ciência e Tecnologia / GPEARI – Gabinete de Planeamento, Estratégia, Avaliação e Relações Internacionais / Ministério da Ciência,
Tecnologia e Ensino Superior, Inquérito ao Potencial Científico e Tecnológico Nacional, Inquérito ao Potencial Científico e Tecnológico Nacional; INE, Contas Nacionais Anuais; OCDE, Principais Indicadores de
Ciência e Tecnologia, 2007 (1).
Sources: R&D Survey, Directorate of statistical information on S&T / Office for Planning, Strategy, Assesment and International Relations of the Portuguese Ministry for Science, Technology and Higher
Education; Statistics Portugal, Annual National Accounts; OECD, Main Science and Technology Indicators (MSTI), 2007 (1).
Nota: Os totais apresentados podem não corresponder à soma das parcelas por razões de arredondamento automático. No número de unidades de investigação por região (NUTS II), para o sector empresas
foi considerado o número de empresas tendo em conta a região de localização da sua sede social, em vez da região onde efectivamente são executadas as suas actividades de I&D, de forma a evitar que as
empresas que desenvolvem I&D em mais do que um concelho fossem contadas mais do que uma vez.
Notes:Totals may not correspond to the sum of parts due to automatic rounding.
For the business sector, the number of research units by region (NUTS II) was determined taking into account the region in which the head office is situated, instead of the region in which the R&D activities are
developed; this aims to avoid that companies with R&D activities in more than one municipality could be reckoned more than once.
- 255 -
III.14.3 - Repartição da despesa em Investigação e Desenvolvimento (I&D) a preços constantes, segundo a área científica
ou tecnológica por NUTS II, 2005
III.14.3 - Gross expenditure on R&D (GERD) at constant prices and according to science and technology fields by NUTS II,
2005
Unidade: milhares de euros
Unit: thousands euros
Ciências exactas
Portugal
Ciências naturais
Ciências de engenharia e
tecnologia
Ciências da saúde
Ciências agrárias e
veterinárias
Ciências sociais e
humanas
74 015
83 949
176 622
74 024
75 571
145 970
Continente
72 137
79 013
174 371
73 646
68 984
143 412
Norte
13 215
16 530
44 442
24 901
12 743
35 660
Centro
16 476
10 778
23 679
14 122
5 454
28 803
Lisboa
39 123
44 215
102 266
34 238
40 995
70 031
Alentejo
2 496
3 568
2 525
190
7 896
6 723
Algarve
827
3 922
1 459
194
1 895
2 196
R. A. Açores
836
3 628
1 290
84
1 603
2 067
1 042
1 307
960
294
R. A. Madeira
Exact sciences
Natural sciences
Engineering and technology
Health sciences
4 984
Agricultural and
veterinary sciences
491
Social sciences and
humanities
© INE, Portugal, 2007, Anuário Estatístico da Região Autónoma dos Açores 2006/Statistical Yearbook of Região Autónoma dos Açores 2006. Informação disponível até 30 de Setembro de 2007. Information
available till 30th September, 2007.
Fontes: DSIECT - Direcção de Serviços de Informação Estatística em Ciência e Tecnologia / GPEARI – Gabinete de Planeamento, Estratégia, Avaliação e Relações Internacionais / Ministério da Ciência,
Tecnologia e Ensino Superior, Inquérito ao Potencial Científico e Tecnológico Nacional; OCDE, Principais Indicadores de Ciência e Tecnologia, 2007 (1).
Sources: R&D Survey, Directorate of statistical information on S&T / Office for Planning, Strategy, Assesment and International Relations of the Portuguese Ministry for Science, Technology and Higher
Education. OECD, Main Science and Technology Indicators (MSTI), 2007 (1).
Nota: Os valores apresentados incluem apenas os sectores Estado, Ensino Superior e Instituições Privadas sem Fins lucrativos, não sendo possível este apuramento para o sector Empresas. Os totais
apresentados podem não corresponder à soma das parcelas por razões de arredondamento automático.
Notes: Values presented only include figures for Government sector, Higher Education sector and PNP sector. Totals may not add due to rounding.
- 256 -
Download