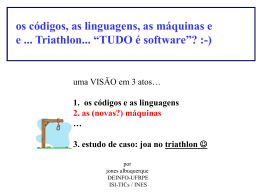
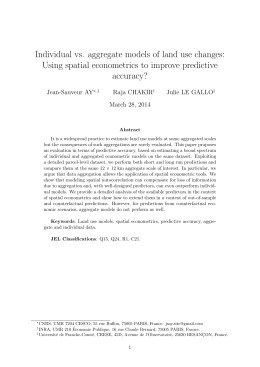
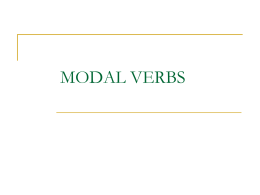
Epidemiology Mathematics, statistics, computer science, … CODES and LANGUAGES fishy.com.br www.epischisto.org Statistical epidemiology - (spatial and temporal frequency) Mathematical epidemiology - (temporal dynamics) Computational epidemiology - (spatial dynamics) Genetic epidemiology - (genetic factors) Codes Languages Machines Epidemiologistas devem ter conhecimentos de [Naomar, 2006, ]: http://www.livrariaodontosites.com.br/produtos_descricao.asp?lang=pt_br&codigo_produto=66 •SAÚDE PÚBLICA – devido a ênfase na prevenção de enfermidades. •MEDICINA CLÍNICA – devido a ênfase na classificação das doenças e seus diagnósticos. •FISIOPATOLOGIA – devido a necessidade de entender mecanismos biológicos básicos da doença. •ESTATÍSTICA – devido a necessidade de quantificar a freqüência das doenças e sua relação com os antecedentes. •CIÊNCIAS SOCIAIS – devido a necessidade de entender o contexto social no qual a doença ocorre e se apresenta. What is statistics for epidemiologists? a code! so “statistical epidemiology” is a redundancy... • a bit of philosophy of languages and codes... Discrete versus continuous codes Alphabet Numbers Languages e 2012? a bit of history, before… • http://library.thinkquest.org/22584/emh1000 .htm resume… • • • • • • • • 1650 BC – Papiro by Ahmes – Fractions 600 – 300 BC – Thales and Euclides – Geometry 1200 – Fibonacci – Series 16th - Father of arithmetic by Widmann – Symbols and x^3 + mx = n 17th – 1654 – Probability and Newton - Leibniz Calculus and symbols 18th - Bernoulli´s differential equations, needles of Buffon http://mste.illinois.edu/reese/buffon/bufjava.html 19th – Gauss, Cauchy, Poincaré, Cantor, Boole… 20th – … [An Introduction to the History of Mathematics by Howard Eves.] Epidemiologistas devem ter conhecimentos de que códigos e linguagens [Epischisto, 2012]: ??????????????? • tudo de 2006 + ...? •http://en.wikipedia.org/wiki/Epidemic_model •??? Livro Naomar ´onicio´... Capítulo modelos... Mathematical epidemiology! and what else?... another code… Moving Things Around WHAT are these systems? Self-Reproducing Automata History... Cellular Spaces • John von Neumann, 40´s, but... [Ulam, Stanislaw 1952] Calculating Spaces [von Neumann, John, 1968] [Zuse, Konrad, 1970] [Burks, Arthur (ed.) Essays on Cellular Automata, Univ. Ill, 1970] [Holland, John, 1966] A famous and simple one: Game of Life • Take a look at this applet – http://www.bitstorm.org/gameoflife/ • MATHEMATICAL GAMES The fantastic combinations of John Conway's new solitaire game "life" • Scientific American, 223 (October 1970): 120-123. some codes by machines... • A cell should be black whenever one or two, but not both, of its neighbors were black on the step before. Rule 30 - 1000 iterações Rule 110, 150 steps Flows in Rule 110!! Are these systems artificial ones? A New Kind of Science! or ? natural biotic types Patterns of some seashells, like the ones in Conus and Cymbiola genus, are generated by natural CA. http://www.answers.com/topic/cellular-automaton arts What can we do with these “systems”? MUSIC is a code by machine... Let´s take a bit of time with this site – http://tones.wolfram.com/ CA music generator What else? The Crucial Experiment – Stephen Wolfram, 1986 22.000 BC Arts Biology Psicology Physics Computing Mathematics Arqueology ... and Epidemiology? Statistical epidemiology - (spatial and temporal frequency) Mathematical epidemiology - (temporal dynamics) Computational epidemiology - (spatial dynamics) Genetic epidemiology - (genetic factors) Codes Languages Machines We have tried with ANKOS… Some codes... cellular automata and epidemiology Population Disease Parameters Vaccination Demographics Interaction factors Distances Data Sets Visualization a cellular automaton Cellular automaton A is a set of four objects A = <G, Z, N, f>, where • G – set of cells • Z – set of possible cells states • N – set, which describes cells neighborhood • f – transition function, rules of the automaton: – Z|N|+1Z (for automaton, which has cells “with memory”) – Z|N|Z (for automaton, which has “memoryless” cells) Moore Neighbourhood (in grey) of the cell marked with a dot in a 2D square grid one proposal: a top-down approach using a cellular automaton a b 1 km simulation space, a 10x10 square grid the dynamics (3a) Mollusk population dynamics a growth model for the number of individuals (N) that considers the intrinsic growth rate (r) and the maximum sustainable yield or carrying capacity (C) defined at each site (Verhulst, 1838): dN N rN (1 ) dt C (1) (3b) C N (t ) C N 0 rt 1 e N0 Human infection dynamics (SIR - SI) This model splits the human population into three compartments: S (for susceptible), I (for infectious) and R (for recovered and not susceptible to infection) and the snail population into two compartments: MS (for susceptible mollusk) and MI (for infectious mollusk). Socioeconomic and environmental factors environmental quality of the nine collection sites in Carne de Vaca, according to the criteria of Callisto et al (Souza et al, 2010). the model calculates the local increase of population using equation 1 and calculating N(t+1) out from N(t). The values for r and C are set at each site and each time step, using monthly meteorological inputs and considering the ecological quality of the habitat dS = p·S·MI + αR dt dI = pH ·S·MI χI dt dR = χI αR dt dM S = pM ·I·MS rM S dt dM I = pM ·I·MS rM I dt Cells and infection forces states black: rate of human infection = 100%; red: 80% ≤ rate of human infection < 100%; light red: 60% ≤ rate of human infection < 80%; yellow: 40% ≤ rate of human infection < 60%; light yellow: 20% ≤ rate of human infection < 40%; cyan: 0% ≤ rate of human infection < 20%. infection forces Human S -> I (infected molluscs contact, pH) I -> R (if treated (1-α), χ) Molluscs S -> I (infected human contact, pM) the algorithm – like the GAME OF LIFE! Main 1. Choose a cell in the world; 2. For each human in the cell perform a random walk weighted by the “probability of movement" defined at each site. Repeat these steps for every cell in the world. Then update data. 3. 4. 5. 6. 7. Choose a cell in the world; Call the “Events” process; Return the individual to his original cell after the infection phase; Choose a cell in the world; For the mollusk population in that cell, perform a diffusion process weighted by the “rate of movement" defined at each site; Repeat these steps for every cell in the world. Then update data. Events process 1. Increase the population of mollusks using the growth model described in Section 3.1; 2. Compute the transition between population compartments of humans using the set of equations (3b) defined in Section 3.2; 3. Compute the transition between population compartments of humans using the set of equations (3a) defined in Section 3.2; Update local data of the spatial cell. simulations Temporal evolution Color Legend I = 100% 80% ≤ I < 100% 60% ≤ I < 80% 40% ≤ I < 60% 20% ≤ I < 40% 0% ≤ I < 20% (I = percentage of infected humans) Day 26 Day 43 Day 106 Day 132 Day 88 Day 365 “according to the risk indicator, in the scattering diagram of Moran represented in the Box Map (Figure 2), indicated 18 areas of highest risk for the schistosomiasis, all located in the central sector of the village. Areas with lower risk and areas of intermediate risk for occurrence of the disease were located in the north and central portions with some irregularity in the distribution” Simulations – previsibility... 2012 2017 2022 2027 Color legend I = 100% 80% ≤ I < 100% 60% ≤ I < 80% 40% ≤ I < 60% 20% ≤ I < 40% 0% ≤ I < 20% Predictive scenarios generated with the parameter calibration of the year 2007 that show endemic schistosomiasis. I stands for the average percentage of infected humans per spatial cell predicted by the model Statistical epidemiology - (spatial and temporal frequency) Mathematical epidemiology - (temporal dynamics) Computational epidemiology - (spatial dynamics) Genetic epidemiology in (genetic factors) Codes? Languages? Machines? Schistosomiasis???? - Thanks a lot! jones.albuquerque
Download