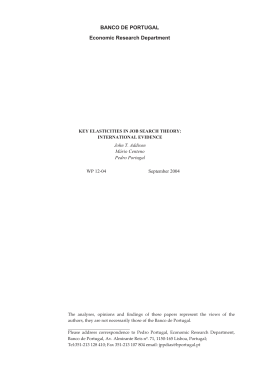
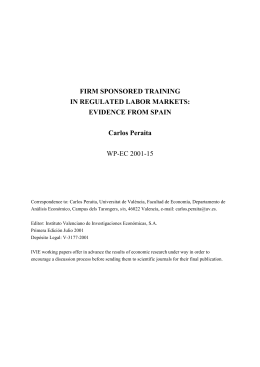
THE IMPACT OF THE MINIMUM WAGE ON LOW-WAGE EARNERS*
107
Articles
Mário Centeno** | Cláudia Duarte** | Álvaro A. Novo**
II
“Advantages and disadvantages tend to equality where there is perfect liberty”
Adam Smith, The Wealth of Nations, Chapter X
Of wages and profit in the different employments of labour and stock
Abstract
This paper estimates the impact of increases in the minimum wage on employment
stability, wages and inequality in Portugal. We use data from 2002 to 2010; from
2002 to 2006 the real minimum wage was stable, but it increased quite substantially
afterwards. Lower-tail wage inequality widen up to 2006 and declined strongly
afterwards. The results point towards a negative employment elasticity for workers
whose initial wage is between the old and the new minimum wages. This elasticity
is similar to the one obtained in the US, a country with a low minimum wage when
compared to the average wage, and smaller than the one obtained for France, a
country with a high minimum wage. The wage elasticity to the minimum wage is
naturally higher for workers earning exactly the old minimum wage. The wages of
all other workers remain unaffected. These results point to a detrimental effect of
minimum wage increases for employment stability of low-wage workers, with only
minor gains in terms of wages.
1. Introduction
Policy makers and economists often lead long debates on relevant issues for people’s life. The minimum
wage is one of the most debated topics in labor economics. The arguments on the minimum wage policy
consider its impact on employment, wages and the distribution of income.
Economists know since the seminal work of Stigler (1946) that the minimum wage can have a positive
impact on employment. They also know, but for a longer period, that the minimum wage can have a
negative impact on employment. While the latter is probably the most expected result – after all nobody
contests that we typically reduce the consumption of apples when its price goes up – the former is also
a plausible outcome. Indeed, in markets where an employer (demand) has a significant market power
and is able to control the wage that he pays, a legal imposition of a minimum wage may increase the
level of employment. The employer has “monopsony power”, which allows him to pay wages below
the workers’ marginal productivity. Thus, in a situation where the government increases the wage paid
(but not above productivity), the employer still has the incentive to keep the worker. What is more,
the higher wage attracts to the labor supply workers otherwise idle. Overall, the minimum wage may
increase employment. But in a market where the minimum wage increase eats away the profit margin,
* The authors thank the comments of Nuno Alves, António Antunes, Ricardo Félix, Ana Cristina Leal, José Ferreira
Machado and Hugo Reis. The opinions expressed are those of the authors and not necessarily those of Banco de
Portugal or the Eurosystem. Any errors and omissions are the sole responsibility of the authors.
** Banco de Portugal, Economics and Research Department.
the impact on employment is perverse. Ultimately, the sign of the impact of the minimum wage on
employment is an empirical question.
The main political goal of the minimum wage is to redistribute income to low-paid workers. To achieve
108
some citizens and pays it to others. In doing this, national output does not increase (except for monopsony
BANCO DE PORTUGAL | ECONOMIC BULLETIN • Autumn 2011
II
this goal most policies incur in several risks. First, the minimum wage increase takes money away from
markets). Does the money reach its target? Probably not, since rises in the minimum wage may reduce
low-wage employment. Second, the minimum wage policy is an exogenous interference with the firm’s
human resources management. It changes the relative price of workers inside the firm, making those
relatively better paid relatively less expensive. This may drive employment away from minimum-wage
earners, but may also result in a significant compression of the wage distribution – lower wage increases
for wages just above the minimum. As a result, internal labor market characteristics of the firm that
deliver positive economic outcomes in terms of productivity, such as returns to tenure, long spells of
employment and ports-of-entry may be negatively impacted.
The motivation to change the minimum wage can also rest on other types of arguments. We can use
efficiency wage arguments. The level of the minimum wage is interpreted as the lowest level of wages
compatible with a given living standard and a fair level of payment in exchange for the services of labor.
This can also be supplied with a Keynesian flavor, if we believe that higher wages provide the economy
with stronger demand and thus increase the overall output level. Additionally, there may be some general
equilibrium effects coming from higher levels of the minimum wage, which may lead firms to create
more productive jobs, therefore better paid and workers to demand these types of jobs.
In this study, we analyze the impact of minimum wage policy on low wage earners between 2002 and
2010. This is a quite interesting period in Portugal because a period of no real gains in the minimum wage
up to 2006 is followed by a period of quite substantial increase in the minimum wage. In this context,
it is interesting to analyze the impact of the minimum wage on low-wage workers and not only on the
minimum-wage earners. We will address the following questions: Does the minimum wage help to reduce
lower tail wage inequality? Are there employment losses associated with increases in the minimum wage
above the average wage increase? Is there a spillover effect from minimum wage increases?
To answer these questions, we estimate a set of models to establish the relationship between minimum
wages increases and employment, conditional on a set of characteristics prevailing in the economy at
that time. In particular, we study how the interaction of the real minimum wage variation and the worker
position in the distribution of wages affects the probability that (s)he remains employed.
Research consensus for other countries seems to evolve around the following conclusion: the impact on
employment is a debate around zero (Freeman, 1996). The minimum wage seems to have some impact
on the wage distribution, but a much smaller impact (if any) on the income distribution (for a detailed
discussion see Brown, 1999, Card and Krueger, 1995 and Neumark and Wascher, 2007). In any case,
the initial level and the dimension of the increase in the minimum wage seem to be relevant to set the
case. Low increases in the minimum wage are certainly much more employment friendly. What would
be difficult after that is to define what a “low increase” is.
Our results confirm this general appraisal. The later and larger updates of the minimum wage lead to
significant reductions in lower-tail wage inequality. This compression of wages was both explained
by significant wage increases in the lower percentiles and below average increases at median wages.
However, they are also associated with significant decreases in employment. A less intrusive minimum
wage policy is thus advisable. Adding to this conclusion, it is widely known that workers and job turnover
are higher for low-wage workers. The resulting excess worker turnover coming from increased employment instability as a result of minimum wage increases is widely detrimental for productivity, training
and progression within the firms’ internal labor markets.
2. Data
In this article we use a longitudinal database matching workers and firms made available by Instituto
de Informática da Segurança Social (Portuguese social security data processing office), which includes
II
to 2010. Workers and firms have a unique identification code that allows tracking both over time. One
109
of the advantages of using this information is the administrative nature of the database – registers of
Articles
all workers who paid contributions to the social security general regime, covering the period from 2002
mandatory contributions to the Portuguese social security system. Usually, the information in administrative databases is seen as more reliable, being less prone to measurement errors, such as reporting or
rounding errors, particularly in wages.
The information on wages refers to gross monthly values, reported in October of each year. The database
includes different types of compensation, namely permanent, variable, vacation and Christmas bonuses,
and other pay. To increase comparability, we used the permanent wage adjusted for a fixed work period
of 30 days, i.e. we divided the permanent compensation by the actual number of days worked in the
month and multiplied by 30.
In addition to wages and the number of days worked in October, this database also includes other variables, such as job tenure and variables related to workers (for example, gender, age and worker status
– employees, self-employed or other) and firms’ characteristics (for instance, region and size), covering
all activity sectors. The coverage in public administration, health and education has been increasing over
time, as new civil servants are enrolled in the social security general regime, instead of the specific civil
servant social security scheme.
The original database was restricted to salaried workers, whose wage was at least 80 per cent of the
minimum wage established by law (taking into account the legal possibility of a 20 per cent reduction
in minimum wages earned by apprentices and trainees). Furthermore, inconsistent and missing reports
on gender, age and job tenure were dropped. So, our sample has almost 25 million year/worker/firm
observations, an average of 2.7 million workers in each year.
3. The evolution of minimum wage in Portugal: 2002-2010
The Portuguese minimum wage legislation was introduced in 1974, defining the legal minimum wage
for employees with at least 20 years of age, excluding agriculture, domestic work and firms with up to
5 workers. Since then, this legislation has undergone several adjustments and currently there are no
exceptions by age, activity sector or firm size. The minimum wage is the same for all employees except
apprentices and trainees (whose minimum wage can be reduced by 20 per cent) and disabled workers
(reductions between 10 and 50 per cent).
In 2002 the minimum wage was 348 euros, representing 50.3 per cent of the mean wage and 70 per
cent of the median wage. In 2010 the minimum wage had increased to 475 euros, which represent
52.2 per cent of the mean wage and 73.1 per cent of the median wage.1 Developments in the minimum
wages have been discretionary, not following a formal rule or indexation – each year the government,
after consulting representatives of workers and employers, proposes a new figure for the minimum
wage. Nevertheless, the rate of change of the minimum wage has typically tracked the expected inflation, resulting in changes of the real minimum wage close to zero. In Chart 1, we can see that this was
the case in the period from 2002 to 2006.
This situation changed from 2007 onwards, a period during which the minimum wage increased markedly in real terms (Chart 1). These recent increases reflected the agreement signed by the government
1 The median of a distribution represents the value for which 50 per cent of the observations are below (and,
likewise, 50 per cent of the observations are above).
and the representatives of workers and employers, in December 2006. The main goal of this agreement
was to have a minimum wage of 500 euros by 2011. The agreed roadmap, put in place up to 2010, set
As shown in Chart 2, up to 2006 the growth of the minimum wage in real terms was quite similar to
the median wage, for all employees who stayed for at least two consecutive years in the database (in
the same firm or not), being, on average, about 1.8 percentage points below the growth rate of the
mean wage. In real terms, since 2007 the minimum wage increased more sharply than the median wage,
outpacing the mean wage in the period from 2008 to 2010.2
Chart 1
Chart 2
DEVELOPMENTS IN THE MINIMUM WAGE
REAL WAGE RATES
7
7
Nominal rate of change
Real rate of change
6
6
5
5
4
4
Per cent
BANCO DE PORTUGAL | ECONOMIC BULLETIN • Autumn 2011
110
the minimum wage at 403 euros in 2007, 426 euros in 2008, 450 euros in 2009 and 475 euros in 2010.
Per cent
II
3
2
3
2
1
1
0
0
-1
-1
-2
Minimum wage
Median wage
Mean wage
-2
2002
2003
2004
2005
2006
2007
2008
2009
2010
Note: Real wage rates were obtained by deflating the nominal
rates of change using consumer prices.
2002
2003
2004
2005
2006
2007
2008
2009
2010
Note: Mean and median wages obtained from Social Security
data and authors’ calculations.
The evolution of the share of minimum wage earners (Chart 3) can be split in two distinct periods: (i)
from 2002 to 2006 this share remained fairly stable, around 8 per cent; (ii) since 2007 the share of
minimum wage earners increased markedly, from 8.9 per cent in 2007 to 12.4 per cent in 2010. This
evolution was common to most activity sectors, being more striking in manufacturing and construction.3
The impact of the minimum wage growth can also be seen through the distributions of wages and
wage changes. A simple visual inspection reveals that the minimum wage is a key factor in the wage
distribution, being the mode of the distribution (Chart 4).4
Moreover, the percentile up to which the minimum wage is binding increased. While, on average, from
2002 to 2006, the minimum wage was binding up to the 10th percentile, in 2010 it was binding up to
the 15th percentile. This means that in 2010 15 per cent of the employees had a wage lower than or
equal to the minimum wage.
Looking at the distributions of nominal wage changes over time, the impact of the minimum wage is
also noticeable (Chart 5). Up to 2006, these distributions showed a high concentration on zero and
values close to the observed/expected inflation rates (used as a reference for bargaining and minimum
2 Real wage rates were obtained by deflating the nominal rates of change using consumer prices.
3 To avoid slight differences due to rounding, we considered that an employee earned the minimum wage if its
wage falls in a 2-euro interval centered on the legal minimum wage (minimum wage +/- 1 euro).
4 The mode of a distribution is the value that occurs most frequently among the sample.
Chart 3
SHARE OF MINIMUM-WAGE EARNERS
II
12.0
111
Articles
13.0
Per cent
11.0
10.0
9.0
8.0
7.0
6.0
2002
2003
2004
2005
2006
2007
2008
2009
2010
Sources: Social Security data and authors’ calculations.
Note: We considered that an employee earned the minimum wage if its wage falls in a 2-euro interval centered on the legal minimum wage (minimum wage +/- 1 euro).
Chart 4
WAGE DISTRIBUTIONS
2006
2010
0.15
0.10
0.10
F r act ion
F r act ion
0.15
0.05
0.00
300
0.05
500
700
900
Euros
1100
1300
1500
0.00
300
500
700
900
Euros
1100
1300
1500
Sources: Social Security data and authors’ calculations.
wages). From 2007 onwards, the distribution of wage changes had three spikes - at zero, at the observed/
expected inflation rate value and at the rate of change of the minimum wage (in 2010, the first two
spikes collapsed into a single spike, reflecting the low positive inflation observed in that year).
Since the minimum wage strongly influences the dispersion on the left tail of the wage distribution, it
plays a significant role in the evolution of wage inequality, as measured by the ratio between the wages
in the 50th and 10th percentiles. This ratio decreased by 12.9 per cent between 2002 and 2010 (Chart
6). After a period of increasing inequality (7.4 per cent up to 2006), the 50/10 ratio decreased by 18.9
per cent between 2006 and 2010. This significant reduction highlights the fact that wages in the 10th
percentile (where the minimum wage was binding) grew more markedly than in the 50th percentile (i.e.
the median). Although common to most activity sectors, this evolution was clearer in manufacturing
and construction.
Chart 5
WAGE CHANGE DISTRIBUTIONS
2003
II
2006
0.30
0.30
0.25
0.25
0.20
0.20
F r act ion
F r act ion
0.15
0.15
0.10
0.10
0.05
0.05
0.00
0.00
-30
-20
-10
0
Per cent
10
20
30
-30
-20
-10
2009
0
Per cent
10
20
30
10
20
30
2010
0.40
0.40
0.35
0.35
0.30
0.30
0.25
0.25
F r act ion
F r act ion
BANCO DE PORTUGAL | ECONOMIC BULLETIN • Autumn 2011
112
0.20
0.20
0.15
0.15
0.10
0.10
0.05
0.05
0.00
0.00
-30
-20
-10
0
Per cent
10
20
30
-30
-20
-10
0
Per cent
Sources: Social Security data and authors’ calculations.
Therefore, this evidence suggests that the stronger increases in minimum wages in recent years contributed
to reducing wage inequality. Previous studies on the role played by the minimum wage in the evolution
of the 50/10 inequality ratio in Portugal include Cardoso (1998) and, more recently, Centeno and Novo
(2009). For the period after 1995, the results in the latter work also suggest that the minimum wage
(mildly) contributed to the reduction of the 50/10 ratio, especially in the case of female workers.
Answering to the question on the impact of minimum wages on wage inequality is not clear cut. This
issue has been extensively discussed in the literature. For example, DiNardo et al. (1996) proposed a
semiparametric procedure to analyze the effect of several factors (including changes in the minimum
wage) over the entire wage distribution. Using data for the US, the authors found that the increase in
the real minimum wage between 1973 and 1979 contributed to the decrease in wage inequality. Also
for the US, Autor et al. (2010) found a small impact of the minimum wage on the lower tail inequality,
but highlighted that this impact could go beyond the direct effect on low-wage workers, through
spillover effects.
Does the evolution of minimum wages only affect low-wage workers? Chart 7 shows the rate of change
of wages up to the 75th percentile in 2004 (nil real change of the minimum wage) and in 2009 (highest
Chart 6
Chart 7
WAGE INEQUALITY: 50/10 RATIO
WAVE EFFECT – REAL RATE OF CHANGE OF
WAGES UP TO THE 75TH PERCENTILE OF WAGE
DISTRIBUTION
2.0
0.40
II
8.0
2004
113
1.5
7.0
1.0
6.0
0.5
5.0
0.0
4.0
-0.5
3.0
Articles
2009 (esc. dir.)
0.34
0.32
-1.0
0.30
2002
2003
2004
2005
2006
2007
2008
2009
2010
Sources: Social Security data and authors’ calculations.
Per c
cent
0.36
Per c
cent
Log points 50/10
0.38
2.0
1
11
21
31
41
P
Percentils
il
51
61
71
Sources: Social Security data and authors’ calculations.
Note: The chart presents the logarithm of the ratio between
the 50th and the 10th percentiles of the wage distribution.
real change of the minimum wage in the period analyzed).5 In 2004 the trend in wage rates over the
wage distribution was positive. In contrast, in 2009, low-wage workers received the highest pay rises.
This is true not only for minimum wage earners, but also for workers with wages slightly above the
minimum wage. In turn, medium-wage workers received the lowest pay rises.
4. Results
The debate on the impact of the minimum wage on employment and, in general, in the economy and
society, is one that will be ultimately settled by the empirical evidence. Theoretically, there are models
in which the minimum wage may lead to a decrease in employment, but there are also models that
imply an increase. The last decade in Portugal has been characterized by both rather meager increases
in the minimum wage, but also by rather generous ones. It bears asking, what has been the impact of
such political choices? To address this question, we follow a line of research developed, among other,
by Abowd et al. (2000) and Neumark et al. (2004). We estimate a set of models that analyze how the
interaction between the real minimum wage increases and the worker position in the distribution of
wages determines the probability that (s)he remains employed.
It is easy to imagine that those most affected by a minimum wage increase scheduled for next year are
the current year’s minimum wage earners themselves. However, all other individuals whose current wage
is below next year’s minimum wage will also be directly affected, although to smaller and varying degrees
than the minimum wage earners. All other workers will not be directly affected by the new minimum
wage. In our model, we will consider six levels of wage earners, hypothesizing that the further away a
worker is from the new minimum wage, the less the probability of remaining employed is affected by
the change in the minimum wage. The six groups are: (i) the current minimum-wage earners; (ii) those
earning more than today’s minimum wage, but below the new minimum wage; (iii) those with wages
in the first quartile, but not in the first two groups; (iv)-(vi) the 2nd, 3rd, and 4th quartiles of the wage
distribution.
5 We are implicitly assuming that the evolution of the wages in the top-25 per cent of the distribution are not
influenced by changes in the minimum wage.
Since we consider the impact of a variation in next year’s minimum wage conditional on being employed
in the current year, our estimate of the impact is a lower bound of the overall impact on the economy
II
BANCO DE PORTUGAL | ECONOMIC BULLETIN • Autumn 2011
114
because it ignores the impact on the transition from unemployment and inactivity to employment.
Year-by-year
We start our study by considering 8 cross-sections of workers for the years of 2003 to 2010. The estimation sample excludes agriculture, wages below the legal minimum wage and missing observations for
nationality, activity sector, job tenure and firm size. The results of cross-section estimation are interpretable as long-term relationships, in that each individual represents a cohort in different stages in the life
cycle of the labor market. Additionally, over the years the minimum wage changes were dramatically
different, with real wage losses and large real wage gains (see Section 3). This variability, apart from year
specific effects, shall reflect itself on the different years’ impact estimates.
We consider the following simple model specification:
Yi = å k bk Dk ,i + X l + ui
where Yi assumes value 1 if individual i remains employed from year t to t + 1 and 0 if (s)he is no
longer employed in t + 1 ; Dk ,i , for k = 1,2,..., 6 is a dummy variable that assumes value 1 if the wage in
year t is in one of the 6 wage categories defined above. The matrix X includes variables with worker,
firm and match characteristics, namely: a quadratic term in the age of the worker; gender indicator;
foreigner indicator; sector dummies (extractive; manufacturing; construction); firm size dummies (small:
1-25 workers; medium: 26-100; large: 101 or more workers); and tenure dummies (up to 6 months;
7-12 months; 13-36 months; 37-72 months; and more than 72 months). And ui is a conventional error
term. We estimated this model using both a linear probability model and a probit model. As it can be
seen in Table 1, the results do not depend on the choice of the method, but for computational reasons
in the remaining of the paper, we report only the results of the linear probability model.6
A Portuguese forty-year-old male, working in a large services firm, in 2002, with more than 6 years of
tenure and a wage falling in the top quartile had a 95 per cent probability of remaining employed in
2003. Relatively to such individuals in the top quartile, the group of minimum wage earners in 2002
was 8.3 p.p. less likely to hold a job in 2003 (Table 1, column 1). In other words, the probability of nonemployment for the minimum wage earner is 13.3 per cent, i.e., 166 per cent higher than that of the
top quartile worker. This result is not surprising in view of the evidence that low-wage workers have
higher on-the-job rotation rates (Centeno et al, 2008).
The following group, composed of those who earn at least the new minimum wage, was 6.5 p.p. less
likely to be among salaried workers than top earners. The next group, which is the first one not directly
affected by the new minimum wage, is 1 p.p. more likely to remain employed than the previous group
but almost 3 p.p. more likely than the group of minimum wage earners. The difference relative to the
top quartile falls monotonically for the other groups.
The remaining columns of Table 1 repeat the exercise for the 2004-2010 period. The estimates are remarkably stable across the years, with slightly lower probabilities of being employed in years of economic
downturn. There is also a tenuous increase in the probability of losing employment in years where the
real (or nominal) minimum wage increases were more significant, particularly among the group of individuals earning more than the current minimum wage but less than next year’s.
6 See Angrist and Pishke (2009) for a full discussion of linear probability models vs. probit models.
2 063 683
2 100 410
-2.45
(0.000)
-2.92
(0.000)
-4.23
(0.000)
-4.74
(0.000)
-6.06
(0.000)
-6.20
(0.000)
-7.90
(0.000)
-7.30
(0.000)
-8.31
(0.000)
-8.92
2004
2003
(0.000)
-1.95
(0.000)
-2.43
(0.000)
-3.55
(0.000)
-4.10
(0.000)
-5.33
(0.000)
-5.46
(0.000)
-7.08
(0.000)
-6.53
(0.000)
-7.81
(0.000)
-8.32
2004
(0.000)
2003
2 118 697
(0.000)
-2.78
(0.000)
-4.63
(0.000)
-7.08
(0.000)
-8.72
(0.000)
-9.70
2005
(0.000)
-2.18
(0.000)
-3.84
(0.000)
-6.16
(0.000)
-7.72
(0.000)
-9.00
2005
(0.000)
-2.38
(0.000)
-3.82
(0.000)
-5.87
(0.000)
-7.47
(0.000)
-7.96
2007
2 137 751
(0.000)
-2.23
(0.000)
-3.99
(0.000)
-6.28
(0.000)
-8.61
(0.000)
-8.90
2006
2 176 748
(0.000)
-3.08
(0.000)
-4.62
(0.000)
-6.85
(0.000)
-8.40
(0.000)
-8.81
2007
Probit model
(0.000)
-1.68
(0.000)
-3.32
(0.000)
-5.58
(0.000)
-7.56
(0.000)
-8.40
2006
Linear probability model
2 250 426
(0.000)
-3.37
(0.000)
-5.54
(0.000)
-7.30
(0.000)
-9.08
(0.000)
-9.99
2008
(0.000)
-2.45
(0.000)
-4.45
(0.000)
-5.97
(0.000)
-7.71
(0.000)
-8.98
2008
2 293 273
(0.000)
-3.38
(0.000)
-5.66
(0.000)
-6.73
(0.000)
-9.11
(0.000)
-9.48
2009
(0.000)
-2.55
(0.000)
-4.65
(0.000)
-5.53
(0.000)
-7.78
(0.000)
-8.61
2009
2 236 537
(0.000)
-2.51
(0.000)
-4.32
(0.000)
-5.71
(0.000)
-7.77
(0.000)
-7.77
2010
(0.000)
-1.90
(0.000)
-3.51
(0.000)
-4.85
(0.000)
-6.72
(0.000)
-7.24
2010
Articles
Notes: p-values in parentheses. The remaining control variables included in the model are omitted from the Table; see text for the full set of variables included. Coefficients were multiplied by 100 to be interpretable as the percentage
change in the probability of remaining employed between two consecutive years for each level of the initial wage relatively to those with wages in the top quartile. For instance, an individual earning the minimum wage in 2002
will be 8.3 p.p. less likely to remain employed in 2003 than an individual with a wage in the top quartile, but otherwise equal (age, gender, industry, etc).
Sources: Social Security data and authors’ calculations.
Number of observations
3rd quartile
2nd quartile
More than next year's minimum wage but less than 1st quartile
Less than next year's minimum wage
Current minimum wage
Wage group:
3rd quartile
2nd quartile
More than next year's minimum wage but less than 1st quartile
Less than next year's minimum wage
Current minimum wage
Wage group:
Employment
YEAR-BY-YEAR LINEAR PROBABILITY AND PROBIT MODEL, 2003-2010
Table 1
II
115
Over time
Note that our cross-section analysis does not account specifically for the variations in the real minimum
II
wage; rather, it shows how the conditional probability of employment varies among the different wage
this issue in a more satisfying way, we extend our analysis to panel data models. We take advantage of
BANCO DE PORTUGAL | ECONOMIC BULLETIN • Autumn 2011
groups. Therefore, we cannot yet attribute to those policy options the variability in employment. To address
116
our panel with 17.4 million observations of about 2.2 million individuals per year, over the 2003-2010
period and estimate the following model using a firm ( j ) fixed-effects estimator:
(
)
Yijt = å k bk Dk ,ijt + jk Dk ,ijt * MWt + X l + uijt
where all variables are defined as before and MWt represents the variation in the real minimum wage
(
)
in year t . The interaction term between the level of wage in year t Dk ,ijt and the minimum wage
variation in year t + 1 captures the impact on the probability of remaining employed in year t + 1 at the
different wage levels due to the minimum wage variation. Note that the specification imposes the mild
hypothesis that individuals in the top wage quartile are not affected by variations in the real minimum
wage. Additionally, the regression model includes year fixed-effects.
The cross-section results gave us a first rough measure of how the probability of employment varies
across the wage distribution. With panel data, we will be able to breakdown this probability in two
factors: one factor associated with a level effect for each wage-group; and another corresponding to
the group specific marginal effect, associated with to the variation in the minimum wage, which also
captures the change in the minimum wage level (interaction Dk .ijt ´ MWt ). The results of the estimation
are presented in Table 2, column (1).
Interpreting the results is not straightforward, given the existence of interaction variables in the model.
The impact of changes in the minimum wage is captured through the b and jk parameters. The first
k
parameter captures the level effect, while the second is associated with the marginal effect. In order to
allow a direct interpretation of the first impact, the variable that measures the change in the minimum
wage was re-centered to the sample average (2 per cent). Thus, the level impact, bk , should be seen as
the one that corresponds to a change in the minimum wage equal to the sample average. The marginal
impact, jk , is not affected by this transformation and has always a direct interpretation.
For workers earning less than next year minimum wage (the two first groups) the probability of remaining
employed decreases by about 0.5 p.p. for each percentage point of increase in the minimum wage. For
instance, in 2009, where the real minimum wage increased 6.6 per cent, the probability of remaining
employed for a minimum wage earner decrease by (an additional) 2.6 p.p.. Overall, in 2009, minimumwage earners had a probability of remaining employed of 9.8 p.p. lower than a top quartile worker. This
is decomposed in 7.2 p.p. associated with the level impact evaluated at the average increase for the real
minimum wage, and 2.6 p.p. due to the marginal impact because the real minimum wage increased
above the average rate. The cross-section estimation indicated a difference of 8.6 p.p.. The remaining
wage groups, despite not being directly affected by the new minimum wage, still have slightly lower
probabilities, around 0.2 p.p. less for each percentage point increase in the real minimum wage.
We conclude that all groups of workers are to some extent affected by the minimum wage. But, are
there differences between them? In other words, are the coefficient estimates statistically different from
each other? We run hypothesis testing for the equality of the impact on the first group of individuals
earning more than next year’s minimum wage to the two groups below next year’s minimum wage. In
both cases, we reject the hypothesis of equality, suggesting that the minimum wage is naturally more
binding for low-wage earners.
Our results are closer to those obtained for the US and the UK than for France. In particular, Currie and
Fallick (1996) obtain an elasticity to changes in the minimum wage of -0.4, which is close to our estimate
Table 2
PANEL DATA FIRM FIXED-EFFECTS LINEAR PROBABILITY MODEL
Employment
Wages
Elasticity
(1)
(2)
(3)=(1)/(2)
-7.21
15.80
(0.000)
(0.000)
Wage group (β):
Less than next year's minimum wage
More than next year's minimum wage but less than 1st quartile
2nd quartile
3rd quartile
-5.88
14.69
(0.000)
(0.000)
-4.42
12.05
(0.000)
(0.000)
-2.56
9.22
(0.000)
(0.000)
-1.11
5.35
(0.000)
(0.000)
117
Articles
Current minimum wage
Percentage change in the real minimum wage times group indicators (φ):
Current minimum wage
Less than next year's minimum wage
More than next year's minimum wage but less than 1st quartile
2nd quartile
3rd quartile
Number of observations
-0.56
0.52
(0.000)
(0.000)
-0.45
0.09
(0.000)
(0.000)
-0.26
-0.16
(0.000)
(0.000)
-0.31
-0.06
(0.000)
(0.000)
-0.17
-0.22
(0.000)
(0.000)
17 377 525
14 721 929
II
-1.08
-5.26
1.64
5.23
0.76
Sources: Social Security data and authors’ calculations.
Notes: p-values in parentheses. The remaining control variables included in the model are omitted from the Table; see text for the
full set of variables included. Conditional on a 2 percent increase in the real minimum wage, the coefficients were multiplied by 100
to be interpretable as the percentage change in the probability of remaining employed between two consecutive years for each level
of the initial wage relatively to those with wages in the top quartile. For instance, with an increase of 2 per cent in the minimum
wage, in relation to an individual with a wage in the top quartile, but otherwise equal (age, gender, industry, etc), a minimum-wage
earner will be 7.2 p.p. less likely to remain employed in the following year. Additionally, for each percentage point of increase in the
minimum wage above 2 per cent the probability of staying employed decreases by 0.56 p.p..
of -0.6. The elasticities estimated by Abowd et al. (2000) are slightly larger for the US, but clearly larger
for France (their estimates are close to -0.6 and -2.1, respectively). Machin et al. (2003) study the impact
of the introduction of the minimum wage in the UK and find also a small impact on employment. The
evidence gathered for Portugal is ambiguous. Using a legislative reform that raised the minimum wage
for workers aged 15 to 19 years, Portugal and Cardoso (2006) show that it resulted in a larger reduction
of separations than in hirings. Using the same reform, Pereira (2003) reports a reduction in employment
among such workers. The estimated employment-minimum wage elasticities of Pereira (2003) are in the
interval -0.2 to -0.4, slightly smaller than our estimates.
The new minimum wage imposes an exogenous constraint on firms. Firms must adjust their production
process to accommodate this raise in labor costs. In doing so, they can opt for adjusting their wage bill,
they can opt for adjusting the quantity of labor (number of workers and hours worked) or a combination of these. We have seen that firms adjust downwards the amount of labor. Now, we explore how
the wages of the different workers are adjusted. We use the same specification (equation (2)), changing
only the dependent variable to the log difference between the real wage in year t+1 and in year t. Table
2, column (2), reports the estimates of the percent impact on the wage growth for the same group of
workers relatively to the top quartile.
The first noticeable fact is that the marginal impact of a percentage point increase in the real minimum
wage is positive for those below next year’s minimum wage and negative for those above it. This pattern
resembles the wave effect discussed earlier in Section 3. Indeed, Chart 8 plots these marginal effects
and, apart from a rescaling, the shape of the curve is generally equivalent to Chart 7. This implies that
Chart 8
WAGE REGRESSIONS: MARGINAL IMPACT OF A PERCENTAGE POINT INCREASE IN THE REAL MINIMUM
WAGE
II
0.6
BANCO DE PORTUGAL | ECONOMIC BULLETIN • Autumn 2011
118
0.5
0.4
0.3
0.2
0.1
0.0
-0.1
-0.2
-0.3
Minimum
wage, year t
< Minimum
wage, year
t+1
1st quartile
(less 2 first)
2nd quartile
3rd quartile
Sources: Social Security data and authors’ calculations, based on the results in Table 2, column 2.
increases in the real minimum wage are not innocuous for non-minimum-wage earners. The spillover on
the other individuals’ wages is negative, suggesting that firms adjust the other wage gains downwards
to accommodate exogenous increases in the minimum wage. For those concerned with wage inequality,
this outcome contributes towards a more uniform wage distribution. But as always, there might be too
much of a good thing and the negative impact on employment must be also considered. Indeed, the
negative outcome in employment may deliver a smaller (if any) decrease of income inequality. Furthermore, given the higher incidence of long-term unemployment among low-wage workers, this impact
may even be increasing overt time.
Having studied the impact on employment and wages, we are now in conditions of computing wage
demand elasticities. Table 2, column (3), reports the wage demand elasticities of each group (the ratio
of the employment to wage coefficients). The elasticity of minimum-wage earners is -1.1, indicating that
for each percentage point increase in wages, employment decrease by slightly more than 1 p.p.. The
elasticity among the group earning below next year’s minimum wage is strong, -5.3, resulting primarily
from having a small wage variation due to the minimum wage and a negative impact on employment
similar to the minimum-wage earners.
Heterogeneity: Young workers and sector of activity
It is a well-established fact in the literature that the minimum wage is more binding among low-skilled
and young workers, those more prone to earn low wages due to lower productivity. Column (1) of Table
3 reports the results of an identical exercise to those reported above, but considering a sub-sample of
workers aged less than 25 years.7 Overall, the results indicate that young workers employment is more
sensitive to variations in the real minimum wage. This is particularly true for the group earning exactly
the current year’s minimum wage; for each percentage point increase in the minimum wage, the probability of remaining employed falls 0.74 p.p.. This is almost a third higher than the effect estimated for
the population of workers considered (0.56). In column (2), we see that the impact on real wages of the
minimum wage variation is similar in magnitude to the previous estimates, but it is typically statistically
non-significant for the group of individuals earning already above next year’s minimum wage. Together,
7 The wage quartiles are re-defined for each of the sub-samples used.
2 184 150
1 720 885
-0.01
(0.630)
-0.24
(0.000)
-0.08
(0.001)
-0.27
(0.000)
-0.36
(0.318)
-2.25
(0.000)
0.09
(0.001)
-0.38
(0.000)
0.55
(0.000)
-0.74
(0.000)
-1.35
-
3.47
-
-4.04
4 456 811
(0.000)
-0.12
(0.000)
-0.28
(0.000)
-0.54
(0.000)
-0.45
(0.000)
-0.71
-1.71
(0.000)
-2.41
(0.000)
-3.26
(0.000)
-5.28
(0.000)
-4.32
(0.000)
-10.35
(0.000)
-5.43
(0.000)
-7.36
(0.000)
-5.70
(0.000)
(4)
-6.72
Notes: p-values in parentheses. See notes to Table 2, to the list of variables included and an interpretation of the results.
Sources: Social Security data and authors’ calculations.
Number of observations
3rd quartile
2nd quartile
More than next year's minimum wage but less than 1st quartile
Less than next year's minimum wage
Current minimum wage
(3)
3 878 574
(0.000)
-0.06
(0.000)
0.12
(0.000)
0.23
(0.000)
0.37
(0.000)
0.70
(5)
Wages
Manufacturing
Elasticity Employment
(0.000)
(2)
(1)
Percentage change in the real minimum wage times wage group indicator (φ):
3rd quartile
2nd quartile
More than next year's minimum wage but less than 1st quartile
Less than next year's minimum wage
Current minimum wage
Wage group (β):
Wages
Employment
Young workers
(less than 25 years)
PANEL DATA FIRM FIXED-EFFECTS LINEAR PROBABILITY MODEL BY AGE LEVEL AND INDUSTRY
Table 3
1.93
-2.33
-2.35
-1.20
-1.02
(6)
2 120 848
(0.000)
-0.33
(0.000)
-0.45
(0.000)
-0.27
(0.000)
-0.51
(0.000)
-0.61
(0.000)
-2.42
(0.000)
-3.90
(0.000)
-5.91
(0.000)
-6.82
(0.000)
-6.48
(7)
Elasticity Employment
1 698 736
(0.043)
-0.04
(0.000)
0.30
(0.000)
0.15
(0.000)
0.35
(0.000)
0.64
(8)
Wages
Construction
-
-1.50
-1.83
-1.43
-0.95
(9)
(0.000)
-0.24
(0.000)
-0.16
(0.000)
-0.32
(0.000)
-0.09
(0.000)
0.46
(11)
Wages
Articles
10 799 866 9 144 619
(0.000)
-0.14
(0.000)
-0.26
(0.000)
-0.15
(0.000)
-0.27
(0.000)
-0.46
(0.000)
-0.56
(0.000)
-1.85
(0.000)
-4.09
-(4.090)
-5.85
(0.000)
-8.03
(10)
Elasticity Employment
Services
II
119
0.61
1.64
0.47
3.04
-1.01
(12)
Elasticity
these results imply a larger (in absolute value) elasticity among young minimum wage earners (-1.3) and
slightly lower elasticity in the contiguous group (-4.0).
Different industries have different human capital requirements. This in turn implies that workers with
120
the prevalence of minimum-wage earners is stronger. For such firms, an exogenous increase in the
BANCO DE PORTUGAL | ECONOMIC BULLETIN • Autumn 2011
II
different skills allocate to each industry accordingly. In industries with lower human capital requirements,
minimum wage may have far stronger impacts than in an industry where there are few such workers.
To study this possibility, we consider three sub-samples by industry type: manufacturing, construction,
and services. Columns (4)-(12) present the estimates for the impact of the minimum wage increases on
employment and wages.
There are three noteworthy facts to take away from this exercise. First, the larger impacts on employment
occur in manufacturing and the smaller in the services sector. Second, in the case of manufacturing, the
larger magnitudes, which were typically observed for the two groups below next year’s minimum wage,
are extended to the third wage group. In other words, in manufacturing, those that stand to lose with
a minimum wage increase are not only those that will have to be legally raised, but also those earning
already slightly above that new legal threshold. Third, in contrast with manufacturing, in the services
sector the larger magnitude is only observed for current minimum-wage earners.
5. Conclusion
This article discusses the impact of increases in the minimum wage on three key labor market outcomes:
employment, wages and inequality. Our results point to negative and small elasticities of employment
to increases in the minimum wage. The disincentives that increases in the minimum wage generate are
small but they are economically significant, especially in a period of protracted economic and productivity growth. Economic theory is used as a guide to interpret these results. The impact of increases in
the minimum wage depends on the structure of the market, but also on the relevance of the level and
increase in the minimum wage.
The recent experience of the Portuguese economy provides an interesting setting to study the consequences of large minimum wage increases. Indeed, this is a challenge to naïve results that extrapolate the
results from increases of the minimum wage in specific groups of workers to a more general conclusion
regarding the overall impact of minimum wage increases. In Portugal, lower-tail wage inequality fell
sharply since 2007. We see this as a direct positive impact on the wages of low-paid individuals and an
indirect (or spillover) negative effect on the wages of median wages, an effect that deserves attention
in future research. However, individuals paid the minimum wage experienced a decrease in employment
stability. The reduced probability of employment is a negative outcome, which may result from both falling
demand and contained supply. The latter effect can be seen as the interaction of the minimum wage
policy with the unemployment insurance system that grants minimum-wage earners an unemployment
benefit close to their previous wage. In this context, the potential positive impact of the minimum wage
increase on labor supply may be much more limited. The smaller probabilities of employment would
translate into a wider income distribution. However, inequality may be reduced by the unemployment
insurance system, even if at the cost of lower incentives to work.
These results highlight the need for a comprehensive policy, in which minimum wage increases take
into account the evolution of productivity gains. A set of policies that increases the cost of labor and
at the same time increases the protection of workers in unemployment is bounded to generate lower
employment and higher unemployment.
References
Abowd, J., Kramarz, F., Margolis, D. and Philippon, T. (2000) “The Tail of Two Countries: Minimum
Wages and Employment in France and the United States”, IZA Discussion Papers 203, Institute for
II
the Study of Labor (IZA).
University Press.
Autor, D., Manning, A. and Smith, C. (2010) “The Contribution of the Minimum Wage to U.S. Wage
Inequality over Three Decades: A Reassessment”, NBER Working Papers 16533.
Brown, C. (1999) “Minimum wages, employment, and the distribution of income”, in O. Ashenfelter
and D. Card (ed.), Handbook of Labor Economics, edition 1, volume 3, chapter 32: 2101-2163,
Elsevier.
Card, D. and Krueger, A. (1995) “Myth and Measurement: The New Economics of the Minimum Wage”,
Princeton University Press.
Cardoso, A. (1998) “Earnings Inequality in Portugal: High and Rising?”, Review of Income and Wealth,
Wiley Blackwell, vol. 44(3): 325-43, September.
Centeno, M., Machado, C. and Novo, Á. (2008) “The Anatomy of Employment Growth in Portuguese
Firms”, Banco de Portugal, Economic Bulletin – Summer: 69-95.
Centeno, M., and Novo, Á. (2009) “When Supply Meets Demand: Wage Inequality in Portugal”, IZA
Discussion Papers 4592, Institute for the Study of Labor (IZA).
Currie, J. and Fallick, B. (1996) “The Minimum Wage and the Employment of Youth Evidence from the
NLSY”, Journal of Human Resources, University of Wisconsin Press, vol. 31(2): 404-428.
DiNardo, J., Fortin, N. and Lemieux, T. (1996) “Labor Market Institutions and the Distribution of Wages,
1973-1992: A Semiparametric Approach”, Econometrica, vol. 64(5):1001-44, September.
Freeman, R. (1996), “The minimum wage as a redistributive tool”, Economic Journal, 106: 639-649.
Katz, L. (1986), “Efficiency wages theories: A partial evaluation”, NBER Macroeconomis Annual, NBER
and MIT Press.
Machin, S., Manning, A. and Rahman, L. (2003) “Where the Minimum Wage Bites Hard: The Introduction of the UK National Minimum Wage to a Low Wage Setor”, Journal of the European Economic
Association, 1: 154-80.
Neumark, D., Schweitzer, M. and Wascher, W. (2004) “Minimum Wage Effects throughout the Wage
Distribution”, Journal of Human Resources, University of Wisconsin Press, vol. 39(2): 425-450.
Neumark, D. and Wascher, W. (2008) “Minimum Wages”, MIT Press, Cambridge.
Pereira, S. (2003) “The impact of minimum wages on youth employment in Portugal”, European Economic Review, vol. 47(2): 229-244, April.
Portugal, P. and Cardoso, A. (2006) “Disentangling the Minimum Wage Puzzle: An Analysis of Worker
Accessions and Separations”, Journal of the European Economic Association, MIT Press, vol. 4(5):
988-1013
Stigler, G. (1946), “The Economics of Minimum Wage Legislation”, American Economic Review, 36,
358-365.
121
Articles
Angrist, J. and Pischke, J. (2009) “Mostly Harmless Econometrics: An Empiricist’s Companion”, Princeton
Download