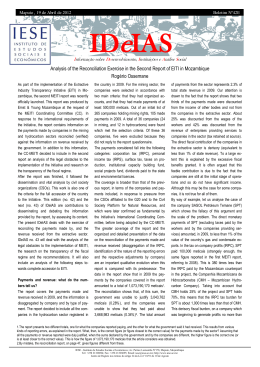
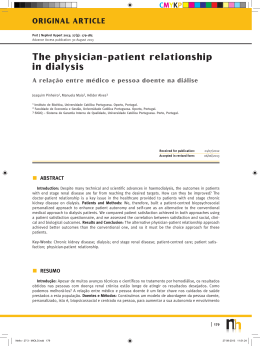
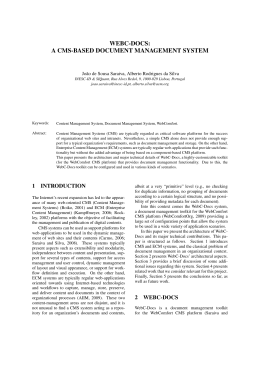
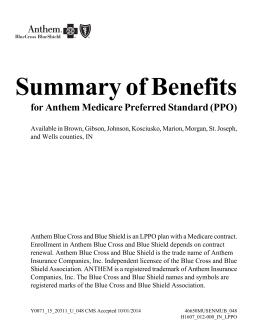
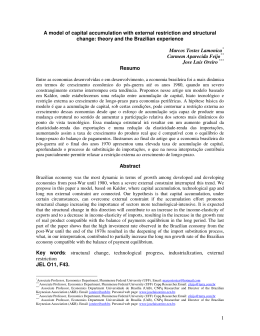
Pay for Performance:
Trends in US Health
Care
Maureen Lewis, PhD
CEO, Aceso Global
A Organização da Prestação de Serviços e
o Financiamento em Saúde
December 2, 2015, Rio de Janeiro, Brazil
Background and context of P4P
In the US, Pay
for
Performance
(P4P) evolved
from 1990s
managed care
capitation
arrangements
Capitation
payments
compensated
physicians for
treating a
defined patient
population
Capitation
controlled
costs but did
not adjust for
quality
New
generation of
P4P adjusting
and
experimenting
with new
approaches
22
Early trends suggested
low P4P returns
Average Performance in P4P and Control Hospitals 2004-08
Patient
experience
survey results
for AMI, heart
failure, and
pneumonia
Rachel M. Werner, Jonathan T. Kolstad, Elizabeth A. Stuart and Polsky. Effect Of Pay-For-Performance In Hospitals: Lessons For Quality
Improvement Health Affairs, 30, no.4 (2011):690-698
33
Early studies showed P4P challenges
• Medicare Premier Quality Incentive
showed no difference in mortality rates for
AMI, congestive heart failure, pneumonia,
and coronary artery bypass surgery from
2004 to 2009
• Massachusetts Medicaid hospital P4P had
no improvement in its early years
• Study of Massachusetts physician
organizations (POs) found improvement in
all POs, regardless of P4P participation
2001-03
44
New P4P methods adopted in both
the public and private sectors -- due
to rising costs and faltering quality
5
US Pay for Performance in 2015
Process
Measures
Assess activities that positively impact patient health
Outcome
Measures
Effects of specific care on patients
Structure
Measures
Incentives for technology adoption (EMR)
Patient
Experience
Patient perceptions of quality of care
Performance of steps that improve patient health
Collect and track patient status measures
Assesses features of delivery organizations and staff
66
Pay for Performance a central
component of the 2010 Affordable
Care Act (ACA) and its
implementation
7
Health price inflation and low
quality are driving interest in P4P
• Two Institute of Medicine studies
complement other research showing
unacceptable quality of care in the US
• Price inflation outstripping national inflation
by a large margin (2% vs. 10%)
• Affordable Care Act (meant to address
access, quality and cost containment
88
The ACA and public sector financing
• Medicare for the elderly - federal government
• Medicaid for the poor from federal/state funds
• Center for Medicare and Medicaid (CMS)
manages both programs - responsible for ACA
implementation
• States finance and design incentives
• Federal government and states finance over
50% of all health spending in the US
99
CMS P4P initiatives
• Affordable care organization (ACO) for
integrated care -- accountable for quality
and costs
• Value based purchasing rewards hospitals
by their performance on set of quality
measures and control of costs
• Incentive payments for physician reporting
quality data and for adopting electronic
medical records (EMR)
• Bonuses for Medicare Advantage Plans
(HMOs) for quality
10
10
P4P Programs in the Affordable
Care Act
• Medical groups for
integrated care and
held accountable for
quality and cost
• Bonus payments to
Medicare HMO
Advantage Plans
with high ratings
Accountable
Care
Organization
s
Value
based
purchasing
Medicare
advantage
plan bonus
Physician
quality
enhancement
• Quality measures
including adjusted
DRG payment
incentives to
reward and punish
• Financial
incentives to report
data
11
CMS payment arrangements
under ACA
Alternative
Payment
Models
Accountable Care Organizations
Medical Homes
Bundled Payments to include physicians and post-hospital care
Comprehensive Primary Care and promoting integrated care models
Payment
for Quality
and Value
Hospital Value Based Purchasing for quality and value
Physician Value Based Modifier for quality and value
Readmissions/Hospital Acquired Infections penalties
12
12
CMS Goals: moving to reward
quality and value
Explicit goals for Medicare payment:
• Alternative payment models
• 2016 - 30% of payments tied to quality or value
• 2018 - 50% of payments tied to quality or value
• DRG payments
• 2016 - 85% of payments tied to quality or value
• 2018 - 90% of payments tied to quality or value
• Physician payment modifier
• 2015 penalties begin
13
13
Accountable Care Organizations
Characteristics
• Pioneer ACOS were designed for
organizations with experience in
coordinated care and ACO-like contracts
• Are held accountable for quality, costs
and integration of care across providers
• 19 ACOs operating in 12 states
14
14
CMS hospital value based
purchasing
CMS P4P scoring for FY17
5%
25%
25%
25%
20%
Clinical Care
Process
Clinical Care
Outcomes
Safety (Infection
rates)
Patient
Experience
Efficiency &
Cost Reduction
Sample indicators
Flu immunization of patients
and health workers
Heart Failure 30-Day Mortality
Rate
Catheter Associated Urinary
Tract Infection
Communication with doctors
Medicare
Spending/Beneficiary
15
15
CMS: DRG payments at risk (%)
Readmissions reduction program
Hospital Value Based Purchasing (HVBP)
IQR/MU (Inpatient Quality Reporting)
Hospital Acquired Infections
Period 2014 (FY16)
Period 2016 (FY18)
2
1,75
3
2
2
1
2
1
16
16
CMS – Physician FFS Payments
and Value
Percentage of FFS payments
at risk for physicians
Physician Value
Based Modifier
Electronic Health
Record Use
Period 2014 (FY16)
Period 2016 (FY18)
2
2
4
Physician Quality
Reporting System
2
3
2
17
17
Preliminary impacts of CMS Pay for
Performance initiatives
18
Pioneer ACOs showed big improved
outcomes
• Quality outperformed published benchmarks in
15/15 clinical quality measures and 4/4 patient
experience measures in year 1 and 2
• Mean quality score increased from 71.8% to
85.2% from 2012 to 2013
• Average performance score improved in 28 of 33
quality measure – or 85%
• $384 million in program savings over two years
• Average savings per ACO increased from $2.7
million to $4.2 million
19
19
Positive Medicare
readmission trends
20
20
Declining per capita spending
growth
12%
*27.59%
11%
10%
9%
9,24%
8%
7,64%
7,16%
7%
6%
5,99%
5%
4,91%
4,63%
4,15%
4%
3%
2%
2,25%
1,98%
1,36%
1%
0%
2001
2002
2003
2004
2005
2006
2007
Medicare Per Capita Growth
2008
2009
2010
2011
1,13%
0,35%
2012
2013
Medical CPI Growth
21
21
Hospital acquired infection
percent reduction 2010-2013
Readmissions
Central Line-Associated Blood Stream
Infections
Ventilator Associated Pneumonia
7,3
Percentage reduction
• 17% fall in
hospital acquired
infections
• 50,000 lives
saved
• US$12 billion in
savings
12,3
62,4
22
22
P4P embraced by the private nonprofit sector -- over 40 groups
incentivizing quality and cost-based
assessments
23
Private and Non-Profit P4P
experiments
California and Massachusetts good examples
California Integrated
Healthcare
Association – nonprofit umbrella group for
payers founded 2001,
managing 8 private
health plans, 200
Physician Organizations
Massachusetts
Alternative Quality
Contract – non-profit
HMO initiative in 2009,
85% of primary care and
90% of specialist
network physicians
participate
24
24
California P4P – value based, cost
sharing
• Shared savings model which holds Physician Organizations
(POs) accountable for cost, cost trends, resources & quality
of care
• Initially funded by California Healthcare Foundation in 2001
Used to Build Quality Composite Score
Quality
Measures
Clinical Quality, Utilizing Information Technology,
Patient Experience
Appropriate Resource Use – Example: Inpatient
Cost
Measures utilization/readmissions
Total Cost of Care
25
25
California value based P4P
Determining PO
Eligibility for
Value based P4P
The PO’s
Quality
Composite
Score is either
at the 75th
percentile or
improved by
10%
The POs Total
Cost of Care
trend is below
Consumer
Price Index
(CPI) +3%
Calculating Shared
Savings
Calculate
shared
savings based
on Appropriate
Resources
Use (ARU)
measures
Calculate
shared
savings based
on Quality
Composite
Score
Sum shared
savings
across ARU
measures to
determine
incentive
amount
26
26
Massachusetts P4P – Alternative Quality
Contract
• Blue Cross, non profit quality and cost control
P4P - finances large physician groups, HMOs
• 700,000 patients
• Spending and clinical performance data shared
with providers – payer supports provider
planning and testing of alternative delivery
• Budgets based on historical provider spending
• Payer should participate in redesign and support
• Payers and providers share risk and rewards
27
27
Massachusetts Alternative Quality
Contract
Global
Budget
Defined annual budget for all physician groups.
All medical expenses covered for enrollees
Performance
Incentives based on quality measures;
performance determines share of profits
losses
Clinical
Support
or
Physician groups have dedicated team from
Blue Cross to generate performance data
share, best practices across groups and drive
innovation
28
28
AQC reduces average
spending/enrollee
Massachusetts
AQC costs fell
relative to costs
in eight
Northeastern US
states for
commercially
insured
enrollees
Song Z, Rose S et al. Changes in Health Care Spending and Quality 4 Years into Global Payment,
N Engl J Med 2014; 371:1704-1714 October 30, 2014
29
29
AQC improves outcomes, 20072012
AQC enrollees
had better
outcomes on 5
measures of the
Healthcare
effectiveness
data information
(HEDIS)
Song Z, Rose S et al. Changes in Health Care Spending and Quality 4 Years into Global Payment,
N Engl J Med 2014; 371:1704-1714 October 30, 2014
30
30
P4P shows promise but challenges
remain – an ongoing learning process
31
Challenges in P4P
• Public reporting of hospital performance
means non-P4P hospitals improve on their
own – competition and reputation matter
• ACOs built on best performers. What of
replication?
• Value Based Purchasing programs alter some
payments by 1% - insufficient incentive to
change behavior of many facilities/physicians
• P4Ps do not work for low income households
or where staff outreach capacity is limited
32
32
Critical Issues
• Data essential and continuous
• Stakeholders must influence design and
monitoring of P4P arrangements (AMA,
Kaiser Permanente)
• Cost a new factor - reporting costs high,
need technical & administrative skills
• P4P penalties may adversely impact care
for low income groups: for hospitals with
high readmissions and low scores losing
1% of funding could be catastrophic
33
33
Lessons
• Data essential and continuous
• Incentive design and measurement need
to align with objectives and be meaningful
measures
• Public reporting important
• Performance measures need to be
measurable, fair and consistent
• “Pay” needs to reflect groups not just
individuals
34
34
OBRIGADA!
35
35
Resources for P4P Measures
• The US Department of Health and Human Services’ (HHS)
Agency for Healthcare Research and Quality (AHRQ)
produces healthcare evidence.
• AHRQ site - http://www.qualitymeasures.ahrq.gov/index.aspx
publishes:
• Measures Inventory - Current, Past, and In Development
Quality measures
• National Quality Measures Clearinghouse – Center for
evidence based quality measure sets - clearinghouse smaller
than the measures inventory
36
36
P4P Process Measures
• Performance of steps that improve patient
health
• Well specified
• Easy, less costly than outcome measures
• Useful when sample sets are small
• Quality improvement easier to guide with
process measures
37
37
P4P Outcome Measures
• Collect data on patient health status
– Sample measures: mortality, blood pressure, lab
results
• Best in programs with large number of patients
• Less controversial when outcomes guide
investigation or how to change delivery
• Controversy - inferences from health status to
quality are difficult
38
38
P4P Structure Measures
• Assess features of delivery
organizations, capabilities of
professionals and staff
• Policy environment in which health
care is delivered
• Adoption and use of electronic
medical records (EMRs)
39
39
P4P Patient Experience
• Comparable data on patient perspectives
– allows comparisons between hospitals
• Publishing patient perceptions provides
incentives for hospitals to raise quality as
perceived by patients
• Involves patients in improving their health
status
40
40
Baixar