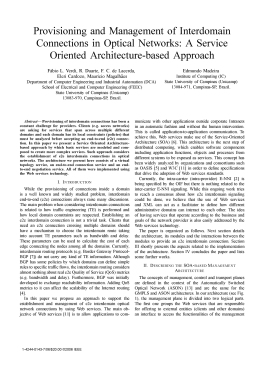
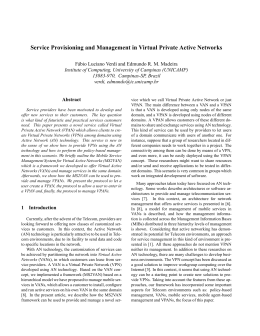
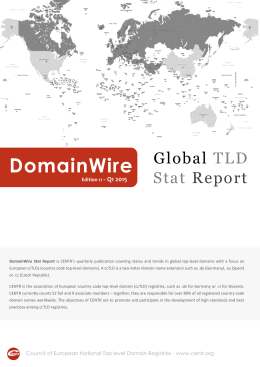
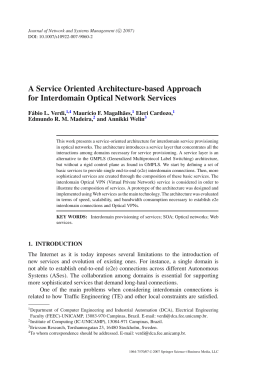
Domain Bias in Web Search
Samuel Ieong
Nina Mishra
Eldar Sadikov∗
Li Zhang
Microsoft Research
Microsoft Research
Stanford University
Microsoft Research
[email protected] [email protected]
[email protected]
[email protected]
ABSTRACT
1.
This paper uncovers a new phenomenon in web search that
we call domain bias — a user’s propensity to believe that
a page is more relevant just because it comes from a particular domain. We provide evidence of the existence of
domain bias in click activity as well as in human judgments
via a comprehensive collection of experiments. We begin
by studying the difference between domains that a search
engine surfaces and that users click. Surprisingly, we find
that despite changes in the overall distribution of surfaced
domains, there has not been a comparable shift in the distribution of clicked domains. Users seem to have learned the
landscape of the internet and their click behavior has thus
become more predictable over time. Next, we run a blind
domain test, akin to a Pepsi/Coke taste test, to determine
whether domains can shift a user’s opinion of which page
is more relevant. We find that domains can actually flip a
user’s preference about 25% of the time. Finally, we demonstrate the existence of systematic domain preferences, even
after factoring out confounding issues such as position bias
and relevance, two factors that have been used extensively in
past work to explain user behavior. The existence of domain
bias has numerous consequences including, for example, the
importance of discounting click activity from reputable domains.
Obtaining high quality labeled data is important for a
search engine since it can be used both for creating a better
ranking function, as well as assessing the quality of search
results. Human judgments are commonly used for both purposes. However, over time it has become evident that human judgments will not scale. Specifically, obtaining human
judgments for every country/language as well as specific verticals such as commerce and health will be challenging in
terms of cost and efficiency.
As a result, the click logs have been proposed as a substitute for human judgments. Clicks are a relatively free,
implicit source of user feedback. Finding the right way to
exploit clicks is crucial to designing an improved search engine.
However, clicks are fraught with biases. The most widely
studied bias is position bias [12, 13], a user’s propensity to
click on a search result just because it appears closer to the
top of a search results page. Much work has been invested
in both establishing the existence of position bias [8, 18],
as well as understanding how to remove position bias from
click activity [2, 3, 7]. Other biases are also known to exist,
for example, snippet attractiveness bias, a user’s propensity
to click on a result because the query terms appear in bold
in the title multiple times [23].
In this paper, we uncover a new phenomenon in click activity that we call domain bias—a user’s propensity to click
on a search result because it comes from a reputable domain,
as well as their disinclination to click on a result from a domain of unknown or distrustful reputation. The propensity
constitutes a bias as it cannot be explained by relevance or
positioning of search results.
Our goal is to provide incontrovertible proof of the existence of domain bias. We do so via a series of carefully
designed experiments. We ask if a search engine drastically
changes the surfaced domains, do domain clicks also change
accordingly? Amazingly, the answer turns out to be no. Instead, we find that users click on the same domains despite
changes in surfaced content. In a similar vein, if we take
two search engines of wildly different relevance, we ask if
domain clicks also swing wildly. Again, to our surprise, the
answer is no. We observe that the top domains garner a
larger and larger fraction of the clicks and it is not because
search engines are surfacing a smaller number of domains.
On the contrary, search engines are changing the domains
they show. It is users who have decided to visit a smaller
number of domains.
It should not be surprising that users have learned to
trust some domains over others. Indeed, past work such
as TrustRank measures user trust at a domain level [10]. A
recent eye-tracking study also confirms that users pay at-
Categories and Subject Descriptors
H.1 [Information Systems]: Models and Principles
General Terms
Experimentation, Human factors, Measurement
Keywords
domain bias, user behavior, web search
∗
The work is done while the author was at Microsoft Research.
Permission to make digital or hard copies of all or part of this work for
personal or classroom use is granted without fee provided that copies are
not made or distributed for profit or commercial advantage and that copies
bear this notice and the full citation on the first page. To copy otherwise, to
republish, to post on servers or to redistribute to lists, requires prior specific
permission and/or a fee.
WSDM’12, February 8–12, 2012, Seattle, Washington, USA.
Copyright 2012 ACM 978-1-4503-0747-5/12/02 ...$10.00.
INTRODUCTION
tention to the displayed URL1 . One could argue that search
engines already know this and exploit it by using the PageRank of a domain in their scoring functions so as to boost
documents from domains of high reputation.
What is surprising is that users click on results from reputable domains even when more relevant search results are
available. Our experiments are geared towards proving that
domains can so drastically influence perceived relevance that
users will favor some domains, regardless of content. Viewing content on the Internet as products, domains have emerged
as brands. And users have developed such fierce brand loyalty that their clicks are tainted by domains.
We establish the existence of domain bias via a Pepsi/Coke
style blind taste test. In our experiment, we request relevance feedback from different users where each is shown a
query and two search results in three scenarios: with the
snippet only (i.e., absent domain), with the snippet and
true URL, and with the snippet and swapped URL. We find
that in 25% of the cases, the behavior of users resembles
a blind following to domains. For example, for the query
{one of the most common types of heart disease}, there are
two snippets and two domains, one from webmd.com and
another from genetichealth.com. Absent domain, users
prefer the snippet from genetichealth. When domains are
revealed, users prefer the snippet of webmd. More interestingly, when we paired the genetichealth snippet with the
webmd URL, users flip their preference and go back to preferring the snippet from genetichealth (now paired with the
domain webmd). The experiment demonstrates that users
have become reliant on domains in assessing the relevance
of search results, and may in some cases blindly trust content
from reputable domains.
Next, we design an experiment to demonstrate a systematic bias towards certain domains that spans across search
queries. Designing an experiment to tease out the existence
of domain trust is a non-trivial task. One confounding factor is relevance—perhaps the reason why certain domains
attract the majority of clicks is that content from the domain appears to be more relevant to the user. Another confounding factor is position bias—perhaps the search engine
tends to rank some domains higher than others and that is
what leads to the observed domain preference. We design an
experiment that removes the relevance factor by focusing on
query, URL1, URL2 combinations that are labeled equally
relevant by a strong majority of a panel of human judges.
Further, the experiment removes position bias by only drawing inferences about domain A being preferred to domain B
when A is ranked below B and yet still A is clicked more
often. By accumulating these preferences, we find that we
can construct an ordering of domains that agrees well with
user preferences. Such an ordering with strong agreement
would have been impossible in the absence of domain trust,
thus confirming its presence.
The existence of domain trust has important consequences
for several areas of web search research. For example, it influences the design of user click models [3, 6, 7, 9], which
have focused on relevance and position of the search results
as the principal factors that influence user clicks. Domain
bias introduces a new factor that needs to be considered.
It also influences the large body of literature of learning
1
“Eye-tracking studies:
More than meets the eye”,
published at http://googleblog.blogspot.com/2009/02/
eye-tracking-studies-more-than-meets.html, 2009.
relevance from clicks. While many studies have considered
ways to remove position bias [2, 7, 11], we must now consider
how to remove domain bias. Domain bias also affects how
queries are categorized as navigational vs. informational. As
user visits concentrate on fewer domains, former informational queries may now appear navigational, and semantic
approaches may be needed to distinguish between the two
types.
The goal of this paper is to provide indisputable proof of
the existence of domain bias. We believe this is an important
phenomenon and we take careful steps in establishing that
it exists beyond reasonable doubt. We also take first steps
in quantifying the amount of bias as it can help with the
aforementioned applications. Nonetheless, our approach is
limited in scale due to the reliance of human labels. The
quantification of domain bias at web scale remains a deep
challenge and we leave it as a great question for future work.
2.
RELATED WORK
The bias of user clicks on search engines has been studied
before. Joachims et. al. found user clicks to be good signals
for implicit relevance judgments but observed via an eyetracking study that there is considerable position bias [12].
Later, Craswell et. al. carried out ranking perturbation experiments and proposed a cascade model: users scan results
from top to bottom and make click decisions based on relevance [6]. Similar to our study, Craswell et. al. found that
users did not blindly trust search engines. Unlike the study
by Craswell et. al., however, our findings are at the aggregate level of page domains and explain clicks beyond pure
relevance. In [23], the authors show that users are biased
towards “attractively” formatted snippets. Our experiments
are geared towards establishing a different bias, by pairing
snippets with swapped URLs.
User browsing models for search engine results, both organic and sponsored, have attracted considerable attention
in recent years [1, 3, 6, 9, 21, 22, 23]. These models aim
to estimate the click-through rate (CTR) of a result (i.e.,
the probability that a result is clicked), given the result’s
position and previous clicks in the user session. The CTR
is commonly modeled as the product of the examination
probability and the perceived relevance of the result (probability of a click given examination). The models vary in the
examination probability and perceived relevance functions,
but all agree that these functions depend only on the current state of the results (i.e., pages) and the current user’s
session clicks. On the other hand, our work shows that CTR
is not only influenced by relevance and examination but also
by domain preference.
It is well known that page quality is correlated with its
hosting domain. There is related work on domain trust in
the context of spam. For example, Gyöngyi et. al. proposed
TrustRank – PageRank like ranking of domains based on a
seed set of trusted reputable sites [10]. It is common practice for search engines to use domain as a feature in ranking.
For example, PageRank [17] can be applied to the hyperlink
structure on domains to obtain domain rank scores. Alternatively, domains that garner many clicks may be boosted
higher in the ranking. Our work shows that if clicks are used
to boost pages in the ranking, that domain bias must first
be discounted.
A related line of research is on the bias of search engines on
page popularity. Cho and Roy observed that search engines
penalized newly created pages by giving higher ranking to
the current popular pages [4]. A number of solutions were
proposed including using the change in popularity as a signal
of page quality [5] and partial randomization of ranking [19].
Although this line of work is related to ours in that we look
at the influence of search engines on users, our focus is different: we aim to understand and model user’s long-term
preference for specific domains.
There are a number of macro-level user behavior studies that we will present in Section 3. For example, [20, 14,
15] analyze user traffic from search engines to individual
sites and characterize search and browsing behavior. Unlike
previous studies that characterize search behavior at a particular time point, our work emphasizes longitudinal search
behavior. Mei and Church [15] conducted a related study
where they showed that the visited web at a particular point
in time has low entropy. Our work is different in that we
look at the visited web over time. We similarly confirm that
user visits are predictable, but we also point out that user
visits are slow to change. Users are consistent about the
domains they visit and are less influenced by changes in the
displayed results.
3.
SEARCH ENGINE INFLUENCE
We set out to study user domain bias by examining user
behavior from search engines at the aggregate level. Our
goal is to check whether users simply follow search engines
and click on the top returned results without giving them
much scrutiny. So we start by comparing the changes in the
top displayed results to the changes in the clicked results.
Intuitively, if users have little preference for domains, we
expect the changes in the displayed results to trigger equivalent changes in the clicked results. Surprisingly, however,
in spite of the changes in the displayed results we find that
clicks tend to be rather stable with respect to domains.
Our experiments also reveal that search results concentrate over time on fewer domains with increasingly larger
share of results pointing to the top domains. This trend
is accompanied by an increase in click-through rates (even
after factoring out query distribution changes) and is in contrast to the growing size of the web content and the number
of registered domains.
Although the evidence we present in this section alone
does not definitively prove the existence of domain bias (we
provide more rigorous experiments in the subsequent sections), the results are likely to be potential consequences
of the phenomenon. By pointing out the potential consequences up front, we motivate careful examination of domain
bias in web search.
URLs
en.wikipedia.org/bp_oil_spill
200
en.wikipedia.org/eigenvector
100
facebook.com/jenn-ibe
20
facebook.com/privacy
30
facebook.com/advertising
50
Host
2009
2010
en.wikipedia.org
300
300
facebook.com
100
400
1*2(345,
-.60
!"#$%&'()'*+',####-./0
-.77
Figure 1: Methodology.
domains. Although technically we aggregate at the level
of hosts, we use the term “domains” throughout the paper.
Consider Figure 1. This is a sample of URLs clicked by
search engine users with the total number of clicks each
URL received, irrespective of queries. We aggregate clicks
on pages from the same host to obtain a distribution of clicks
over the host names. We look at hosts and not the individual
pages because studying visits with respect to pages over a
long time period becomes impractical: after one year nearly
60% of the pages are replaced by new ones [16]. More importantly, aggregating visits over hosts makes sense because
hosts roughly correspond to individual publishers on the
web, e.g., each sub-domain of wordpress.com corresponds
to an individual blog. We also performed experiments on
top level domains and obtained similar results to the ones
presented here.
Data. Our findings are based on data derived from search
logs. We study user visit patterns over a seven-day period at
two different time points: July 2009 and July 2010. Looking
at the same period in 2009 and 2010 minimizes the temporal
bias. To remove variance due to geographic and linguistic
differences in search behavior, we only consider queries issued in the English speaking United States locale.
Method. We use Shannon entropy to measure the display
and visit distribution of domains. Compared to other measures such as power-law exponent, Shannon entropy has an
intuitive meaning: it is the average number of bits required
to encode the destination domain of each visit. Increasing
entropy is a sign of user visits becoming more diverse, while
decreasing entropy is a sign of user visits becoming more predictable and suggests the formation of domain preferences.
We use KL(Kullback-Leibler) divergence to measure the
difference between two distributions.
P Recall that KL diverfor two
gence is defined as DKL (p||q) = d∈D p(d) log p(d)
q(d)
distributions p = {p(d)} and q = {q(d)}. KL divergence
measures the average number of extra bits required to encode the distribution of p using the optimal encoding of q.
Together with Shannon entropy, it provides an intuition of
the magnitude of distribution changes. One problem with
the use of KL divergence is that it is undefined when there
is a domain d such that p(d) > 0 and q(d) = 0. To address
this issue, we employ the standard add-one smoothing: before computing the distribution, we add one to the count of
each domain.
3.1
2
Why Domains? We study user visit patterns in terms of
the aggregate distribution of page views over their hosting
Displayed vs. Clicked Results
We compare the search displays and user visits from the
same search engine in two time periods: July 2009 and July
2010. We refer to these data sets as 2009 and 2010 data,
respectively. We only consider the top 5 results returned by
the search engine for each query. By focusing on the top
results, we aim to reduce the influence of examination bias:
users scan results from the top to bottom, so the top results
are more likely to be examined [12]. We also analyzed the
top 1 result and top 10 result distributions and found similar
insights to the ones we present here.
Table 1 shows the ten most frequently displayed domains
in 2009. We show the display and visit shares2 point-wise for
each domain in 2009 and 2010. Observe the drastic change
The display (visit) share of a domain is the number of times
the domain is displayed (visited) over the total number of
displays (visits).
#
#
#
#!
#!!
#!!!
#
!"#
!"#
!"!#
!"!#
!"!!#
#!
#!!
#!!!
!"!!#
$!#!
$!#!
!"!!!#
!"!!!#
$!!%
!"!!!!#
$!!%
!"!!!!#
(a) Display Distribution Changes
(b) Click Distribution Changes
Figure 2: Display and click distributions point-wise for 2009 and 2010. Both (a) and (b) plots are on log-log
scale. The points are connected in a line for better exhibition of the distribution differences.
Domains
en.wikipedia.org
www.facebook.com
www.youtube.com
www.google.com
groups.google.com
checkout.google.com
mail.yahoo.com
www.yahoo.com
www.imdb.com
blog.facebook.com
2009
display
0.0750
0.0119
0.0098
0.0085
0.0053
0.0043
0.0044
0.0044
0.0042
0.0042
2010
display
0.0923
0.0251
0.0104
0.0087
0.0002
0.0000
0.0030
0.0034
0.0035
0.0001
2009
visit
0.0274
0.0233
0.0177
0.0276
0.0001
0.0000
0.0067
0.0137
0.0038
0.0000
2010
visit
0.0279
0.0497
0.0197
0.0236
0.0001
0.0000
0.0069
0.0110
0.0036
0.0000
binning of domains as for 2009. As a result, the curve need
not be monotonic. This presentation allows one to visually
observe the difference between the two distributions. From
Figure 2(a) and (b), we can see that the displayed results
have undergone a larger change compared to the visits. This
effect is especially prominent in the head of the distributions.
Furthermore, the discrepancy between the changes in the
displays and the visits are prominent even when looking at
the distributions for the top result only.
3.2
Nature of the Displayed Result Changes
We next look at the nature of the changes in the surfaced
results between 2009 and 2010 (by the same search engine).
Table 1: Display and visit share for a sample of domains in 2009 and 2010. The ten domains are the
most displayed domains in 2009.
80%
70%
2009 entropy
2010 entropy
KL divergence
displays
15.24
14.24
1.33
visits
15.07
14.72
0.76
60%
Percentage
in the display shares in contrast to the more modest change
in the visit shares. The entropy, as well as the KL divergence, of the distribution of displayed and visited domains
are shown in Table 2.
50%
40%
2009
30%
2010
20%
10%
0%
top 30 domain display share
Table 2: Summary of the changes to the distribution
of displayed and visited domains from 2009 to 2010.
From Table 2, we can see that while the distribution of
displayed domains undergoes significant changes, there is no
comparable shift in the distribution of visited domains. To
provide a visual illustration of the scale of changes behind
the numbers, we plot in Figure 2 (a) and (b) the distributions
from the two time periods point-to-point for displayed and
visited domains, respectively. In both figures, we use 2009
data as the baseline, sorting all domains in decreasing order
of their frequencies in 2009. We then bin every 10 domains
and plot the cumulative frequency for each bin as the dark
curve. Since we order by the frequencies in 2009, the dark
curve monotonically decreases. With the light curve, we plot
the corresponding frequency for 2010 data, keeping the same
top 1000 domain display share
Figure 3: Cumulative share of displays attributed to
the 30 and 1000 most popular domains in 2009 and
2010, respectively.
Figure 3 shows the cumulative share of search displays attributed to the 30 most popular domains in the time periods
of July 2009 and July 2010. As seen from the graph, 2010
share of search results pointing to the top 30 domains increases from 25% to 38% and to the top 1000 domains from
61% to 74%. Note that the increase is not limited to particular few domains, e.g., facebook.com, but rather applies
to a large set of domains beyond the topmost few. Further,
the observed trend cannot be explained by the increasing
share of navigational queries, as the increase in the share
of search results pointing to the top 1000 domains persists
after re-normalizing for the query distribution changes.
The shift of the search results towards popular domains
is also demonstrated by the entropy of the distribution of
search displays over domains in Table 2. There is a 1-bit
drop in the entropy, which is quite drastic when viewed in
the context of the vast growth of the web. While there is an
increasing volume of content on the web and an increasing
number of sites, search engine results tend to concentrate on
increasingly fewer domains!
Both the increasing share of search displays attributed to
the top domains and the drop in the overall entropy indicate that the search engines show increasingly less diverse
domains. The logical question is whether this trend aligns
with the user preferences. It turns out that the answer is yes:
for the particular search engine we study, the click-through
rate in 2010 compared to 2009 has increased dramatically;
so does the click-through rate on the top position of search
results. The trend can be verified even after re-normalizing
for the query distribution changes, which may suggest (although not definitively yet) that increasing number of users
develop preference for specific domains that cannot be explained by the increasing share of navigational queries alone.
3.3
Clicks of Different Search Engines
Our analysis has so far focused on a particular search engine. Next, we compare the distribution of clicks from two
different search engines side by side observed in the same
time period in July 2010. Search engine A is a major search
engine with a large market share, while search engine B is a
niche search engine with a tiny market share. Given differences in the two search engines’ target audiences, we hypothesize a large difference in their displayed results (we verified
this hypothesis with a limited sample of queries). If users
have an intrinsic preference for specific domains, their clicks
should be similar independently of the search engine they
use and the results surfaced.
Indeed, comparing the two search engines’ distributions
of the visited domains, we find them to be fairly close. The
KL divergence between the click distributions of the two
search engines is only 0.92 bits. This number is quite low
considering that the entropy of the click distributions for
the two search engines are 16.72 and 14.7 bits, respectively
for search engine A and B. Although the two search engines
are likely to be using different ranking functions and, hence,
displaying different results for the same queries, the click
distributions are quite similar.
To put the KL divergence value of 0.92 bits in perspective,
contrast it against the KL divergence numbers in Table 2.
The displayed results of the same search engine from two
different time periods already differ by 1.33 bits, we expect
the displayed results of two different search engines to diverge even more. Nonetheless, the 0.92 bits is only slightly
higher than the 0.76 bits of divergence in that table.
To summarize, our experiments suggest that users do not
blindly visit results surfaced by search engines, instead they
show preference for the domains they visit. The concentration of search results on fewer domains is accompanied by
an increase in click-through rates. Such a trend may suggest that users have intrinsic preferences for certain domains.
However, to understand whether this preference constitutes
a bias, we need to conduct more careful experiments since
domains are likely to be correlated with relevance. In what
follows, we will address this concern, and find out to what
extent domains can influence perceived relevance of search
results, and verify that even after removing confounding factors such as relevance and position bias, there still remains
a systematic domain bias.
4.
PEPSI/COKE TEST FOR DOMAINS
We are interested in determining if URL influences perceived relevance. We answer this question via an experiment similar in spirit to the Pepsi/Coke taste test. In our
experiment, the products under question correspond to the
snippets3 shown to the user. In the taste test analogy, we
are interested in whether simply labeling a product “Pepsi”
or “Coke” can make a product taste better.
We measure a user’s preference under three different conditions: (1) only the snippets are shown, i.e., URLs are hidden, (2) the snippet and true URLs are shown and (3) the
snippet and swapped URLs are shown. The first test is a
blind taste test that establishes the baseline. An example is
given in Figure 4. The second gives the true labels and the
third labels “Coke” as “Pepsi” and vice versa. An example
of the second and third experimental conditions is given in
Figure 5.
In our experiments, we present these three modes to different human judges and ask them to choose the result with
higher relevance. This step is done by creating human intelligence tasks (HITs) on the Amazon Mechanical Turk platform. We describe the details next.
4.1
Setup
We obtain human judgments of the relevance of about 30
URLs each for 14K queries sampled from the search log of
a commercial search engine. We select queries for which
at least two URLs from different domains are judged to be
equally and highly relevant to the query. This selection step
effectively removes navigational queries for which domains
are unlikely to introduce a bias to the perceived relevance
of the URLs. Next, we sort the domains by popularity as
measured by the frequency with which they appear in the
judged URLs. We keep hquery, URL1, URL2i tuples for
which URL1 belongs to one of the top 50 most popular
domains while URL2 belongs to a domain outside of the
top 200 most popular domains. This helps to selects tuples for which both URLs are considered equally relevant by
a human expert, but one URL belongs to a highly recognizable domain while the other belongs to a more obscure
domain. Finally, we sample 1K instances from the tuples
for which we have successfully obtained snippets for both
URLs. The snippets are obtained from a major commercial
search engine and anonymized algorithmically based on a
set of handcrafted rules so that the content of snippet does
not reveal the domain it comes from. This is important as
we subsequently paired each snippet with both URLs, and
anonymization is needed to avoid creating confusion to the
users when a snippet is paired with a different URL.
Using this dataset, we generate HITs to verify the existence of domain bias. Each HIT requires the worker to decide whether one snippet or the other is more relevant to the
query. To reduce the effect of presentation bias, we present
the two snippets side-by-side, and randomly flip the ordering
of the snippets. To mimic the conditions of a search engine,
3
A snippet is the short summary of a page presented to the
user by the search engine. It does not include the URL in
our definition.
Figure 4: The design of the HIT for Mechanical Turks under the first condition—hidden URLs.
Figure 5: The second and third experimental conditions—pairing URLs with snippets. The pairing above
corresponds to the correct labeling of the snippet with the URL. The one below swaps the two URLs.
we format the snippets and the URLs in exactly the same
manner as a search engine would, together with in-context
highlighting. The worker is given four choices: “the left
snippet is more relevant”, “they are equally relevant”, “the
right snippet is more relevant”, and “I don’t understand the
query”. For each instance hquery, URL1, URL2i, we generated three different types of tasks corresponding to different
experimental conditions, as discussed before. An illustration
of the HIT interface is given in Figure 4.
To root out workers who may randomly select answers, we
introduce and scatter honeypots into the tasks, and exclude
in our results the judgments provided by any workers who
have failed the honeypot tests (which is about 10% in the
received results). Each instance for each of the experimental conditions is repeated six times, three each for the two
different ordering of the snippets.
4.2
Results
For each pair of results (R1 , R2 ) presented to the worker i,
we assign a rating q (i) (R1 : R2 ) ∈ {1, 0, −1} to R1 according
to the worker’s response. The rating indicates whether the
worker thinks R1 is more (1), equally (0), or less (−1) relevant than R2 for the given query. Averaging over the ratings
from the six trials for each of the experimental conditions,
we obtain an overall rating q(R1 : R2 ) ∈ [−1, 1] for each
pair of results, with the sign of q indicating the preferences
of the workers. We also compute the standard deviation of
the ratings and use it to compute confidence intervals of the
ratings.
We write a result R as sd if it consists of the snippet s
and the URL with domain d, or s if the URL is not shown
to the worker. By the three types of tasks we designed, for
each pair (R1 = s1 d1 , R2 = s2 d2 ), we obtain three ratings
q0 = q(s1 : s2 ), q1 = q(s1 d1 : s2 d2 ), and q2 = q(s1 d2 : s2 d1 ).
We will use q0 as the baseline and q1 , q2 to verify to what
extent URL influences preference.
If there is no domain bias, then the sign of q1 and q2
should be the same as that of q0 ’s, indicating that the user
has the same preference regardless of whether the URL is
presented. On the other hand, if q1 > 0 but q2 < 0, it
means that users prefer both s1 d1 to s2 d2 and s2 d1 to s1 d2 .
This indicates that the user follows the domain d1 in his
preference. Similarly q1 < 0 and q2 > 0 indicates that d2 is
preferred.
Consider the example presented in Figures 4 and 5. When
the URLs are not presented, users prefer the right snippet. However, when the URLs are presented correctly, they
change their preference to the left snippet. When the URLs
are swapped, their preference flips once again to the right
snippet. In both the second and third conditions, their preference follows webmd. This provides strong evidence that
www.webmd.com is preferred to www.genetichealth.com.
100%
90%
domain biased
percentage
70%
cumulative %
80%
inconsistent rating
60%
50%
snippet dominant
40%
30%
20%
10%
0%
0
0.1
0.2
0.3
0.4
0.5
0.6
We use this intuition to consider how user preferences are
influenced by domains. To do so, we focus on only the ratings for which the workers are “confidently” positive or negative, i.e., we consider only the ratings whose 70% confidence
interval is entirely positive or entirely negative. For each
pair, according to the sign of q0 , q1 , q2 , we distinguish three
cases
• Snippet dominant. q0 , q1 , q2 all have the same sign.
In this case, user preferences follow the snippet.
• Domain biased. q1 and q2 have opposite sign. In
this case, user preferences follow the domain.
• Inconsistent ratings. q1 and q2 have the same sign
but opposite to q0 ’s. This is an inconsistent outcome
that cannot be explained by either the snippet or the
domain. Such inconsistency is likely due to randomness in human judgments.
Figure 6 shows the distribution of the three cases for different minimum values of |q0 | (non-inclusive). For example,
the distribution of cases for the case of |q0 | = 0.1 includes
all cases for which |q0 | > 0.1. As we can see from the graph,
a majority of the cases are dominated by the snippet. This
is as expected as the snippet contains rich contextual information to help users determine its relevance. However, we
see that in a substantial fraction (about 25%) of the cases,
user preferences are driven by domains. More importantly,
domain bias persists for different values of |q0 |. That is,
for 25% of cases users follow the URL even when there is a
large difference between the perceived relevance of snippets
in the absence of URLs! On the other hand, the fraction of
inconsistent cases diminishes to 0% as the baseline preferences |q0 | increases, providing evidence that the inconsistent
cases are due to randomness in human judgments and they
happen only when the users do not have strong preferences
between the two snippets by themselves.
A reasonable question is whether users react differently
to the three different modes. For example, if the snippet itself contains some domain information, when presented with
swapped URLs, the user might get confused by the combination and provide inconsistent feedback. Our results suggest
q0
q1
q2
0
0.7
0.2
0.4
0.6
0.8
1
average rating
threshold for |q0|
Figure 6: Distribution of three preference patterns
with different minimum value of |q0 |.
100%
90%
80%
70%
60%
50%
40%
30%
20%
10%
0%
Figure 7: Cumulative distribution of user ratings.
that users are not confused. Consider the distribution of
ratings for the three different types of tasks. Figure 7 shows
the cumulative distribution of the absolute value of the ratings4 . First, we note that even though the content of the
URLs are judged by human experts to be equally relevant
to the query, the workers do not rate the snippets to be
equally relevant. Further, comparing the distribution of q0
and q1 (and likewise q0 and q2 ), we observe a 10% difference
in distribution in the ratings region of (0, 0.1). This difference suggests that users are more inclined to prefer one URL
to another when they learn of the URL and its domain. Second, comparing the distribution of q1 and q2 , we notice that
the distribution is almost identical as the two lines overlap
one another. This suggests that the pairing of the snippets
with both the correct URL and the opposite URL does not
introduce systematic bias in the ratings, and alleviates the
concern of whether pairing a snippet with an incorrect URL
will confuse users.
In summary, the results from the experiments on Amazon
Mechanical Turk platform show that while the perceived
relevance of a URL is primarily determined by the snippet,
which we view as an approximation of the relevance of its
content, the exact URL contributes substantively to its perceived relevance. We believe the URL influences perceived
relevance through its domain. We verify this in the following
section.
5.
SYSTEMATIC DOMAIN BIAS
Our previous experiment has demonstrated that the perceived relevance of search results can be swayed by domains.
But could this phenomenon be query specific, hence hard to
predict for each particular query? In this section, we design
experiments to show that domain bias is actually consistent
across different queries. Further, based on our experimental
data, there exists an ordering of the domains that is highly
consistent with the outcome of “head-to-head preference” between two domains as exhibited by users.
4
Since q(R1 ; R2 ) = −q(R2 ; R1 ), the distribution is symmetric, and it suffices to show the distribution of the absolute
value.
5.1
Methodology
Designing an experiment to single out the influence of domain turns out to be challenging, as we need to carefully
factor out relevance and position bias, two well studied factors that may influence user click behavior [3, 6, 7].
Our strategy is to first identify pairs of webpages in which
one is clearly preferred to the other by the users after relevance and position bias is controlled for. We then verify that
user preferences are strongly correlated with the domains of
the pages and they exhibit a consistent bias across queries.
Our experiment consists of three steps.
First, we identify pairs of URLs p1 and p2 that are deemed
to be equally relevant to a query q, denoted by p1 ∼q p2 .
The relevance of the URLs for the query are determined by
human judges.
Next, we identify user preferences between two URLs that
cannot be explained by position bias. For each pair of equally
relevant URLs, we examine the search logs for instances
where both appeared in the search results. We then count
the number of times p1 preceding p2 and vice versa. We
also count the number of clicks both URLs received. We say
that p1 is preferred to p2 under q, p1 →q p2 , if p1 receives
more clicks and p2 appears before p1 more often than p1
before p2 . The latter requirement is there to ensure that the
preference is not explicable by position bias.
Finally, we aggregate these preferences at the domain level
and determine if the users exhibit a systematic bias based
on hypothesis testing. This is a complex step that involves
a number of sub-steps. First, we construct a domain preference graph based on user preferences from the last step.
The domain preference graph, G = hV, Ei, is a unweighted
directed multi-graph. The nodes V in the graph represent
domains. For each preference p1 →q p2 we add a directed
edge from the domain of p1 to the domain of p2 (we ignore
the pair if p1 , p2 are from the same domain). The graph can
be viewed as a summary of the preference the users exhibit
over the domain.
We show an example taken from a domain preference
graph constructed in our experiments in Figure 8. The data
behind this graph is discussed further in the next section.
The nodes in this sub-graph are domains related to exchange
rates. For presentation, we drew only a single edge between
each pair of domains (u, v). The two numbers on the edge,
x/y, represent the number of the edges that go with the indicated direction (x) and those that go backwards (y). Recall
that this graph is actually an unweighted multi-graph.
An important statistic that we compute over the domain
preference graph G is the maximum agreement rate, A(G).
Given a linear order L over the nodes V , (v1 > v2 > · · · >
vn ), we say that an edge e = (vi , vj ) agrees with the order,
L ⇒ e, if vi > vj according to L. The agreement rate
between graph G and order L, A(G, L), is defined as the
fraction of edges E in G that agrees with L, i.e., |{e | L ⇒
e}|/|E|. The maximum agreement rate, A(G), is defined as
the agreement rate achieved by the best linear order, A(G) =
maxL A(G, L). As an example, consider the sub-graph in
Figure 8. The best linear order over the nodes is (xe.com >
oanda.com > x-rates.com > finance.yahoo.com). Under
this order, A(G, L) = (32 + 23 + 48 + 21 + 51 + 8)/(32 + 13 +
23 + 4 + 48 + 5 + 21 + 6 + 51 + 3 + 8 + 3) ≈ 0.84, the ratio
between the number of forward edges and the total number
of edges.
But does the value 0.84 confirm the existence of a system-
xe.com
x−rates.com
23/4
48/5
8/3
32/13
21/6
oanda.com
51/3
finance.yahoo.com
queries
foreign currency converter
currency exchange rates
foreign exchange rates
foreign money converter
euro currency converter
currency rates
currency converter
conversion dollars
convert to us dollars
convert currency
world currency rates
Figure 8: A sub-graph of the domain preference
graph. In the left figure, each node corresponds
to a domain, and each (super)edge represents the
set of multi-edges between the two nodes. The two
numbers on each super-edge represent the number
of forward and backward multi-edges with respect
to the direction of the arrow. For example, there
are 32 multi-edges from xe.com to oanda.com and 13
multi-edges from oanda.com to xe.com. On the right
is the list of top 10 queries that contribute to the
multi-edges of the graph.
atic bias? To answer, we use statistical hypothesis testing.
Our null hypothesis, H0 , is that there is no systematic bias.
If so, the observed preference relationship would have been
arisen from a random process, and that for each preference
p1 →q p2 , we would have equally likely observe p2 →q p1 ,
since the preference is random. Hence, our statistical experiment consists of the following. For each preference relationship, we flip a fair coin to decide whether p1 is preferred
to p2 or vice versa. We then construct the corresponding
domain preference graph G0 , and compute A(G0 ). If the observed value of A(G) is significantly larger than the mean
value of A(G0 ), we reject H0 , thus confirming the existence
of domain preference. Note that one cannot simply confirm
the existence of domain preference by the maximum agreement rate alone. This is because for very sparse graphs, A(·)
will be close to one regardless of the direction of the edges.
Hence, it is important to consider the statistical hypothesis
testing explained above.
There are practical reasons we choose to test according
to A(G). If we are to assign a number to each domain as
a measure for the domain preference, it necessarily imposes
a linear order on the domains. By definition, A(G) is the
maximum agreement of any linear order with the preference
graph. Therefore, it represents the best we can achieve if we
are to preserve the preference order faithfully.
To close this section, we note that computing A(G) exactly is equivalent to solving the minimum feedback-arc set,
an NP-hard problem. In our experiments, we use a local
search algorithm that starts from an arbitrary linear order
and swaps two vertices until no improvement can be made.
This is repeated many times and the best linear order is selected. While there is no direct performance guarantee on
the algorithm, we found that it works well as it typically
finds solution with maximum agreement rate close to an
upper-bound estimated by summing over all pairs of nodes
vi and vj the larger of the size of the two sets of edges
|(vi , vj )| and |(vj , vi )|. The value is a valid upper bound
# of vertices
# of edges
G0
60
33
Gq
287
308
Gp
282
575
Gq,p
1020
7519
Table 3: The size of preference graphs.
A(·)
A(·) under H0
Gq
0.90
0.83 ± 0.008
Gp
0.85
0.71 ± 0.007
Gq,p
0.76
0.60 ± 0.005
Table 4: The maximum agreement rate A(·) on graph
Gq , Gp , Gq,p and under the null hypothesis that randomly flips the direction of the preference, with its
0.99 confidence interval.
since no linear order can agree with both (vi , vj ) and (vj , vi )
simultaneously.
5.2
Results
To instantiate the framework, for step 1, we obtain human judgment for about 2K queries (mostly informational
queries) and 770K pairs of URLs, each judged by a panel of
11 judges. We keep only those pairs for which at least 8 out
of 11 judges deemed the two URLs to be equally relevant
to the query, resulting in about 130K pairs. For step 2, we
examine 6 months of search logs from July 2010 to December 2010 and keep the preference relationship in cases where
there are at least 5 clicks in total for both results. We then
construct the domain preference graph G0 . Unfortunately,
due to index churn between the time when the URLs are
judged and the collection of the log data, we found very
few pairs of the judged URLs appearing together in the log,
and the number of directed edges is further reduced due to
the stringent requirement in step 2 that corrects for position bias, giving rise to a very sparse graph. The graph
is unsuitable for the hypothesis testing framework as most
random instantiation of it will be perfectly consistent with
some linear ordering of the domains.
To remedy this situation, we relax the definition of equivalent pairs in the first step. We consider three approaches
for each pair p1 ∼q p2 . Under query relaxation, we include
a pair p1 ∼q0 p2 if q 0 is a super-string of q. Under page relaxation, we include a pair p01 ∼q p02 if pages p01 and p02 are
from the same domain as p1 and p2 respectively. Under the
query-page relaxation, we allow both query and page relaxations. The domain preference graphs based on these three
relaxations are denoted Gq , Gp , and Gq,p respectively. We
summarize the statistics of all four graphs in Table 3.
While it is possible that the relaxation we performed may
introduce noise in the results, by requiring that both p1 and
p2 have surfaced in response to a query, and that the user
clicks on at least one of the results, the drift in query intent
is limited. Hence the relevance judgments still apply to the
expanded set of results. This is demonstrated by the set of
queries related to exchange and currency that appeared in
Figure 8. For example, even though “microsoft exchange”
is a super-string of “exchange”, it was not included because
the domains surfaced do not match the exchange currency
domains in the human judgment data set. To further ensure
the safety of this relaxation step, we also manually check a
random sample of the data and find that the relaxation does
indeed produce coherent sets of queries and results.
The values of A(·) for preference graphs Gq , Gp , and Gq,p
are shown in Table 4, along with the sample mean and confidence interval at p = 0.99 under the null hypothesis H0 . For
all three graphs, the value A(·) for the actual graph lies outside the confidence interval of the null hypothesis, hence we
can reject the null hypothesis and confirm that users do indeed exhibit a systematic and consistent bias over domains.
6.
DISCUSSION AND FUTURE WORK
The phenomenon that Internet users favor certain domains over others in their visits is not a new discovery. Indeed, past work has recognized the importance of domains
in web search [10]. One explanation of why this happens is
that documents belonging to a domain are typically written
by the same author, as in the case of a blog, or are subject to the same quality control, as in the case of a wiki
or a news organization, and therefore good documents are
often clustered at the domain level. Our experiment in Section 3 confirms that users indeed have discovered the good
domains, and their visits are increasingly concentrated on
these domains.
The new phenomenon discovered in this paper is that user
preferences of certain domains to others is beyond what can
be explained due to relevance, and creates a bias similar in
spirit to position bias [11] and snippet bias [23]. The bias
manifests itself as leading a user to perceive the same document as being more relevant when it is attached to a more
reputable domain than a less reputable one. Its existence
is established beyond reasonable doubt through a series of
carefully controlled experiments in Sections 4 and 5.
Why is domain bias an important concept and how does it
influence search today? First, it has important consequences
for click prediction, a central problem for both web search
and sponsored search. Many click models have been proposed in the web literature over the past few years [3, 6, 7, 9].
While these models differ in how they capture user behavior, a common theme is that they focus on three factors that
influence how users click—the user queries, the positions of
the results, and the relevance of the results. The existence
of domain bias implies that the precision of these models
can be improved, and the design of click models should be
revisited in light of the findings in this paper.
Second, domain bias has important consequences on learning relevance from clicks, the dual problem to click prediction. The web community has long recognized the importance of clicks as a source of signal for learning relevance,
and there are many studies on how to learn relevance in the
presence of position bias [2, 7, 11]. As domain bias becomes
stronger, we need new learning algorithms that can account
for domain bias. This is a challenging problem as domain
bias exists partly due to difference in relevance across different domains, and therefore it cannot be easily teased out as
a component separate from relevance. Further, users may
exhibit different bias depending on the class of queries. For
example, while users may strongly prefer wikipedia.org for
queries about world geography, users may prefer amazon.com
for queries about digital cameras. Whether we should consider bias at a query level or at a category level (and if so,
which degree of categorization) will influence the success of
the learning algorithm.
Finally, domain bias also affects existing approaches for
classifying queries into navigational vs. informational ones.
One common approach for determining whether a query is
navigational is based on the entropy of its clicks. As domain
bias becomes stronger, user visits are concentrated on fewer
domains, even for informational queries. Algorithms for distinguishing between informational and navigational queries
may have to be revisited in the presence of domain bias.
In view of the important consequences of domain bias, how
does one go about measuring this bias? This is a fundamental and challenging question to which we only have a partial
answer. The main obstacle to successfully measuring domain
bias is the need to control for other factors that may lead a
user to prefer one domain to another, chief among which is
relevance, although other forms of confounding bias such as
position bias also play a role. The experiment in Section 5
offers our best effort in isolating domain bias in a controlled
setting. We believe it is a sound approach to both establishing and estimating domain bias. Nonetheless, it only constitutes a partial answer to the measurement question, as the
methodology cannot be easily scaled up due to the need for
a large quantity of human labels. Our limited data-set has
forced us to use various heuristics to expand our coverage of
domains; to scale to all domains is out of reach today. We
believe that as user visits become increasingly concentrated
on certain domains, domain bias will become an even more
important issue, and measuring domain bias will be an important future research topic. Progress in this area will also
have important implications on how to measure other forms
of bias in web search.
Domain bias has led users to concentrate their web visits
on fewer and fewer domains. It is debatable whether this
trend is conducive to the health and growth of the web in
the long run. Will users be better off if only a handful
of reputable domains remain? We leave it as a tantalizing
question for the reader.
7.
REFERENCES
[1] E. Agichtein, E. Brill, S. T. Dumais, and R. Ragno.
Learning user interaction models for predicting web
search result preferences. In Proceedings of SIGIR,
pages 3–10, 2006.
[2] R. Agrawal, A. Halverson, K. Kenthapadi, N. Mishra,
and P. Tsaparas. Generating labels from clicks. In
WSDM, pages 172–181, 2009.
[3] O. Chapelle and Y. Zhang. A dynamic bayesian
network click model for web search ranking. In
WWW, pages 1–10, 2009.
[4] J. Cho and S. Roy. Impact of search engines on page
popularity. In WWW, pages 20–29, 2004.
[5] J. Cho, S. Roy, and R. Adams. Page quality: In search
of an unbiased web ranking. In SIGMOD, pages
551–562, 2005.
[6] N. Craswell, O. Zoeter, M. Taylor, and B. Ramsey. An
experimental comparison of click position-bias models.
In WSDM, pages 87–94, 2008.
[7] G. Dupret and B. Piwowarski. A user browsing model
to predict search engine click data from past
observations. In SIGIR, pages 331–338, 2008.
[8] Z. Guan and E. Cutrell. An eye tracking study of the
effect of target rank on web search. In CHI, pages
417–420, 2007.
[9] F. Guo, C. Liu, A. Kannan, T. Minka, M. Taylor,
Y.-M. Wang, and C. Faloutsos. Click chain model in
web search. In WWW, pages 11–20, 2009.
[10] Z. Gyöngyi, H. Garcia-Molina, and J. Pedersen.
Combating web spam with trustrank. In VLDB, pages
576–587, 2004.
[11] T. Joachims. Optimizing search engines using
clickthrough data. In KDD, pages 133–142, 2002.
[12] T. Joachims, L. Granka, B. Pan, H. Hembrooke, and
G. Gay. Accurately interpreting clickthrough data as
implicit feedback. In SIGIR, pages 154–161, 2005.
[13] T. Joachims, L. Granka, B. Pan, H. Hembrooke,
F. Radlinski, and G. Gay. Evaluating the accuracy of
implicit feedback from clicks and query reformulations
in Web search. ACM Transactions on Information
Systems, 25(2), Apr. 2007.
[14] R. Kumar and A. Tomkins. A characterization of
online browsing behavior. In WWW, pages 561–570,
2010.
[15] Q. Mei and K. Church. Entropy of search logs: how
hard is search? with personalization? with backoff? In
WSDM, pages 45–54, 2008.
[16] A. Ntoulas, J. Cho, and C. Olston. What’s new on the
web?: the evolution of the web from a search engine
perspective. In WWW, pages 1–12, 2004.
[17] L. Page, S. Brin, R. Motwani, and T. Winograd. The
pagerank citation ranking: Bringing order to the web.
Technical Report 1999-66, Stanford InfoLab,
November 1999. Previous number =
SIDL-WP-1999-0120.
[18] B. Pan, H. Hembrooke, T. Joachims, L. Lorigo,
G. Gay, and L. A. Granka. In google we trust: Users’
decisions on rank, position, and relevance. Journal of
Computer-mediated Communication, 12:801–823, 2007.
[19] S. Pandey, S. Roy, C. Olston, J. Cho, and
S. Chakrabarti. Shuffling a stacked deck: the case for
partially randomized ranking of search engine results.
In VLDB, pages 781–792, 2005.
[20] F. Qiu, Z. Liu, and J. Cho. Analysis of user web traffic
with a focus on search activities. In WebDB, pages
103–108, 2005.
[21] M. Richardson, E. Dominowska, and R. Ragno.
Predicting clicks: estimating the click-through rate for
new ads. In WWW, pages 521–530, 2007.
[22] R. Srikant, S. Basu, N. Wang, and D. Pregibon. User
browsing models: relevance versus examination. In
KDD, pages 223–232, 2010.
[23] Y. Yue, R. Patel, and H. Roehrig. Beyond position
bias: Examining result attractiveness as a source of
presentation bias in clickthrough data. In WWW,
pages 1011–1018, 2010.
Baixar