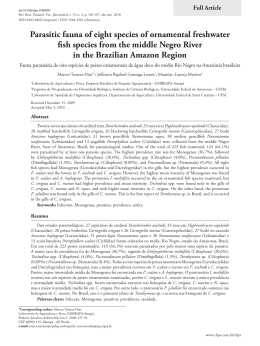
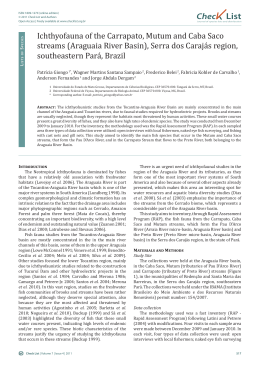
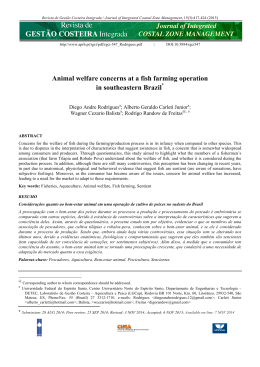
Maejo Int. J. Sci. Technol. 2013, 7(Special Issue), 43-51 Maejo International Journal of Science and Technology ISSN 1905-7873 Available online at www.mijst.mju.ac.th Report Fish species composition caught by gillnets: Case study from Chi River, Mahasarakham province, Thailand Ruamruedee Panchan1,*, Tuantong Jutagate 2 and Supranee Wigraiboon1 1 Division of Fisheries, Department of Agriculture Technology, Faculty of Technology, Mahasarakham University, Mahasarakham, 44000, Thailand 2 Faculty of Agriculture, Ubon Ratchathani University, Ubon Ratchathani, 34190, Thailand * Corresponding author, e-mail: [email protected] Received: 15 September 2012 / Accepted: 10 July 2013 / Published: 10 July 2013 Abstract: The aim of this study is to provide information about fish species composition, catch per unit effort (CPUE) and percentage index of relative importance (% IRI) of fish species caught by gillnets (mesh size range 35-55 mm) from Chi River, Mahasarakham province, Thailand. The data was collected during June-August 2011 from 3 sampling stations: Tah-songkhon, Din-dum and Bung-kla. Fifty-four fish species were found within 36 genera and 18 families. Fish in the Family Cyprinidae were the dominant group with 24 fish species (44.4%). Silver barb (Barbonymus gonionotus) was the most abundant species (16.9 % IRI), followed by common siamese barb (Henicorhynchus siamensis) (15.0% IRI) and white lady carp (Thynnichthys thynnoides) (12.8% IRI). The average of CPUE throughout the study was 2.1 ±0.4 kg fisher-1 day-1. Statistical differences among sampling sites were found and the highest CPUE, 3.8±0.6 kg fisher-1 day-1, was at Ban Tah-songkhon. Keywords: fish species composition, catch per unit effort, percentage index of relative importance, gillnets, Chi River INTRODUCTION The Chi River is the longest river in Thailand (765 km). It originates in the Phetchabun mountains, Chiyaphum province and flows through the central part of the north-eastern region of Thailand, passing Khonkaen, Mahasarakham, Kalasin, Roi-et and Yasothon, and then merges with Mun River in Warinchamrab district, Ubon Ratchathani province before joining the Mekong River. People living along the Chi River use it for domestic, agricultural, transport, industrial and, most important, fishery purposes. Local fishermen have a long development in fisheries. Importantly, the Chi River is known as one of the most important fishery resources in the north-eastern region. Fish 44 Maejo Int. J. Sci. Technol. 2013, 7(Special Issue), 43-51 are the cheapest source of protein and generate incomes for the local people along the river. Leeraputhana [1] surveyed the fish species diversity and reported that about 110 species in 22 families were found, with Cyprinidae as the dominant group. Aengwanich, et al. [2] surveyed the fish species and studied the way of life for fishermen in Mahasarakram province and reported that 85 species in 8 genera and 20 families were found, and that for most people along the river, catching fish was the occupation supplementary to rice farming. The main fishing gear was gillnets (37%), lift nets (26%), long line hooks (23%), traps (11%) and surrounding nets (2%). The average of catch per unit effort (CPUE) was about 1-3 kg fisherman-1 day-1, with March -April being the most productive period. Nachaiperm et al. [3] surveyed fish species in Pong, Chi and Mun Rivers caught by seine nets, electro-fishing gear and gillnets, and reported that in the Chi River there were about 88 species in 24 families, with the Cyprinidae group being the one with the greatest number of species (42). Pilasemorn et al. [4] studied the fish community structure and distribution in Chi River by electro-fishing and gillnets, and reported that about 88 species in 23 families were found. Rasbora dusonensis and Channa striata were the species with the highest abundance by number and weight respectively [4]. The objective of this study is to obtain the basic information on the current status of native fish species that were caught by gillnet in the Chi River, Mahasarakham province through the study of fish species composition and dominant catches. The result of this study will provide useful information on the fishery resources to support data related to sustainable management. MATERIALS AND METHODS Sampling Sites and Techniques The study was carried out on a weekly basis between June-August 2011. The sampling sites were at Ban Tah-songkhon (S1), Ban Din-dum (S2) and Ban Bung-kla (S3) (Figure 1). Fish specimens were taken by local fishermen from each site with gillnets of mesh sizes 35, 45 and 55 mm, which are often used in this area. The fishermen were explained about the purpose of the study and were free to decide when to fish on each appointed night. The fishing gear was set during 3-6 p.m. and the fishermen came back the next day at 5-7 a.m. to their fishing gear to take the fish sample from each set of gillnets. Fish samples were taxonomically classified and identified [5-6] into species. The total length was measured to the nearest centimetre and body weight taken to the nearest gramme. Data analysis The percentage index of relative importance (%IRI) [7] was used to identify the main catches according to: % W % N % F i i i %IRI n % Wi % N i %Fi i 1 100 where %Wi and %Ni are the percentage weight and number of the ith species in the total catch and %Fi is the percentage frequency of occurrence of each species in the total number of species. The catch per unit effort (CPUE) was expressed as kg fisherman-1 day-1. Weekly CPUE values were transformed to ln(1+CPUE) [8], which allows zero catches to be used and makes the 45 Maejo Int. J. Sci. Technol. 2013, 7(Special Issue), 43-51 , values suitable for one-way analysis of variance (ANOVA) [9]. ANOVA and Duncan s new multiple range test were used to analyse the difference between sites. Figure 1. Location of sampling sites along Chi River, Mahasarakham province RESULTS AND DISCUSSION Composition of Fish Taxa In total, during the survey with gillnets, 1,902 fish were caught comprising 54 species within 38 genera and 18 families (Table 1), which is fewer than previous findings with 85-110 species [1-4]. This might be due to the change of ecology, although the different sampling methods and locations might also account for the variation observed. The family with the most frequent occurrence in this study was Cyprinidae, which comprised 24 species (44.4%), followed by Bagridae (14.8%), Cobitidae (5.6%), Siluridae (5.6%) and Pangasiidae (5.6%) (Figure 2). These findings are in agreement with the observation of Aengwanich et al. [10], who reported that the Cyprinidae group was the dominant group in catches from the Chi River. Among all the sites, 21 species were found belonging to the Cyprinidae. Henicorhynchus siamensis was the most frequently encountered species (13.4%), followed by Labiobarbus leptocheila (12.2%), Thynnichthys thynnoides (12.2%) and Puntioplites falcifer (10.7%) (Table 1). The body size seemed to influence catching efficiency and selectivity of gillnets more than species. The catching efficiency and selectivity of gillnets were found to be related to body shape; particularly, diamond-shaped fish were caught more often than torpedo-shaped fish [11]. The Cyprinidae is in the diamond-shaped group and the Cyprinid fish are also the dominant species and widely distributed in Thai reservoirs__ more than 50% of the fish assemblage are in this fish group [12]. The most abundance was found at S2 (1,095 fish), followed by S1 (601 fish) and S3 (206 fish). In terms of the number of families at each site, S1 had the greatest number with 14 families, followed by S2 and S3 with 12 and 11 families respectively. In terms of species, S1 ranked first with 38 species, followed by S2 and S3 with 37 and 31 species respectively. In terms of yield or weight per species, that from Barbonymus gonionotus was the highest (19.5%), followed by H. siamensis (13.5%) and T. thynnoides (10.6%) (Table 1). 46 Maejo Int. J. Sci. Technol. 2013, 7(Special Issue), 43-51 Table 1. Species and total number of individuals of each species caught at each site from June-August Family/Scientific name Family Notopteridae Notopterus notopterus Family Cyprinidae Luciosoma bleekeri Rasbora aurotaenia Paralaubuca harmandi Cyclocheilichthys apogon Cyclocheilichthys armatus Cyclocheilichthys enoplos Cyclocheilichthys repasson Puntioplites falcifer Puntioplites proctozysron Barbonymus altus Barbodes gonionotus Barbonymus schwanenfeldii Hampala dispar Hampala macrolepidota Puntius brevis Thynnichthys thynnoides Labiobarbus leptocheila Henicorhynchus ornatipinnis Henicorhynchus siamensis Morulius chrysophekadian Osteochilus hasseltii Osteochilus lini Osteochilus melanopleura Osteochilus microcephalus Family Cobitidae Syncrossus helodes Yasuhikotakia modesta Yasuhikotakia eos Family Loricariidae Hypostomus plecostomus Family Bagridae Mystus sp. Leiocassis siamensis Mystus atrifisciatus Hemibagrus filamentus Mystus singaringan Mystus multiradiatus Mystus wycki Hemibagrus wyckioides Family Siluridae Kryptopterus cheveyi Micronema bleekeri Ompok krattensis Family Pangasiidae Helicophagus leptorhynchus Pangasius macronema Pteropangasius pleurotaenia Family Synbranchidae Monopterus albus Family Belonidae Mastacembelus armatus Family Ambassidae Parambassis siamensis Family Nandidae Pristolepis fasciatus Family Cichlidae Pterophyllum sp. Family Eleotrididae Oxyeleotris marmorata Family Anabantidae Anabas testudineus S1 S2 S3 Total % Number of individuals % Weight 12 - 22 34 1.8 1.4 1 2 14 15 12 143 45 26 112 3 2 4 12 77 59 5 13 2 1 1 1 4 9 21 12 97 36 91 46 9 1 24 218 142 5 184 3 41 5 7 4 1 4 2 9 25 11 15 29 3 1 2 13 12 1 6 1 1 1 5 12 21 18 29 118 204 147 87 150 3 5 2 28 232 232 5 255 9 70 7 9 6 0.1 0.3 0.6 1.1 1.0 1.5 6.2 10.7 7.7 4.6 7.9 0.2 0.3 0.1 1.5 12.2 12.2 0.3 13.4 0.5 3.2 0.4 0.5 0.3 0.01 0.1 0.3 0.5 0.6 2.1 2.9 8.8 9.4 4.3 19.5 0.2 0.7 0.2 0.5 10.6 7.8 0.1 13.5 1.7 2.9 0.3 0.7 0.2 1 - 2 2 1 1 2 3 0.1 0.1 0.2 0.1 0.1 0.2 1 - - 1 0.1 0.1 2 4 3 - 3 1 4 23 1 1 12 7 1 - 3 1 7 16 10 23 1 1 0.1 0.4 0.8 0.5 1.2 0.1 0.1 0.02 0.2 1.4 0.5 0.5 0.1 0.03 2 4 7 1 1 2 - 5 4 8 0.3 0.2 0.4 0.1 0.9 0.9 2 1 2 - 1 1 - 5 1 1 0.3 0.1 0.1 1.1 0.1 0.01 - 1 - 1 0.1 0.03 2 2 - 4 0.2 0.8 1 47 1 49 2.6 0.3 5 24 13 42 1.4 2.2 1 - - 1 0.1 0.02 2 15 6 23 1.2 1.4 - 1 1 2 0.1 0.1 47 Maejo Int. J. Sci. Technol. 2013, 7(Special Issue), 43-51 Table 1. (continued) Family/Scientific name Family Belontiidae Trichogaster trichopterus Family Channidae Channa striata Family Soleidae Euryglossa harmandi Family Tetraodontidae Monotreta suvattii Total no. of individuals Total no. of families Total no. of species S1 S2 S3 Total % Number of individuals % Weight 1 3 - 4 0.2 0.1 - - 1 1 0.1 0.1 - 1 - 1 0.1 0.04 1 601 14 38 1,095 12 39 206 11 31 1 1,902 18 54 0.1 0.1 Figure 2. Percentage of fish species in each family caught by gillnets Dominant Fish Species According to % IRI (Figure 3), Barbodes gonionotus, Puntioplites falcifer and Puntioplites proctozysron were the dominant species at 15.1%, 11.6% and 9.6% respectively in the catch at S1. Thynnichthys thynnoides, Henicorhynchus siamensis and P. proctozysron were the dominant species with 13.8%, 13.2% and 9.5% respectively at S2. B. gonionotus, Labiobarbus leptocheila and Cyclocheilichthys repasson were the dominant species with 12.3%, 5.9% and 5.6% respectively at S3. B. gonionotus, P. falcifer and Barbonymus altus were caught at all sampling sites. In terms of the most frequently caught at each site, B. gonionotus, P. falcifer and B. altus were found throughout the sampling period at S1. T. thynnoides, H. siamensis, L. leptocheila, C. repasson, B. altus and P. falcifer were found throughout the sampling period at S2. B. gonionotus, P. falcifer, Notopterus notopterus and H. siamensis were also commonly found at S3. Additionally, the three most dominant species in the total catch throughout the study period were B. gonionotus (16.9%), 48 Maejo Int. J. Sci. Technol. 2013, 7(Special Issue), 43-51 H. siamensis (15.0%) and T. thynnoides (12.7%) (Figure 3). These results disagree with the previous study by Pilasemorn, et al. [4], who surveyed the fish species from upstream to downstream along the Chi River using electro-fishing and gillnets during 2003-2005. They found that Rasbora dusonensis and Channa striata were the dominant species. Catch per Unit Effort (CPUE) The highest CPUE, 3.8±0.6 kg fisherman-1day-1 was at S1, followed by S2 and S3 with 1.5± 0.5 and 1.0±0.2 kg fisherman-1day-1 respectively. The average of CPUE throughout the study was 2.1 ±0.4 kg fisherman-1day-1 (ranging between 0.3-6.3 kg fisherman-1day-1). From ANOVA analysis, there were statistical differences in the ln(1+CPUE) among sampling sites (Figure 4). The differences in CPUE between the sites were probably caused by differences in the size of fish species and topological characteristics of the fishing area. S1 was higher than the other two sites and it was observed that S1 mainly gave large fish species as indicated by the weight of the catch, whereas S2 and S3, with many aquatic plants which may serve as spawning and nursing grounds for small fish, mainly gave smaller fish species. 49 Maejo Int. J. Sci. Technol. 2013, 7(Special Issue), 43-51 Figure 3. Percentage index of relative importance (% IRI) for each species 50 Maejo Int. J. Sci. Technol. 2013, 7(Special Issue), 43-51 Figure 4. Summary of statistical testing of ln(1+CPUE) at each sampling site (The same letter in box indicates that the values are not statistically different ( = 0.05).) CONCLUSIONS Fifty-four fish species were found in the Chi River, Mahasarakham province in this survey, considerably fewer than previous findings. Fish in the Family Cyprinidae were the dominant group with 24 species (45.28%), and Barbodes gonionotus was the dominant species in catches by gillnets (16.91 % IRI). The average CPUE throughout the study was 2.1±0.4 -1 -1 kg fisherman day and S1 (Ban Tah-songkhon) was the site with the highest CPUE, 3.8±0.6 kg fisherman-1 day-1. ACKNOWLEDGEMENTS This study was funded by the Faculty of Veterinary and Animal Sciences, Mahasarakham University. We would like to thank all the local fishermen from the Chi River, Mahasarakham province for their kind help during the field trips. REFERENCES 1. 2. 3. W. Leeraputhana. “Fish and fisheries in Chi River”, Annual report, 1977, Department of Fisheries, Bangkok, pp.63-81 W. Aengwanich, T. Chinrasri, O. Chinrasri and W. Kongbuntad.. “Ichthyofauna and taxonomy of the Chi River’s fish in Mahasarakham province”, Research paper of Mahasarakham University, 1998, Mahasarakham University, Thailand. J. Nachaiperm, C. Neungsith and C. Chernchom, “Structure and distribution of fish community in Chi River”, Technical Paper No. 20/2005, 2004, Department of fisheries, Bangkok. 51 Maejo Int. J. Sci. Technol. 2013, 7(Special Issue), 43-51 4. 5. C. Pilasemorn, S. Singsri, C. Phetcharat and M. Chaengkij, “Structure and distribution of fish community in the Chi River during 2003-2005”, Technical Paper No. 2/2006, 2006, Department of Fisheries, Bangkok. W.J. Rainboth, “FAO species identification field guide for fishery purpose: Fishes of the Cambodian Mekong”, FAO, Rome, 1996. C. Vidthayanon, “Manual of Freshwater Fish”, Sarakadee Press, Bangkok, 2004. L. Pinkas, “Food habits study”, in “Food Habits of Albacore, Blue-fin Tuna, and Bonito in California Waters” (Ed. L. Pinkas, M. S. Oliphant and I. L. K. Iverson), The California Department of Fish and Game’s Fish Bulletin No. 152, 1971, pp.5-10. 8. J. D. Emerson and M. A. Stoto,“Transforming data”, in “Understanding Robust and Exploratory Data Analysis” (Ed. D. C. Hoaglin, F. Mosteller and J. W. Turkey), John Wiley and Sons, New York, 1983, pp.97-128. 9. R. H. Green, “Sampling Design and Statistical Methods for Environmental Biologist”, John Wiley and Sons, New York, 1979. 10. W. Aengwanich, T. Chinrasri, and O. Chinrasri, “Study on diversity of family Cyprinidae of Chi River in Mahasarakham province, Thailand”, KKU Sci. J., 1999, 27, 43-50. 11. H. A. Regier, “Fish size parameters useful in estimating gill net selectivity”. Progress. Fish Cultur. 1969, 31, 57-59. 12. T. Jutagate, “Reservoir fisheries in Thailand”, in “Reservoir Fisheries in Asia and Pacific” (Ed. S. S. de Silva and U. S. Amarasinghe), Monograph No. 2, Network of Aquaculture Centres in Asia-Pacific (NACA), Bangkok, 2009, pp.96-113. 6. 7. © 2013 by Maejo University, San Sai, Chiang Mai, 50290 Thailand. Reproduction is permitted for noncommercial purposes.
Baixar