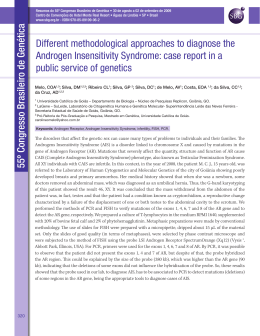
Pedro Miguel Pinto Gonçalves Gouveia Pedrosa Licenciado em Biologia pela Faculdade de Ciências de Lisboa Gold nanoprobes for the detection of mutations associated with antibiotic resistance in Mycobacterium tuberculosis complex Dissertação para obtenção do Grau de Mestre em Genética Molecular e Biomedicina Orientador: Pedro Viana Baptista, Professor Associado com Agregação, Faculdade de Ciência e Tecnologia Júri: Presidente: Prof. Doutor José Paulo Sampaio Arguente: Prof. Doutor Abel González Oliva Vogal: Prof. Doutor Pedro Viana Baptista [Agosto 2013] ii Gold nanoprobes for the detection of mutations associated with antibiotic resistance in Mycobacterium tuberculosis complex Copyright em nome de Pedro Miguel Pinto Gonçalves Gouveia Pedrosa e da FCT, UNL. A Faculdade de Ciências e Tecnologia e a Universidade Nova de Lisboa têm o direito, perpétuo e sem limites geográficos, de arquivar e publicar esta dissertação através de exemplares impressos reproduzidos em papel ou de forma digital, ou por qualquer outro meio conhecido ou que venha a ser inventado, e de a divulgar através de repositórios científicos e de admitir a sua cópia e distribuição com objectivos educacionais ou de investigação, não comerciais, desde que seja dado crédito ao autor e editor. iii iv ACKNOWLEDGEMENTS This work would not have been possible without the help of the people and Institution that contributed to its success. For those who were a part of it, in their particular way I express my gratitude. I would like to especially thank: Prof. Pedro Viana Baptista my supervisor, for all the opportunities he gave me throughout this year; for promoting my scientific and academic growth; for the guidance; and most of all for trusting in me. I am sincerely thankful. Bruno Veigas, and Fábio Carlos for the support and patience; for everything they taught me; for being pillars of this work; and for the unconditional friendship. All my lab colleagues for fulfilling my days during this year, scientifically and spiritually. To Miguel Larguinho, Ana Cordeiro, Milton Cordeiro, João Rosa, João Conde, Rita Cabral, Sara Figueiredo, Letícia Giestas, Ana Sofia, Margarida Queiroz, I am very glad I met them and I am honored to have worked with them. Instituto de Higiene e Medicina Tropical for the collaboration in this work, namely Prof. Miguel Viveiros, Prof. Isabel Couto and Diana Machado. My closest friends, for always being there when I needed them. My family, for the unconditional love and support, especially my parents, brother and grandparents. I might not always be close to you but you know you are always in my heart. Márcia for the true love. Pedro Pedrosa v vi RESUMO A tuberculose humana é ainda uma das doenças infecciosas de maior incidência mundial, com 8.7 milhões de novos casos reportados em 2011. O aumento da taxa de infecções por tuberculose multi-resistente tem também imposto sérios riscos à saúde pública, especialmente em países em desenvolvimento. Resistência à isoniazida e rifampicina, dois antibióticos de primeira linha, está geralmente associada a mutações pontuais nos genes katG, inhA e rpoB de Mycobacterium tuberculosis complex (MTBC). O desenvolvimento de um método molecular barato, rápido e simples, capazes de aferir os perfis de susceptibilidade antimicrobiana, terá um grande impacto na capacidade de diagnóstico precoce e tratamento de doentes com tuberculose multi-resistente. Nanopartículas de ouro funcionalizadas com oligonucleotidos tiolados (nanossondas) têm mostrado o seu potencial de detecção rápida e sensível de MTBC, bem como de mutações associadas a resistência a antibióticos. Nomeadamente a caracterização dos três codões mais relevantes do gene rpoB, associados à resistência à rifampicina. Neste trabalho alargou-se a discriminação de mutações ao gene inhA associadas a resistência à isoniazida. Utilizando uma abordagem de multiplex PCR foi ainda possível amplificar os genes rpoB e inhA e aferir ambos os loci em paralelo, estendendo o potencial das nanossondas para a caracterização de tuberculose multi-resistente, com especial aplicação nos genótipos mais frequentes na região da Grande Lisboa. Palavras-chave: nanodiagnóstico; nanopartículas de ouro; tuberculose; multiplex PCR. vii viii ABSTRACT Tuberculosis is still one of the leading human infectious diseases, with 8.7 million new cases reported in 2011 alone. Also, the increasing rate of multidrug-resistant tuberculosis (MDR-TB) and its treatment difficulties pose a serious public health threat especially in developing countries. Resistance to isoniazid and rifampicin, first line antibiotics, is commonly associated with point mutations in katG, inhA and rpoB genes of Mycobacterium tuberculosis complex (MTBC). Therefore, the development of a cheap, fast and simple molecular method to assess susceptibility profiles would have a huge impact in the capacity of early diagnosis and treatment of MDR-TB patients. Gold nanoparticles functionalised with thiol-modified oligonucleotides (Au-nanoprobes) have shown the potential to provide a rapid and sensitive detection method for MTBC and single base mutations associated with antibiotic resistance, namely the characterisation of the three most relevant codons in rpoB gene associated to rifampicin resistance. In this work the Au-nanoprobe approach is extended towards the discrimination of specific mutations within inhA gene which is associated with resistance to isoniazid. Using a multiplex PCR reaction for rpoB and inhA genes, it was possible to assess both loci in parallel, and extend the potential of the Au-nanoprobe method to MDR-TB molecular characterisation with special application in the most frequent genotypes circulating in the Lisbon Health Region. Keywords: nanodiagnostics; gold nanoparticles; tuberculosis; multiplex PCR. ix x TABLE OF CONTENTS ACKNOWLEDGEMENTS .............................................................................................................v RESUMO ....................................................................................................................................vii ABSTRACT ..................................................................................................................................ix FIGURES AND TABLES INDEX .................................................................................................xv ABBREVIATIONS .....................................................................................................................xvii 1. INTRODUCTION ......................................................................................................................1 1.1 Tuberculosis............................................................................................................................1 1.1.1 Mycobacterium Tuberculosis ...............................................................................................1 1.1.2 TB Treatment .......................................................................................................................2 1.1.3 Mechanisms of Resistance ..................................................................................................2 1.1.4 Diagnostic ............................................................................................................................3 1.1.5 Current Needs .....................................................................................................................4 1.2 Nanotechnology ......................................................................................................................5 1.2.1 Gold Nanoparticles ..............................................................................................................5 1.2.1.1 Synthesis ..........................................................................................................................5 1.2.1.1 Functionalisation ...............................................................................................................5 1.2.1.3 Physical and Optical Properties ........................................................................................5 1.2.2 Non-cross-linking method ....................................................................................................6 1.2.3 Tuberculosis Detection with Au-nanoprobes .......................................................................6 1.3 Scope of Thesis ......................................................................................................................7 2. MATERIALS AND METHODS ..................................................................................................9 2.1 Materials .................................................................................................................................9 2.1.1 Equipment ...........................................................................................................................9 2.1.2 Other Materials ....................................................................................................................9 2.1.3 Chemical Reagents .............................................................................................................9 2.1.4 Biological Reagents .............................................................................................................9 2.1.5 Biological Sequences ........................................................................................................10 2.1.6 Solutions ............................................................................................................................11 2.2 Methods ................................................................................................................................12 2.2.1 Molecular Biology ..............................................................................................................12 xi 2.2.1.1 Plasmid Extraction ..........................................................................................................12 2.2.1.2 Polymerase Chain Reaction ...........................................................................................13 2.2.2 Nanotechnology ................................................................................................................13 2.2.1.2 Synthesis of Gold Nanoparticles ....................................................................................13 2.2.1.3 Thiol-modified Oligonucleotides Preparation ..................................................................13 2.2.1.4 Synthesis of Nanoprobes (Salt-Aging Method) ..............................................................14 2.2.1.5 Synthesis of Nanoprobes (pH Assisted Method) ............................................................14 2.2.1.6 Nanoprobes Stability Assays ..........................................................................................14 2.2.1.7 Non-cross-linking Detection Assays ...............................................................................15 2.2.1.8 TEM Analysis ..................................................................................................................15 2.2.1.9 DLS Analysis ..................................................................................................................15 3. RESULTS AND DISCUSSION ...............................................................................................17 3.1 Design and Characterisation of inhA primers and probes ...................................................17 3.1.1 Sequence Design ..............................................................................................................17 3.1.2 Target Preparation .............................................................................................................17 3.1.3 AuNPs Synthesis and Characterisation .............................................................................18 3.1.4 Au-nanoprobes Characterisation .......................................................................................19 3.1.5 Au-nanoprobes Calibration.................................................................................................20 3.2 Dual loci Characterisation .....................................................................................................22 3.2.1 Au-nanoprobes Synthesis Method ....................................................................................22 3.2.2 PCR Multiplex ....................................................................................................................23 3.2.3 Target Concentration .........................................................................................................24 3.2.3 Data Analysis .....................................................................................................................26 3.2.4 Detection and Characterisation of Samples ......................................................................28 4. CONCLUSION ........................................................................................................................33 REFERENCES ...........................................................................................................................35 APPENDIX .................................................................................................................................39 xii FIGURES AND TABLES INDEX Table 1.1 Most relevant methods of diagnostic of TB in use ...................................................... 3 Figure 1.1 Au-nanoprobes non-cross-link method for the diagnostic of TB ................................ 7 Table 2.1 Equipment ................................................................................................................... 9 Table 2.2 Biological reagents ...................................................................................................... 9 Table 2.3 Biological Sequences ................................................................................................ 10 Figure 3.1 Electrophoretic analyses of plasmids and PCR products ........................................ 18 Equation 3.1 Equation for the calculus of AuNPs mean size using UV-Vis spectrum .............. 18 Figure 3.2 Characterisation of AuNPs by TEM ......................................................................... 19 Figure 3.3 DLS Analysis of AuNPs and Au-nanoprobes .......................................................... 20 Figure 3.4 Au-nanoprobes stability at various concentrations of MgCl2 .................................... 20 Figure 3.5 Au-nanoprobes detection assays ............................................................................ 21 Figure 3.6 Au-nanoprobe assays with various concentrations PCR Product ........................... 22 Figure 3.7 Au-nanoprobes stability assays for pH-assisted synthesis ..................................... .23 Figure 3.8 Au-nanoprobe detection assays using MTBC probe synthesised by pH assisted method with different ratios ........................................................................................................23 Figure 3.9 Electrophoretic analysis of multiplex PCR ................................................................24 Figure 3.10 Au-nanoprobe detection assays of multiplex PCR products ..................................25 Figure 3.11 Au-nanoprobe detection using unbalanced multiplex PCR products .....................26 Equation 3.2 Ratio of WT \ Mut Au-nanoprobes ........................................................................27 Figure 3.12 Analysis of data using ratio of WT and Mut probes ................................................27 Figure 3.13 Schematics of multiplex PCR and Au-nanoprobes colorimetric detection ..............28 Figure 3.14 Au-nanoprobes detection of negative and positive controls ...................................29 Figure 3.15 Multiplex PCR products tested with MTBC probe ..................................................29 Figure 3.15 Au-nanoprobe assays of the 25 samples ...............................................................30 Table 3.1 Phenotypes and genotypes of the tested samples ....................................................31 Figure A2 Autocorrelation curves of DLS measurements .........................................................39 Table A3 Ratio of WT probes divided by ratio of Mut probes ....................................................40 xiii xiv ABBREVIATIONS Abs – Absorption AL – Alkaline Lysis AuNPs – Gold Nanoparticles BCG – Bacillus Calmette-Guérin DLS – Dynamic Light Scattering DNA – Deoxyribonucleic Acid dNTPs – Deoxyribonucleotide Triphosphate dsDNA – double strand Deoxyribonucleic Acid DTT – Dithiothreitol INH – Isoniazid LB – Luria Bertani LED – Light-Emitting Diode MDR – Multi-Drug Resistant MTBC – Mycobacterium tuberculosis complex Mut – Mutated NAAT – Nucleic Acid Amplification Tests PCR – Polymerase Chain Reaction SDS – Sodium Dodecyl Sulfate SPR – Surface Plasmon Resonance ssDNA – single strand Deoxyribonucleic Acid TB – Tuberculosis TEM – Transmission Electronic Microscope TM – Temperature of Melting WT – Wild Type xv This work resulted in the following publications in books of abstracts: Pedrosa P., Veigas B., Machado D., Perdigão J., Portugal I., Couto I., Viveiros M., Baptista P.V. 2013, Feb. Gold nanoprobes methodology for diagnosis of Multi-Drug Resistant Tuberculosis. NanoPT, Porto, Portugal. Pedrosa P., Veigas B., Machado D., Perdigão J., Portugal I., Couto I., Viveiros M., Baptista P.V. 2013, Apr. Detecção de MDRTB por gold-nanoprobes – Uma nova abordagem tecnológica desenvolvida em Portugal. Workshop Multidrug-Resistant Tuberculosis, IHMT, Lisbon, Portugal. xvi 1. INTRODUCTION 1.1 Tuberculosis Fighting Tuberculosis (TB) remains one of the biggest challenges of our times. Killing 1.4 million people in 2011 it is the second worldwide killer especially in developing countries, which account for 95% of the deaths. Despite largely curable when accurately diagnosed and treated, one third of the 8.7 million estimated new cases in 2011 were undiagnosed or unreported leading to continuous spread of the disease. Insufficient access to diagnostic tests sets one of the biggest barriers for TB control (WHO, 2012). In spite of the dropping mortality numbers that account for a reduction of 41% since 1990, cases of multidrug resistant tuberculosis (MDR-TB) – resistance to two first line antibiotics – are increasing. Such cases impose serious risks for public health, which could be avoided with an accurate and early diagnosis, improving treatment effectiveness. However, the percentage of undiagnosed or unreported cases for MDR-TB is 81% worldwide, also demonstrating the need for new diagnostic tools to assess resistance profiles (WHO, 2012). 1.1.1 Mycobacterium tuberculosis The most common mode of TB infection is by inhalation of aerosols containing viable microorganisms. Mycobacterium tuberculosis is the main etiological agent of TB in humans and part of the Mycobacterium tuberculosis complex (MTBC) that includes other human infecting subspecies. Described as fairly large, non-motile, rod-shaped bacterium distantly related to the Actinomycetes, its cellular wall is rich in mycolic acids impermeable to common dyes and stains used in bacterial studies. Acid-fast staining, such as Ziehl-Neelsen, is therefore the most commonly used for its microscopy visualisation. Mycobacterium tuberculosis is an obligate aerobe, facultative intracellular parasite usually found in lung alveoli. Able to evade standard immune system digestion mechanisms, it survives and replicates inside macrophages with a generation time of 15 to 20 hours, which makes them hard to grow in culture (McMurray, 1996). TB is an infectious disease of mandatory notice, divided into two types, active and latent. The active type is characterised by coughing, weight loss, fever, night sweats and in some cases coughing blood; other forms of extrapulmonary tuberculosis are described, but are rare and restricted to immunodepressed patients. The latent TB is asymptomatic, not contagious, and accounts for 95% of infected cases. Patients can remain infected for years without being diagnosed, of which 10% will evolve to an active form of the disease (McMurray, 1996; WHO, 2012). 1 1.1.2 TB Treatment TB treatments consist on long regimens of multiple antibiotics. For new patients, where no resistance is suspected, the treatment consists of 2 months of 4 first-line antibiotics (isoniazid, rifampicin, pyrazinamide, and either ethambutol or streptomycin) followed by 4 months of rifampicin (RIF) and isoniazid (INH). If resistances are found, second-line antibiotics are administered for up to 24 months. Directly observed therapy is recommended for all patients since they tend to stop or reduce the medication when they recover during the first weeks of treatment, increasing the risk for resistances. Ideally all diagnosed patients should stay in isolation until negative sputum smear – usually after approximately 2-4 weeks of treatment when they are considered not contagious – however this is not a reality in TB high-burden countries (ATS et al., 2003). 1.1.3 Mechanisms of Resistance Unlike other bacteria, which drug resistance is generally acquired through horizontal transfer by mobile genetic elements, M. tuberculosis acquires drug resistance mainly by spontaneous mutations in chromosomal genes, due to selection of resistant strains during sub-lethal drug therapy (Silva and Palomino, 2011). Since the two most relevant antibiotics are RIF and INH, their mechanisms of resistance will be clarified. RIF is an antibiotic of the rifamycin group that acts by binding to the active site of RNA polymerase beta subunit thereby blocking transcription. Alterations in single nucleotides confer resistance to RIF, making it recurrent in monotherapy schemes. An 81 bp region of rpoB gene (codons 507-533) accounts for about 95% of all single nucleotide alterations in examined clinical isolates, where more than 35 distinct variations have been described. Among these, H526D and S531L mutations account for two-thirds of RIF resistance and are absent in susceptible isolates (Telenti et al., 1993; Miller et al., 1994; Musser, 1995). These single mutation events are associated with high levels of RIF resistance, increasing its occurrence and making it one of the main reasons for treatment failure and fatal clinical outcome (Mitchison and Nunn, 1986). Resistance to INH is far more complex and its full mechanism of action is still not understood. It has been proposed that for INH effectiveness, it requires activation by a catalase-peroxidase enzyme encoded by katG. During this activation, the enzyme generates a hypothetical isonicotinic acyl radical that inhibits NADH-dependent enoyl-ACP reductase (encoded by inhA) which plays a role in the synthesis of essential mycolic acids (Vilcheze and Jacobs, 2007). INH resistance works therefore, either by loss of KatG activity (decreasing INH activation) or by InhA over expression (compromising its inhibition by the isonicotinic acyl radical). Mutations in inhA and katG are present in 75-85% of the cases (Musser, 1995; Zhang et al., 1992). However, mutations in other genes have also been related with resistance to INH such as ahpC, ndh, embB, kasA, furA, showing the complexity of INH action (Banerjee et al., 2008). The most common point mutation in clinical isolates lies in codon 315 of katG, with a serine to threonine substitution. This substitution is responsible for about 50-90% of the isoniazid resistant mutants globally but not in Portugal, where there is a high prevalence of MDR-TB in the Lisbon Health Region (Machado et al., 2013). More than 90% of these resistant strains show no 2 mutation in katG, but only in the promoter region of inhA (C-15T) coupled with mutations in inhA gene locus. Furthermore, inhA mutations have also been described as conferring cross-resistance to ethionamide (ETH) (Viveiros et al., 2010; Machado et al., 2013). The rpoB S531L and inhA C-15T are then the most common mutations in the Lisbon Health Region, conferring resistance to RIF, INH and ETH. 1.1.4 Diagnostics Diagnosis of TB can be difficult since it shares the same early symptoms with other diseases. For that matter, clinicians have a broad range of screening tests to confirm the diagnosis (Wallis et al., 2010). Mantoux tuberculin skin test and Interferon-γ release assays test the immune response of a patient to specific antigens of M. tuberculosis. They are the primarily screening methods, however they present low specificity with false positive results in BCG vaccinated patients (Mazurek et al., 2007). Once suspected of TB, chest X-Ray radiography is taken to seek for abnormalities and acidfast bacilli smear microscopy is analysed, which despite rapid, has low sensitivity even when coupled to light-emitting diode microscopy (Parsons et al., 2011). Microorganisms are also grown in laboratorial culture using Löwenstein–Jensen medium. Cultures can provide drug-susceptibility profiles, but due to the low growing rate of Mycobacterium tuberculosis results can take 2 to 6 weeks. Meanwhile clinicians use molecular tests to support the diagnosis and start treatment. Several molecular methods are available on the market, but they are either cumbersome, expensive or require specialised equipment and technicians, making them unsustainable in developing countries (Parsons et al., 2011). They generally depend on nucleic acids-amplification tests (NAAT) and two of them are endorsed by World Health Organization: line probe assays and automated detection. Both methods reduce time of diagnosis by hours, and automated systems even discards the need for specialised training, but the price of both technologies restricts their use to developed countries (Wallis et al., 2010; WHO, 2012). Table 1.1 Most relevant methods of TB diagnostisis Diagnostic Method Tuberculin skin Test (Mantoux) Description Extensive Immunological skin practical and response to tuberculin published experience Immunoassays Detection of released Interferon-γ Main strengths Interferon-γ to identify active MTBC infection Main weaknesses Low sensitivity with immune compromised; crossreaction with BCG vaccine Moderate training; Highly specific; consumables relatively fast dependent; imperfect sensitivity 3 Detection of Radiography Chest abnormalities in radiography pulmonary radiographies Smear microscopy Ziehl- Detect TB bacteria by Neelsen and common or fluorescent LED microscopy Detect TB bacteria (manual or automated) Liquid culture use not restricted to TB Rapid; low consumables Good sensitivity; Solid culture Culture Indications and and screen drug susceptibility low equipment Low specificity; low sensitivity; requires equipment and trained interpreter Low sensitivity Slow Slow; extensive High sensitivity; training, faster than solid infrastructure and culture consumables dependent Line probe assays NAAT Automated Systems Aunanoprobes Strip tests, detect MTBC and assess INH Rapid and RIF resistance Automated processing, Rapid; almost detect MTBC and no training assess RIF resistance required Colorimetric detection of TB, assess RIF and INH resistance Rapid; cheap; easy-read Moderate training; expensive Expensive; equipment and consumables dependent Moderate training Note: Adapted from (Dorman, 2010; WHO, 2009); BCG, Bacillus Calmette-Guérin; LED, Light-Emitting Diode 1.1.5 Current Needs There are two front lines in the combat for TB: treatment and diagnostics. Without new effective drugs on the market for over 40 years, TB is characterised as a disease of developing countries, with reduced interests for pharmaceutical industries (Parsons et al., 2011; Wallis et al., 2010). Diagnostic technologies for instance have seen new improvements in the latest years, especially molecular diagnostics. These molecular methods are based on NAAT, taking advantage of its high sensitivity and specificity, but require laboratories, trained personnel and are extremely expensive, which is the main bottleneck to overcome. The impact for the 22-high burden countries is estimated to be more than $3.4 trillion between 2006 and 2015 if no anti-TB strategy is implemented (Laxminarayan et al., 2009). To solve the TB problem a fast, accurate, simple, and mostly low cost technology for diagnostics is needed (Wallis et al., 2010). 4 1.2 Nanotechnology Nanotechnology can be defined as understanding, controlling and manipulating materials at dimensions between 1 and 100 nanometers (Debnath et al., 2009). Nanomaterials have been used since ancient times, as evidenced by the presence of gold nanoparticles (AuNPs) in medieval cathedrals’ stained glass windows. Just recently however, the interest in nanomaterials bloomed due to their wide range of applications, especially in the biomedical field. Carbon nanotubes, quantum dots and noble metal nanoparticles are examples of such nanomaterials (Eustis and El-Sayed, 2006). AuNPs in particular have shown great potential for theranostics, due to their physical and optical properties. With a high surface-area-to-volume ratio, they are great vectors for delivery of molecular cargo. Also, their optical properties make them a better alternative to common fluorophores used in molecular diagnostic (Dreaden et al., 2012; Veigas et al., 2012). In the following sections, I will outline the most important characteristics of AuNPs along with their method of synthesis, functionalisation, and application. 1.2.1 Gold Nanoparticles 1.2.1.1 Synthesis Various techniques have been described for the synthesis and functionalisation of AuNPs, with different sizes, shapes and capping. Each of these has unique characteristics and is used for different purposes. I will focus on the properties of 14 nm diameter, spherical, citrate capped AuNPs. AuNPs synthesis is performed in liquid medium starting by dissolution of chloroauric acid (HAuCl4) in water. Then, sodium citrate reduces Au 3+ 0 ions to Au that start to precipitate in the form of sub-nanometre particle clusters. These nanoparticles grow in diameter until they get saturated of sodium citrate that acts also as a capping agent, protecting them from aggregation. Its concentration is thus crucial to set the final AuNPs size, where higher sodium citrate concentrations promote the formation of smaller nanoparticles. The higher surface area-to-volume ratio in smaller particles makes them need more citrate to get surface saturated. This method of synthesis produces relatively monodisperse nanoparticles that due to their size, are stable in water, forming an homogenous colloid that does not precipitate nor aggregate (Ji et al., 2007). 1.2.1.2 Functionalisation Since citrate interactions with gold are weak (adsorption), functionalisation with biomolecules is generally easy through amine and thiol groups that interact strongly with gold (chemisorption) (Love et al., 2005). Several methods for nanoparticle functionalisation with DNA are described in the literature, but only functionalisation with 5’ thiol modified oligonucleotides by salt-aging and pHassisted methods will be addressed in this thesis (Zhang et al., 2012). The salt-aging method consists of the continuous addition of a salt solution that reduces repulsions between nanoparticles and oligonucleotides (both negatively charged), thus assisting in the Au-thiol interaction. Anionic 5 surfactants, such as sodium dodecyl sulfate (SDS) and ultrasounds are also used since they promote the general stabilisation of the system thus allowing higher salt concentrations that accelerate the functionalisation process. The pH-assisted method consists on lowering the AuNPs and DNA solution to pH 3 using sodium citrate. At pH 3 oligonucleotide and nanoparticle repulsion is reduced, accelerating functionalisation (Zhang et al., 2012). 1.2.1.3 Physical and Optical Properties The most noteworthy physical property of AuNPs is their size, which affects their surface-areato-volume ratio and colloidal stability in solution (Eustis and El-Sayed, 2006). Uniformly surface charged, 14 nm diameter AuNPs are stable in water but start to precipitate at larger sizes (Alexander et al., 2013). An interesting effect is observed upon the addition of salt: momentary dipoles are generated at the nanoparticles’ surface, reducing the repulsion between them and promoting their irreversible aggregation. Aggregated nanoparticles behave as bigger nanoparticles despite not being chemically bonded. This occurrence affects their stability in solution, promoting precipitation, and their special optical properties (Sato et al., 2005). When matter interacts with light several phenomena can occur and light can be: absorbed, scattered (i.e. or Rayleigh scattering) or absorbed and re-emitted (i.e., fluorescence). In the case of AuNPs all these phenomena are strongly enhanced due to the unique interaction of light with free electrons on their surface. Since light wavelength and nanoparticles are at the same scale, when gold nanoparticles are exposed to light, its electromagnetic field causes a collective oscillation of the conduction-band electrons at the surface of the nanoparticles, forming instantaneous dipoles. These dipoles cancel the electromagnetic radiation of the same frequency, “pseudo-absorbing” light (Eustis and El-Sayed, 2006). The synchronised oscillation of the free electrons with the electromagnetic field is called surface plasmon resonance (SPR). The SPR of gold nanoparticles depends on their size and shape; for spherical, 14nm diameter nanoparticles, the resonance occurs in the visible spectrum region (520nm) giving them a brilliant red colour (Huang et al., 2007). Bigger nanoparticles tend to blue colours due to a shift in the SPR peak to 600 nm region. When close enough, AuNPs change their optical properties, behaving as single bigger particles and shifting the SPR band to longer wavelengths. For that reason when AuNPs aggregate their colour changes to blue (Baptista et al., 2006; Sato et al., 2005). 1.2.2 Non-cross-linking Method Several approaches of DNA detection using AuNPs functionalised with oligonucleotides (Aunanoprobes) have been described (Baptista et al., 2006; Sato et al., 2003). In this work, a non-crosslinking method was used, based on the Watson-Crick base pair complementarity of DNA and saltinduced aggregation of AuNPs (Baptista et al., 2006; Watson and Crick, 1953). Basically, a DNA sample is added to the Au-nanoprobes followed by a salt that promotes the nanoprobes’ aggregation. In the presence of complementary DNA, the latter hybridises with the probe, protecting Aunanoprobes from aggregation. If the target is non-complementary, the Au-nanoprobes remain 6 unprotected, thereby aggregating. The colorimetric change of disperse versus aggregated nanoparticles allows a simple visual analysis which can also be quantified in a spectrophotometer. Due to the specificity of DNA base paring, single base mismatched sequences can be discriminated, since they confer less protection to the Au-nanoprobes than full complementary sequences (Veigas et al., 2010). 1.2.3 Tuberculosis Detection with Au-nanoprobes Au-nanoprobes have already proven their potential in the molecular diagnostic of TB, distinguishing not only MTBC from Non-MTBC (Baptista et al., 2006; Costa et al., 2010) but also mutations associated with antibiotic resistance. Veigas et al. (2010) described the use of Aunanoprobes for the characterisation of the three most relevant codons in rpoB gene associated to RIF resistance (Veigas et al., 2010). Since Au-nanoprobes present higher stability in the presence of full complementary targets a two-probe approach was addressed, with one probe harbouring a wild type (WT) sequence and the other a mutated (Mut) sequence. Considering that biological targets can only be WT or Mut, the redundancy of the two probes gives robustness to the result (Veigas et al., 2010). For its simplicity, speed and low-cost, this method has the capacity to fulfil clinical needs at point-ofcare (Baptista et al., 2008). Figure 1.1 Au-nanoprobes non-cross-link method for the diagnostics of TB 1.3 Scope of the Thesis The molecular methods for diagnostic of TB are still unsuited for clinical needs, especially in the most affected countries where resources are limited (Parsons et al., 2011). The huge impact of point-of-care diagnostic makes it an important research topic with direct implication in peoples’ lives. A method has already been developed for the discrimination of the most common mutations associated with resistance to RIF using Au-nanoprobes, but there is no method for the analysis of mutations associated with resistance to INH, the second most important TB drug. The scope of this work is thus to develop a molecular method at point-of-care, able to assess the most common inhA mutation associated with resistance to INH, prevalent in Portuguese strains. It will also be addressed the possibility of complementing the developed protocol with the existing method of rpoB mutation discrimination. The use of a one-step amplification method for both loci results in a more complete profile of resistances and reduces time and costs. 7 2. MATERIALS AND METHODS 2.1 Materials 2.1.1 Equipment Table 2.1 Equipment Equipment model Company UV-Vis Spectrophotometer UV Mini-1240 Shimadzu, Germany UV-Vis Spectrophotometer Nanodrop ND-1000 Nanodrop Technologies, USA Microplate reader Infinite M200 with Absorbance module Tecan, Switzerland Microfuge 1-14 Sartorius Sigma SIGMA, Germany Thermal Cycler DNA Engine Bio-Rad, USA Gel Doc XR+ Molecular Imager system Bio-Rad, USA Ultrasonic bath Elmasonic S10H Elma, Germany pH meter Basic 20 with combined glass electrode 5209 Crison, Spain Power supply electrophoresis Bio-Rad, USA DLS, SZ-100 Horiba, Japan 2.1.2 Other Materials - Quartz Absorption Cell – 105.202-QS (Hellma, Germany) - NAP-5 columns (GE Healthcare, Sweden) - 384 well small volume, LoBase Polystyrene microplates, black (Greiner Bio-One, Germany) 2.1.3 Chemical Reagents The chemicals used in this work were purchased from Sigma-Aldrich with the highest purity available unless stated otherwise. 2.1.4 Biological reagents Table 2.2 Biological reagents Product Company dNTPs Mix Bioline, United Kingdom DreamTaq DNA polymerase Fermentas, Canada 8 GelRed® Fermentas, Canada GeneRuler™ DNA Ladder Mix, ready-to-use Fermentas, Canada Oligonucleotides StabVida, Portugal RNase A endoribonuclease Fermentas, Canada 2.1.5 Biological Sequences All the following oligonucleotides 5’-thiol-(CH2)6 modified were resuspended in 100 μL of 1 M DTT and incubated for 1 h at room temperature. Afterwards, 900 μL of sterile milli-Q H2O was added to achieve a final concentration of 0.1M Dithiothreitol (DTT) and stored at -20ºC. All the following non-modified oligonucleotides were resuspended in sterile milli-Q H2O to achieve a final concentration of 100 pM and stored at -20ºC. Table 2.3 Biological Sequences Comment Name Sequence (5’- 3’) rpoB FW * GAG AAT TCG GTC GGC GAG CTG ATC C Primer rpoB RV * CGA AGC TTG ACC CGC GCG TAC ACC Primer inhA FW * CCT CGC TGC CCA GAA AGG GA Primer inhA RV * ATC CCC CGG TTT CCT CCG GT Primer AAT CAT CCC GTA ACA TAG TAG TCT CGC CGC GGC CGG GCC G Target AAT CAT CCC GTA ACA TAG TAA TCT CGC CGC GGC CGG GCC G Target AAT CAT CCC GTA ACA TAG CAC AAG CGC CGA CTG TCG GC Target AAT CAT CCC GTA ACA TAG GAC AAG CGC CGA CTG TCG GC Target MTBC Comp. TGG AAC TAT GAG TTG GAC GTG GAG GCG ATC Target Non-Comp. TTG AGT ATC AAG GTG ATC GCC TCC ACG TCC Target MTBC * Thiol - GAT CGC CTC CAC GTC C Probe rpoB 531 WT * Thiol - GCC GAC AGT CGG CGC TTG TG Probe rpoB S531L * Thiol - GCC GAC AGT CGG CGC TTG TC Probe inhA -15 WT Thiol - CGG CCC GGC CGC GGC GAG AC Probe inhA C-15T Thiol - CGG CCC GGC CGC GGC GAG AT Probe inhA -15 WT Comp. inhA C-15T Comp. rpoB 531 WT Comp. rpoB S531L Comp. s * Note: The rpoB primers and probes, and the MTBC probe were defined according to Veigas et. al (2010). The inhA primers were designed in collaboration with Grupo de Micobactérias, at Instituto de Higiene e Medicina Tropical (IHMT/UNL), Portugal. 9 2.1.6 Solutions AGE I 2% (w/v) SDS 10 mM phosphate buffer pH 8 Sterilised by filtration (0.22 μm) and stored at 4ºC. Warm up to 25ºC before used. AGE II 1.5 M NaCl 0.01% (w/v) SDS 10 mM phosphate buffer pH 8 Sterilised by filtration (0.22 μm) and stored at 4ºC. Warm up to 25ºC before used. Alkaline Lysis I (ALI) 50 mM Glucose 25 mM Tris-HCl pH 8 10mM EDTA pH 8 Sterilised by autoclaving and stored at 4ºC. Alkaline Lysis II (ALII) 200 mM NaOH 1% (w/v) SDS freshly prepared (room temperature). Alkaline Lysis III (ALIII) 3M sodium acetate (The pH was adjusted to 4.8 with glacial acetic acid) Stored at 4ºC and kept in ice during use. Aqua Regia One volume of HNO3 to three volumes of HCl Luria-Bertani (LB) medium 1% (w/v) tryptone 0.5% (w/v) yeast extract 171 mM NaCl The pH was adjusted to 7 with NaOH, sterilised by autoclaving and stored at 4ºC. Phosphate buffer (10 mM) pH 8.0 9.32mM Na2HPO4 mM 0.68 mM NaH2PO4 Sterilised by autoclaving and stored at 4ºC. 10 Sodium Citrate (0.5M) pH 3 0.5M sodium citrate The pH was adjusted to 3 with pure HCl, sterilised by autoclaving and stored at 4ºC. TAE Buffer 1X 40 mM Tris-Acetate 1 mM EDTA Tris-acetate was made with Tris-Base and Glacial Acetic Acid. The solution was sterilised by autoclaving and stored at 4ºC until further use. 2.2 Methods 2.2.1 Molecular Biology 2.2.1.1 Plasmid Extraction 1. An E. coli colony was inoculated in 10 mL of LB medium with 100 μg/mL ampicillin and incubated at 37ºC 16h with agitation. 2. Cells were pelleted by centrifuging at 1844g for 5 min in 1.5 mL tubes. 3. The supernatant was discarded and the pellet was resuspended in 100 μL of ice-cold AL I solution. 4. After 5 minutes on ice, 200 μL of AL II solution was added and mixed by inversion. 5. After 5 minutes on ice, 150 μL of AL III solution was added and mixed by vortex. 6. After 15 minutes on ice, the lysate was centrifuged at 21,460 g for 5 minutes. 7. The supernatant was transferred to a sterile tube and 2 volumes of ice-cold 100% ethanol were added. 8. The plasmid DNA was left to precipitate at -20ºC for 2 hours 9. The precipitate was centrifuged at 21460 g for 15 minutes and the supernatant was discarded. 10. The pellet was washed with 500 μL of ice-cold 70% ethanol. 11. The pellet was dried with the help of a speed-vac and resuspended in 50 μL of sterile milli-Q H2O. 12. RNase A was added to a final concentration of 25 μg/ml and incubated for 1 hour at 37ºC. 13. Two extractions with 1 volume of phenol were performed, followed by one extraction with chloroform. 14. Plasmid DNA was precipitated with ethanol by repeating steps 7 to 11 11 2.2.1.2 Polymerase Chain Reaction Simplex reaction Multiplex Reaction 1x DreamTaq Buffer 1x DreamTaq Buffer 0.2 μM primer Fw 0.2 μM inhA Fw 0.2 μM primer Rv 0.2 μM inhA Rv 0.2 mM dNTP mixture 0.2 μM rpoB Fw 0.1 U/μL DreamTaq polymerase 0.2 μM rpoB Rv 0.4 mM dNTP mixture 0.1 U/μL DreamTaq polymerase Reaction program 5 min 94º Pre-Denaturation 30s 94º Denaturation 30s 58º Annealing 35 cycles 45s 72º Extension 5min 72º Final Extension Pause 4º 2.2.2 Nanotechnology 2.2.2.1 Synthesis of Gold Nanoparticles adapted from Lee and Meisel (1982) All glass materials used for the synthesis of AuNPs were previously immersed in aqua regia for 2 hours and later washed with milli-Q H2O (18.2 MΩ.cm at 25 °C). All metal materials used during synthesis were covered with Teflon and Milli-Q H2O was used in all solutions. 1. In a 500 mL round bottom flask, 250 mL of 1 mM HAuCl 4 were brought to a boil while in reflux and vigorously stirring. 2. Then 25 mL of 38.8 mM sodium citrate were added and after 20 minutes the colloidal solution was left to cool to room temperature. 3. The solution was then transferred to a 500 mL Erlenmeyer and stored in the dark at room temperature. 4. AuNPs concentration was determined by the Lambert–Beer law assuming a molar absorptivity 8 −1 for the SPR peak (526 nm) of 2.33×10 M 5. cm −1 (Baptista et al., 2005). Morphological characterisation of the AuNPs was performed by Transmission Electron Microscopy (TEM) and Dynamic Light Scattering (DLS). 2.2.2.2 Thiol-modified Oligonucleotides Preparation 1. One volume of thiol-modified oligonucleotide was extracted with two volumes of ethyl acetate. 2. The organic phase was discarded after centrifuging for 5 minutes at 21460 g. 3. Two more extractions were performed repeating steps 1 and 2. 12 4. The remaining aqueous phase was further purified through a NAP-5 column, accordingly to manufacturer’s instructions, using 10 mM phosphate buffer pH 8 as eluent. 5. The purified thiol-modified oligonucleotide was quantified by UV/Vis spectroscopy with help of NanoDrop, using the optical density at 260 nm provided. 2.2.2.3 Synthesis of Nanoprobes (Salt-Aging Method) 1. In a polypropylene 25 mL vial with a conical skirted base, the purified thiol-modified oligonucleotide was mixed with a ~15 nM AuNPs solution in a theoretical ratio of 1:200 (AuNP:oligos). 2. AGE I solution was then added to achieve a final concentration of 10 mM phosphate buffer pH 8, 0.01% (w/v) SDS. 3. Afterwards, the ionic strength of the solution was sequentially increased in 50 mM increments by adding a certain volume of AGE II solution up to a final concentration of 10 mM phosphate buffer pH 8, 0.3 M NaCl, 0.01% (w/v) SDS and let rest at room temperature for an o/n period. NOTE: After each AGE solution addition, the vial was submersed in an ultrasound bath for 10 seconds and let to rest at room temperature for 20 minutes before the next increment. 4. The functionalised AuNPs were distributed in 2 mL tubes and centrifuged at 21460 g for 40 minutes. 5. The supernatant was discarded and the resulting oily pellet was washed twice with 10 mM phosphate buffer pH 8 and once with 10 mM phosphate buffer pH 8 0.1M NaCl. 6. The resulting pallets were than mixed and the concentration of functionalised AuNPs was determined by the Lambert–Beer law assuming a calculated molar absorptivity for the SPR peak (526 8 −1 nm) of 2.33×10 M 7. −1 cm . By diluting the resulting functionalised AuNPs solution (stock solution) with 10mM phosphate buffer pH 8 0.1M NaCl a final concentration of 15 nM was obtained and the colloidal solution was stored in the dark at 4ºC. 2.2.2.4 Synthesis of Nanoprobes (pH Assisted Method) 1. In a polypropylene 25 mL vial with a conical skirted base, the purified thiol-modified oligonucleotide was mixed with a ~15 nM AuNPs solution in a theoretical ratio of 1:200 (AuNP:oligos). 2. Then, 500mM sodium citrate pH 3 was added up to a final concentration of 20mM and let the solution rest for 30min. 3. Steps 4-7 of Salt-Aging Method were performed 2.2.2.5 Nanoprobes Stability Assays 1. A solution containing 15 nM Au-nanoprobe (Au-nanoprobe final concentration of 2.5 nM) and 10 mM phosphate buffer pH 8 alone was prepared by heating for 10 minutes at 95ºC and cool down for 10 minutes at 24 ºC 2. The solution was mixed with increasing concentrations of MgCl 2 solution to fulfil a total volume of 30 μL. 13 3. The solutions were transferred to microplate wells and UV-visible spectroscopic measurements were registered 30 minutes after salt addition in a microplate reader. 2.2.2.6 Non-cross-linking Detection Assays 1. Assay solutions containing the Au-nanoprobes and target DNA were prepared by mixing the appropriate DNA sample with the Au-nanoprobe solution (final concentration 2.5 nM), and by using 10 mM phosphate buffer pH 8 to fulfil the final volume. A blank solution was prepared by replacing the DNA for an equivalent volume of 10 mM phosphate buffer pH 8. 2. The solutions were heated for 10 min at 95ºC and then allowed to cool down for 10 minutes at 24 ºC. 3. The solutions were mixed with specific concentrations of MgCl 2 solutions to fulfil a total volume of 30 μL (Au-nanoprobe final concentration of 2.5 nM). 4. The solutions were transferred to microplate wells and UV-visible spectroscopic measurements were registered 30 minutes after salt addition in a microplate reader. 2.2.2.7 TEM Analysis Samples of AuNPs were sent to Instituto de Ciência e Engenharia de Materiais e Superfícies (ICEMS/IST), Portugal, for TEM analysis. The samples were prepared by depositing 10 μL of the asprepared colloidal suspensions in carbon copper grids, washing twice with 10 μL of Milli-Q water, and air dried. TEM was performed with a HITACHI H-8100 microscope operated at 200 kV. Particles size and shape were determined by analysing the TEM pictures using the imaging software Carnoy 2.0. 2.2.2.8 DLS Analysis The hydrodynamic diameter of AuNPs was determined by DLS. A total volume of 100 μL of 2.5 nM AuNPs was first stabilised for 15 minutes at 25ºC and then a total of 60 μL was measured for each sample. DLS analyses were performed at Departamento de Quimica (FCT\UNL). 14 15 3. RESULTS AND DISCUSSION 3.1 Design and Characterisation of inhA primers and probes 3.1.1 Primers and Probe Design RIF resistance is mostly characterised by mutations in rpoB gene, with special relevance to codon 531. The nucleotide sequences used for amplification and detection of this gene were previously described in literature by Veigas et al. (2010). The rpoB PCR primers used are specific for MTBC members, and the MTBC probe serves as second line MTBC identification. Using this probe, electrophoretic gel analysis is discarded, since it serves as indicator of PCR amplification (Veigas et al., 2010). The probe used for mutation discrimination within the rpoB gene harboured the mismatch at the 3’ nucleotide as it is the best discriminating position (Doria et al., 2007; Veigas et al., 2010). INH resistance in Portugal is characterised by mutation in inhA, namely in its promoter region. inhA primers were designed considering that they should flank the mutation site and that their melting temperatures (TM) should be similar to the ones from rpoB primers, thus allowing the amplification of both loci in parallel. When designing inhA amplicon size it was taken in consideration that it should be different enough from rpoB to allow electrophoretic gel analysis differentiation during development stage, and close enough to have similar hybridisation kinetics – inhA amplicon size was 248 bp and rpoB, 395 bp. The chosen inhA primer sequences flanked the mutation site and had similar primer melting temperatures to the rpoB primers – inhA primers TM was 62º and 63.5º; and rpoB primers TM was 63º and 66º. The inhA probe was also designed to harbour the mismatch at the 3’ nucleotide. 3.1.2 Target Preparation During the development stage of this work, DNA sequences of MTBC were required. In order to be independent from DNA extraction of limited biological samples, four plasmids were designed and cloned in collaboration with Faculdade Farmacia, UL, Portugal. These clones contained both WT and Mut sequences of inhA and rpoB genes. The first step of this thesis was to extract plasmid DNA from inhA -15 WT and inhA C-15T clones by alkaline lysis. The successful extraction was confirmed by electrophoretic analysis in agarose gel and by spectroscopy (Figure 3.1). Presence of a single absorbance peak at 260 nm indicated high purity of DNA without contaminants. A PCR reaction using inhA primers was optimised using different thermo cycler programs as well as different reagent concentrations. Both inhA WT and Mut PCR products were sequenced and mutation sites were confirmed (Figure 3.1 and Appendix A1). The PCR products were analysed by UV-Vis, the DNA concentration was calculated using Nanodrop ND-1000 (Nanodrop Technologies, USA) and the targets were used for Au-nanoprobes detection. 16 Figure 3.1 Electrophoretic analysis in 1% agarose gel of inhA WT and Mut plasmids (lane 2-3) and respective PCR products (lane 4-5) amplified with inhA primers (248 bp amplicon); lane 6 is the negative control 3.1.3 AuNPs Synthesis and Characterisation Citrate capped AuNPs, were synthesised to achieve a final average diameter of 14nm, as previously described in similar non-cross link approaches (Costa et al., 2010; Veigas et al., 2010). After synthesis, three different techniques were used to confirm the desired size. Firstly the UV-Vis spectrum was analysed and theoretical size was calculated using equation 3.1 (Haiss et al., 2007). Presence of a single 520 nm SPR peak indicates relatively monodisperse spherical particles and the calculated mean diameter was 13.5 nm. 𝑑=3 𝐴𝑏𝑠520 − 2.2 𝐴𝑏𝑠450 Equation 3.1 Equation to calculate AuNPs’ mean size using UV-Vis spectrum; d is the mean diameter and Abs is the absorbance value at the described wavelength (Haiss et al., 2007). Characterisation through DLS can also give information about AuNPs size. This technique is based on the differential scattering of colloids according to their Brownian movement in solution, which is directly related to the AuNPs size or, more precisely its hydrodynamic radius. The hydrodynamic radius of AuNPs is for instance affected by the molecules at its surface, either capping or functionalisation (Kato et al., 2009). The DLS analysis revealed an AuNPs mean diameter size of 17.4 nm (+ 0,415) which is higher than the previous calculated diameter (Figure 3.3). This can be explained by the citrate capping of the AuNPs that lead to an increase in its hydrodynamic radius. The DLS result for this reason converges with calculated UV-Vis spectrum size, indicating the expected AuNPs size. The third method used for the characterisation of AuNPs was TEM. This method allowed the direct visualisation of the AuNPs core and shape and the definite confirmation of their size. Ten random pictures were taken and nanoparticle size was measured representing a total of 387 counted 17 AuNPs. The expected size and shape were confirmed, with mean a diameter of 13.9 nm (+ 1.7 nm) spherical AuNPs (Figure 3.2). A) B) TEM Analysis Nanoparticle counts 120 100 80 60 40 20 0 9 10 11 12 13 14 15 16 17 18 19 20 Diameter (nm) Figure 3.2 Characterisation of AuNPs by TEM; A) TEM picture of spherical nanoparticles with approximate 14 nm diameter size; B) histogram of analysed particles by measured diameter, with a mean diameter of 13.9 nm (+ 1.7 nm) 3.1.4 Au-nanoprobes Characterisation After guaranteeing the desired size and shape of the AuNPs, functionalisation was performed using inhA -15 WT and inhA C-15T probe sequences with salt aging method. Three different approaches were used to confirm functionalisation. Firstly, both UV-Vis spectra were analysed and a shift in the SPR peak was observed from 520 nm to 525 nm, meaning an increase in the hydrodynamic radiuses. To prove this the probes were analysed by DLS, which confirmed an increase in diameter from 17.4 nm (+ 0,415) to 31 nm (+ 0,807) and 29.5 nm (+ 0,283) for WT and Mut probes respectively (Figure 3.3). Assuming that the distance between dsDNA base pairs is 0.34 nm (Watson and Crick, 1953) and knowing that the probe has 20 nucleotides, an increase of 13.6 nm in the hydrodynamic diameter would be expected (6.8 nm for each side). Considering also that the citrate capping is removed during functionalisation, 14 nm diameter gold core plus 13.6 nm of oligonucleotides should have approximately 27.6 nm. The difference between expected values and experimental values can be explained by: the thiol group size being ignored; Watson and Crick’s model referring to dsDNA while the probes are ssDNA; or by the solvation around AuNPs. 18 Frequency (%) DLS Analysis 25 AuNPs 20 inhA -15 WT 15 inhA C-15T 10 5 0 0 10 20 30 40 50 60 70 80 Diameter (nm) Figure 3.3 DLS Analysis of AuNPs and Au-nanoprobes; an increase in hydrodynamic radius is observed in both probes, when compared to naked particles from 17.4 nm (+ 0,415) to 31 nm (+ 0,807) and 29.5 nm (+ 0,283). The quality of the data was assessed through the auto-correlation curves of the three measurements represented in Appendix A2 The last evidence of functionalisation was the increase in AuNPs colloidal stability in solution. Citrate capped AuNPs easily aggregate in the presence of salts that increases the ionic strength in solution. After functionalisation, the oligonucleotides protect the AuNPs from aggregation maintaining their stability at higher salt concentrations (Sato et al., 2003). A series of stability assays were made and it was observed that the maximum shift in SPR peak was 570 nm, hence defining this wavelength as reference for AuNPs aggregated species. The 30 mM concentration of MgCl2 was defined as fully aggregating both probes, since the ratio between 525nm (SPR peak for dispersed particles) and 570 nm was less than 1. This threshold was set to define whether there were more dispersed or aggregated nanoparticles in solution (Figure 3.4). Stability Assays Abs525 / Abs570 1.6 inhA -15 WT probe 1.5 inhA C-15T probe 1.4 1.3 1.2 1.1 1 0.9 0 10 20 30 40 MgCl2 (mM) Figure 3.4 Au-nanoprobes stability assays at various concentrations of MgCl2. The abs 525 nm / 570 nm ratio was calculated and for values lower than 1 the nanoprobes were considerate full aggregated. For both WT and Mut probes 30 mM of MgCl2 was set as the concentration for full aggregation. 19 3.1.5 Au-nanoprobes Calibration Once proven the functionalisation of the AuNPs it was necessary to demonstrate their capacity to detect complementary targets and to discriminate single base mismatches. Synthetic oligonucleotides were firstly used since they are single stranded and have a high level of purity with much less interferents than PCR products. It was observed an increase in AuNPs stability upon hybridisation with a complementary target. This stabilisation effect is due to the steric hindrance created around AuNPs, since the synthetic oligonucleotides have not only a complementary region but also a ~20 bp tail. The formation of dsDNA structures, more rigid than ssDNA (Li and Rothberg, 2004) with oligonucleotide tails shields the AuNPs, reducing the probability of aggregation and increasing their stability. As the main scope of the thesis was to discriminate single base mismatches (point mutations related to drug resistance), the AuNPs’ efficiency toward discrimination of mismatched targets was also tested. The stated hypothesis was that mismatched targets would not stabilise AuNPs as much as full complementary targets. This proved to be correct with more Au-nanoprobes aggregated in the presence of mismatch targets than full complementary targets. This can be explained due to higher dissociation constants of mismatch targets conferring less protection to Au-nanoprobes in high ionic strength (Doria et al., 2007). The next step was to demonstrate the capacity of Au-nanoprobes to discriminate mutations using PCR products. Detection assays 1.4 Abs525 / Abs570 1.35 1.3 inhA -15 WT Probe 1.25 inhA C-15T Probe 1.2 1.15 1.1 1.05 1 0.95 0.9 Probe Blank inhA -15 WT inhA C-15T Non-Comp. Target Figure 3.5 Au-nanoprobes detection assays using 30 µg/mL of PCR product; 30mM of MgCl2 was used in all assays except from Probe; in Blank and Probe assays, no DNA was added. Higher stabilisation is observed in probes in presence of full complementary targets than single base mismatched. Several components of PCR interfere with Au-nanoprobes stability, such as salts, dNTPs and proteins (Eichmann and Bevan, 2010; Zhao et al., 2007). In order to remove these interferents the same volume of PCR product was added to each assay. Three replicate assays were performed for each probe. This way, the only variability between assays that had the same PCR product was the 20 probe used. The Au-nanoprobes then proved to be capable of discriminating single mutation in PCR products (Figure 3.5). Several concentrations of both targets were plotted using both probes in order to determine the best concentration for mismatch discrimination (Figure 3.6). The results showed a direct correlation between target concentration and Au-nanoprobes stability, where higher concentrations resulted in higher stability. This effect was more prominent when the probe and the target were fully complementary compared with mismatch cases. This can be explained by the different dissociation constants of DNA between full hybridised complementary sequences and mismatched ones. The range between ~20 µg/mL and ~50 µg/mL of target DNA set the lower and upper thresholds of DNA discriminative concentration. As 30 µg/mL presented the highest discriminating capacity for both probes, was used in the following assays. Abs525 / Abs570 A) inhA -15 WT Target inhA C-15T Target B) 1.4 1.4 1.3 1.3 1.2 1.2 inhA -15 WT probe 1.1 1 inhA C-15T probe 0.9 inhA -15 WT probe 1.1 1 inhA C-15T probe 0.9 0 10 20 30 40 50 Target Concentration (µg/mL) 60 0 10 20 30 40 50 Target Concentration (µg/mL) 60 Figure 3.6 Optimisation of PCR product concentration for Au-nanoprobes discrimination assay. Various concentrations of A) inhA -15 WT target and B) inhA C-15T target were tested with inhA probe set. All assays were performed with 30 mM of MgCl2. The ratio between absorbance at 525 nm and 570 nm was calculated and a range between ~20 µg/mL and ~50 µg/mL allowed discrimination between WT and Mut targets; 30µg/mL was defined as the best discriminative concentration 3.2 Dual Loci Characterisation 3.2.1 Au-nanoprobes Synthesis Method The salt aging method is long known and established, for functionalisation of AuNPs. However, functionalisation takes two days due to an overnight incubation during the process. Zhang et al. (2012) recently described a pH-assisted method for the functionalisation of AuNPs that takes just one day with the same results (Zhang et al., 2012). I tested this new method against the standard method to assess its applicability. Four MTBC probes were synthesised using the pH assisted synthesis protocol, with four theoretical ratios of AuNP:oligos – 1:50, 1:100, 1:150 and 1:200. During synthesis the 1:50 ratio probe aggregated and was therefore discarded from further tests. The other three probes were characterised and it was observed an increase in stability for higher functionalisation ratios, proving a growing density of oligos per nanoparticle (Figure 3.7). 21 Stability assays 2.4 Abs525 / Abs570 2.2 Controlo 2 Racio 1:100 1.8 Racio 1:150 1.6 Racio 1:200 1.4 1.2 1 0.8 0 5 10 15 20 MgCl2 (mM) 25 30 Figure 3.7 Au-nanoprobes stability assays for pH-assisted synthesis; the following concentrations of MgCl2 were defined as the minimum to aggregate: Control, 20mM; Ratio 1:200, 17mM; Ratio:1:150, 12mM; Ratio 1:100 10mM Synthetic oligos and rpoB PCR products were then used for detection assays. A MTBC probe used as control was synthesised using the salt-aging method for method comparison. The results suggest a slightly higher stability when using a 1:200 ratio to discriminate between MTBC and nonMTBC, however there was no statistically significant difference between any of the three studied ratios and the control (Figure 3.8). Curiously, the stability also increased with non-complementary targets along with the decrease in ratio functionalisation. This can be explained by unspecific DNA adsorption to Au-nanoprobes since they are less functionalised, that stabilises the nanoparticles. As no significant advantage was observed in using this new method of synthesis, all further assays were performed with salt-ageing synthesised probes. Abs525 / Abs570 MTBC Probe 1.6 Control 1.5 ratio 1:200 1.4 ratio 1:150 1.3 ratio 1:100 1.2 1.1 1 0.9 MTBC Non-Compl. Target Figure 3.8 Au-nanoprobe detection assays using MTBC probe synthesised by pH assisted method with different ratios; the control probe was synthesised by salt-aging method; a complementary (MTBC) and a non-complementary target were used; for each probe the minimum salt concentration for aggregation was assayed and used (Figure 3.7). No statically significant difference was observed between probes 22 3.2.2 Multiplex PCR In order to simplify the method of DNA amplification and to reduce time and costs, a multiplex PCR approach was tested. The aim was to amplify the two most relevant loci associated with RIF and INH resistance in a single reaction, and test the capacity to discriminate both mutations in parallel. All the previous work of production and characterisation of targets and probes was repeated using MTBC, rpoB WT and rpoB Mut sequences. AuNPs were functionalised, characterised and tested to guarantee accurate discrimination. Multiplex PCR reactions were performed with both pairs of primers and twice the concentration of dNTPs. To prove it was possible to assess both loci, four reactions were prepared with the four possible combinations between WT and Mut templates of inhA and rpoB plasmids. Amplification of both templates was confirmed by agarose gel electrophoresis and similar intensities in both codons were observed (Figure 3.9). This demonstrates that the primers were accurately designed to have similar yields, since the same concentration of both templates was used, and the same amount of product was achieved. 1 2 3 4 WT WT WT Mut 5 6 7 8 9 10 500 bp 250 bp rpoB 531 inhA -15 ‒ ‒ Mut Mut Wt Mut WT – Mut – – – WT Mut Figure 3.9 Electrophoretic analysis in 1% agarose of the four combinations of rpoB and inhA multiplex PCR products (lane 3-6) and simplex products (lane 7-8 for rpoB and lane 9-10 for inhA); lane 1 is the negative control 3.2.3 Target Concentration for Detection Assays The optimal concentration of PCR amplified target for discrimination between WT and Mut sequences of rpoB locus was described in the literature as 30 µg/mL (Veigas et al., 2010); this concentration also proved to be the best for inhA locus. Since both amplicons showed similar amplification yields, a 60 µg/mL of multiplex PCR products was used in the detection assays. The four multiplex PCR products above mentioned were tested with both inhA and rpoB probe sets to confirm its ability to detect the desired mutations in parallel. In all cases the mutations were correctly assessed, with probes stabilising more in the presence of full complementary targets 23 compared to single base mismatched ones (Figure 3.10). However it was noted an overall decrease in stability, which can be explained by the volume of PCR product used in the assays. As twice the target concentration was needed, in general twice the volume of PCR product was added to each detection assay, resulting in twice the concentration of salts. Since no adjustment to the 30mM MgCl2 was done, multiplex PCR detection assays had more salts than simplex assays, leading to a general destabilisation of Au-nanoprobes (compare Figure 3.5 with Figure 3.10). A) B) rpoB 531 1.2 rpoB WT probe rpoB Mut probe 1.15 Abs525 / Abs570 inhA -15 1.2 inhA WT Probe inhA Mut probe 1.15 1.1 1.1 1.05 1.05 1 1 0.95 0.95 rpoB WT inhA WT rpoB Mut inhA WT rpoB WT inhA Mut rpoB Mut inhA Mut rpoB WT rpoB Mut rpoB WT rpoB Mut inhA WT inhA WT inhA Mut inhA Mut Multiplex PCR Product Multiplex PCR Product Figure 3.10 Au-nanoprobe detection assays of multiplex PCR products. The four combinations of WT and Mut sequences of inhA -15 and rpoB 531 were tested with A) rpoB 531 probe set and B) inhA -15 probe set. The absorbance ratio 525 nm / 570 nm is used to assess the level of aggregation. For all combinations the correct genotype was assessed. Through electrophoretic analysis in agarose gel, it was noted in some cases a difference in amplification yield of both amplicons, which can be explained by the stochastic characteristics of PCR and/or by different plasmid template DNA in the reaction (Figure 3.11 A). For such cases Aunanoprobe detection was performed and despite the lower concentration of one of the amplicons it was still possible to accurately assess mutations (Figure 3.11 B, C). The reason for this is, as show in Figure 3.6, that mutation detection is possible when using between ~20 µg/mL and ~50 µg/mL of target DNA. Therefore, an accurate result can be obtained even in these cases despite the variability in PCR amplifications.. 24 A) 1 2 3 4 5 6 400 bp 400 bp 300 bp 300 bp 200 bp 200 bp 100 bp 100 bp rpoB 531 inhA -15 WT WT WT Mut B) WT Mut Mut Mut C) rpoB 531 1.2 Abs525 / Abs570 1.15 inhA -15 rpoB WT probe inhA WT probe rpoB Mut probe inhA Mut probe 1.1 1.05 1 0.95 WT WT WT Mut WT Target Mut Mut Mut Target Figure 3.11 Au-nanoprobe detection using unbalanced multiplex PCR products. A) electrophoretic analysis in 1% agarose gel of four unbalanced products, two with higher amplification of inhA amplicon (lane 2-3) and two with higher amplification of rpoB amplicon (lane 4-5), lane 1 and 6 are molecular rulers; B) Au-nanoprobe detection assays using the products from lanes 2-5 respectively, with rpoB 531 probeset and C) inhA -15 probeset It was already proven that non-complementary PCR products do not interfere with the hybridisation of fully complementary targets in the Au-nanoprobes assays (Veigas, 2009). In this work it was shown that the capacity to detect single base mismatches is also unaffected by a noncomplementary target since a second amplicon did not interfere with the results accuracy. The capacity of Au-nanoprobes to detect single mutations is also unaffected by unbalanced multiplex amplifications, as long as the minimum discriminative concentration is present in the assays. 25 3.2.4 Data Analysis Aggregation profiles were analysed in terms of the ratio of Abs 525 nm / Abs 570 nm (dispersed vs. aggregated species) for each Au-nanoprobe. A threshold of 1 can be considered where values > 1 indicate that the Au-nanoprobes are mostly non-aggregated, whereas a value < 1 indicates aggregation. For the MTBC Au-nanoprobe, this approach indicates the presence or absence of MTBC DNA in the sample, serving as MTBC identifier and amplification sensor. In contrast, when using a set of Au-nanoprobes targeting WT and Mut sequences, the result is given by two probes, one fully complementary with the WT sequence and another with the Mut sequence. The most stable probe, which has a higher ratio of Abs 525 nm / Abs 570 nm in the presence of the target, sets the result. To assess two loci, it is necessary to analyse four values compared in pairs, so a simpler approach was used to ease results readout: the ratio between the Abs 525 nm / Abs570 nm value for the WT probe was divided by the ratio of the Mut probe (Equation 3.2). Abs525 Abs570 X= Abs525 Mut Abs570 WT Equation 3.2 Ratio of WT \ Mut Au-nanoprobes. The absorbance ratio (525 nm / 570 nm) of WT probe is divided by the absorbance ratio of the Mut probe. When X > 1 the WT probe is more stable and when X < 1 the Mut is more stable Values >1 identify assays in which the WT probe was more stable than Mut probe, and thus the sample presented the WT sequence; whereas values <1 indicate the presence of mutation. With this approach the previous four values readout is reduce to a two values readout with a threshold of one. To exemplify the easiness of the read, the data of Figure 3.9 B was analysed using this approach (Figure 3.12). A) B) rpoB 531 Ratio WT / Ratio Mut 1.06 inhA -15 1.04 1.02 1 0.98 0.96 0.94 0.92 WT WT WT Target Mut WT Mut Mut Mut Target Figure 3.12 Analysis of data using ratio of WT and Mut probes; A) and B) represent data from Figure 3.11 B,C analysed using Equation 3.2; values higher than one are considerate WT (in white) and lower Mut (in black) 26 3.2.5 Detection and Characterisation of Samples A methodology was then designed for the assessment of MTBC members, inhA -15 and rpoB 531 mutations, consisting on a multiplex PCR and testing the products with the MTBC Au-nanoprobe; if the result returns negative (blue), no further testing is required since it is probably not TB. The test only fails if nucleic acids amplification is under the limit of detection, or in atypical TB; if the result returns positive (red), the two loci are evaluated to search for possible resistances (Figure 3.13). Figure 3.13 Schematics of multiplex PCR and Au-nanoprobes colorimetric detection. The two most relevant loci are amplified and MTBC probe is tested, then two sets of probes assess for mutations. The solutions spectra are taken and the stable probe (red), is compared with the unstable probe (blue) to set the result. In this case the sample would be MTBC positive and WT for both loci To prove the capacity of the methodology in a laboratory set up, biological samples where used. Mycobacterium DNA was extracted from sputum samples in collaboration with Prof. Miguel Viveiros and Prof. Isabel Couto from Grupo de Micobactérias, at Instituto de Higiene e Medicina Tropical (IHMT/UNL), Portugal. Hence two known samples – a M. tuberculosis reference sample and a M. kansasii (non-MTBC) – were successfully amplified and tested with the MTBC probe. The M. kansasii sample returned negative and the M. tuberculosis returned positive, further being used as negative and positive controls (Figure 3.14 A). For the M.tuberculosis sample, inhA -15 and rpoB 531 mutations were also evaluated; as expected the sample had a WT genotype for both loci that was confirmed by sequencing analysis (Figure 3.14 B). 27 A) B) MTBC Probe M. tuberculosis 1.2 Ratio WT / Ratio Mut Abs525 / Abs570 1.2 1.15 1.1 1.05 1 0.95 1.15 1.1 1.05 1 0.95 M. tuberculosis M. kansasii Sample inhA -15 rpoB 531 Locus Figure 3.14 Au-nanoprobes detection of negative and positive controls; A) MTBC probe was tested with the multiplex PCR product of M.tuberculosis sample and M. kansasii sample; B) M.tuberculosis multiplex PCR product was tested using inhA -15 and rpoB 531 probesets, the ratio of WT \ Mut probes was calculated; positive results are in white and negative in black For the proof-of-concept, a set of 25 DNA samples with susceptible and resistant genotypes were blindly tested with this methodology. The Mycobacterium DNA was extracted from pre-cultured sputum; the samples were amplified by multiplex PCR and the results were all positive when tested with the MTBC probe. Interestingly the two samples with lowest values of detection (1 and 21) were the ones with faintest PCR amplification. This means that a greater volume of PCR product was added to the assays to reach a concentration of 30 µg/mL. Consequently the Au-nanoprobes got more unstable due to salts in PCR that were not taken into account (Figure 3.15). MTBC 1.3 Abs525 / Abs570 1.25 1.2 1.15 1.1 1.05 1 0.95 0.9 PC NC 1 2 3 4 5 6 7 8 9 10 11 12 13 14 15 16 17 18 19 20 21 22 23 24 25 Sample Figure 3.15 Multiplex PCR products tested with MTBC probe where PC is the positive control and NC the negative control. The threshold of 1 sets the result; positive values are in white and negative in black Then inhA and rpoB probesets were used to assess the two relevant mutations (Appendix A3). For the rpoB 531 mutation, 3 samples had ratios of WT / Mut close to one (1 + 0.005), meaning that 28 the stability values for WT probes were almost the same as Mut probes, leading to inconclusive results (samples 3, 15, 25). The rpoB S531L mutation was detected in 9 samples indicating a profile of RIF resistance and the remaining samples were considered susceptibility with a WT genotype (Figure 3.16 A). For inhA -15 mutation, 4 ratios had values close to one, lacking a conclusive result (samples 9, 13, 18, 24). The inhA C-15T mutation was detected in 8 samples indicating a profile of INH resistance and the remaining samples were considerate WT with INH susceptibility (Figure 3.16 B). It is noteworthy that this genotyping analysis gives only an indication of the phenotype and not a definitive profile of resistance. A) rpoB 531 Ratio Wt / Ratio Mut 1.15 1.1 1.05 1 0.95 0.9 0.85 1 2 3 4 5 6 7 8 9 10 11 12 13 14 15 16 17 18 19 20 21 22 23 24 25 Samples B) inhA -15 Ratio Wt / Ratio Mut 1.15 1.1 1.05 1 0.95 0.9 0.85 1 2 3 4 5 6 7 8 9 10 11 12 13 14 15 16 17 18 19 20 21 22 23 24 25 Samples Figure 3.16 Au-nanoprobe assays of the 25 samples where the ratio of WT probe was divided by the Mut probe; A) probe set ratio of rpoB 531, were values >1 indicate a WT genotype (in black) and <1 a Mut genotype (in white); B) the same approach used for inhA -15 probe set. The samples were tested with a commercial line probe assay screening test and with a liquid medium culture system (performed at Grupo de Micobácterias, IHMT). Comparing the Au-nanoprobes system results with the line probe assay a 100% concordance was attained for the MTBC probe, rpoB and inhA probesets. Also the 7 inconclusive results from both loci turned out to be correctly assessed showing that the threshold for undefined results (1 + 0.005) was incorrectly set. Meaning that despite being near 1, all ratios WT / Mut were accurate. It should be mentioned, that the Au-nanoprobe 29 strategy described is capable of the same level of detection but with reduced time, and costs, thus speeding up diagnostics. Interestingly within 11 mutated samples, 9 had both mutations, 1 had only inhA C-15T and 1 had only rpoB S531L showing that these mutations are correlated and tend to appear simultaneously between these mutations in the tested population, as it was previously describe in literature (Viveiros, 2005). The liquid medium culture analysis assessed the profile resistance of RIF and INH of the 25 samples. For RIF resistance all samples were in concordance with the assessed genotype, with 10 RIF resistant strains and 15 susceptible. For INH resistance, 14 samples showed resistance including the 10 inhA C-15T samples, and representing an accuracy of 84%. The four INH resistant samples that showed no inhA C-15T were sequenced and two mutations in katG locus were found, G494A (sample 3) and S315T (samples 4 and 6). In sample 13, no known mutation was detected, possibly representing a strain with an unknown mechanism of resistance (Table 3.1). As it was early explained, rpoB mutations are straightly related with RIF resistance, most precisely codon 531, as this study also corroborates. Mutations in inhA usually represent half of the INH resistant cases but not in the Lisbon Region where there is a higher incidence of this mutation, as the studied population demonstrates. These results indicate, once again, that the chosen mutations are the most relevant for RIF and INH resistance in Lisbon Region. Table 3.1 Phenotypes and genotypes of the tested samples, using liquid medium culture, line probe assay and Au-nanoprobe assay methods RIF/INH Line Probe rpoB/inhA Au-nanoprobe rpoB/inhA R/R +/+ +/+ 2 S/S -/- -/- 3 S/R -/- -/- katG G494A 4 R/R +/- +/- katG S315T 5 R/R +/+ +/+ 6 S/R -/- -/- 7 S/S -/- -/- 8 S/S -/- -/- 9 S/S -/- -/- 10 R/R +/+ +/+ 11 S/S -/- -/- 12 R/R +/+ +/+ 13 S/R -/- -/- 14 S/S -/- -/- Sample 1 Culture 15 S/S -/- -/- 16 R/R +/+ +/+ 17 R/R +/+ +/+ 18 S/R -/+ -/+ 19 S/S -/- -/- 20 S/S -/- -/- 21 S/S -/- -/- Other Mutations katG S315T Not found 30 22 S/S -/- -/- 23 R/R +/+ +/+ 24 R/R +/+ +/+ 25 R/R +/+ +/+ Note: R – Resistant; S – Susceptible; (+) – Mut; (-) – WT 31 4. CONCLUSION In this study, the already described method for the characterisation of rpoB mutations was successfully ported to the inhA C-15T mutation, hence allowing the complete characterisation of a new set of probes. The minimum salt concentration that induced both probes aggregation was defined at 30 mM of MgCl2 as well as the best discriminating contraction between WT and Mut sequences using PCR product, 30 µg/mL. The advantages of using the pH assisted method for probe synthesis were not confirmed and consequently all probes were synthesised using the salt-aging method. It was also demonstrated a two-step approach based on the simultaneous PCR amplification of the two loci of interest followed by Au-nanoprobes characterisation of the molecular alterations involved in MDR-TB. These two mutations are particular to a specific geographic location with an uncommon and particular genotypic profile of MDR-TB, but clearly demonstrate the potential of the strategy for application to other clinical settings. A new method of data analysis was also proposed to simplify results read reducing the analysis of both codons from 4 values to 2 values. The Au-nanoprobe system proved to be capable of sensitive and specific detection of MTBC members and mutations associated with RIF and INH resistance, while being easy to perform without the need for expensive and complex laboratory set up. Following PCR amplification, the Au-nanoprobe system takes only 50 minutes to yield a colorimetric result that can be easily coupled to a portable device/platform that allows the analysis at a peripheral laboratory or in the field (Silva et al., 2011). However, this method does not solve all the problems, remaining some issues to overcome. Based on DNA genotyping it shares the same problems of all DNA molecular methods, namely: the characterisation of the genotype and not the phenotype, which are discordant in some cases; and not stating the cellular viability of the microorganisms. It still depends on nucleic acid amplification that requires lab technicians and routine lab material. Despite that, this technique proved to be as robust as others in the market, and bypassed a limiting factor, the cost, since the materials used have the potential to greatly lower the price of the final product, making it available at point-of-care. 32 33 REFERENCES Alexander, C. M., Dabrowiak, J. C. & Goodisman, J. 2013. Gravitational sedimentation of gold nanoparticles. Journal of colloid and interface science 396:53-62. ATS, CDC & IDSA 2003. Treatment of Tuberculosis. American Journal of Respiratory and Critical Care Medicine 167:603-662. Banerjee, R., Schecter, G. F., Flood, J. & Porco, T. C. 2008. Extensively drug-resistant tuberculosis: new strains, new challenges. Expert Review of Anti-infective Therapy 6:713-724. Baptista, P., Doria, G., Henriques, D., Pereira, E. & Franco, R. 2005. Colorimetric detection of eukaryotic gene expression with DNA-derivatized gold nanoparticles. Journal of biotechnology 119:111-117. Baptista, P. V., Koziol-Montewka, M., Paluch-Oles, J., Doria, G. & Franco, R. 2006. Gold-nanoparticleprobe-based assay for rapid and direct detection of Mycobacterium tuberculosis DNA in clinical samples. Clinical chemistry 52:1433-1434. Baptista, P. V., Pereira, E., Eaton, P., Doria, G., Miranda, A., Gomes, I., Quaresma, P. & Franco, R. 2008. Gold nanoparticles for the development of clinical diagnosis methods. Analytical and bioanalytical chemistry 391:943-950. Costa, P., Amaro, A., Botelho, A., Inacio, J. & Baptista, P. V. 2010. Gold nanoprobe assay for the identification of mycobacteria of the Mycobacterium tuberculosis complex. Clinical microbiology and infection : the official publication of the European Society of Clinical Microbiology and Infectious Diseases 16:1464-1469. Debnath, B., Shashank, S., Niraj, S., Ankesh, K. & Seung-Hwan, J. 2009. Nanotechnology, Big things from a Tiny World: a Review. International Journal of u- and e- Service, Science and Technology 2. Doria, G., Franco, R. & Baptista, P. 2007. Nanodiagnostics: fast colorimetric method for single nucleotide polymorphism/mutation detection. IET Nanobiotechnology 1:53-57. Dorman, S. E. 2010. New Diagnostic Tests for Tuberculosis: Bench, Bedside, and Beyond. Clinical Infectious Diseases 50:S173-S177. Dreaden, E. C., Alkilany, A. M., Huang, X., Murphy, C. J. & El-Sayed, M. A. 2012. The golden age: gold nanoparticles for biomedicine. Chemical Society reviews 41:2740-2779. Eichmann, S. L. & Bevan, M. A. 2010. Direct Measurements of Protein-Stabilized Gold Nanoparticle Interactions. Langmuir : the ACS journal of surfaces and colloids 26:14409-14413. Eustis, S. & El-Sayed, M. A. 2006. Why gold nanoparticles are more precious than pretty gold: noble metal surface plasmon resonance and its enhancement of the radiative and nonradiative properties of nanocrystals of different shapes. Chemical Society reviews 35:209-217. Haiss, W., Thanh, N. T., Aveyard, J. & Fernig, D. G. 2007. Determination of size and concentration of gold nanoparticles from UV-vis spectra. Analytical chemistry 79:4215-4221. 34 Huang, X., Jain, P. K., El-Sayed, I. H. & El-Sayed, M. A. 2007. Gold nanoparticles: interesting optical properties and recent applications in cancer diagnostics and therapy. Nanomedicine 2:681693. Ji, X., Song, X., Li, J., Bai, Y., Yang, W. & Peng, X. 2007. Size Control of Gold Nanocrystals in Citrate Reduction: The Third Role of Citrate. Journal of the American Chemical Society 129:1393913948. Kato, H., Suzuki, M., Fujita, K., Horie, M., Endoh, S., Yoshida, Y., Iwahashi, H., Takahashi, K., Nakamura, A. & Kinugasa, S. 2009. Reliable size determination of nanoparticles using dynamic light scattering method for in vitro toxicology assessment. Toxicology in Vitro 23:927934. Laxminarayan, R., Klein, E. Y., Darley, S. & Adeyi, O. 2009. Global Investments In TB Control: Economic Benefits. Health Affairs 28:w730-w742. Lee, P. C. & Meisel, D. 1982. Adsorption and surface-enhanced Raman of dyes on silver and gold sols. The Journal of Physical Chemistry 86:3391-3395. Li, H. & Rothberg, L. 2004. Colorimetric detection of DNA sequences based on electrostatic interactions with unmodified gold nanoparticles. Proceedings of the National Academy of Sciences of the United States of America 101:14036-14039. Love, J. C., Estroff, L. A., Kriebel, J. K., Nuzzo, R. G. & Whitesides, G. M. 2005. Self-Assembled Monolayers of Thiolates on Metals as a Form of Nanotechnology. Chemical reviews 105:1103-1170. Machado, D., Perdigao, J., Ramos, J., Couto, I., Portugal, I., Ritter, C., Boettger, E. C. & Viveiros, M. 2013. High-level resistance to isoniazid and ethionamide in multidrug-resistant Mycobacterium tuberculosis of the Lisboa family is associated with inhA double mutations. The Journal of antimicrobial chemotherapy 68:1728-1732. Mazurek, G. H., Zajdowicz, M. J., Hankinson, A. L., Costigan, D. J., Toney, S. R., Rothel, J. S., Daniels, L. J., Pascual, F. B., Shang, N., Keep, L. W. & LoBue, P. A. 2007. Detection of Mycobacterium tuberculosis Infection in United States Navy Recruits Using the Tuberculin Skin Test or Whole-Blood Interferon-γ Release Assays. Clinical Infectious Diseases 45:826836. McMurray, D. N. 1996. Mycobacteria and Nocardia. In Medical Microbiology (BARON, S. eds), 4th ed., University of Texas Medical Branch at Galveston, Galveston, Texas. Miller, L. P., Crawford, J. T. & Shinnick, T. M. 1994. The rpoB gene of Mycobacterium tuberculosis. Antimicrobial Agents and Chemotherapy 38:805-811. Mitchison, D. A. & Nunn, A. J. 1986. Influence of initial drug resistance on the response to shortcourse chemotherapy of pulmonary tuberculosis. The American review of respiratory disease 133:423-430. Musser, J. M. 1995. Antimicrobial agent resistance in mycobacteria: molecular genetic insights. Clinical Microbiology Reviews 8:496-514. 35 Parsons, L. M., Somoskövi, Á., Gutierrez, C., Lee, E., Paramasivan, C. N., Abimiku, A. l., Spector, S., Roscigno, G. & Nkengasong, J. 2011. Laboratory Diagnosis of Tuberculosis in Resource-Poor Countries: Challenges and Opportunities. Clinical Microbiology Reviews 24:314-350. Sato, K., Hosokawa, K. & Maeda, M. 2003. Rapid aggregation of gold nanoparticles induced by noncross-linking DNA hybridization. Journal of the American Chemical Society 125:8102-8103. Sato, K., Hosokawa, K. & Maeda, M. 2005. Non-cross-linking gold nanoparticle aggregation as a detection method for single-base substitutions. Nucleic acids research 33:e4. Silva, L. B., Veigas, B., Doria, G., Costa, P., Inacio, J., Martins, R., Fortunato, E. & Baptista, P. V. 2011. Portable optoelectronic biosensing platform for identification of mycobacteria from the Mycobacterium tuberculosis complex. Biosensors & bioelectronics 26:2012-2017. Silva, P. E. & Palomino, J. C. 2011. Molecular basis and mechanisms of drug resistance in Mycobacterium tuberculosis: classical and new drugs. The Journal of antimicrobial chemotherapy 66:1417-1430. Telenti, A., Imboden, P., Marchesi, F., Matter, L., Schopfer, K., Bodmer, T., Lowrie, D., Colston, M. J. & Cole, S. 1993. Detection of rifampicin-resistance mutations in Mycobacterium tuberculosis. The Lancet 341:647-651. Veigas, B., Doria, G. & Baptista, P. V. 2012. Nanodiagnostics for Tuberculosis. In Understanding Tuberculosis - Global Experiences and Innovative Approaches to the Diagnosis (CARDONA, P.-J. eds), InTech. Veigas, B., Machado, D., Perdigao, J., Portugal, I., Couto, I., Viveiros, M. & Baptista, P. V. 2010. Aunanoprobes for detection of SNPs associated with antibiotic resistance in Mycobacterium tuberculosis. Nanotechnology 21:415101. Veigas, B. 2009. Au-Nanossondas Aplicação na detecção de Mycobacterium tuberculosis e Plasmodium berghei. Master Thesis. Faculdade de Ciências e Tecnologia, Universidade Nova de Lisboa. Vilcheze, C. & Jacobs, W. R., Jr. 2007. The mechanism of isoniazid killing: clarity through the scope of genetics. Annual review of microbiology 61:35-50. Viveiros, M., Martins, M., Couto, I., Rodrigues, L., Machado, D., Portugal, I. & Amaral, L. 2010. Molecular tools for rapid identification and novel effective therapy against MDRTB/XDRTB infections. Expert Review of Anti-infective Therapy 8:465-480. Viveiros, M., Leandro, C., Rodrigues, L., Almeida, J., Bettencourt, R., Couto, I., Carrilho, L., Diogo, J., Fonseca, A., Lito, L. Lopes, J., Pacheco, T., Pessanha, M., Quirim, J., Sancho, L., Salfinger, M., & Amaral, L. 2005. Direct Application of the INNO-LiPA Rif.TB Line-Probe Assay for Rapid Identification of Mycobacterium tuberculosis Complex Strains and Detection of Rifampin Resistance in 360 Smear-Positive Respiratory Specimens from an Area of High Incidence of Multidrug-Resistant Tuberculosis. Journal of Clinical Microbiology 43:4880-4884. Viveiros, M., Portugal, I., Bettencourt, R., Victor, T. C., Jordaan, A. M., Leandro, C., Ordway, D. & Amaral, L. 2002. Isoniazid-Induced Transient High-Level Resistance in Mycobacterium tuberculosis. Antimicrobial Agents and Chemotherapy 46:2804-2810. 36 Wallis, R. S., Pai, M., Menzies, D., Doherty, T. M., Walzl, G., Perkins, M. D. & Zumla, A. 2010. Biomarkers and diagnostics for tuberculosis: progress, needs, and translation into practice. The Lancet 375:1920-1937. Watson, J. D. & Crick, F. H. 1953. Molecular structure of nucleic acids; a structure for deoxyribose nucleic acid. Nature 171:737-738. WHO 2009. New laboratory diagnostic tools for tuberculosis control. Accessed at July 2013. http://www.who.int/tdr/publications/documents/diagnostic-tool-tb.pdf. WHO 2012. Global Tuberculosis Report 2012. Geneva, Swiss Zhang, X., Servos, M. R. & Liu, J. 2012. Instantaneous and Quantitative Functionalization of Gold Nanoparticles with Thiolated DNA Using a pH-Assisted and Surfactant-Free Route. Journal of the American Chemical Society 134:7266-7269. Zhang, Y., Heym, B., Allen, B., Young, D. & Cole, S. 1992. The catalase peroxidase gene and isoniazid resistance of Mycobacterium tuberculosis. Nature 358:591-593. Zhao, W., Lee, T. M. H., Leung, S. S. Y. & Hsing, I. M. 2007. Tunable Stabilization of Gold Nanoparticles in Aqueous Solutions by Mononucleotides. Langmuir 23:7143-7147. 37 APPENDIX A1 Results of the DNA sequencing analysis plus primers inhA amplification sequence CCTCGCTGCCCAGAAAGGGATCCGTCATGGTCGAAGTGTGCTGAGTCACACCGACAAACGTCAC GAGCGTAACCCCAGTGCGAAAGTTCCCGCCGGAAATCGCAGCCACGTTACGCTCGTGGACATAC CGATTTCGGCCCGGCCGCGGCGAGACGATAGGTTGTCGGGGTGACTGCCACAGCCACTGAAGG GGCCAAACCCCCATTCGTATCCCGTTCAGTCCTGGTTACCGGAGGAAACCGGGGGAT rpoB amplification sequence CTGCGTACGGTCGGCGAGCTGATCCAAAACCAGATCCGGGTCGGCATGTCGCGGATGGAGCGG GTGGTCCGGGAGCGGATGACCACCCAGGACGTGGAGGCGATCACACCGCAGACGTTGATCAAC ATCCGGCCGGTGGTCGCCGCGATCAAGGAGTTCTTCGGCACCAGCCAGCTGAGCCAATTCATGG ACCAGAACAACCCGCTGTCGGGGTTGACCCACAAGCGCCGACTGTCGGCGCTGGGGCCCGGCG GTCTGTCACGTGAGCGTGCCGGGCTGGAGGTCCGCGACGTGCACCCGTCGCACTACGGCCGGA TGTGCCCGATCGAAACCCCTGAGGGGCCCAACATCGGTCTGATCGGCTCGCTGTCGGTGTACGC GCGGGTCAACCCGTT Autocorrelation Curves 1 0.9 Fitting Function 0.8 0.7 0.6 0.5 AuNPs 0.4 inhA -15 WT 0.3 inhA C-15T 0.2 0.1 0 0 100 200 Delay Time (µs) 300 400 Figure A2 Autocorrelation curves of DLS measurements for inhA probes 38 Table A3 Ratio of WT probes (Abs525 \ Abs570) divided by ratio of Mut probes (Abs525 \ Abs570). Values >1 mean higher stability of WT probes, and <1 higher stability of Mut probes. Mutated genotypes (+) and wildtype (-). Ratio rpoB WT/ Ratio inhA WT/ rpoB Mut inhA Mut 1 0.907 2 Sample rpoB 531 inhA -15 0.979 + + 1.052 1.023 - - 3 1.005 1.079 - - 4 0.978 1.109 + - 5 0.983 0.972 + + 6 1.008 1.014 - - 7 1.025 1.028 - - 8 1.028 1.022 - - 9 1.023 1.002 - - 10 0.991 0.971 + + 11 1.02 1.017 - - 12 0.955 0.987 + + 13 1.075 1.004 - - 14 1.012 1.012 - - 15 1.004 1.021 - - 16 0.988 0.971 + + 17 0.991 0.988 + + 18 1.017 0.997 - + 19 1.028 1.027 - - 20 1.007 1.062 - - 21 1.015 1.014 - - 22 1.009 1.039 - - 23 0.898 0.94 + + 24 0.984 0.994 + + 25 0.999 0.959 + + 39
Baixar