Presen~ aI d1e.Intem.tiona1 Con(ere~ on Cosmjc Rljji.tion and Ajrr;rew Expoture, 1mplemenWiol
ole..opean RequilemencsiD Civil Avi.tiOQ, .(Xlanil.ed b'1 d\e Europeu CommiJlion and ~
~ioIoIicIJ
ProcectionInstiru~ ofIrcI.nd. ~bli", Ircland.ll&ty 1.3.1998. To bc p'Jb(j~
with ~
pr~inas
ol tbe confete~.
Guidelines and Technical Information Provided by the U. S. Federal A viation
Administration to Promote Radiation Safety for Air Carrier Crewmembers
w. Friedberg, K. Copeland, and F. E. Duke
Civil Aeromedical Institute, AAM-610
Federal A viation Administration
P. 0. Box 25082, Oklahoma City, OK 73125-5066, USA
K. O'Brien m
Department of Physics and Astronomy, Northern Arizona University
flagstaff, AZ 86011, USA
E. B. Darden, Jr.
105 Orchard Lane, Oak Ridge, TN 37830, USA
INTRODUcrION
Air
carrier
crews
are occupationally
exposed
to ionizing
radiation,
principally
from
galactic
cosmic radiation. To promote radiation safety in civil aviation, the Federal Aviation Administration
(FAA) has provided instructional
material on radiation exposure during air travel (1, 2.3.4). FAA
Advisory
Circular
120-61 (4) contains recommended
topics for a training program on in-flight
radiation
exposure
risks from exposure
to instruct
to ionizing
air carrier crewmembers
radiation
and their managers on the possible
and on basic radiation
protection
health
principles.
Research on effects of irradiation during pregnancy has been supported by the FAA {5, 6, 7, 8).
Currently, the FAA and the National Institute of Occupational Safety and Health are jointly
investigating possible hanDful effects of the aircraft environment, including galactic radiation, on
the reproductive health of female flight attendants.
The FAA has developed a computer program (CARl) that can estimate the galactic radiation dose
rate at any location in the atmosphere and, for a given flight profile, the dose received on a flight
between any two airports in the world. CARl can estimate the doSe of radiation received on a flight
during any month from January 1958 to the present. Up-to-date infonT1ation needed by the program
to adjust for changes in solar activity is provided on the Civil Aeromedical Institute Web site (9). The
amounts of radiation received on flights in years past are of particular interest to epidemiologists
investigating the possible association of long-tenT1 exposure to galactic radiation and health effects
in aircrew members. Using a new version of the CARl program (CARl-LF), we calculated for the
40-year period from January 1958 through December 1997: (a) effective dose rates of galactic
radiation at various altitudes, both at the equator and at a high latitude; (b ) percent contributions to
the galactic radiation effective dose rate by its components (neutrons, protons, electrons & photons,
muons, and charged pions) as related to altitude, at the equator and at a high latitude; and (c)
effective doses of galactic radiation received on a wide variety of air carrier flights. Results are
presented below. For a discussion of the transport code used in generating the radiation data see
O'Brien et al. (1996)(IO).
1
GALACnC
RADIATION
SOLAR ACTNrrY
DOSE RATE AS RELATED
TO ALTUUDE,
LATUUDE,
AND
When energetic galactic radiation particles (mostly protons and alpha particles) enter the
atmosphere they collide with and break apart the nuclei of nitrogen, oxygen, and other air atoms.
Each disrupted nucleus can yield multiple ionizing particles. The incident particles and those
generatedmay have enough energyto disrupt additional nuclei and producestill more particles. After
several such interactions the particles no longer have enough energy to causenuclear disruption.
Thereafter they lose energy principally by ionization until the particle energyis too low for ionization
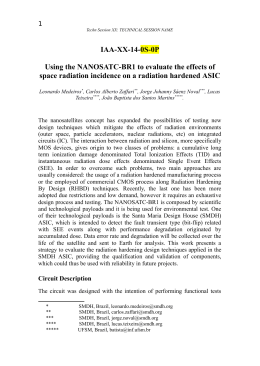
to occur. At the equator the effective dose rate from galactic radiation is lower at SO,()()()ft. than
at 60,()()()ft. (Figure 1). This phenomenonis the result of the initial increasefollowed by a decrease
in the number of ionizing particles as the radiation propagatesdown through the atmosphere. The
altitude at which the maximum dose rate occurs depends on the latitude (more accurately the
geomagnetic latitude).
The number of galactic radiation particles entering the atmosphere,and as a result the radiation
dose rates in the atmosphere,vary inversely with an approximate ll-year cycle of rise and decline
in solar activity. This variation, which is particularly evident where both latitude and altitude are
high (Figure 1). is brought about by magnetic fields carried by low-energy subatomicparticles (solar
wind) emitted from the sun. The magnetic fields deflect the lower-energy galactic particles that
would otherwise enter the atmosphere. During times of high solar activity the solar wind is more
intense and therefore more effective in deflecting galactic particles. The particles that comprise the
solar wind are themselvestoo low in energy to causean increasein radiation levels at aircraft flight
altitudes.
The earth's magnetic field (geomagneticfield) also deflects incoming galactic radiation particles,
particularly the lower-energy galactic particles, those most affected by the solar wind. In general,
radiation shielding by the geomagneticfield is greatestat the geomagneticequator(which is near the
geographic equator) and decreasesas one goes north or south. Thus, from January 1958 through
December 1997 (Figure I ), at the high latitude at an altitude of 20,000 ft., the mean effective dose
rate of galactic radiation was a factor of 2.0 higher than it was at the samealtitude at the equator; the
factor increasedto 2.7 at 40,000 ft. and 5.5 at 80,000 ft. Also, as a consequenceof the shielding by
the geomagnetic field, at the equator there was little variation in the galactic radiation dose rate with
changesin solar activity over the 40-year period studied, at least at altitudes up to 80,000 ft. At the
high latitude, however, where geomagnetic shielding is negligible, the galactic radiation dose rate
varied appreciably over the 40 years; at 40,000 ft., for example,the maximum doserate was a factor
of 1.8 higher than the minimum value.
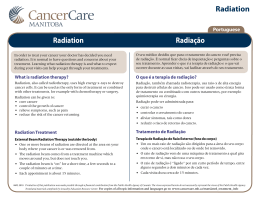
COMPONENTS OF GALACTIC RADIA noN
Figure 2 shows the percent contributions to the 40-year mean effective dose rate of galactic
radiation by its components as related to altitude, both at the equator and at a high latitude. At the
equator, the percent contributions showed very little variation over the 40 years, so only the mean
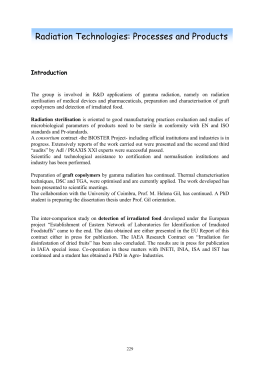
values are shown. During the sametime period at the high latitude, where geomagnetic shielding
2
is negligible, the varying solar activity resulted in noticeable variations in the percent contributions
(Figure 3). Subsonic air carrier aircraft commonly cruise at altitudes from 20,000 ft. to 40,000 ft.
In this altitude range over the 40-year period studied, and at all latitudes, 88-97% of the effective
dose rate was from neutrons, protons, and electrons & photons (electromagnetic showers). The
contribution from neutronswas 33-52%, from protons 21-28%, from electrons & photons 17-41%,
from muons 2-11%, and from charged pions less than I %. Thus, the composition of the galactic
radiation varied appreciably with changesin altitude, latitude, and solar activity .
RADIA TION EXPOSURE OF AIR CARRIER CREWMEMBERS
Table 1 shows calculated mean, minimum, and maximum effective dosesfrom galactic radiation
that crewmembers would have received on simulated air carrier flights on a wide variety of routes
to and from and within the contiguous United Statesfrom 1958through 1997. The simulated flights
used real time-and-altitude flight profiles collected over the last decade. For the purposes of this
report, the dosesand doserates for the flights are assumedto be the same in both directions. Based
on 0.60 mSv per 100 block hours, the mean for the Athens, Greece, to New York City flight (the
flight with the highest dose per 100 block hours), a crewmember working 700 block hours a year
would receive an annual occupational exposure of 4.2 mSv. This is considerably less than the
recommended annual limit of 20 mSv (II).
For a pregnant crewmember working on the Athens to New York flight, occupational exposure
from galactic radiation could approach or exceed recommended limits. For example, with a work
scheduleof 70 block hours a month, the 2 mSv recommendedpregnancylimit (II) would be reached
in 4.8 months. Her monthly effective dose from occupational exposure would be 0.42 mSv, which
is less than the recommended0.5 mSv monthly limit (12).
For each of the 32 flights in Table I, we estimated the average annual effective dose from
occupational plus non-occupational natural sources (i.e., total exposure on and off the job) that
would be received by an aircrew member who worked 700 block hours a year. The crewmember
doses were compared with the average annual effective dose of natural background radiation, 3.0
mSv, received by a member of the U.S. population (13). Radiation and tissue weighting factors
recommendedby the International Commission on Radiological Protection (11)are incorporated in
the CARI-LF program used to calculate the amount of galactic radiation received in flight. Some
results follow.
--A crewmember working 700 block hours a year flying between London and New York City
(Table I) would receive from occupational plus non-occupational natural radiation sources an
averageannualeffective doseof 6.1 mSv, a factor of 2.0 higher than the averageannual dose(3.0
mSv) receivedby a memberof the U.S. population. Radiation received by the crewmemberwhile
airborne (96 flights, 653 hours) would come from galactic cosmic rays (Table I, 3.3 mSv) and
from radionuclides in body tissues (0.031 mSv, based on general population data (13)). For the
remaining 8113 hours of the year the crewmember would receive radiation (2.8 mSv) from the
same sources as the general population.
3
--The two lowest annual crewmember doses (fable I, fIrst two flights) are within 1% of the
average annual generalpopulation dose,whereasthe two highest crewmember doses(Table 1.
last two flights) are factors of 2.1 and 2.3 higher.
Thus for the flights in Table I, the average annual radiation dose to a crewmember from
occupational plus non-occupationalnatural sourcesranged from almost identical to about twice the
dose of background radiation received by a member of the U.S. population.
REFERENCES
1. Friedberg, W., Faulkner, D. N. and Snyder, L. Transport Index Limits for Shipments of
Radioactive Material in Passenger-Carrying Aircraft, Federal Aviation Administration, Office of
A viation Medicine, Report No. FAA -AM -82-12. A vailable from the National Technical Information
Service, Springfield, V A 22161. Order No. ADA I 22794/1 (1982).
2. Friedberg, W ., Snyder,L, Faulkner,D. N., Darden, E. B., Jr. and O'Brien, K. Radiation Exposure
of Air Carrier CrewmembersII, Federal Aviation Administration, Office of Aviation Medicine,
Report No. DOT/FAAIAM-92/2. Available from the National Technical Information Service,
Springfield, V A 22161. Order No. ADA245508 (1992).
3. Federal Aviation Administration. Radiation Exposure of Air Carrier Crewmembers, Advisory
Circular No.120-52, Washington, DC (1990).
4. Federal Aviation Administration. Crewmember Training on In-Flight Radiation Exposure,
Advisory Circular No.120-61, Washington, DC (1994).
5. Friedberg, W., Hanneman,G. D., Fauikner, D. N., Darden, E. B., Jr. and Deal, R. B., Jr. Prenatal
survival ofmice irradiated with fission neutrons or 300 kVp X-rays during the pronuclear-zygote
stage: survival curves, effect of dosefractionation, Int. J. Radiat. Bioi. 24, 549-560 ( 1973).
6. Friedberg, W., Hanneman,G. D., Faulkner, D. N., Neas, B. R., Cosgrove, G. E., Jr. and Darden,
E. B., Jr. Fast-neutron irradiation of mouse embryos in the pronuclear zygote stage: mortality
curves and neoplastic diseasesin 30-day postnatal survivors, Prac .Sac. Exper. BioI. Med. 151,
808-810 (1976).
7. Friedberg, W ., Faulkner, D. N., Neas,B. R., Hanneman,G. D., Darden, E. B., Ir., Deal, R. B., Ir.
and Parker, D. E. Dose-incidence relationships for exencephalia, anopthalmia and prenatal
mortality in mouseembryos irradiated with fission neutrons or 250 kV X-rays,lnt. I. Radiat. Bioi.
52, 223-236 (1987).
8. Friedberg, W ., Faulkner, D. N., Neas,B. R., Darden, E. B., Jr., Parker, D. E. and Hanneman,G.
D. Prenatal survival ofmouse embryos irradiated in utero with fission neutrons or 250 kV X-rays
during the two-cell stage of development,Int. J. Radiat. BioI. 73, 233-239 (1998).
4
9. Civil Aeromedical Institute. Radiobiology ResearchTeam Web site
http://www .cami.jccbi.gov/ AAM-600/610/6OOradio.html
10. O'Brien, K., Friedberg, W ., Sauer, H. H., Smart, D. F. Atmospheric Cosmic Rays and Solar
Energetic Particles at Aircraft Altitudes, Environment International 22 (Suppl. I): S9-S44 (1996).
II. International Commission on Radiological Protection. 1990 Recommendations of the
Intemational Commission on Radiological Protectit!n, ICRP Publication 60. Annuals of the ICRP
21, No.1-3, 1-201. New York: Pergamon Press(1991).
12. National Council on Radiation Protection and MeasurementS.Limitation of Exposureto Ionizing
Radiation, NCRP Report No.116, Bethesda,MD (1993).
13. National Council on Radiation Protection and Measurements.Exposure ofthe Population in the
United States and-Canadafrom Natural Background Radiation, NCRP Report No.94, Bethesda,
MD ( 1987).
5
~
'i:'
5
6
.Q
M
~
Q.. 4
~
~
~
>
~
.-
~
~
vy
~i-"'
'80,OQq
3
~
!
t
2
w-
ft; 3.49 (3.32-3.6QluSv/h
j
,T---r-~~
40,000 ft; ~.71 (2.55-2.78)~Sv/h
.e
-.-
~
I~
.--
1-.+--
e
u
III
I
60,000 ft; 3.98 (3.77 -4.09) JlSv/h
..-v-i
~
~
~
o
O
1
~
>
....
u
~
~
~
~29,00~-
0
~; 0.,43 (0.40-0.44)
~Sv/h
-r-
I
1965
1970
1975
1980
1985
1990
1995
Date
30
~
..Q
...
&
tn
~
~
>
~
tn
e
u
.s
~
~
~
~
tn
0
O
~
>
25
~
20
~
,1\11
15
10
L...N~5
~~
u
~
C+.~
1-~20~00-Q~t;
0
-r-
j I I , , I'
1965
1970
O:~-{~.63~0.98)
I ..I
I I I , I.
1975
1980
Date
~S~
, I .I.'
1985
I I /
1990
1995
I
I
80
.
o 70
"
"'
~ 60
8
~ 50
.Muons
.Electrons
-6Neutrons
-0-0-
Protons
Charged
& Photons
Pions
,1j 40
"'
I
~ 30
:E
~
~
]
20
~
~
~
)-0-0-0-<-,
~
10 ~
0 -<,>-0-0=0=<
0
~
20
Altitude
(feet
40
in thousands)
,
60
,
~
80
80
4)
70
~
~
4)
tI)
60
o
J
O
4)
>
50
~~
u
~
40
~
,--
~
c
~
4)
30
~
?=r"~
~
<+--1
O
I
20
~
c
I
0
~~~>-0-0-0-é)
0
20
Altitude
(feet
40
in thousands)
T
T
60
80
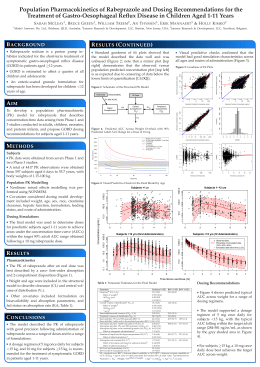
Figure 2. Percent Contributions to the Mean Effective Dose Rate of Galactic
Radiation by its Components as Related to Altitude, at the Equator and at a High
Latitude, for the Period January 1958 Through December 1997.
~
80
.Muons
.Electrons
& Photons
--6Neutrons
-0Protons
-0Charged Pions
.
p;2
~
I~-6~
~
I
()=(
)-O--()
I~~
)-{)-O-O-<
)
I
y
0
20
40
Altitude
(feet
60
80
in thousands)
80
70
60
50
~=6~
40
~--
c:
v
u
,~
~I)
r
I
!
~~
~
I
10
o-Q-o-o-O=<
0
20
60
Figure 3. Percent Contributions to the Minimum and Maximum Effective Dose
Rates of Galactic Radiation by Their Components as Related to Altitude, at a
High Latitude (70oN, 20~), for the Period January 1958 Through December
1997.
Table 1. Effective Dosesof Galactic Cosmic Radiation Received on Air Carrier Flights
Single nonstop one-way flight
Highest
Altitude,
feet in
thousands
Origin -Destination
Air
Block
hours
time,
hours
Seattle W A -Portland OR
Houston TX -Austin TX
Miami FL- Tampa FL
St. Louis MO -Tulsa OK
San Juan PR -N1iami FL
Tampa FL -St. Louis MO
New Orleans LA -San Antonio TX
Los Angeles CA -Honolulu HI
21
20
24
35
35
31
39
35
Denver CO -Minneapolis MN
New York NY -San Juan PR
Honolulu HI- Los Angeles CA
Chicago n.. -New York NY
Los Angeles CA -Tokyo JP
Tokyo JP -Los Angeles CA
Washington DC -Los Angeles CA
New York NY -Chicago n..
33
37
40
37
40
37
35
39
Minneapolis MN -New York NY
London GB -Dallas/Ft. Worth TX
Lisbon ES -New York NY
Dallas/Ft. Worth TX -London GB
Seattle W A -Anchorage AK
Chicago IL -San Francisco CA
Seattle W A -Washington DC
London GB -New York NY
37
1.8
2.1
39
9.7
10.1
39
6.5
6.9
31.
8.5
8.8
San Francisco CA -Chicago IL
New York NY -Seattle W A
New York NY -Tokyo JP
London GB -Los Angeles CA
Chicago IL -London GB
Tokyo JP -New York NY
London GB -Chicago n...
Athens GR -New York NY
a Mean
{minimum
-maximum)
b Based on the mean effective
effective
0.4
0.6
0.5
0.6
0.6
0.9
0.9
1.1
2.2
2.5
2.0
2.2
1.2
1.4
5.2
5.6
1.2
3 .0
5 .1
1.6
.1 .7
8 .8
4 .7
1.8
1.5
3.5
5.6
2.0
12.0
9.2
5.0
2.3
35
3.4
3.7
39
3.8
4.1
37
4.1
4.4
37
6.8
7.3
41
3.8
4 .9
13.0
10.5
7 .3
12.2
7 .8
9 .4
4.1
5.3
13.4
11.0
7.7
12.6
8.3
9.7
39
43
39
37
41
39
41
dose, January
dose for the one-way
Effective dose,
microsieverts a
0.14
0.14
0.34
1.57
4.84
4.31
3.11
12.9
(0.11-0.15)
(0.12-0.15)
(0.28 -0.36)
(1.20-1.74)
(4.16-5.18)
(3.35-4.74)
(2.54- 3.31)
(11.5- 13.3)
04
14
0. 19
0. 20
0. 22
0. 23
3.54
9.20
15.2
6.09
38.0
30.0
17.2
8.42
(2.56(7.52(13.4(4.33(31.8(24.6(13.2(5.93-
4.05)
10.1)
15.8)
7.10)
40.4)
32.2)
19.1)
9.85)
24
26
0. 27
0. 30
0. 32
0. 33
0. 34
0. 37
7.91
.38.8
27.3
35.3
15.1
17.7
20.4
34.0
(5.54-9.26)
(27.6-45.1)
(20.5-31.1)
(24.8- 41.4)
(10.4- 17.8)
(13.2-19.8)
(14.3- 23.8)
(23.8 -40.0)
0.38
0.38
0.40
0.40
0.41
0.43
0.46
0.47
19.5
25.6
67.1
55.2
38.7
63.5
43.3
58.2
(14.2- 22.1)
(17.7-30.1)
(48.3 -77.7)
(38.5 -64.9)
(26.6- 45.8)
(44.3- 74.8)
(29.6- 51.6)
(42.3 -67.0)
0.48
0.48
0.50
0.50
0.50
0.50
0.52
0.60
1958 through
flight.
Millisieverts
per 100
block
hours b
December
1997
0.
02
0. 02
0.
0.
0.
0.
Baixar