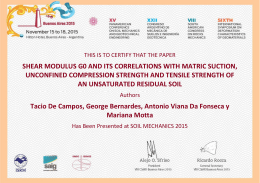
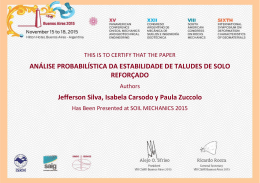
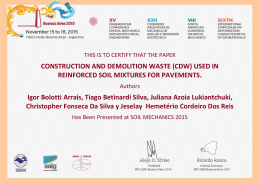
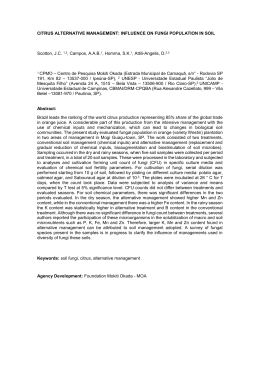
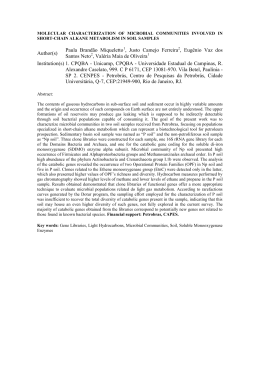
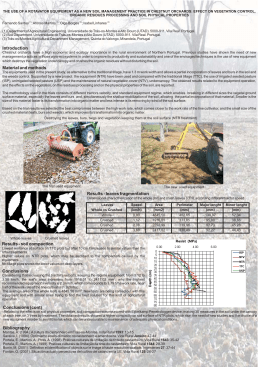
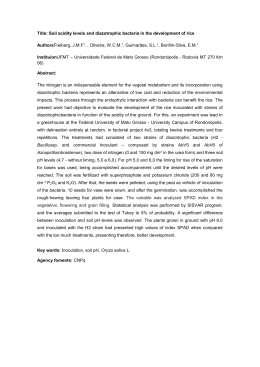
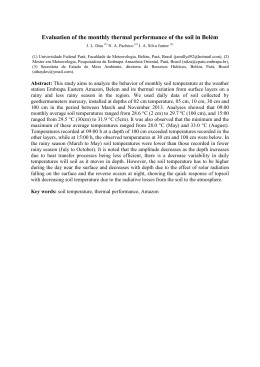
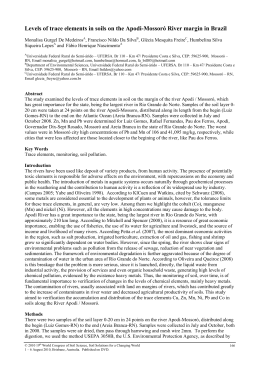
IMPACTS OF LAND LEVELING ON LOWLAND SOIL PHYSICAL PROPERTIES
315
IMPACTS OF LAND LEVELING ON LOWLAND SOIL
PHYSICAL PROPERTIES(1)
José Maria Barbat Parfitt(2), Luís Carlos Timm (3), Klaus Reichardt(4) & Eloy Antonio
Pauletto(5)
SUMMARY
The practice of land leveling alters the soil surface to create a uniform slope to
improve land conditions for the application of all agricultural practices. The aims
of this study were to evaluate the impacts of land leveling through the magnitudes,
variances and spatial distributions of selected soil physical properties of a lowland
area in the State of Rio Grande do Sul, Brazil; the relationships between the
magnitude of cuts and/or fills and soil physical properties after the leveling process;
and evaluation of the effect of leveling on the spatial distribution of the top of the
B horizon in relation to the soil surface. In the 0-0.20 m layer, a 100-point georeferenced grid covering two taxonomic soil classes was used in assessment of the
following soil properties: soil particle density (Pd) and bulk density (Bd); total
porosity (Tp), macroporosity (Macro) and microporosity (Micro); available water
capacity (AWC); sand, silt, clay, and dispersed clay in water (Disp clay) contents;
electrical conductivity (EC); and weighted average diameter of aggregates (WAD).
Soil depth to the top of the B horizon was also measured before leveling. The
overall effect of leveling on selected soil physical properties was evaluated by
paired “t” tests. The effect on the variability of each property was evaluated through
the homogeneity of variance test. The thematic maps constructed by kriging or by
the inverse of the square of the distances were visually analyzed to evaluate the
effect of leveling on the spatial distribution of the properties and of the top of the
B horizon in relation to the soil surface. Linear regression models were fitted with
the aim of evaluating the relationship between soil properties and the magnitude
of cuts and fills. Leveling altered the mean value of several soil properties and the
agronomic effect was negative. The mean values of Bd and Disp clay increased and
(1)
(2)
(3)
(4)
(5)
Part of the PhD thesis of the first author presented to the Graduate Studies Program in Agronomy, Universidade Federal de
Pelotas (Federal University of Pelotas) - UFPel. Received for publication on October 29, 2012 and approved on October 3, 2013.
Researcher, Embrapa (Brazilian Agricultural Research Corporation). BR 392, Km 78. CEP 96001-970 Pelotas (RS), Brazil. Email: [email protected]
Professor, Departamento de Engenharia Rural, UFPel. Campus Universitário, s/n. CEP 96010-900 Pelotas (RS), Brazil. Email: [email protected]
Professor, Laboratório de Física do Solo, Centro de Energia Nuclear na Agricultura, Universidade de São Paulo. CEP 13418900 Piracicaba (SP), Brazil. E-mail: [email protected]
Professor, Departamento de Ciência do Solo, UFPel. E-mail: [email protected]
R. Bras. Ci. Solo, 38:315-326, 2014
316
José Maria Barbat Parfitt et al.
Tp, Macro and Micro, WAD, AWC and EC decreased. Spatial distributions of all soil
physical properties changed as a result of leveling and its effect on all soil physical
properties occurred in the whole area and not specifically in the cutting or filling
areas. In future designs of leveling, we recommend overlaying a cut/fill map on the
map of soil depth to the top of the B horizon in order to minimize areas with shallow
surface soil after leveling.
Index terms: soil management practices, land forming, irrigated rice crop, soil
movement, soil properties.
RESUMO: IMPACTO DA SISTEMATIZAÇÃO NOS ATRIBUTOS FÍSICOS DE
UM SOLO DE VÁRZEA
A sistematização altera a superfície natural do solo criando uma área com declividade
uniforme com a finalidade de facilitar todas as operações agrícolas. Os objetivos deste trabalho
foram de determinar os impactos da sistematização sobre: a magnitude, a variância e a
distribuição espacial de alguns atributos físicos de uma área em solos de várzea no Estado do
Rio Grande do Sul; a relação entre a magnitude dos cortes e, ou, os aterros e os atributos físicos
do solo, após a sistematização da área; e a distribuição espacial do topo do horizonte B em
relação à superfície do solo. Em uma área constituída por dois tipos taxonômicos de solo, foi
estabelecida uma malha de 100 pontos georreferenciados. Em cada ponto, na camada de 00,20 m, foram determinados os seguintes atributos físicos, antes e após a sistematização:
densidade do solo e das partículas, porosidade total, macro e microporosidade, capacidade de
água disponível, teores de areia, silte, argila e argila dispersa em água, condutividade elétrica
e diâmetro médio dos agregados estáveis em água. Nos mesmos pontos, antes da sistematização,
foi medida a profundidade do topo do horizonte B em relação à superfície do solo. O efeito da
sistematização sobre os valores médios dos atributos físicos foi avaliado pelo teste “t” de
médias pareadas. O efeito sobre a variância de cada atributo foi analisado pelo teste de
homogeneidade da variância. Para avaliar o efeito da sistematização sobre a distribuição
espacial dos atributos e do topo do horizonte B em relação à superfície do solo, foi realizada
uma análise visual dos mapas temáticos construídos por krigagem ou pelo inverso do quadrado
das distâncias. Com a finalidade de avaliar a relação entre os atributos do solo e a magnitude
de cortes e aterros, foram ajustados modelos de regressão linear. A sistematização alterou a
média de vários atributos físicos do solo e o efeito agronômico foi negativo. Houve aumento dos
valores médios dos teores de argila dispersa e de densidade do solo e diminuição dos valores de
porosidade total, macro e microporosidade, capacidade de água disponível, diâmetro médio
ponderado dos agregados estáveis em água e da condutividade elétrica. As distribuições
espaciais de todos os atributos foram alteradas após a sistematização; o efeito da sistematização
sobre os atributos físicos ocorreu em toda a área e não especificamente nas áreas de corte ou
aterro. Para futuros projetos de sistematização, é recomendado sobrepor o mapa de cortes e
aterros e o da profundidade do topo do horizonte B, em relação à superfície do solo, com o
objetivo de minimizar locais com solo muito raso após a sistematização.
Termos de indexação: práticas de manejo do solo, nivelamento, arroz irrigado, movimento do
solo, propriedade do solo.
INTRODUCTION
Land leveling is used to adjust the soil surface and
standardize its slope, facilitate the distribution of
irrigation water and improve field conditions for other
agricultural practices (Brye et al., 2006). Leveling has
been practiced throughout the world for more than half
a century (Whitney et al., 1950). It increases the
efficiency of irrigation control and facilitates
agricultural mechanization. In addition, leveling allows
reduction in water application, increasing water
conservation. Evaluating more than 40 leveled and
unleveled rice (Oriza sativa) fields, Laughlin & Mehrle
R. Bras. Ci. Solo, 38:315-326, 2014
(1996) concluded that leveling increased the profitability
of the rice field by US$ 201 ha -1 as a result of an
increase in rice yield of 550 kg ha-1 and of a decrease in
production costs of US$ 129 ha-1. Parfitt & Silva (2005)
and Silva & Parfitt (2005) mentioned that in addition
to these benefits for the irrigated rice crop, leveling
also benefits soybean (Glycine max L.) and maize (Zea
mays L.) crops because of the possibility of irrigating
both field crops by surface irrigation. However, land
leveling also has disadvantages due to severe soil
disturbance (Eck, 1987; Miller, 1990; Brye et al., 2005).
According to the Instituto Rio-grandense do Arroz
(IRGA, 2005), in the 1999/2000 crop year, the area of
IMPACTS OF LAND LEVELING ON LOWLAND SOIL PHYSICAL PROPERTIES
leveled land in the State of Rio Grande do Sul (RS),
Brazil, was estimated to be around 0.15 × 10⁶ ha of
the total of 5.4 × 10⁶ ha of lowland area of the state
(Pinto et al., 2004). However, not all the so-called
lowland areas with irregular micro-topography may
be leveled.
Land leveling can significantly decrease the
thickness of the A horizon and expose the subsoil in
the cut areas. As a consequence, crop production may
be affected by leveling, and, therefore, there is a call
for studies on the impact of leveling on soil physical
properties and on its effect on crop growth. Brye et al.
(2003) characterized the short-term impacts of land
leveling on the magnitude and spatial distributions
of biological and physical soil properties of an
Albaqultic Hapludalf soil used for irrigated rice and
soybean crops, as well as on the relationships among
these properties. They concluded that leveling affected
the magnitude of all soil properties and relationships:
soil bulk density and sand and clay contents increased,
while silt content and fungal and bacterial biomass
decreased. According to the authors, the variance
associated with soil biological properties changed as a
result of leveling, while the variance associated with
soil physical properties was not affected by this
agricultural practice. However, in the study, Brye et
al. (2003) did not evaluate which soil properties were
most affected by the leveling process. Ferreira et al.
(2003) aimed to evaluate the effect of cut and fill
elevation coordinates on the yield of an irrigated ricesoybean-maize rotation in a lowland area, and they
estimated a maize yield of 2.4 and 7.6 t ha-1 in -0.10 m
cut areas and in +0.075 m filled areas, respectively.
For the soybean crop, the minimum and maximum
estimated yields were 0.8 t ha-1 (-0.10 m cut area)
and 2.0 t ha-1 (+0.069 m fill areas), respectively. They
concluded that both maize and soybean yields were
more affected by leveling, in comparison to irrigated
rice, and because leveling severely disturbs soil, only
minimum amounts of soil should be moved. However,
Ferreira et al. (2003) did not evaluate the effects of
land leveling on the magnitude and spatial
distributions of soil properties and which properties
were most affected by the practice.
The aforementioned studies do not evaluate the
relationships between the magnitude of cuts and/or
fills and soil physical properties after the leveling
process. They also do not pay attention to soil depth
to the top of the B horizon in relation to the soil surface
in lowland soils. This depth is important since the
depth of the A+E horizons will be exploited by the
new crop roots. Moreover, they do not associate this
depth to the magnitudes of cuts and fills. It is
important to mention that lowland soils of RS are
mainly classified as Albaqualfs and Epiaqualfs, which
have a textural B horizon in which roots are rarely
found. This horizon restrictive to root development
and its low fertility make these soils definitively
unproductive mainly when this horizon is exposed at
the soil surface. Therefore, the aims of this study were
317
to evaluate the impacts of land leveling through
evaluation of the magnitudes, variances and spatial
distributions of selected soil physical properties of a
lowland area in the state of Rio Grande do Sul, Brazil;
verification of the existence of a relationship between
the magnitude of cuts and/or fills and the magnitudes
of soil physical properties after the leveling process,
and evaluation of the effect of leveling on the spatial
distribution of the top of the B horizon in relation to
the soil surface.
MATERIALS AND METHODS
Study area and land leveling process
The study was carried out on an area of 0.81 ha
in the municipality of Capão do Leão, RS, Brazil
(31o 49' 13'’ S; 52o 27' 59'’ W), to study the changes
in soil physical properties after land leveling. A grid
of 100 geo-referenced points at a spacing of 10 m in
orthogonal directions was used for this purpose. The
climate in the region is of the Cfa type according to
the Köppen classification and the specific area is
representative of a subtropical marine environment
with a sub-humid summer and humid or super-humid
conditions in the remaining seasons. The soil of the
area belongs to two taxonomic classes (Figure 1a), a
Typic Albaqualf in the relatively high portion and an
Umbric Epiaqualf in the lower portion (NRCS, 2009).
In the area under study, the two soils do not present
a sharp interface. This situation is common in the
rice-growing lowland areas of RS. Before the study
began, the area was planted twice to wetland rice and
planted once to grain sorghum (Sorghum vulgare),
all under conventional tillage that includes plowing
operations to the depth of about 0.20 m. Before land
leveling and at each geo-referenced point, one
disturbed soil sample was collected from the 0-0.20 m
layer to evaluate soil particle density (Pd) (Blake &
Hartge, 1986), clay, dispersed clay (Disp clay), silt
and sand contents (Gee & Bauder, 1986), and electrical
conductivity (EC) in 5:1 soil water extracts (Rhoades,
1982). Evaluation of the distributions of aggregate size
and stability (weighted average diameter - WAD) was
performed on 0.05 × 0.05 × 0.20 soil samples collected
so as to avoid disintegration in the field (Kemper &
Rosenau, 1986). Undisturbed soil samples (0.05 m
diameter, 0.03 m height) were collected at the 0.10 m
depth (to represent the 0-0.20 m surface layer) for
determination of soil bulk density (Bd); total (Tp),
macro (Macro) and micro (Micro) porosities; and soil
water retention curves using the matric potentials of
0; -1; -6; -10; -33; -100 and -1500 kPa, according to
methods described in Klute (1986). The available water
capacity (AWC) was considered between the potentials
of -10 and -1500 kPa. The depth to the top of the B
horizon in relation to the soil surface was also
evaluated before leveling through auger samplings.
R. Bras. Ci. Solo, 38:315-326, 2014
318
José Maria Barbat Parfitt et al.
The land leveling procedure occurred at the
beginning of 2008 and was carried out with a lasercontrolled scraper, using a planialtimetric survey and
minimum squares approximation as described in
Parfitt et al. (2004). The final average slope was 0.15 %
with an approximate soil displacement of 519 m3 ha-1;
about half of the area underwent cuts and the other
half underwent fills. The maximum cut was 0.21 m
and the maximum fill was 0.17 m (Figure 1b). The
period between samplings before and after leveling
was about three months. After land leveling and in
the same geo-referenced points, disturbed and
undisturbed samples were collected from the 0-0.20 m
layer to evaluate the same soil properties described
above. After leveling, the depth to the top of the B
horizon was calculated by the sum of cut or fill
magnitudes with the depth to the top of the B horizon
evaluated before leveling.
semivariograms, and through the inverse of the
squares of the distances when the spatial variability
was not properly defined by semivariograms.
Therefore, a visual analysis of the spatial distribution
of the properties was made.
Classical statistics and geostatistical analysis
Impacts of land leveling on the magnitudes
and variances of selected soil physical
properties
All data were subjected to descriptive statistical
analysis and analyzed to confirm normality through
the non-parametric Kolmogorov-Smirnov test at the
5 % probability (p<0.05) using the maximum distance
D (SAS Institute, 1985). To determine the overall
effect of land leveling on all data sets, paired t tests
were performed (Montgomery & Runger, 1994). For
normal data distributions, the hypothesis of the applied
test was parametric (t statistics), and for non-normal
distributions, the test was non-parametric (Wilcoxon
test). To evaluate the effect of leveling on the sampling
variability of each property, the homogeneity of
variance test was applied using the method of Levene
(1960), modified by Brown & Forsythe (1974).
Experimental and theoretical semivariograms were
calculated and evaluated by the cross validation
technique through use of the Software GS+, version
9.0 (Journel & Huijbregts, 1978; Webster & Oliver,
2001; Nielsen & Wendroth, 2003; Robertson, 2008).
Thematic maps were generated before and after
leveling (Parfitt, 2009; Parfitt et al., 2009) through
kriging when the spatial variability of the properties
was properly defined and identified through
RESULTS AND DISCUSSION
Average particle size distribution of the 0-0.02 m
soil layer before leveling (143 g kg-1 clay, 399 g kg-1
silt and 458 g kg-1 sand) and after leveling (154 g kg-1
clay, 375 g kg-1 silt and 471 g kg-1 sand) classify the
soil as having a loamy texture, in both situations
(Embrapa, 2006). Mean soil bulk density increased
from 1.60 kg dm-3 (before) to 1.67 kg dm-3 (after), due
to intense machinery traffic during leveling. As a
consequence, the mean total porosity decreased from
0.44 to 0.37 m3 m-3 (Table 1). Table 1 also shows the
predominance of microporosity (0.34 m3 m-3) as
compared to macroporosity (0.10 m3 m-3) at a ratio
greater than 3:1, indicating that this soil layer
presented a restriction to water movement before
leveling (Winkler & Goedert, 1972). The same behavior
can be observed after leveling. The mean diameter of
the water stable aggregates (WAD) decreased from
1.7 to 1.1 mm, indicating that soil mixing during
leveling can cause the breakdown of larger aggregates.
Mean WAD of 1.7 mm is larger than that obtained by
Lima et al. (2003) for a soil of the same taxonomic
(b)
(a)
90
With the aim of determining which soil physical
properties were most affected by the leveling process
and to better describe future management practices
to be carried out on leveled land, simple regression
analysis was made using the SAS software, version
8.2 (SAS Institute, 1985) based on the depth of cut
and/or fill (CF) and the values of the soil physical
properties after leveling.
N
Cuts (-) and Fills (+), cm
60
Y
30
0
> 11,0
> 5,5
> 0,0
> -5,5
> -11,0
> -16,5
> -22,0
1 - Albaqualf
2 - Epiaqualf
Point of soil pro!le
caracterization
0
30
X
60
90
0
30
X
60
90
Figure 1. (a) Soil spatial distribution in the experimental area: (1) “Gleissolic Planossolo háplico eutrófico”
(Typic Albaqualf) in the relatively high portion, and (2) “Solodic Gleissolo háplico Ta eutrófico” (Umbric
Epiaqualf) in the lower portion. (b) Map of cut and fill depths.
R. Bras. Ci. Solo, 38:315-326, 2014
IMPACTS OF LAND LEVELING ON LOWLAND SOIL PHYSICAL PROPERTIES
319
Table 1. Descriptive statistics, Kolmogorov-Sminorv and normality hypothesis tests for physical properties
measured before and after land leveling
Property
Clay (g kg
-1)(1)
-1 (2)
Mean
Minimum value
Maximum value
Variance
143
117
181
174
Clay (g kg )
154
Silt (g kg-1)(1)
Silt (g kg-1)(2)
-1 (1)
Sand (g kg )
-1 (2)
Sand (g kg )
-1 (1)
Disp clay (g kg )
-1 (2)
Disp clay (g kg )
-3 (1)
Bd (kg dm )
**
0.06N
0.94NN
123
227
399
333
483
1096
0.04N
375***
276
441
1390NS
0.10NN
458
385
541
1414
0.07N
***
310
NS
D
NS
471
401
538
912
79
50
115
190
***
NS
88
60
125
228
1.60
1.36
1.75
0.005
0.11NN
0.08N
1.67
1.43
1.92
0.008
0.08N
-3 (1)
2.52
2.11
2.68
0.006
0.07N
Pd (kg dm )
-3 (2)
***
NS
2.48
2.33
Tp (m3 m-3)(1)
0.44
0.37
0.51
7.24
0.05N
Tp (m3 m-3)(2)
0.37***
0.24
0.48
11.76NS
0.05N
Macro (m3 m-3)(1)
0.10
0.05
0.16
4.20
0.04N
0.06
0.004
0.13
7.90*
0.07N
0.34
0.30
0.42
3.53
0.07N
0.31
0.18
0.38
9.86**
0.08N
1.7
0.8
3.0
0.24
0.08N
-3 (2)
Macro (m m )
3
-3 (1)
3
-3 (2)
Micro (m m )
Micro (m m )
***
***
0.004
0.14NN
Pd (kg dm )
3
2.68
NS
0.07N
-3 (2)
Bd (kg dm )
***
0.11NN
WAD (mm)
(1)
WAD (mm)
(2)
1.1
0.5
1.8
0.12
AWC (mm)
(1)
25
9
39
50.4
AWC (mm)
(2)
***
***
NS
NS
19
8
33
36.5
EC (µs cm-1)(1)
52
36
139
273.2
EC (µs cm-1)(2)
43***
28
61
41.7**
0.13NN
0.09N
0.08N
0.23NN
0.04N
Disp clay: dispersed clay, Bd: bulk density, Pd: particle density, Tp: total porosity, Macro: macroporosity, Micro: microporosity,
WAD: weighted average diameter, AWC: available water capacity, EC: electrical conductivity. (1) Mean value of the property
before land leveling; (2) mean value of the property after land leveling. *** p<0.001; ** p<0.01; * p<0.05 and NS no significant
differences by the t hypothesis test (for normal data distributions) and by the Wilcoxon test (for non-normal data distributions)
applied to the mean values of each property before and after land leveling, respectively. D: value of the Kolmogorov-Smirnov
statistical test. N and NN: normally and no normally distributed data set at p<0.05, respectively.
class planted to flooded rice under conventional soil
tillage practices. A decrease of 6 mm in the mean
AWC was also observed as a consequence of a decrease
in microporosity, which is responsible for water
retention in the soil. Mean AWC, according to Pereira
et al. (2002), lies within the values presented by soils
of medium texture. Mean electrical conductivity
decreased from 52 µS cm-1 (before leveling) to 43 µS cm-1
(after) showing a change in the distribution of
dissolved ions in the soil solution. In general, mean
values for soil property data before leveling (Table 1)
are in agreement with those observed by Palmeira et
al. (1999) for lowland soils planted to irrigated rice
under conventional tillage.
Leveling altered the mean values of nearly all
the properties (p<0.001) for the paired comparison
test (Table 1), with only clay content (p<0.01). Table
1 also shows that the range, which is the difference
between the greatest and the smallest observations
of a data set, increased for most soil physical
properties.
The variance parity test of Levene (1960),
modified by Brown & Forsythe (1974), applied to the
data sets before and after leveling showed that only
the variances for EC, Macro and Micro changed
significantly. Therefore, land leveling did not
significantly change the variance values for the great
majority of the data sets. According to Schlindwein
& Anghinoni (2002), in the case of precision
agriculture, an increase in the variance of a set of
measurements implies an increase in the number of
samples that need to be collected for a given
probability level. Among the properties evaluated
before leveling (Table 1), only the EC data did not
follow normal distribution according to the
Kolmogorov-Smirnov test (p<0.05), while after
leveling, clay, silt, sand, Disp clay, Pd and WAD
also did not follow normality, indicating that these
properties showed a localized distribution in the
experimental area (Grego et al., 2006), and the mean
value cannot be considered the center of the
distribution (Nielsen & Wendroth, 2003).
R. Bras. Ci. Solo, 38:315-326, 2014
320
José Maria Barbat Parfitt et al.
Impacts of land leveling on the spatial
distributions of selected soil physical
properties
gradual increase from east to west. Silt and sand
presented opposing behavior, with silt having the
greatest concentration in the central part and the
smallest in the east. The behavior of the Disp clay
data set is directly related to clay. In general,
distribution of Pd (Figure 3) had behavior similar to
sand (Figure 2), where the largest values of particle
density were found at locations with the highest
sand contents. The distribution of Tp, which in a
homogeneous management area is mainly related
to particle size distribution, had its largest values
concentrated in the center and west, approximately
the inverse of sand. The spatial distribution of Bd
(Figure 3), which is related to Pd and Tp, followed
the behavior of these two properties, presenting the
Thematic maps of soil properties before and after
leveling are presented in figures 2, 3, and 4. The
spatial variability, before and after leveling (Parfitt,
2009; Parfitt et al., 2009), of clay, sand, silt, Disp
clay and Bd properties as well as Micro (after leveling)
were well described by semivariograms, and
therefore their thematic maps were generated by
kriging. For the other properties, the inverse of the
squares of the distances was used to generate the
thematic maps. Figure 2 shows that before leveling,
clay presented a uniform spatial distribution with a
Before land leveling
After land leveling
90
60
Y
Clay, g kg
Clay, g kg-1
-1
> 176
> 166
> 156
> 146
> 136
> 152
> 142
> 132
> 122
30
0
90
-1
Silt, g kg
Silt, g kg-1
Y
60
> 410
> 370
> 330
> 290
> 450
> 410
> 370
> 330
30
0
90
Sand, g kg-1
-1
60
Y
Sand, g kg
> 520
> 480
> 440
> 400
> 500
> 460
> 420
> 380
30
0
90
Y
> 100
> 85
> 70
> 55
> 100
> 85
> 70
> 55
30
0
Disp clay, g kg-1
Disp clay, g kg-1
60
0
30
X
60
90
0
30
X
60
90
Figure 2. Maps of the spatial distribution of concentrations of clay, silt, sand and dispersed clay in water
(Disp clay), before and after land leveling.
R. Bras. Ci. Solo, 38:315-326, 2014
IMPACTS OF LAND LEVELING ON LOWLAND SOIL PHYSICAL PROPERTIES
lowest values in the center and west. The
distribution of Micro (Figure 4) approximately
followed the inverse of sand. Macro distribution
(Figure 3) appeared to be random, with the largest
values in the west and it followed the inverse
situation of Bd. WAD and AWC also presented
random distribution before land leveling and EC had
a tendency to decrease from the southeast to the
northwest corners (Figure 4).
Land leveling consisted of cuts on the northern
part of the experimental area, with a maximum cut
of 0.21 m in the northwest portion. The soil in this
part of the area was classified as a Typic Albaqualf,
typical of the relatively higher portions of the land.
The maximum fill of 0.17 m occurred near the
southwest corner [at coordinates (0.0; 10.0)]. It was
321
observed that soil depth to the top of the B horizon
was variable over the area such that during sampling
of the 0-0.20 m layer after leveling, some points,
mainly those in the extreme northeastern, presented
the top of horizon B in addition to horizon E (Figure
1b). Due to the different physical characteristics of
the B horizon in relation to the upper horizons, the
spatial distributions of the soil properties analyzed
were affected by leveling, especially those of particle
sizes. In contrast, in the filled areas of the whole
southern part, the soil was mixed so that an E
horizon remained at the top. The value of Pd, as
well as clay, presented an inverse behavior in
relation to the pre-leveling condition (Figures 3 and
2). The largest values of Pd and the lowest of Tp,
Macro, Micro, WAD and AWC were found in the cut
After land leveling
Before land leveling
90
Bd, kg dm-3
Bd, kg dm-3
Y
60
> 1.66
> 1.59
> 1.52
> 1.45
> 1.66
> 1.59
> 1.52
> 1.45
30
0
90
60
Pd, kg dm-3
Y
Pd, kg dm-3
> 2.55
> 2.50
> 2.45
> 2.40
30
> 2.55
> 2.50
> 2.45
> 2.40
0
90
60
Tp, m3 m-3
Y
Tp, m3 m-3
> 0.39
> 0.35
> 0.31
> 0.27
> 0.23
> 0.47
> 0.43
> 0.39
> 0.35
30
0
90
Macro, m3 m-3
Macro, m3 m-3
60
> 0.08
> 0.06
> 0.04
> 0.02
> 0.00
Y
> 0.12
> 0.10
> 0.08
> 0.06
> 0.04
30
0
0
30
X
60
90
0
30
X
60
90
Figure 3. Maps of the spatial distribution of soil bulk density (Bd), particle density (Pd), total porosity (Tp)
and macroporosity (macro) before and after land leveling.
R. Bras. Ci. Solo, 38:315-326, 2014
322
José Maria Barbat Parfitt et al.
parts (Figures 3 and 4). EC also presented a pattern
that followed soil movement.
Relationships between the magnitude of cuts
and/or fills and soil physical properties
Miller (1990) observed that variability in the yield
of irrigated rice was related to the spatial variability
of soil properties after leveling. Dobermann et al.
(1997) reported that rice yield was related to the spatial
variability of soil properties after land leveling.
Reichert et al. (2008) concluded that land leveling
increased the spatial variability of soil chemical and
physical properties of a lowland soil, which was
reflected in the yield of the soybean crop. It is therefore
expected that the generation of maps such as those
presented here (Figures 2, 3 and 4) provides a very
good tool for the establishment of soil management
practices to be introduced in recently leveled land for
the purpose of greater crop yield.
In order to better understand the relation between
soil properties and the magnitudes of cuts and/or fills
resulting from leveling, mathematical relationships
between them were established (Figures 5 and 6).
Although most of the relationships between properties
are statistically significant, it can be observed from
the figures that there is no defined relationship among
soil property values and the magnitudes of cuts and
fills, which is confirmed by the very low R2 coefficients.
According to Charnet et al. (1999), upon increasing
the number of observations, there is a tendency for
an increase in the significance of the R2 coefficient;
however, based on the absolute values of R2 (Figures
5 and 6) no satisfactory relationships can be observed
Before land leveling
After land leveling
90
60
Micro, m3 m-3
Y
Micro, m3 m-3
> 0.309
> 0.287
> 0.265
> 0.243
> 0.221
> 0.377
> 0.354
> 0.331
> 0.309
30
0
90
WAD, mm
60
WAD, mm
Y
> 2.0
> 1.7
> 1.4
> 1.1
> 0.8
30
> 1.40
> 1.10
> 0.80
> 0.50
0
90
60
AWC, mm
Y
AWC, mm
> 24.0
> 19.0
> 14.0
> 9.0
> 29.0
> 24.0
> 19.0
> 14.0
30
0
90
EC, µS cm-1
> 107.7
> 92.6
> 83.5
> 74.4
> 65.3
> 56.2
> 47.1
> 38.0
Y
60
30
0
0
30
X
60
90
EC, µS cm-1
> 47.1
> 38.0
> 28.0
0
30
X
60
90
Figure 4. Maps of the spatial distribution of microporosity (micro), weighted average diameter (WAD),
available water capacity (AWC), and electrical conductivity (EC) before and after land leveling.
R. Bras. Ci. Solo, 38:315-326, 2014
IMPACTS OF LAND LEVELING ON LOWLAND SOIL PHYSICAL PROPERTIES
Sand, g kg-1
-30,0
-20,0
Silt, g kg-1
500,00
600,00
500,00
400,00
300,00
200,00
100,00
0,00
-10,0
0,0
400,00
300,00
200,00
100,00
10,0
20,0
-30,0
-20,0
2
ŷ = 469*** -1.07 x R =0.09**
Clay, g kg
250,00
50,00
10,0 15,0 20,0
5,0
2
x R =0.001
-30,0
-20,0
140,00
120,00
100,00
80,00
60,00
40,00
20,00
0,00
-10,0
0,0
2,00
1,50
1,00
0,50
-10,0
0,00
0,0
x R =0.05*
10,0
20,0
Pd, kg dm-3
2,50
-20,0
20,0
2
ŷ = 87*** - 0.37* x R2=0.04*
NS
Bd, kg dm-3
-30,0
10,0
NS
Disp clay, g kg
100,00
ŷ = 154*** + 0.06
0,00
0,0
-1
150,00
NS
-10,0
ŷ = 376*** + 1.01
-1
200,00
0,00
-25,0 -20,0 -15,0 -10,0 -5,0 0,0
323
10,0
20,0
-30,0
-20,0
-10,0
2,70
2,65
2,60
2,55
2,50
2,45
2,40
2,35
0,0
10,0
20,0
Cut (-) and !ll (+), cm
ŷ = 1.66*** - 0.004*** x R2=0.20**
ŷ = 2.47*** -0.001* x R2=0.05*
Figure 5. Regressions between cut (-) and fill (+) depths and sand, silt, clay and dispersed clay content in
water (Disp clay), soil bulk density (Bd) and particle density (Pd). *** p<0.001; * p<0.05 and NS not
significant.
between the variables. The low values of the slopes of
the regressions in relation to the respective intercepts
show that the effects of land leveling on the soil
properties evaluated occurred mainly over the whole
area, and not specifically in the cut or fill areas.
Based on the results, however, it cannot be said
that leveling caused soil compaction over the whole
area. Nevertheless, there was a significant increase
and decrease in the mean values of Bd and Tp in the
whole area, respectively, as a result of leveling (Table 1).
Although there was a significant decrease in the mean
value of Macro following leveling (Table 1), it can be
seen that its values present a random distribution as
a function of the magnitudes of cuts and/or fills (Figure 6).
From this result, it can be said, in an indirect way,
that there was soil compaction over the whole area
after leveling, but without relationship to the
magnitudes of cuts and/or fills.
The effect of leveling on the spatial distribution
of the B horizon in relation to the soil surface
Another important effect of the leveling operation
is the change of depth to the top of the B horizon in
relation to the new soil surface, that is, the effective
arable depth (Figure 7). From figure 7.1 it can be
seen that this depth is highly variable in this area,
ranging from 22 cm (minimum) to 120 cm
(maximum), with a mean value of 77 cm. This
behavior is linked to the Albaqualf and Epiaqualf soil
formation processes, with their origin in a coastal plain
during transgressive-regressive cycles controlled by
glacio-eustatic sea level fluctuations (Tomazelli et al.,
2000). Overlaying the cut and fill map (Figure 1b) on
the map of the depth to the B horizon before leveling
(Figure 7.1), the map of the B horizon in relation to
the soil surface after leveling was obtained (Figure
7.2). In combined analysis of these figures, it can be
seen that the maximum depth of cut was made in the
northeast area where the soil is relatively deep. The
area where the soil was shallower is located east
(Figure 7.1), more specifically northeast, where cuts
were also made. In order to clarify this, figure 8 shows
that before leveling, the regression line between the
depth to the top of the B horizon and the geo-referenced
points of the area was practically horizontal. However,
after leveling the depth to the top of the B horizon
ranged from 40 to 66 cm. It can be seen that several
R. Bras. Ci. Solo, 38:315-326, 2014
324
José Maria Barbat Parfitt et al.
points where the effective depth was shallow, located in
the northeast part (Figure 7.2), were subjected to cuts.
physical indicators, which most likely are not related
to the specific soil, climate and land use factors. Soil
quality was affected mainly by soil bulk density
increases and decreases in the size of water stable
aggregates, air space and water retention capacity
(Table 1). To minimize these negative effects of
leveling, it is essential to adopt correct management
practices for selected crops, such as incorporation of
Implications and management strategies to
remedy soil physical degradation after land
leveling
Based on these results, it can be said that land
leveling induces negative effects on important soil
Macro, %
Tp, %
60,00
50,00
40,00
30,00
20,00
10,00
-30,0
-20,0
0,00
0,0
-10,0
10,0
20,0
-30,0
ŷ = 0.37*** + 0.001** x R2=0.10**
-20,0
-10,0
-20,0
10,0
20,0
ŷ = 0.06*** - 0.0002NS x R2=0.01NS
Micro, %
-30,0
14,00
12,00
10,00
8,00
6,00
4,00
2,00
0,00
0,0
WAD, mm
45,00
40,00
35,00
30,00
25,00
20,00
15,00
10,00
5,00
0,00
-10,0
0,0
2,00
1,50
1,00
0,50
10,0
0,00
-10,0 -5,0 0,0
-25,0 -20,0 -15,0
20,0
ŷ = 0.31*** + 0.001*** x R2=0.17**
5,0
ŷ = 1.17*** + 0.004NS x
10,0
15,0 20,0
R2=0.01NS
AWC, mm
-30,0
-20,0
ES, mS cm-1
35,00
30,00
25,00
20,00
15,00
10,00
5,00
0,00
-10,0
0,0
10,0
-30,0
20,0
-20,0
-10,0
70
60
50
40
30
20
10
0
0,0
10,0
20,0
Cut (-) and !ll (+), cm
ŷ = 19*** + 0.28*** x
R2=0.15**
ŷ = 44*** + 0.38*** x
R2=0.25**
Figure 6. Regressions between cut (-) and fill (+) depths and total porosity (Tp), macroporosity (Macro),
microporosity (Micro), weighted average diameter (WAD), available water capacity (AWC) and electrical
conductivity (EC). *** p<0.001; ** p<0.01; * p<0.05 and NS not significant.
Before land leveling
After land leveling
90
60
Y
> 90
> 66
> 42
> 18
30
0
Depth of B horizon in
relation to the surface
after levelling (cm)
Depth of B horizon in
relation to the surface
before levelling (cm)
0
30
X
60
90
> 90
> 66
> 42
> 18
0
30
X
60
90
Figure 7. Maps of the spatial distribution of the distance to the top of the B horizon in relation to the soil
surface before (left side) and after (right side) land leveling.
R. Bras. Ci. Solo, 38:315-326, 2014
Depth of B horizont, cm
IMPACTS OF LAND LEVELING ON LOWLAND SOIL PHYSICAL PROPERTIES
325
determine the suitability of a site for leveling before
carrying out the leveling in the field.
120
100
80
60
40
20
0
Linear (Before)
0
10
20
30
40
50
Point
60
70
Linear (After)
80
90
ACKNOWLEDGMENTS
100
Figure 8. Depth variation of the top of the B horizon
before and after land leveling. Solid line before
leveling and dotted line after leveling.
organic residues applied to the soil surface or
subsurface (e.g. crop residues, poultry litter, among
others) (Dourado-Neto et al., 2010). The use of plants
with deep and vigorous root systems, minimum tillage,
incorporation of green manure and subsoiling are also
recommended procedures. In several regions of the
world, leveled areas lead to yield increases due to the
possibility of using surface irrigation, as mentioned
above. They also promote more efficient use of available
water resources, thereby conserving natural resources.
The main problem in such operations is the cutting
of shallow soils, a practically insoluble problem for
any type of soil. Management practices recommended
to avoid this problem, like removal of the surface
horizon so as to level the B horizon and then restore
the surface horizon, become economically unviable in
many situations. Future research under different
environmental conditions is essential for establishing
technical criteria for land leveling and for defining
the cutting threshold, taking the depth to the B horizon
within the area to be leveled into account.
CONCLUSIONS
1. The agricultural effects from land leveling were
negative since it increased soil bulk density and
dispersed clay, and decreased total porosity, macro
and micro porosity, weighted average diameter of
aggregates, available water capacity and electrical
conductivity. The spatial distributions of all soil
physical properties and the depth of the B horizon in
relation to the soil surface changed.
2. The effect of leveling on all soil physical properties
occurred over the whole area and not specifically in
the cut or fill areas. Therefore, recovery of the physical
soil quality of the leveled areas should be performed
over the total area, not just specifically on cuts or
fills.
3. To design a land leveling plan, a cut/fill map
overlaid on the map of the depth to the top of the B
horizon is recommended so as to minimize problems
from shallow soils after leveling. This overlaying of
maps facilitates the leveling design, and from the
information contained in these maps, it is possible to
To the Brazilian Research Council (CNPq) for
scholarships and funding, and also to the Brazilian
Agricultural Research Corporation (EMBRAPA) for
field support.
LITERATURE CITED
BLAKE, G.R. & HARTGE, K.H. Particle density. In: KLUTE,
A., ed. Methods of soil analysis. 2.ed. Madison, Soil Science
Society of America, 1986. p.377-382.
BROWN, M.B. & FORSYTHE, A.B. Robust test for equality of
variances. J. Am. Stat. Assoc., 69:364-367, 1974.
BRYE, K.R.; SLATON, N.A.; SAVIN, M.C.; NORMAN, R.J. &
MILLER, D.M. Short-term effects of land leveling on soil
physical properties and microbial biomass. Soil Sci. Soc.
Am. J., 67:1405-1417, 2003.
BRYE, K.R.; SLATON, N.A. & NORMAN, R.J. Soil physical
and biological properties as affected by land leveling in a
clayey Aquert. Soil Sci. Soc. Am. J., 70:631-642, 2006.
BRYE, K.R.; SLATON, N.A. & NORMAN, R.J. Penetration
resistance as affected by shallow-cut land leveling and
cropping. Soil Till. Res., 81:1-13, 2005.
CHARNET, R.; BONVINO, H.; FREIRE, C.A.L. & CHARNET,
E.M.R. Análise de modelos de regressão linear. Com
aplicações. Campinas, UNICAMP, 1999. 354p.
DOBERMANN, A.; PAMPOLINO, M.F. & NEUE, H.U. Spatial
and temporal variation of transplanted rice at the field
scale. Agron. J., 87:712-720, 1997.
DOURADO-NETO, D.; POWLSON, D.; BAKAR, R.A.; BACCHI,
O.O.S.; BASANTA, M.V.; CONG, P.T.; KEERTHISINGHE,
G.; ISMAILI, M.; RAHMAN, S.M.; REICHARDT, K.;
SAFWAT, M.S.A.; SANGAKKARA, R.; TIMM, L.C.;
WANG, J.Y.; ZAGAL, E. & van KESSEL, C. Multiseason
recoveries of organic and inorganic nitrogen-15 in tropical
cropping systems. Soil Sci. Soc. Am. J., 74:139-152, 2010.
ECK, H.V. Characteristics of exposed subsoil - At exposure
and 23 years later. Agron. J., 79:1067-1073, 1987.
EMPRESA BRASILEIRA DE PESQUISA AGROPECUÁRIA EMBRAPA. Centro Nacional de Pesquisa de Solo. Sistema
brasileiro de classificação de solos. Brasília, 2006. 306p.
FERREIRA, L.H.G.; GOMES, A.S.; PARFITT, J.M.B.; SILVA,
C.A.S. & GOMES, D.N. Produtividade do arroz, milho e
soja em sistema de rotação influenciada pela altura de
corte/aterro em várzea sistematizada. In: CONGRESSO
BRASILEIRO DE ARROZ IRRIGADO, 3., Camboriú,
2003. Anais... Florianópolis, Sociedade Brasileira de Arroz
Irrigado, 2003. v.1, p.765-767.
R. Bras. Ci. Solo, 38:315-326, 2014
326
José Maria Barbat Parfitt et al.
GEE, G.W. & BAUDER, J.W. Particle-size analysis. In: KLUTE,
A., ed. Methods of soil analysis. 2.ed. Madison, Soil Science
Society of America, 1986. p.383-411.
GREGO, C.R.; VIEIRA, S.R. & LOURENÇÃO, A.L. Spatial
distribution of Pseudaletia sequax Franclemlont in triticale
under no-till management. Sci. Agric., 63:321-327, 2006.
JOURNEL, A.G. & HUIJBREGTS, C.H.J. Mining geostatistics.
New York, Academic Press, 1978. 600p.
INSTITUTO RIOGRANDENSE DO ARROZ - IRGA, 2005.
Available: <http://www.irga.rs.gov.br/uploads/anexos/
1292592973censodg3.pdf>. Accessed on: Aug. 15, 2012.
KEMPER, W.D. & ROSENAU, R.C. Aggregate stability and
size distribution. In: KLUTE, A., ed. Methods of soil
analysis. 2.ed. Madison, Soil Science Society of America,
1986. p.425-441.
KLUTE, A. Water retention: Laboratory methods. In: KLUTE,
A., ed. Methods of soil analysis. 2.ed. Madison, Soil Science
Society of America, 1986. p.635-662.
LAUGHLIN, D.H. & MEHRLE, R.K. Straight versus contour
levee rice production practices in Mississipi. Mississippi,
Division of Agriculture, Forestry, and Veterinary
Medicine/Mississippi State University, 1996. p.1-6.
(Bulletin, 1063)
LEVENE, H. Robust test for equality of variances. In: OLKIN,
I.; GHURYE, S.G.; HOEFFDING, W.; MADOW, W.G. &
MANN, H.B., eds. Contribution to probability and statistics.
Stanford, Stanford University Press, 1960. p.278-292.
LIMA, C.L.R.; PAULETTO, E.A.; GOMES, A.S. & SILVA, J.B.
Estabilidade de agregados de um planossolo sob diferentes
sistemas de manejo. R. Bras. Ci. Solo, 27:199-205, 2003.
MILLER, D.M. Variability of soil chemical properties and rice
growth following land leveling. Arkansas Farm Res., 39:14, 1990.
MONTGOMERY, D.C. & RUNGER, G.C. Applied statistics
and probability for engineers. New York, John Wiley &
Sons, 1994. 895p.
NIELSEN, D.R. & WENDROTH, O. Spatial and temporal
statistics: Sampling field soils and their vegetation.
Reiskirchen, Catena Verlag GMBH, 2003. 416p.
NRCS, 2009. Available: <http://soils.usda.gov/technical/
classification/tax_keys>. Accessed: Aug. 20, 2012.
PALMEIRA, P.R.T.; PAULETTO, E.A.; TEIXEIRA, C.F.A.;
GOMES, A.S. & SILVA, J.B. Agregação de um Planossolo
submetido a diferentes sistemas de cultivo. R. Bras. Ci.
Solo., 23:189-195, 1999.
PARFITT, J.M.B. Impacto da sistematização sobre atributos
físicos, químicos e biológico em solos de várzea. Pelotas,
Universidade Federal de Pelotas, 2009. 92p. (Tese de
Doutorado)
PARFITT, J.M.B.; SILVA, C.A.S. & PETRINI, J.A. Estruturação
e sistematização da lavoura de arroz irrigado. In: GOMES,
A.S. & MAGALHÃES JUNIOR, A.M., eds. Arroz irrigado
no Sul do Brasil. Brasília, Embrapa Informação
Tecnológica, 2004. p.237-257.
R. Bras. Ci. Solo, 38:315-326, 2014
PARFITT, J.M.B. & SILVA, C.A.S. Desempenho da soja
cultivada no sistema sulco/camalhão em área de várzeas
sistematizadas - Safras 2003/2004 e 2004/2005. In:
CONGRESSO BRASILEIRO DE ARROZ IRRIGADO, 4.;
REUNIÃO DA CULTURA DO ARROZ IRRIGADO, 28.,
Santa Maria, 2005. Anais... Santa Maria, Sociedade
Brasileira de Arroz Irrigado, 2005. p.587-589.
PARFITT, J.M.B.; TIMM, L.C.; PAULETTO, E.A.; SOUSA, R.O.;
CASTILHOS, D.D.; ÁVILA, C.L. & RECKZIEGEL, N.L.
Spatial variability of the chemical, physical and biological
properties in lowland cultivated with irrigated rice. R.
Bras. Ci. Solo, 33:819-830, 2009.
PEREIRA, A.R.; ANGELOCCI, L.R. & SENTELHAS, P.C.
Agrometeorologia: Fundamentos e aplicações práticas.
Guaíba, Agropecuária, 2002. 478p.
PINTO, L.F.S.; LAUS NETO, J.A. & PAULETTO E.A. Solos de
várzea do Sul do Brasil cultivados com arroz irrigado. In:
GOMES, A.S. & MAGALHÃES JUNIOR, A.M., eds. Arroz
irrigado no Sul do Brasil. Brasília, Embrapa Informação
Tecnológica, 2004. p.75-95.
REICHERT, J.M.; DARIVA, T.A.; REINERT, D.J. & SILVA,
V.R. Spatial variability of a Planosol and soybean yield on
a land-leveled paddy soil: Geostatistical and regression
analysis. Ci. Rural, 38:981-988, 2008.
RHOADES, J.D. Soluble salts. In: PAGE, A.L.; MILLER, R.H.
& KEENEY, D.R., eds. Methods of soil analysis. Madison,
America Society Agronomy, 1982. Part 2. p.167-179.
(Agronomy Monograph, 9)
ROBERTSON, G.P. GS+: Geostatistics for the environmental
sciences. v. 9.0. Plainwell, Gamma Design Software, 2008.
172p.
SAS Institute. Statistical analysis system: User’s guide. 5.ed.
Cary, 1985.
SCHLINDWEIN, J.A. & ANGHINONI, I. Tamanho da
subamostra e representatividade da fertilidade do solo no
sistema plantio direto. Ci. Rural, 32:963-968, 2002.
SILVA, C.A.S. & PARFITT, J.M.B. Utilização do sistema sulco/
camalhão para o cultivo do milho em áreas de várzeas
sistematizadas - safras 2003/2004 e 2004/2005. In:
CARGNELUTTI, A.F. & BARNI, N.A., eds. REUNIÃO
TÉCNICA ANUAL DO MILHO, 50., Porto Alegre, 2005.
Anais... Porto Alegre, Fepagro/Emater, 2005. p.109.
TOMAZELLI, L.J.; DILLENBURG, S.R. & VILLWOCK, J.A.
Late quaternary geological history of Rio Grande do Sul
coastal plain, southern Brazil. R. Bras. Geosci., 30:474476, 2000.
WEBSTER, R. & OLIVER, M.A.
Geostatistics for
environmental scientists. West Sussex, John Wiley &
Sons, 2001. 271p.
WHITNEY, R.S.; GARDNER, R. & ROBERTSON, D.W. The
effectiveness of manure and commercial fertilizer in
restoring the productivity of subsoils exposed by leveling.
Agron. J., 42:239-245, 1950.
WINKLER, E.I.G. & GOEDERT, W.J. Características hídricas
dos solos de Pelotas, Rio Grande do Sul. Pesq. Agropec.
Bras., 7:1-4, 1972.
Baixar