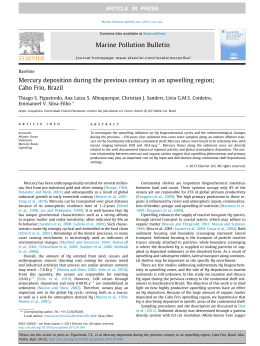
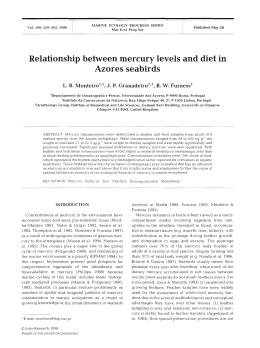
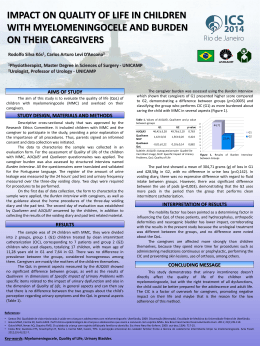
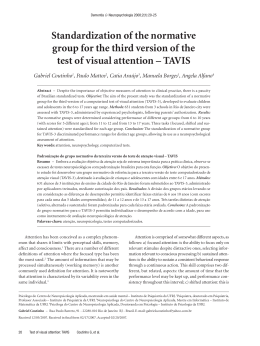
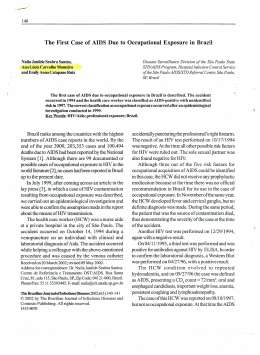
JOEM • Volume 51, Number 12, December 2009 1403 Preliminary Findings on the Effects of Occupational Exposure to Mercury Vapor Below Safety Levels on Visual and Neuropsychological Functions Mirella Telles Salgueiro Barboni, MSc Cláudia Feitosa-Santana, PhD Elaine Cristina Zachi, MSc Marcos Lago, MSc Rosani Aparecida Antunes Teixeira, MSc Anita Taub, MSc Marcelo Fernandes da Costa, PhD Luiz Carlos de Lima Silveira, PhD Dora Fix Ventura, PhD N Objective: To evaluate whether there are visual and neuropsychological decrements in workers with low exposure to Hg vapor. Methods: Visual fields, contrast sensitivity, color vision, and neuropsychological functions were measured in 10 workers (32.5 ⫾ 8.5 years) chronically exposed to Hg vapor (4.3 ⫾ 2.8 years; urinary Hg concentration 22.3 ⫾ 9.3 g/g creatinine). Results: For the worst eyes, we found altered visual field thresholds, lower contrast sensitivity, and color discrimination compared with controls (P ⬍0.05). There were no significant differences between Hg-exposed subjects and controls on neuropsychological tests. Nevertheless, duration of exposure was statistically correlated to verbal memory and depression scores. Conclusions: Chronic exposure to Hg vapor at currently accepted safety levels was found to be associated with visual losses but not with neuropsychological dysfunctions in the sample of workers studied. (J Occup Environ Med. 2009;51:1403–1412) From the Neuroscience and Behavior (Ms Barboni, Dr Feitosa-Santana, Ms Zachi, Mr Lago, Ms Teixeira, Dr da costa, Dr Ventura), University of Sao Paulo, Sao Paulo, Brazil; Department of Experimental Psychology (Ms Barboni, Dr Feitosa-Santana, Ms Zachi, Mr Lago, Ms Teixeira, Dr da Costa, Dr Ventura), Institute of Psychology, University of Sao Paulo, Sao Paulo, Brazil; Department of Psychology (Dr Feitosa-Santana), University of Chicago, Chicago, Ill; Visual Science Laboratories and Institute for Mind and Biology (Dr Feitosa-Santana), University of Chicago, Chicago, Ill; Department of Psychiatry (Ms Taub), Faculty of Medicine, University of Sao Paulo, Sao Paulo, Brazil; Tropical Medicine Nucleus (Dr Silveira), Federal University of Para, Belem, Brazil; and Institute of Biological Sciences (Dr Silveira), Federal University of Para, Belem, Brazil. This research was approved by the Human Research Ethics Committees of the Institute of Psychology and of the University Hospital, University of São Paulo (Authorization numbers 0303 and 0606). Address correspondence to: Mirella Telles Salgueiro Barboni, MSc, Av. Prof. Mello Moraes, 1721, Bloco A, Sala D9, 05508-900 São Paulo, SP, Brazil; E-mail: [email protected]. Copyright © 2009 by American College of Occupational and Environmental Medicine DOI: 10.1097/JOM.0b013e3181bca9ea eurological and neuropsychological impairment because of exposure to mercury (Hg) vapor has been demonstrated in different occupationally exposed populations,1– 4 and its toxic effect on the human visual system has been reported in several studies.5–10 Nevertheless, there is no clear knowledge of the level of exposure at which Hg vapor causes adverse effects. Visual impairment has been found in subjects with very low urinary Hg concentration, such as children exposed to inorganic Hg in their living environment11 and dentists exposed to inorganic Hg because of the manipulation of dental amalgam in their work environment.12 Both groups had urinary Hg concentration below the level considered safe for nonexposed individuals (⬍5 g Hg/g creatinine).11,12 The American Conference of Governmental Industrial Hygienists has recommended a threshold limit for monitoring of urinary Hg concentration of 35 g Hg/g creatinine.13 The World Health Organization (1980) had previously suggested the limits of 5 g/100 mL for blood Hg concentration and of 50 g/g creatinine for urinary Hg concentration in occupational exposure.14 Nevertheless, neuropsychological effects of Hg intoxication have been revealed at concentrations lower than these safety levels.15 Evidence for neurobehavioral impairment because of occupational exposure to inorganic Hg at urinary concentrations 1404 Visual Dysfunctions in Occupational Exposure to Hg • Barboni et al TABLE 1 Demographic Information and Professional Description of Hg-Exposed Subjects N Gender Age (yr) Function Exclusion Motive Urinary (Hg)* 1 2 3 4 5 6 7 8 9 10 11 12 13 14 15 16 17 18 19 20 21 F M M M M M M M M M M F M M M M F M M F M Mean (SD) Mean (SD) 23 29 45 62 48 29 57 25 25 30 36 24 30 27 32 25 52 29 42 19 33 34.4 (12) 32.5 (8.5) Laboratory technician Driver Mechanic Doorman Reactor operator, fluorescent lamp breaker Machine maintenance Gardener Doorman Production supervisor Reactor operator, fluorescent lamp breaker Reactor operator, fluorescent lamp breaker Office assistant Reactor operator, fluorescent lamp breaker Breaking fluorescent lamps Unpacking and breaking fluorescent lamps Machine maintenance and unpacking Cleaner Reactor operator, fluorescent lamp breaker Reactor operator, fluorescent lamp breaker Office assistant Reactor operator, fluorescent lamp breaker No direct exposure Smoker Smoker Smoker Neurologic history No direct exposure Other substances Smoker No direct exposure Smoker No direct exposure - 30.8 5.3 29.7 No information 38.1 24 11 No information 14.8 23.2 22.8 8 22.4 No information 11.8 34.6 34.9 20.2 12.5 18.6 8.7 20.6 (10.1) 22.3 (9.3) Study subjects *g Hg/g creatinine. below 100 g Hg/g creatinine has been reported.16 A meta-analysis performed with results from 12 studies of occupational Hg exposure showed a significantly lower performance of Hg-exposed subjects compared with the control group.16 Some studies showed evidence for neuropsychological decrements associated with low Hg concentrations on attention, visual perception, memory, and psychomotor speed.1,15 There is, however, some controversy concerning the occurrence of neuropsychological deficits in workers exposed to Hg.16 In line with previous evidence that Hg vapor can have neurological effects at very low levels of exposure, the objective of this study was to evaluate whether there are decrements in visual and neuropsychological functions in workers with assumed low exposure to Hg vapor. Materials and Methods Subjects Table 1 presents demographic and occupational information for the 21 TABLE 2 Demographic Information of Control Groups Automated perimetry Contrast sensitivity function Color vision test—D15d Color vision test—CCT Neuropsychological tests N Age (yr) Male/Female 20 10 20 20 9 39.6 ⫾ 6.9 35.6 ⫾ 9.0 34.5 ⫾ 9.1 31.8 ⫾ 5.0 37.1 ⫾ 5.7 12/8 8/2 13/7 10/10 8/1 Hg-exposed subjects evaluated and for the 10 subjects included in the study. The mean age and the mean urinary Hg levels are given separately. Table 2 provides demographic information for the control subjects. Hg-exposed subjects were workers from a mercury recycling industry in Paulínia, São Paulo, Brazil, who were sent to our laboratory by the National Agency of Sanitary Vigilance to have their visual and neuropsychological functions tested. The National Agency of Sanitary Vigilance had monitored their urinary Hg concentrations, periodically, along with general health examinations. From 21 subjects, only 1 had urinary Hg value above the threshold limit recommended by American Conference of Governmental Industrial Hygienists and his results were not included in the study because he was a smoker. From 21 workers evaluated, 11 had to be excluded for the following reasons: smoking (5), workers who had no direct Hg exposure (4), previous exposure to other hazardous substances (1), and neurologic history (1). Hg-exposed subjects included were 10 workers (8 men and 2 women) aged from 23 to 52 years (mean, 32.5 ⫾ 8.5 years), who had been exposed to Hg vapor between 1.5 and 9 years (mean, 4.3 ⫾ 2.8 years), and at the time of JOEM • Volume 51, Number 12, December 2009 examination had 8.7 to 34.9 g Hg/g urinary creatinine (mean, 22.3 ⫾ 9.3 g Hg/g urinary creatinine). Mercury level, in g Hg/g urinary creatinine, was measured using atomic absorption spectrophotometry that involves reduction, aeration, and reading of Hg vapor absorption at 253.7 nm in a quartz cell.17,18 The workers had different occupational functions, including one laboratory technician, one cleaner, two subjects working on machine maintenance (one of which also unpacking lamps), one working on unpacking and breaking fluorescent lamps, and five reactor operator/ fluorescent lamp breaker (Table 1). Results were compared with those of 5 different control groups (1 for each test) comprising a total of 79 healthy subjects. The control subjects were unexposed individuals, including students, professors, and workers (and also their relatives) from the Institute of Psychology, to which the laboratory belongs. Their results are part of the laboratory’s database and were collected by different researchers at different times (Table 2). Testing was conducted by six different examiners, each of whom had experience with at least one of the tests. Those who conducted the neuropsychological tests and psychiatric inventories had a degree in Psychology in addition. Exclusion criteria were visual acuity, measured with the Snellen optotypes, worse than 20/25; known ophthalmological or neurological diseases; congenital color vision deficiencies; exposure to other heavy metals besides Hg; alcoholism; and smoking. All subjects were screened for congenital color vision deficiencies with the D-15 test.19 Informed consent was signed by all subjects. The procedures complied with the tenets of the Declaration of Helsinki and were approved by the Research Ethics Committees of the Institute of Psychology and of the University Hospital, University of São Paulo. We performed all visual tests monocularly, with one eye opened and the other one covered. For the Hgexposed subjects, the tests were performed monocularly in both eyes. For the control subjects, only one eye, randomly chosen, was tested. The neuropsychological tests were administered binocularly for both groups. The tests were performed in the same day with intervals for lunch and breaks to avoid fatigue effects. Equipments, Tests, and Procedures Visual Field Tests. The Humphrey Field Analyzer II-model 750i (HFA; Zeiss Humphrey Systems, Dublin, CA) was used to measure light sensitivity against an illuminated background. Two tests were performed in random order for the different subjects. One was the standard automated perimetry (SAP), also called conventional perimetry or white-onwhite perimetry, and the other was the short wavelength automated perimetry (SWAP) or blue-on-yellow perimetry. The SAP test used the Swedish interactive threshold algorithm and the standard central 30-2 strategy. At each visual field location, a spot of white light (4 mm2 viewed at 30 cm) was presented on a 10-cd/m2 white background for 200 ms. For the SWAP test, the fullthreshold central 30-2 strategy was used. The stimuli were blue (440 nm) spots of light (64 mm2 viewed at 30 cm) presented for 200 ms on a 100cd/m2 yellow background. The observer’s task was to press a button to indicate the presence of the light spot whenever it was detected. Sequences of test stimuli were randomly presented throughout 27° of visual field, and the sensitivity at each location was determined by the standard Humphrey staircase procedure. The visual threshold was calculated as the average of the four measurements. Luminance Spatial Contrast Sensitivity Test. The luminance spatial contrast sensitivity was measured with the computerized program 1405 PSYCHO for Windows version 2.36 software (Cambridge Research Systems, Rochester, England). The stimuli used were achromatic horizontal sinusoidal gratings with an average luminance 34.4 cd/m2, and they were produced in a 19-in FD Trinitron CPD-G420 CRT monitor (Sony Electronics, Tokyo, Japan) through a VSG 2⁄4 graphics board (Cambridge Research Systems, Rochester, England), with a 100-Hz temporal resolution and 800 ⫻ 600 spatial resolution. Monitor luminance and chromatic calibrations were performed with a Minolta CS-1000A photometer (Konica Minolta, Tokyo, Japan). The spatial frequencies used were 3, 6, 12, and 18 cycles/degree (cpd), and the subjects were positioned 1.5 m away from the monitor, providing 4° visual angle. To determine the contrast sensitivity function, we used the method of adjustments. With this psychophysical method, the subject’s task was to adjust the contrast to its minimum perceived level, through a response box, in steps of 1% through ascending and descending presentations of gratings. The number of trials in the protocol resulted from previous research in our laboratory aimed at establishing a testing procedure sufficiently rigorous to yield reproducible results and not too long, given the time constraints of clinical populations.6,12 Color Vision Tests D-15 D Test. The D-15 d test (Luneau SAS, Prunayle-Gillon, France) comprises 16 color chips, 1.2 cm in diameter, in a black plastic support. The colors of the chips were defined by the Munsell system.20 The chips of the D-15 d test had the same lightness (value ⫽ 5) and saturation (chroma ⫽ 4). The color chips were placed on a desktop covered with a black cloth. The subject was instructed to arrange the colors in a continuous order. An illumination of 500 lux was provided by two fluorescent lamps (Sylvania Octron 6500 K FO32W/65K Day-Light, Munich, Germany). The total color difference score (TCDS) was calculated to express discrimination capacity.21 1406 Higher TCDS score values indicate deviation from the errorless cap arrangement. The minimum TCDS value for the correct order for this test is 56.41. Cambridge Colour Test (CCT). This test was performed using the CCT version 2.0 software (Cambridge Research Systems, Rochester, England) in a microcomputer XTC-600 (Dell Dimension, Winston-Salem, NC) equipped with a VSG 5 graphics card (Cambridge Research Systems) and a Sony FD Trinitron color monitor GDMF500T9 (Sony Electronics), with 100 Hz temporal resolution and 800 ⫻ 600 spatial resolution. Monitor luminance and chromatic calibrations were performed with a Minolta CS-1000A photometer (Konica Minolta). Visual stimuli consisted of a Landolt “C” target, composed of circles of a given chromaticity having a series of different randomly chosen sizes and luminances, which were presented against a background of constant chromaticity. Tests were performed in a dark room with illumination provided only by the monitor with the visual stimuli. A subject was positioned 2.6 m away from the monitor providing 18° of visual angle for the gap in the Landolt “C” target. The gap appeared randomly in one of four orientations (up, down, left, and right), and the subject’s task was to indicate the position of the opening by pressing a corresponding button of a response box. The Trivector test measured color discrimination thresholds relative to a background chromaticity (Comission Internationale de l’Éclairge [CIE] 1976: u⬘ ⫽ 0.1977, v⬘ ⫽ 0.4698) as excursions in u⬘v⬘ units along the protan, deutan, and tritan confusion axes. The Ellipse test measured color discrimination thresholds along eight color space vectors around the same background chromaticity. The CCT version 2.0 software calculates a threshold for each vector after 11 reversals using the last 7 trials, which is the part of the staircase that should be around the threshold area. The program does not include the first reversals, because they depend on the starting point, which is far from the threshold. Neuropsychological Tests and Psychiatric Inventories. The aim of the neuropsychological assessment is to investigate the cognitive expression of brain functioning. Neuropsychological instruments were included in this study to examine the possible impact of mercury on cognitive function. The Visual Dysfunctions in Occupational Exposure to Hg assessment battery included measures of 1) information processing speed efficiency; 2) executive function, which includes complex processes intrinsic to the ability to respond adaptively to new situations and demands of the environment; 3) short-term and longterm memory assessed verbally and visually; 4) motor performance, which is known to be impaired in many neurological conditions; and 5) visuoconstructional ability that requires planning and visuoperceptual skills. Since cognitive deficits and mood alterations can interact, depression and anxiety symptoms inventories were administered. Stroop Test. This task evaluated information processing speed, inhibitory control ability, and selective attention. In part 1, the subject was asked to name colors printed in rectangles. Then, the subject was required to name colors printed in “neutral” words (noncolors; part 2). In part 3, color names printed in nonmatching colors were presented, and the subject was asked to name the printed color.22 Buschke Selective Reminding Test (SRT). The Buschke Selective Reminding Test assessed the ability to learn new verbal information and retrieval efficiency. A 12item list of unrelated words was verbally presented, and the subject was required to recall as many of them as possible during multiple trials. A delayed recall trial was administered 30 minutes later.22 • Barboni et al the letters “F,” “A,” and “S” during a 60-second period.22 Grooved Pegboard. The Grooved Pegboard (Lafayette Instrument Company, Indiana, IN) provided a measure of manual dexterity, psychomotor speed, and visual-motor coordination. The test consists of a pegboard with 25 holes with randomly positioned slots and 25 key-shaped pegs that match them. Subjects were required to insert the pegs into the holes as quickly as possible by rotating them.22 Block Design. This subtest of the Wechsler Adult Intelligence Scale (Psychological Corporation) assessed visuospatial organization and planning skills. The task consisted of reproducing 9-printed patterns with blocks.22 The Beck Depression Inventory (BDI). The BDI rate depression symptoms inventory is composed of 21 questions presented in a multiple choice format.22 A Portuguese version of the BDI (Casa do Psicólogo, São Paulo, Brazil) was administered. State-Trait Anxiety Inventory (STAI). The State-Trait Anxiety Inventory consists of two 20-item subscales and provides measures of anxiety symptoms that differentiate a temporary condition (state anxiety) and stable qualities (trait anxiety). Subjects filled a Portuguese version of the State-Trait Anxiety Inventory (Centro Editor de Psicologia Aplicada, Rio de Janeiro, Brazil).23 Analysis Visual Reproduction. The visual reproduction, a subtest of the Wechsler Memory Scale (Psychological Corporation, San Antonio, TX), is a measure of immediate and long-term visual memory in which the subject was asked to reproduce four increasingly complex geometric pictures, one at a time, after a 10-second presentation period. Delayed recall trial was administered 30 minutes later.22 Controlled Oral Word Association Test. The Controlled Oral Word Association Test is a verbal fluency test widely used as a measure of executive function. The subject was required to generate as many words as possible beginning with each of Because the data were not normally distributed, we applied nonparametric tests (Mann-Whitney U test and Wilcoxon matched pair test), with the level of significance of P ⬍ 0.05 (Statistica 6.0; StatSoft, Tulsa, OK). In addition, linear regression and correlation analyses were performed to investigate a possible relation between results and exposure time to Hg vapor, and Hg urinary concentrations. The statistical power was calculated for each test considering the parameters showing statistic differences between controls and Hg-exposed subjects. We used the averages and SDs (two-tailed test). JOEM • Volume 51, Number 12, December 2009 1407 45 Hg-Exposed Workers Best Eyes P Worst Eyes P ⫺0.4 ⫾ 0.8 36.5 ⫾ 1.7 33.2 ⫾ 1.0 32.2 ⫾ 1.0 29.6 ⫾ 1.1 29.3 ⫾ 1.3 27.6 ⫾ 2.0 ⫺2.5 ⫾ 2.4 35.9 ⫾ 3.9 31.2 ⫾ 3.7 30.4 ⫾ 3.1 27.8 ⫾ 2.8 27.6 ⫾ 2.8 26.3 ⫾ 2.5 0.001* 0.856 0.119 0.070 0.056 0.067 0.161 ⫺3.1 ⫾ 2.5 35.9 ⫾ 4.0 30.9 ⫾ 2.9 29.4 ⫾ 2.8 26.9 ⫾ 2.6 27.3 ⫾ 3.1 25.9 ⫾ 3.9 0.001* 0.611 0.059 0.002* 0.003* 0.056 0.657 Hg Best eyes Hg Worst eyes * 35 A * 30 25 20 15 35 * 30 B * * 25 20 15 10 5 0 3 9 15 21 27 Degrees of eccentricity ⫺4.1 ⫾ 2.3 22.9 ⫾ 4.5 25.0 ⫾ 3.3 24.4 ⫾ 3.8 21.6 ⫾ 3.0 20.6 ⫾ 3.8 18.4 ⫾ 4.0 0.010* 0.646 0.241 0.959 0.839 0.959 0.878 ⫺5.6 ⫾ 2.6 23.7 ⫾ 3.2 23.9 ⫾ 2.8 22.7 ⫾ 3.0 19.9 ⫾ 3.2 18.9 ⫾ 4.0 17.2 ⫾ 4.1 0.001* 0.858 0.023* 0.047* 0.047* 0.140 0.386 P values indicate the comparison between controls and Hg-exposed workers (best and worst eyes). *Statistically different from controls. MD, mean deviation; F, foveal threshold. Results Visual Field Tests Two Hg-exposed subjects failed the reliability test and were excluded. Hg-exposed subjects’ eyes were separated in two groups— best eyes and worst eyes— based on their mean deviation (Humphrey mean result). Visual field tests revealed losses in 6 of 8 subjects of the Hg-exposed group. Table 3 presents the basic statistics for the visual field test results for both, controls and Hgexposed subjects. Significant sensitivity reductions for the Hg-exposed subjects relative to the control group at some regions of their visual fields were found in both tests. Compared with the controls, 9° and 15° of eccentricity were different for the worst eyes (P ⬍ 0.01). Similar results were found in the SWAP: 3°, 9°, and 15° of eccentricity were different for the worst eyes (P ⬍ 0.03, P ⬍ 0.05, and P ⬍ 0.05, respectively) compared with the controls (Mann-Whitney U test). The mean sensitivity at the fovea of the best and the worst eyes did not differ from the controls for either the SAP (Fig. 1A) or the SWAP (Fig. 1B) procedures. Nevertheless, at five concentric eccentricity rings, from 3° to 27° of visual angle, there was a lower sensitivity for both best and worst eyes at all eccentricities, with statistical significance for the worst eyes at 9° and 15° for the SAP, and at 3°, 9°, and 15° for the SWAP (Fig. 1). The mean deviation values—a location weighted mean of the values in the total deviation plot—showed a significant difference for the Hgexposed subjects compared with the controls for the SAP (P ⬍ 0.01; Fig. 2A) and the SWAP (P ⬍ 0.02; Fig. 2B), with similar results between best and worst eyes (SAP, P ⫽ 0.44; and SWAP, P ⫽ 0.07; Wilcoxon matched pair test; Fig. 2). The statistical power ranged from 51% to 97% (two-tailed test), and we assumed that the low power for some parameters is explained by the low number of workers included in the study. There was no correlation between visual field test results and duration of exposure to the Hg vapor (P ⫽ 0.27) or their urinary Hg concen- Fig. 1. Visual field results. Mean sensitivity at the fovea and for the locations within five concentric eccentricity rings from 3° to 27° of visual angle. Normative data are shown by upper and lower limits (gray bars). The data from the Hg-exposed workers are plotted individually as filled diamonds (gray, best eyes; black, worst eyes). A, SAP: for the worst eyes, 9° and 15° of eccentricity were different compared with controls (P ⬍ 0.01). B, SWAP: for the worst eyes, 3°, 9°, and 15° of eccentricity were different compared with controls (P ⬍ 0.05). 2 A 0 Mean Deviation ⫺1.8 ⫾ 1.5 23.8 ⫾ 3.8 26.4 ⫾ 2.6 25.1 ⫾ 2.6 22.4 ⫾ 2.4 21.0 ⫾ 2.8 19.0 ⫾ 3.6 -2 -4 -6 -8 -10 2 B 0 Mean Deviation SAP MD F 3° 9° 15° 21° 27° SWAP MD F 3° 9° 15° 21° 27° Controls Controls mean ± SD 40 Visual Sensitivity (dB) TABLE 3 Means and SDs of the MD and of the Sensitivities Measured at the Fovea and at Each of the Five Concentric Eccentricity Rings for the Controls and for the Best and Worst Eyes of the Hg-Exposed Workers, Using the SAP and SWAP -2 -4 -6 -8 -10 Controls Hg Best Eyes Hg Worst Eyes Fig. 2. Global sensitivity results expressed as mean deviation values of the visual field examinations for the Hg-exposed subjects (n ⫽ 8) and for the controls (n ⫽ 20). There was a significant reduction of the mean deviation in both eyes (light gray, best eyes; dark gray, worst eyes) for both tests: A, SAP (P ⬍ 0.01) and B, SWAP (P ⬍ 0.02) compared with controls. 1408 Visual Dysfunctions in Occupational Exposure to Hg TABLE 4 Mean and SD of the Luminance Spatial Contrast Sensitivity Function for the Controls and for the Best and Worst Eyes of the Hg-Exposed Workers Hg-Exposed Workers SF Controls Best Eyes P Worst Eyes P 3 cpd 6 cpd 12 cpd 18 cpd 150.5 ⫾ 21.0 151.8 ⫾ 36.8 105.6 ⫾ 44.9 62.5 ⫾ 40.8 141.0 ⫾ 40.5 125.0 ⫾ 42.4 81.9 ⫾ 34.8 37.9 ⫾ 21.8 0.845 0.434 0.770 0.283 115.4 ⫾ 32.1 112.9 ⫾ 40.2 50.2 ⫾ 22.3 43.7 ⫾ 35.7 0.129 0.204 0.019* 0.435 P-values are indicating the comparison between controls and Hg-exposed workers (best and worst eyes). *Statistically different from controls. SF, spatial frequency. their urinary Hg concentrations at the time of examination (P ⫽ 0.05). Contrast Sensitivity 1000 * 100 Color Vision Tests 10 1 0 Controls mean ± SD 3 Hg Best eyes Hg Worst eyes 6 12 18 Spatial frequency (cpd) Fig. 3. Contrast sensitivity results at four different spatial frequencies (3, 6, 12, and 18 cpd). Normative data are shown by upper and lower limits (gray bars). The data from the Hg-exposed workers are plotted individually as filled diamonds (gray, best eyes; black, worst eyes). For the worst eyes, 12 cpd was statistically different for the Hg-exposed subjects compared with controls (P ⬍ 0.02). trations at the time of examination (P ⫽ 0.25). Luminance Spatial Contrast Sensitivity Test The luminance spatial contrast sensitivity was significantly lower in Hg-exposed subjects compared with controls for the 12-cpd spatial frequency for the worst eyes (P ⬍ 0.02), and the statistical power was 91.9% (two-tailed test). For the other spatial frequencies tested, there were no significant differences compared with controls, for either the best eyes (P ⫽ 0.28) or for the worst eyes (P ⫽ 0.13; Mann-Whitney U test; Table 4 and Fig. 3). We did not find any correlation between luminance spatial contrast sensitivity results and length of exposure to the Hg vapor (P ⫽ 0.09) or D-15 D Test. The TCDS was calculated to express discrimination capacity.21 TCDS was 56.87 ⫾ 1.43 for the controls. In the Hg-exposed subjects, TCDS was elevated relative to controls for both best eyes (58.37 ⫾ 3.76) and worst eyes (62.00 ⫾ 5.43). The difference was statistically significant for the worst eyes (P ⬍ 0.01) but not for the best eyes (P ⫽ 0.15; Mann-Whitney U test). There was also significant difference between best and worst eyes (P ⬍ 0.05; Wilcoxon matched pair test). CCT. The color discrimination thresholds of the three vectors tested (protan, deutan, and tritan) did not differ between Hg-exposed subjects and controls for both best eyes (P ⫽ 0.18) and worst eyes (P ⫽ 0.17). There was no difference between Hg-exposed subjects and control subjects for all parameters of the Ellipse test for the best eyes (P ⫽ 0.18). For the worst eyes, we found a difference for the axis ratio (P ⬍ 0.01) and for the minor axis (P ⬍ 0.04; Mann-Whitney U test); the statistical power was 83.5% (twotailed test; Table 5 and Fig. 4). There was no difference between best and worst eyes of Hg-exposed subjects for all CCT parameters (P ⫽ 0.34), except for the tritan threshold (P ⬍ 0.01; Wilcoxon matched pair test). No correlation was found be- • Barboni et al tween color vision results and number of years of exposure to the Hg vapor (P ⫽ 0.07) or their urinary Hg concentrations at the time of examination (P ⫽ 0.06). Neuropsychological Tests and Psychiatric Inventories The Hg-exposed group and the control group did not differ in terms of any neuropsychological measure, indicating similar cognitive performances. There were also no significant differences between groups regarding the mood inventories, suggesting equivalent depression and anxiety profiles (Table 6). Nevertheless, significant correlations were found between duration of exposure on the following scores of the Buschke Selective Reminding Test: long-term retrieval (R ⫽ 0.72, P ⬍ 0.02), long-term storage (R ⫽ ⫺0.73, P ⬍ 0.02), and randomic long-term retrieval (R ⫽ ⫺0.67, P ⬍ 0.04; Spearman correlation). Indeed, duration of exposure had significant relation to the BDI (R ⫽ 0.68, p ⬍ 0.04) scores, suggesting that exposure is a predictor of higher scores on the BDI. Regarding the verbal memory test, duration of exposure predicted a lesseffective encoding of verbal stimuli. Discussion The results obtained in this study showed visual dysfunction in subjects occupationally exposed to Hg vapor within the accepted safety levels of urinary Hg concentration (mean, 22.3 ⫾ 9.3 g Hg/g creatinine). The exposure length ranged between 1.5 and 9 years (mean, 4.3 ⫾ 2.8 years), but there was no correlation between losses and length of exposure. High levels of chronic exposure to Hg vapor are known to cause neuropsychological impairment, as well as damage to visual functions mediated by central vision, such as contrast sensitivity function and color discrimination, and visual field losses.4 –10,15,24 Much less is known about nervous system alterations that JOEM • Volume 51, Number 12, December 2009 1409 TABLE 5 Mean and SD of the Trivector Test for the Controls and for the Best and Worst Eyes of the Hg-Exposed Workers Hg-Exposed Workers Trivector Protan Deutan Tritan Controls Best Eyes P Worst Eyes P 56.7 ⫾ 21.5 54.5 ⫾ 18.7 99.5 ⫾ 42.1 65.9 ⫾ 37.2 64.8 ⫾ 45.6 79.9 ⫾ 43.3 0.523 0.791 0.183 60.9 ⫾ 34.0 64.4 ⫾ 35.1 108.9 ⫾ 54.6 0.877 0.628 0.613 Controls Hg Best eyes Hg Worst eyes Fig. 4. MacAdam’s ellipses presented within the CIE 1976 chromaticity diagram (u⬘v⬘ units) for the controls, and for the best and worst eyes for the Hg-exposed subjects. Bold line, mean; regular line, mean plus one SD. may occur at low level exposure to Hg vapor, even if it is known that the estimated number of workers exposed to low level of Hg vapor in the world is in the order of several thousands.25 Some studies have suggested that the neurobehavioral effects of Hg exposure have not determined a level of exposure that is convincingly safe. Evidence for impairments has been reported at occupational exposure to Hg vapor at urinary concentrations below 100 g Hg/g creatinine in a meta-analysis of neurobehavioral results.16 As a result of gold mining and other anthropogenic factors, which cause Hg release in the Amazon basin, fishes exhibit high levels of methylmercury contamination. Fishes constitute an important component of the basic diet of riverine communities.26 The exposure of this population to methylmercury through fish consumption has been associated with visual dysfunction and with other Hg intoxication symptoms.27–29 These symptoms have also been found among populations living in regions situated far away from the gold mines,30 but depending on eating fish as their main diet component.26 Most of the knowledge on visual field effects caused by Hg intoxication comes from the studies after methylmercury exposure in Japan (1950s) and Iraq (1970s). The Minamata disease, caused by ingestion of methylmercury contaminated seafood from the Minamata bay and the neighboring areas in Japan, has been regarded as the typical neurological description of the concentric constriction of the visual field.31–34 Visual field constriction has been correlated with significant impairments in the calcarine cortex shown by magnetic resonance imaging.35,36 In the early 1970s in Iraq, as a result of poisoning of farmers by consumption of grain treated with methylmercury as fungicide, the visual field changes in most of the patients were also described as concentric constriction.37 Visual field losses have also been found to result from exposure to Hg vapor. In workers chronically exposed to high levels of Hg vapor for 10 years in average, we found sensitivity reduction at all eccentricities tested—from the fovea to 27° at the peripheral visual field.9 In the present study, we have found reductions for the Hg-exposed subjects’ worst eyes tested with SAP at 9° and 15° of eccentricity, and with SWAP at 3°, 9°, and 15° of eccentricity. At high levels of methylmercury intoxication, the calcarine area of the visual cortex exhibited atrophy, which produced visual symptoms.35,36 Even at low levels of exposure to methylmercury, the calcarine area had changes in its glial cells in monkeys.38,39 In the case of Hg vapor, magnetic resonance imaging showed a mild central and cortical atrophy in frontal regions and in the subcortical white matter in a subject exposed to Hg vapor in a thermometer factory, and this was related to the difficulties in neuropsychological tests.40 Some pathophysiological differences between methylmercury and Hg vapor intoxication may occur because of the kinetics and biotransformation of Hg in the organism that depend on its chemical and physical form.41 Exposure to Hg vapor has been demonstrated to produce Hg deposits in the primate retinas. In adult monkeys exposed to Hg vapor by inhalation, autometallographic techniques showed that Hg accumulates in both glial cells and neuronal cells in the retina, with some differences in accumulation between central and peripheral retinal regions. A detailed topographic analysis showed Hg deposits in the central and midperipheral parts of the retina but not in the peripheral retina.42,43 Furthermore, retinal damage has been found in methylmercury intoxication as a reduction of the density in amacrine and bipolar cells, and alterations of the horizontal cells by electrophysiological measurements.44,45 In humans exposed to Hg vapor, electrophysiological evidence for impairment of the peripheral retina has been found in 1410 Visual Dysfunctions in Occupational Exposure to Hg TABLE 6 Comparison of Neuropsychological Scores Between Hg-Exposed Workers and Controls Test and Domains Examined Stroop* (inhibitory control) Part 1 Part 2 Part 3 SRT (verbal memory) Total words recalled Long-term recall (LTR) Long-term storage (LTS) Randomic long-term recall (RLTR) Consistent long-term recall (CLTR) Delayed recall Visual reproduction (visual memory) Immediate recall Delayed recall FAS (verbal fluency) Grooved pegboard* (manual dexterity) Dominant hand Nondominant hand Block design (visuospatial function) BDI (depression) STAI (anxiety) State Trait Controls Hg-Exposed Workers P 15.0 ⫾ 5.1 17.6 ⫾ 6.2 28.8 ⫾ 9.1 15.4 ⫾ 3.9 22.7 ⫾ 11.3 30.8 ⫾ 10.3 0.91 0.42 0.55 101.6 ⫾ 11.3 102.6 ⫾ 18.1 102 ⫾ 18.1 38.1 ⫾ 12.3 66.6 ⫾ 33.7 8.8 ⫾ 1.7 113.9 ⫾ 10.8 104.2 ⫾ 32.0 106.7 ⫾ 22.5 26.5 ⫾ 10.4 71.1 ⫾ 27.4 9.4 ⫾ 2.9 0.22 0.29 0.49 0.11 0.71 0.88 19.3 ⫾ 6.0 20.2 ⫾ 9.6 33.6 ⫾ 6.9 31.8 ⫾ 7.3 26.8 ⫾ 8.3 26.2 ⫾ 10.3 0.11 0.41 0.10 74.5 ⫾ 5.7 78.3 ⫾ 14.3 25.7 ⫾ 8.4 8.0 ⫾ 8.2 71.4 ⫾ 13.7 73.4 ⫾ 6.7 23.7 ⫾ 9.3 6.7 ⫾ 5.9 0.11 0.23 0.73 0.46 42.8 ⫾ 11.1 40.0 ⫾ 13.5 41.2 ⫾ 9.5 42.0 ⫾ 9.7 0.96 0.79 *Results are time in seconds. SRT, Bushcke selective reminding test; FAS, verbal fluency; BDI, Beck Depression Inventory; STAI, State Trait Anxiety Inventory. full-field electroretinogram responses, and in the central retina by multifocal electroretinogram responses.5 The authors argued that the involvement of the central retina, in addition to the retinal periphery, was in line with psychophysical results showing losses of central visual functions (luminance spatial contrast sensitivity and color vision),5 confirmed by the present study. Luminance spatial contrast sensitivity has been used to evaluate visual functions and has been shown to be altered in different types of Hg intoxication.6,12,27,28 In this study, in chronic exposure to low level Hg vapor, there was significant reduction of sensitivity for 12 cpd; a previous study measured spatial contrast sensitivity at five spatial frequencies (from 1.5 to 18 cpd) and the authors found, among other visual alterations, poorer spatial contrast sensitivity for 12 cpd in riverine populations (Amazon) exposed to low levels of methylmercury.30 Workers with high Hg vapor levels of intoxication showed a uniform reduction, measured psychophysically and electrophysiologically, for the spatial contrast sensitivity function: seven spatial frequencies measured psychophysically (from 0.2 to 20 cpd) were significantly lower for the Hg-exposed workers.6 Similar results showing losses throughout the same spatial frequency range were found in dentists who had been occupationally exposed to Hg vapor for many years during preparation of dental Hg amalgam and removal of amalgam fillings, nevertheless they presented very low concentrations of urinary Hg.12 Our results confirm findings of previous studies showing that the D-15 d test is appropriate for evaluating color discrimination in subjects occupationally exposed to neurotoxic substances.46,47 These findings agree with a previous study that showed subclinical losses of which the workers were unaware,7 suggesting the D-15 d test would be useful for screening color • Barboni et al vision deficiencies in cases of early neurotoxicity in exposed workers. In contrast with previous results in which the CCT was shown to be sensitive to evaluate a group several years after a long period of exposure to Hg vapor,6 in the present group, differences between Hg-exposed subjects and controls were found for only two parameters in the Ellipse test. Summarizing the neuropsychological assessment, no significant differences were found between performance of controls and Hg-exposed subjects on any measurement of this series. On the other hand, significant negative correlations were found between duration of exposure and verbal memory performance, suggesting lower storage and word retrieval efficiency of this population. Although low scores on randomic long-term retrieval are desirable, the negative correlation with duration of exposure seems to represent inconsistence in recalling words rather than a better performance with the increase of duration of exposure. The positive correlation between duration of exposure and scores on BDI reveals more depressive symptoms, which are common in Hg-exposed workers.4 Because depression is a risk factor for decline of neuropsychological performance, further studies, with larger sample size, should include correlation analysis between depression scores and neuropsychological measures to clarify whether possible impairments are related to Hg exposure or mood disorders. A previous study found verbal memory deficits and depression symptoms in former workers of a fluorescent lamp plant, 10 years in average after the exposure was ceased.4 This study is in agreement with previous results that have not found significant differences in neuropsychological test scores between chloralkali workers exposed to low Hg concentrations and controls. Nevertheless, in that study, concentration of Hg in blood correlated significantly with poorer performances in JOEM • Volume 51, Number 12, December 2009 tasks that required psychomotor speed, attention, and visual memory.48 On the other hand, deficits have been found on tasks that require arithmetic skills, psychomotor speed, attention, visual perception, and short-term memory in fluorescent lamp workers exposed to low levels of Hg vapor.15 Despite the ambiguity among findings, the more likely affected domains at urinary concentrations below 100 g Hg/g creatinine seem to be memory, psychomotor speed function, attention, and construction ability.16 The possibility of neuropsychological deficits associated with current low measures of exposure must be considered because Hg continues to be used for industrial processes. This study shows preliminary evidence of visual dysfunctions in a group of workers with well-controlled Hg exposure in their work environment. The study group has a low number of subjects, because it was restricted to individuals from a single company, therefore, keeping homogeneous conditions for the sample. All workers from the company were evaluated (21 workers), but 11 subjects did not comply with the inclusion criteria of the study. More studies are needed to confirm the occurrence of visual dysfunction at low level occupational exposure to Hg vapor. The findings of visual dysfunction in this group, occupationally exposed to Hg vapor within the accepted safety levels, suggest that these levels may not be safe. These results amplify concerns regarding the potential risks of exposure to environmental Hg sources and reinforce earlier suggestions of reduction of accepted safety levels of the urinary Hg concentration during occupational exposure to Hg vapor. Acknowledgment This research was supported by grants from Brazilian research funding agencies: FAPESP Projeto Temático 2002/12733-8 (to DFV); CNPq 523303/95-5; CAPES PROCAD 0019/01-1; NIH EY-04802, and FINEP IBN- 1411 Net 01.06.0842-00. MTSB, CFS, and ECZ were supported by FAPESP fellowships for graduates; RAT had a CAPES fellowship for graduates. LCLS and DFV are CNPq research fellows. 13. References 14. 1. Ellingsen DG, Morland T, Andersen A, Kjuus H. Relation between exposure related indexes and neurological and neurophysiological effects in workers previously exposed to mercury vapor. Br J Ind Med. 1993;50:736 –744. 2. Urban P, Lukas E, Benicky L, Moscovicova E. Neurological and electrophysiological examination on workers exposed to mercury vapors. Neurotoxicology. 1996;17:191–196. 3. Urban P, Nerudova J, Cabelkova Z, Krajca V, Lukas E, Cikrt M. EEG photic driving in workers exposed to mercury vapors. Neurotoxicology. 2003;24:23–33. 4. Zachi EC, Taub A, Medrado-Faria MA, Ventura DF. Neuropsychological dysfunction related to earlier occupational exposure to mercury vapor. Braz J Med Biol Res. 2007;40:425– 433. 5. Ventura DF, Costa MTV, Costa MF, et al. Multifocal and full-field electroretinogram changes associated with colorvision loss in mercury vapor exposure. Vis Neurosci. 2004;21:421– 429. 6. Ventura DF, Simoes AL, Tomaz S, et al. Colour vision and contrast sensitivity losses of mercury intoxicated industry workers in Brazil. Environ Toxicol Pharmacol. 2005;19:523–529. 7. Feitosa-Santana C, Costa MF, Lago M, Ventura DF. Long-term loss of color vision after exposure to mercury vapor. Braz J Med Biol Res. 2007;40:409 – 414. 8. Feitosa-Santana C, Barboni MTS, Oiwa NN, et al. Irreversible color vision losses in patients with chronic mercury vapor intoxication. Vis Neurosci. 2008;25:487– 491. 9. Barboni MT, Costa MF, Moura AL, et al. Visual field losses in workers exposed to mercury vapor. Environ Res. 2008;107: 124 –131. 10. Costa MF, Tomaz S, de Souza JM, Silveira LCL, Ventura DF. Electrophysiological evidence for impairment of contrast sensitivity in mercury vapor occupational intoxication. Environ Res. 2008;107:132–138. 11. Altmann L, Sveinsson K, Krämer U, et al. Visual functions in 6-year-old children in relation to lead and mercury levels. Neurotoxicol Teratol. 1998;20:9 –17. 12. Canto-Pereira LHM, Lago M, Costa MF, et al. Visual impairment on dentists related to occupational mercury exposure. 15. 16. 17. 18. 19. 20. 21. 22. 23. 24. 25. 26. Environ Toxicol Pharmacol. 2005;19: 517–522. American Conference of Governmental Industrial Hygienists (ACGIH). Threshold Limit Value for Chemical Substances and Biological Exposure Indices. Cincinnati: ACGIH; 2001. World Health Organization (WHO). Recommended Health-based Limits in Occupational Exposure to Heavy Metals. Genève: WHO; 1980. Liang Y, Sun R, Sun Y, Chen Z, Li L. Psychological effects of low exposure to mercury vapor: application of a computer administered neurobehavioral evaluation system. Environ Res. 1993;60:320 –327. Meyer-Baron M, Schaeper M, Seeber A. A meta-analysis for neurobehavioural results due to occupational mercury exposure. Arch Toxicol. 2002;76:127–136. Hatch WR, Ott WL. Determination of submicrogram quantities of mercury by atomic absorption spectrophotometry. Anal Chem. 1968;40:2085–2087. Wittmann Z. Determination of mercury by atomic-absorption spectrophotometry. Talanta. 1981;28:271–273. Lanthony P. The desaturated panel D-15. Doc Ophthalmol. 1978;46:185–189. Farnsworth D. The Farnsworth-Munsell 100-Hue and dichotomous tests for color vision. J Opt Soc Am. 1943;33:568 –578. Bowman KJ. A method for quantitative scoring of Farnsworth Panel D-15. Acta Ophthalmol. 1982;60:907–916. Strauss E, Sherman EMS, Spreen O. A Compendium of Neuropsychological Tests: Administration, Norms, and Commentary. 3rd ed. New York, NY: Oxford Press; 2006. Andrade L, Gorenstein C, Vieira Filho AH, Tung TC, Artes R. Psychometric properties of the Portuguese version of the State-Trait Anxiety Inventory applied to college students: factor analysis and relation to the Beck Depression Inventory. Braz J Med Biol Res. 2001;34:367– 374. Kishi R, Doi R, Fukushi Y. Subjective symptoms and neurobehavioral performances of ex-mercury minners at an average of 18 years after the cessation of chronic exposure to mercury vapor. Environ Res. 1993;62:289 –302. Agency for Toxic Substances and Disease Registry (ATSDR). Toxicological Profile for Mercury. Washington, DC: U.S. Department of Health and Human Services, Public Health Service; 1998. Pinheiro MCN, Nascimento JLM, Silveira LCL, Rocha JBT, Aschner M. Mercury and selenium—a review on aspects related to the health of human popula- 1412 27. 28. 29. 30. 31. 32. 33. tions in the Amazon. Environ Bioindicators. 2009;4:1–24. Silveira LCL, Damin ETB, Pinheiro MCN, et al. Visual dysfunction following mercury exposure by breathing mercury vapour or by eating mercury-contamminated food. In: Mollon JD, Pokorny J, Knoblauch K, eds. Normal and Defective Colour Vision. Oxford: University Press; 2003:407– 417. Rodrigues AR, Botelho de Souza CR, Braga AM, et al. Mercury toxicity: contrast sensitivity and color discrimination of subjects exposed to mercury. Braz J Med Biol Res. 2007;40:415– 424. Costa GM, Anjos LM, Souza GS, et al. Mercury toxicity in Amazon gold miners: visual dysfunction assessed by retinal and cortical electrophysiology. Environ Res. 2008;107:98 –107. Lebel J, Mergler D, Branches F, et al. Neurotoxic effects of low-level methylmercury contamination in the Amazonian basin. Environ Res. 1998;79:20 –32. Hunter D, Russell DS. Focal cerebellar and cerebellar atrophy in a human subject due to organic mercury compounds. J Neurol Neurosurg Psychiatr. 1954;17: 235–241. Okajima T. Studies on the visual field of Minamata disease. Jpn Med J. 1972:2510. Iwata K, Abe H. Neuroophthalmological and pathological studies of organic mercury poisoning, “Minamata Disease” in Japan. In: Tsubaki T, Takahashi H, eds. Recent Advances in Minamata Disease Studies. Methylmercury poisoning in Minamata and Niigata, Japan. Tokyo: Kodansha; 1986:58 –74. Visual Dysfunctions in Occupational Exposure to Hg 34. Harada M. Minamata disease—methylmercury poisoning in Japan caused by environmental pollution. Crit Rev Toxicol. 1995;25:1–24. 35. Korogi Y, Takahashi M, Hirai T, et al. Representation of the visual field in the striate cortex: comparison of MR findings with visual field deficits in organic mercury poisoning (Minamata disease). AJNR Am J Neuroradiol. 1997;18:1127– 1130. 36. Korogi Y, Takahashi M, Okajima T, Eto K. MR findings of Minamata disease— organic mercury poisoning. J Magn Reson Imaging. 1998;8:308 –316. 37. Sabelaish S, Hilmi G. Ocular manifestations of mercury poisoning. Bull World Health Organ. 1976;3(suppl):83– 86. 38. Charleston JS, Bolender RP, Mottet NK, Body RL, Vahter ME, Burbacher TM. Increases in the number of reactive glia in the visual cortex of macaca fascicularis following subclinical long-term methyl mercury exposure. Toxicol Appl Pharmacol. 1994;129:196 –206. 39. Charleston JS, Body RL, Mottet NK, Vahter ME, Burbacher TM. Autometallographic determination of inorganic mercury distribution in the cortex of the calcarine sulcus of the monkey macaca fascicularis following long-term subclinical exposure to methylmercury and mercuric chloride. Toxicol Appl Pharmacol. 1995;132:325–333. 40. White RF, Feldman RG, Moss MB, Proctor SB. Magnetic resonance imaging (MRI), neurobehavioral testing, and toxic encephalopathy: two cases. Environ Res. 1993;61:117–123. • Barboni et al 41. World Health Organization (WHO). Elemental Mercury and Inorganic Mercury Compounds: Human Health Aspects. Geneva: WHO; 2003. 42. Warfvinge K, Bruun A. Mercury accumulation in the squirrel monkey eye after mercury vapour exposure. Toxicology. 1996;107:189 –200. 43. Warfvinge K, Bruun A. Mercury distribution in the squirrel monkey retina after in utero exposure to mercury vapour. Environ Res. 2000;83:102–109. 44. Bonci DMO, de Lima SMA, Grotzner SR, Oliveira-Ribeiro CA, Hamassaki DE, Ventura DF. Losses of immunoreactive parvalbumin amacrine and immunoreactive alfa-protein kinase C bipolar cells caused by methylmercury chloride intoxication in the retina of the tropical fish Hoplias malabaricus. Braz J Med Biol Res. 2006;39:405– 410. 45. Tanan CL, Ventura DF, de Souza JM, et al. Effects of mercury intoxication on the response of horizontal cells of the retina of thraira fish (Hoplias malabaricus). Braz J Med Biol Res. 2006;39: 987–995. 46. Gobba F. Color vision: a sensitive indicator of exposure to neurotoxins. Neurotoxicology. 2000;21:857– 862. 47. Gobba F, Cavalleri A. Evolution of color vision loss induced by occupational exposure to chemicals. Neurotoxicology. 2000;21:777–781. 48. Ellingsen DG, Bast-Pettersen R, Efskind J, Thomassen Y. Neuropsychological effects of low mercury vapor exposure in chloralkali workers. Neurotoxicology. 2001;22:249 –258.
Baixar