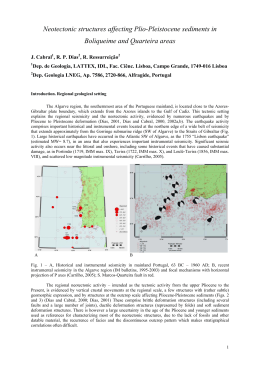
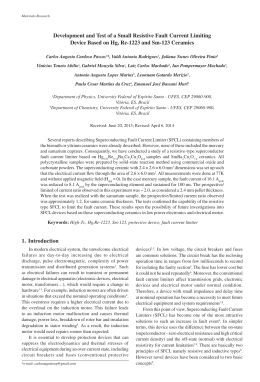
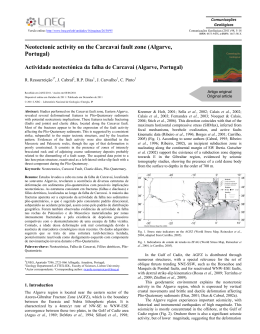
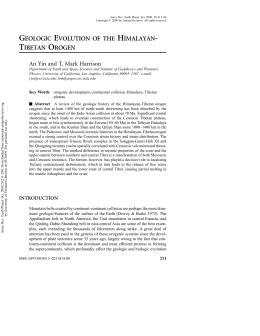
CIRED
21st International Conference on Electricity Distribution
Frankfurt, 6-9 June 2011
Paper 0848-
FAULT LOCATION IN PORTUGUESE MV NETWORKS
Miguel LOURO
EDP Distribuição – Portugal
[email protected]
Mário LEMOS
EDP Distribuição – Portugal
[email protected]
Pedro CARVALHO
IST - Portugal
[email protected]
Fernando CARVALHO
IOA – Portugal
[email protected]
Luís MARCELINO FERREIRA
IST - Portugal
[email protected]
ABSTRACT
FAULT LOCATION SYSTEM DESCRIPTION
Today’s challenges faced by electrical utilities are
always related, directly or indirectly, with improving the
quality of the service while maintaining, or decreasing,
costs (both operational and investment costs). From the
analysis of the client interruptions it is possible to
conclude that the majority of the interruptions are caused
by faults in the Medium Voltage (MV) network. The
process of handling faults in this voltage level has several
stages: fault location; maximum power restoration to
clients; fault repair.
Nowadays, MV protection units usually have
incorporated a “fault location” module for no extra cost.
Recognizing the interest of estimating fault location from
protection units’ data, EDP has been involved in a pilot
project to ascertain the best manner of grasping its full
potential.
The pilot project’s results showed the potential for a
decrease in interruption time between 12% and 76% and
a reduction of the number of network incidents.
Besides their main functions modern protection units can
also perform other tasks (ex.: control functions). One of
these tasks is commonly named “fault location”. It
consists of an analysis performed on recorded fault data,
by the protection unit, with the objective of determining
the fault’s electrical impedance.
By comparing the fault impedance with the network
impedance it is possible to locate the fault. In HV
networks each line has a protection unit and it is possible
for the protection to compare the line’s impedance (which
is one of the protection unit’s settings) with the fault
impedance and transmit the fault’s location in kilometres.
However, in MV networks that is not possible because,
despite being radial, there are many ramifications with
different electrical characteristics. So, the option, in our
case, was to perform the fault impedance comparison not
in the protection unit but in the Control Centre using
DPlan software.
The fault location system operation is shown in Figure 1.
The protection unit detects the fault, records the voltage
and current time values and trips the circuit breaker.
Afterwards it performs a “fault location” calculation and
sends the fault impedance data to the SCADA system.
The SCADA then sends it to the DPlan software which
determines the fault’s possible location.
INTRODUCTION
With the objective of improving the Quality of Service
EDP deployed a fault location pilot project using the
information of the protection units.
Nowadays, MV protection units usually have
incorporated a “fault location” module for no extra cost.
This is a well established function for transmission
networks; however, distribution networks have some
differences that must be taken into consideration. The
main factor is that distribution networks are radial and
constituted by many branches which may have different
impedances. So, it is not possible to use a distance to
fault in kilometres information as it is common practice
in higher voltage levels. An option is to use the fault
impedance data, which is available in the protection units,
and determine the likely area of fault location in a central
software application.
The pilot project lasted from Jan. 2010 to the end of Nov.
2010. The actual faults that occurred during the project
are presented. The fault location’s performance is
assessed in terms of distance error between the actual
location and the protection unit calculations. Some
recommendations are made for those who which to
endeavour in a similar project.
Paper No 0848
SCADA
Fault Impedance
Fault Impedance
DPLAN
Possible Fault
Location
Fig.1 – Fault location system operation
1/4
CIRED
21st International Conference on Electricity Distribution
Frankfurt, 6-9 June 2011
Paper 0848-
FAULT LOCATION USING DPLAN
Measurement errors
The software DPlan has been used for almost a decade in
Portugal for power system planning at a Distribution
level. Therefore it is a very stable and tested platform.
It can determine the possible faulty branch with the fault
impedance from the protection units very quickly.
As with any other measurement the fault impedance is
also affected by errors. These errors affect the resistive
(R) and reactance (X) part of the impedance.
The error region is shown in Figure 3. For further
information on this topic the reader is recommended to
refer to [2].
X
Z error
X error
R
R error
Fig.3 – Impedance measurement errors
Fig.2 – Fault location example using DPlan (possible
faulty branches in black)
Because DPlan currently does not yet have access to the
SCADA system data for cyber security reasons the
process of inserting fault impedance data remained
manual during the pilot project.
The fault location estimation is usually done through the
fault reactance. Using the R value is less precise because
of the fault resistive nature, the resistance of which is
unknown.
A value of 10% was used for the overall fault impedance
measurement error for the fault location project. For
further information about this topic please refer to [3].
IMPEDANCE BASED FAULT LOCATION
ALGORITHM ERRORS
PREPARATION TASKS
Load Current Compensation
Before installing the system in the field several tests were
performed to the protection units. These consisted on
injecting currents and voltages, obtained by simulating
various fault types and fault resistances, in the protection
relays and accessing their response.
Some of the relays tested selected phase-to-ground fault
loops [4], instead of phase-to-phase loops, to perform the
fault impedance calculation while in the presence of
phase-phase-ground faults. This can lead to a less precise
location because the fault resistance to ground is usually
larger than between phases.
Several protection unit configuration issues were also
detected and resolved during the testing stage.
During a fault the feeder is still providing current to the
loads. Therefore, the current flowing from the feeder has
two main components: fault current and load current.
Because fault location algorithms calculate fault
impedances, the presence of the load current can lead to
large errors. This is especially true for phase-to-ground
faults in systems where the neutral impedance limits the
maximum fault current to values near the feeder nominal
current. In Portugal the neutral current is usually limited
to 300A for substations serving a mainly overhead
network.
Fortunately there are algorithms that can compensate the
load current and perform a more accurate fault impedance
calculation (most notably the algorithm in [1]). However,
these algorithms need information about the load in the
instants before the fault. If the fault appears just after a
circuit breaker closure (consider a previous opening due
to a fast reclosing) there is no information about load
current and the fault location is less precise.
In the case of several automatic, or manual, reclosures the
most precise information is the first one, which is the one
that is most likely to have load compensation.
Paper No 0848
Protection unit testing
SCADA and Substation Automation System
interfaces
SCADA systems have limitations on the type of
information that can be sent to them.
Fault location information results from the analysis
performed at the protection unit level after a fault event.
However, the final product of the analysis are two
numerical values (R and X) that have to be with high
precision (a 3 decimal representation was chosen for this
pilot project).
After careful consideration of the available options it was
2/4
CIRED
21st International Conference on Electricity Distribution
Frankfurt, 6-9 June 2011
Paper 0848-
decided that the fault location information should be
communicated to the SCADA system as a measured
value similar to a voltage or a current. The fault location
report was performed by variation in value, instead of a
time controlled refreshing.
Considering the typical number of feeders in a substation
the number of measured values to be transmitted is
significant. To reduce the workload associated with the
pilot project another criteria for the substation selection
was the presence of a substation automation system
(using IEC 60870-5-104 or IEC 61850). Wiring at the
project’s substations was kept at a minimum.
IMPLEMENTATION STAGE
In order to minimize the cost associated with this pilot
project only four new substations were chosen to
participate. The cost of configuring the fault location
system fell under the overall substation configuration.
Due to the previous testing of protection units and
relative ease of sending information to the SCADA
system the implementation stage was straightforward.
The selected substations network is mainly overhead.
DPlan software was also installed in the MV Control
Centre and basic training was given to the users.
breaker trip was not due to the damaged surge arrestor
but to another fault (which was eliminated by the circuit
breaker reclosure). However, because the first fault
location indication is usually the most accurate it was
used to assess the system’s performance. The incorrect
fault location results from a rare situation.
The accuracy of the fault locator was also assessed. The
results are shown in Figure 4.
By observing Figure 4 it is apparent that the impedance
error is below 10% for most cases (there was a case of
10,5%). So, using an error margin of 10% will yield good
results for practical cases. The impedance error was
determined by comparing the fault impedance with the
network impedance in DPlan’s database.
Unfortunately when the faults described in Table 1
occurred there were adverse meteorological conditions in
several zones and therefore the Control Centre was very
busy dealing with several simultaneous faults to devote
some attention to the new system. An estimation of gains
was performed considering the search and repair times
associated with each of the faults shown in Table 1.
10,0%
8,0%
6,0%
4,0%
During the pilot project 13 faults were detected by the
field crews in the network served by the four substations
from Jan. to end of Nov. 2010.
The results of the new fault location strategy are shown in
Table 1.
Z Error
2,0%
RESULTS
0,0%
-2,0% 0,0
5,0
10,0
15,0
20,0
25,0
30,0
35,0
40,0
-4,0%
-6,0%
-8,0%
-10,0%
-12,0%
-10,5%
Zfault (W)
Table 1 – Pilot project fault location results
Fig.4 – Fault impedance error vs. total fault impedance
Fault Fault location
1
successful
2
successful
3
successful
4
successful
5
successful
6
successful
7
successful
8
successful
9
successful
10
successful
11
successful
12
successful
13 unsuccessful
Description
Broken conductors due to fallen tree
Bird contact
Broken conductors
Damaged distribution transformer
Broken conductors due to fallen tree
Tree contact
Broken conductors due to fallen tree
Broken conductors
Tree contact
Tree contact
Broken conductors
Tree contact
Damaged surge arrestor
There were 12 correct fault locations and 1 incorrect
location.
The incorrect location was a peculiar case of a fault that
initially started in phase C with a fault current of 70A.
After the first automatic reclosure the fault reappeared in
phase A with a fault current of 140A. Later, a damaged
surge arrestor was found. Probably the first circuit
Paper No 0848
It was determined that the fault location system can lead
to a reduction in interruption time from 12% to 76%. The
average reduction for the 12 faults was of 40%. Some of
the lines served by the pilot project substations go
through mountainous terrain with no roads nearby. So
finding a fault in these conditions can be very time
consuming. Therefore, fault location can contribute very
significantly to reduce the total interruption time.
There is still another gain that can be achieved from a
fault location system. Some faults begin as nonpermanent faults and are typically eliminated by the
automatic reclosures. However, after a time, and several
reclosures, they become permanent and give rise to
interruption time for the costumers. EDP has specialized
teams that are in charge of the MV line maintenance and
that look for the non-permanent fault locations. The fault
location data of automatic reclosures of the monitored
substations were made available to the specialized teams.
With the data provided the teams found four faults
(which were inserted in Table 1. Faults #2, #6, #10 and
#12) and thus prevented further occurrences.
3/4
CIRED
21st International Conference on Electricity Distribution
Frankfurt, 6-9 June 2011
Paper 0848-
LESSONS LEARNED
REFERENCES
Protection unit configuration
[1] T. Takagi et al., 1982, "Development of a new fault
locator using the one-terminal voltage and current
data", IEEE Transactions on Power Apparatus and
Systems, vol. 101, 2892-2898.
Special attention should be paid to the protection unit
configuration. In the course of the pilot project it was
discovered that the fault location information was not
being transmitted after a fast reclosure. This was a
configuration issue in the protection modules.
It should also be noticed that the fault location
information is being communicated in primary values by
the protection. Therefore it is essential that the correct CT
and VT relation is inserted in the protection unit.
Full automatic system
Due to the low budget and short time of the pilot project
it was not possible to establish a secure database link
between the SCADA system and DPlan. Therefore
several stages of the fault location system remained
manual through the pilot project.
It was established that the fault location information is
most necessary in periods were there are multiple faults
in the network. In those periods the Control Centre are
extremely busy dispatching crews and need to get
information without manual intervention.
An automatic and easy to use system is necessary to
obtain higher gains.
[2] J. Pinto de Sá, 1994, "Stochastic analysis in the time
domain of very high speed digital relays – Part1:
Theory", IEE Proc. in Generation, Transmission and
Distribution, vol. 141, 161-168.
[3] J. Pinto de Sá et al., 1997, "A probabilistic approach
to setting distance relays in transmission networks",
IEEE Transactions on Power Delivery, vol. 12, 681686.
[4] IEEE, 2004, C37.114 IEEE Guide for Determining
Fault Location on AC Transmission and Distribution
Lines, IEEE, New York, USA, 1-36.
Network Data
The fault location process is based upon the comparison
between the fault impedance (calculated in the protection
unit) and the network’s impedance (computed by DPlan).
If the electrical characteristics of the network are not
correctly loaded in DPlan’s database the comparison is
error prone.
Therefore, before engaging in a similar project it is
advisable to conduct a quality test to the electrical
information of the network’s database.
During the course of the pilot project a few erroneous
situations were detected and corrected.
CONCLUSION
The usage of the fault location information given by the
MV protection units has the potential for a large
reduction of interruption time. Our experience shows that
gains can range from 12% to 76% per incident. There are
also gains by avoiding re-occurring faults, provided that
the line maintenance teams are supplied with the fault
location information.
A fault location system, as reported here, could be easily
implemented because it was built upon existing functions
of the protection units and DPlan that is a stable
technology, widespread in EDP.
The system’s full potential is however dependent on
automating the process.
Paper No 0848
4/4
Baixar