Ciências Biomédicas / Biomedical Sciences
Avaliação do efeito da temperatura sobre a dinâmica da resposta
microcirculatória cutânea
Assessment of the effect of temperature on the dynamics of cutaneous
microcirculatory response
1
1
1
1,2
Pedro Contreiras Pinto , Sara Jerónimo Moniz , Luis Monteiro Rodrigues
UDE Unidade de Dermatologia Experimental, Universidade Lusófona, Campo Grande 376, 1749-024 Lisboa,
Portugal
2
Laboratório de Fisiologia Experimental, Faculdade de Farmácia da Universidade de Lisboa, Av das Forças
Armadas, 1600-019 Lisboa, Portugal.
__________________________________________________________________________________
Resumo
De há muito que se conhecem as influências da variação da temperatura da pele sobre a microcirculação embora os
mecanismos e vias envolvidos nesta resposta reflexa não estejam totalmente identificados, pelo que os autores
entenderam estudar a resposta da pele in vivo ao aquecimento local. O estudo foi realizado no antebraço de 10
voluntários saudáveis (mulheres, entre os 20 e 35 anos de idade média: 25 ± 3,7). Após aclimatação as voluntárias
foram submetidas a um protocolo de aquecimento a duas temperaturas (42 e 44ºC) durante 40 minutos, sendo as
variações seguidas por meios não invasivos (PTEA perda trans-epidérmica de água e LDF perfusão sanguínea por
fluxometria de laser doppler). A resposta medida por LDF foi diferente nas temperaturas de 42 e de 44 ºC. A 42ºC a
resposta é bifásica (resposta típica) ao contrário do que sucede aquando do aquecimento a 44ºC. Neste caso, para
além da intensidade ser maior é atingido de imediato um platô, sugerindo a presença de um outro mecanismo
regulatório local. Relativamente à PTEA verificou-se um aumento semelhante em ambas as temperaturas, não tendo
sido observadas diferenças estatisticamente significativas. O aquecimento a diferentes temperaturas parece colocar
em evidência diferentes mecanismos de regulação da temperatura local.
Palavras chave: microcirculação, temperatura, in vivo, estímulos dinâmicos, LDF, PTEA
___________________________________________________________________________________________________
Abstract
Although it has long been known that variations in temperature can affect microcirculation, the mechanisms and
pathways involved in this reflex response have not yet been completely identified. For this reason the authors
resolved to study the response to local heating in vivo. The study was conducted on the forearms of 10 healthy
volunteers (women between the ages of 20 and 35 years; mean: 25 ± 3.7). After the volunteers were acclimated, they
were subjected to two temperature increases (to 42ºC and 44ºC) for 40 minutes and changes were measured by noninvasive means (TEWL trans-epidermic water loss, and LDF laser Doppler flowmetry to measure blood perfusion).
Different responses were observed to the two temperatures on the LDF measurments. At 42ºC the response is
biphasic (a typical response), but it is not when the temperature is increased to 44ºC. In the latter case, the intensity of
the response is greater and it reaches a plateau immediately, which suggests the presence of another local regulatory
mechanism. The TEWL shows a similar increase at both temperatures, with no statistically significant differences
observed. Heating to different temperatures appears to trigger different mechanisms of local temperature regulation.
Key words: microcirculation, temperature, in vivo, dynamic stimuli, LDF, TEWL
________________________________________________________________________________________________
Recebido em 08/05/2008
Aceite em 20/05/2008
Rev. Lusófona de Ciências e Tecnologias da Saúde, 2008; (5) 1: 61-67
Versão electrónica: http//revistasaude.ulusofona.pt
61
Pedro Pinto et al.
Introdução
Introduction
A microcirculação cutânea é um sistema vascular
especial que inclui vasos com calibre inferior a 100
[1]
m
participando na termorregulação e no
metabolismo. O comportamento e funções deste
sistema microcirculatório variam consoante a área
considerada[1-3]. Na pele glabra, presente nas palmas das
mãos, plantas dos pés e face, existe um grande número
de anastomoses estando, por isso, particularmente
envolvida no controlo da temperatura[1]. Na pele não
glabra, presente na maior parte da superfície do
organismo, a ausência de anastomoses faz com que a
nutrição do tecido constitua a sua principal função [1].
A avaliação das alterações da microcirculação cutânea,
sobretudo por meios não invasivos, tem especial
relevância no seguimento de patologias de incidência
vascular[4] como a diabetes[5], a hipertensão[6] ou o
sindrome de Raynaud[7-9]. É neste sentido que
numerosos estudos têm utilizado a Fluxometria por
Laser Doppler (LDF)[10-14] ou a Perda Trans Epidérmica
de Água (PTEA) )[18-20] como indicador clínico .
Contudo, estes métodos apresentam várias limitações
instrumentais e metodológicas que condicionam a sua
utilidade, aconselhando
a alguma reserva na
interpretação dos seus resultados[18]. Abordagens
dinâmicas que permitam seguir, com estes meios, a
resposta fisiológica (adaptativa) ao estímulo são, por
isso preferidas, como nos casos do aquecimento local[2223]
, da aplicação de fármacos vasoactivos[10,13], das
alterações da postura[33,34] ou, da indução de hiperémia
reactiva[20]. A avaliação da resposta microcirculatória
ao aquecimento local da pele[21-23], tornou-se numa
ferramenta clínica na avaliação da disfunção
vasomotora, especialmente na diabetes[21-24].
Em
indivíduos saudáveis, o aquecimento local a 42ºC
provoca uma vasodilatação bifásica, com um rápido
aumento do fluxo de sangue, nos 3 a 5 minutos após o
aquecimento, devido à actividade dos nervos sensoriais
aferentes[3,22-30]. Este rápido aumento é seguido por um
decréscimo moderado e uma subida lenta que atinge
um platô 25 a 30 minutos após o aquecimento. Esta fase
prolongada foi atribuída à libertação de mediadores
locais, nomeadamente Óxido Nítrico (NO), uma vez
que após tratamento local com inibidores da NO
Sintetase o efeito desaparece[23-31]. A activação das
fibras C poderá influenciar a resposta ao aquecimento
local, especialmente se existir resposta nociceptora
local[23,31], não estando bem definido a que temperatura é
atingido o seu limiar de excitação[31-32]. A resposta a
temperaturas de aquecimento diferentes de 42ºC, não
está caracterizada, pelo que, o presente estudo
propõem-se verificar as alterações da microcirculação
e da PTEA, como resposta a variações locais da
temperatura, em indivíduos saudáveis, de modo a
Cutaneous microcirculation is a special vascular
system that includes vessels with a caliber of less than
[1]
100 m that play a role in thermoregulation and
metabolism. The behavior and functions of this
microcirculatory system vary depending on the area of
skin being considered[1-3]. In the glabrous skin, which is
present on the palms of the hands, the soles of the feet
and the face, there are large numbers of arteriovenous
anastomoses, making these areas particularly
important in temperature control[1]. In the non-glabrous
skin, which covers most of the body's surface, the
absence of anastomoses means that nutrition of the
tissue is its primary function[1].
Assessment of changes in cutaneous microcirculation,
mainly by noninvasive means, is especially important
in monitoring diseases associated with a high incidence
of vascular conditions [4] , such as diabetes [5] ,
hypertension[6] or Raynaud's phenomenon[7-9]. To this
end, numerous studies have been undertaken using
Laser Doppler Flowmetry (LDF)[10-14] or TransEpidermic Water Loss (TEWL) )[18-20] as a clinical
indicator. These methods, however, have a number of
instrumental and methodological shortcomings that
limit their usefulness, and the results obtained using
them must be interpreted cautiously[18]. Dynamic
approaches that allow us to track the (adaptive)
physiological response to stimuli, such as local
heating[22-23], application of vasoactive drugs[10,13],
postural changes[33,34], or induction of reactive
hyperemia[20] are therefore preferred. Assessment of
microcirculatory response to local heating of the skin[2123]
, has thus become a clinical tool for evaluating
vasomotor dysfunction, especially in diabetes[21-24]. In
healthy individuals, local heating to 42ºC causes a
biphasic vasodilation with a rapid increase in blood
flow in the first 3 to 5 minutes after the heating due to
the action of the afferent sensory nerves[3,22-30]. This rapid
increased is followed by a moderate decrease and a
subsequent slow rise, which plateaus about 25 to 30
minutes after the heating. This lengthy phase has been
attributed to the release of local mediators, namely
nitric oxide (NO), since this effect disappears upon
local treatment with NO synthetase inhibitors[23-31]. Cfiber activation may affect response to local heating,
especially if there is a local nociceptor response[23,31];
however, the temperature at which the excitation
threshold is reached has not been well established[31-32].
Since responses to temperatures other than 42ºC have
not been described, this study proposes to determine
changes in microcirculation and TEWL as a response to
local temperature changes in healthy individuals in
order to contribute to the development of a more robust
diagnostic method.
62
Avaliação do efeito da temperatura sobre a dinâmica da resposta microcirculatória cutânea
Assessment of the effect of temperature on the dynamics of cutaneous microcirculatory response
contribuir para o desenvolvimento de uma metodologia
de diagnóstico mais robusta.
Material e métodos
O estudo foi efectuado em 10 voluntárias do sexo
feminino, com idades compreendidas entre 20 e 35
anos (média 25 ± 3,7 anos), saudáveis, sem qualquer
patologia dermatológica ou circulatória declarada, não
fumadoras, normotensas e não sujeitas a medicação
vasoactiva. As voluntárias foram detalhadamente
informadas sobre o estudo, tendo expresso o seu
consentimento prévio. Todos os procedimentos
adoptados tiveram em consideração a Declaração de
Helsínquia e emendas subsequentes.
Após aclimatação (20 minutos a temperatura e
humidade relativa controladas) sujeitaram-se as
voluntárias a um protocolo dinâmico de aquecimento
local a 42º e 44ºC realizado num antebraço
aleatoriamente escolhido. Este protocolo envolveu
medições do fluxo sanguíneo local, obtido através de
Fluxometria por Laser Doppler (LDF) (Periflux
PF5010, Perimed, Suécia) e da PTEA, medida por
evaporimetria (Tewameter TM300, CK electronics,
Alemanha). O sistema de aquecimento (Periflux
PF5020, Perimed, Suécia), colocado na sonda de LDF,
permitiu gerar as duas temperaturas. As sondas de
medição foram colocadas de forma a evitar zonas com
vasos de grande calibre à superfície. O protocolo
experimental envolveu o registo basal (10 min),
seguido de aquecimento a 42º ou 44ºC (40 min) e
retoma à condição inicial (10 min).
Para a análise dos dados de PTEA consideraram-se os
valores médios de 5 minutos antes do final de cada
período do protocolo. Para o LDF, para além destes
períodos de avaliação considerou-se ainda o tempo
médio do pico e o tempo médio do vale, obtidos no
registo de aquecimento a 42ºC. A comparação
estatística foi realizada através do Teste de Wilcoxon
para variáveis emparelhadas. Todos os testes
estatísticos foram realizados utilizando os programas
SPSS 16.0 e MSExel. O nível de confiança adoptado
foi de 95%.
Resultados
As figuras 1 e 2 ilustram, respectivamente o perfil
típico de resposta do fluxo de sangue e da PTEA
durante o aquecimento local a 42ºC e a 44ºC. Os
valores médios e respectivos desvios padrão de todos
os indivíduos, para as diferentes variáveis, estão
representados nas tabelas I e II, bem como as diferenças
estatisticamente significativas encontradas em cada
fase experimental. Para o LDF (Figura 1), durante o
aquecimento a 42ºC verifica-se uma subida rápida do
fluxo, alcançando um máximo aos 2m ± 1m40s de
Materials and methods
The study was carried out on 10 healthy female
volunteers between the ages of 20 and 35 years (Mean
25 ± 3.7 years) with no known dermatological or
circulatory conditions, who were non-smokers with
normal blood pressure and were not on any vasoactive
medications. The volunteers were fully informed about
the study and gave their express prior consent. All
procedures adopted were in compliance with the
Helsinki Declaration and its subsequent amendments.
After acclimatization (20 minutes at controlled
temperature and relative humidity), the volunteers
were subjected to a dynamic protocol of local heating to
42ºC and 44ºC, which was applied to a randomly
chosen forearm. The protocol involved measuring local
blood flow using laser Doppler flowmetry (LDF)
(Periflux PF5010, Perimed, Sweden) and TEWL,
measured by evaporimetry (Tewameter TM300, CK
Electronics, Germany). The heating system (Periflux
PF5020, Perimed, Sweden), which was attached to the
LDF probe, was capable of generating the two
temperatures. The measurement probes were
positioned so as to avoid areas with large caliber vessels
near the surface. The experimental protocol involved
recording the baseline temperature (10 min), followed
by heating to 42ºC or 44ºC (40 min) and a subsequent
return to the initial condition (10 min).
For the purpose of analyzing the TEWL data, the mean
values obtained at 5 minutes prior to the end of each
period of the protocol were used. For the LDF data, in
additional to these assessment points, mean peak times
and mean trough times were also obtained in the 42ºC
heating record. Statistical comparison was made using
the Wilcoxon test for matched variables. All statistical
tests were carried out using the software programs
SPSS 16.0 and MS Excel. The confidence level chosen
was 95%.
Results
Figures 1 and 2 illustrate the typical profile of blood
flow response and TEWL, respectively, during local
heating to 42ºC and 44ºC. The mean values and
respective standard deviations for all subjects are
shown in tables I and II, along with the statistically
significant differences found in each experimental
phase. For the LDF (Figure 1), when the site was heated
to 42ºC, a rapid increase in blood flow was observed,
which reached a maximum at 2min ± 1m40s of heating
and was followed by a decrease that bottomed out at
4min ± 1m40s, then rose once more to reach a plateau.
When the site was heated to 44ºC, there was a rapid
increase which reached a plateau immediately, where it
remained until the heating is discontinued. During the
stimulus, statistically significant differences were
63
Pedro Pinto et al.
aquecimento seguido de uma descida que apresenta um
mínimo aos 4 m ± 1m40s, subindo novamente e
atingindo um platô. No aquecimento a 44ºC existe uma
subida rápida atingindo-se de imediato um platô que se
mantêm até finalizar o aquecimento. Durante o
estímulo foram encontrados, para os períodos de pico,
vale e pós estímulo, diferenças estatisticamente
significativas (p=0,004, p=0,004 e p=0,026
respectivamente) (Tabela I). Relativamente à PTEA
(Figura 2) observou-se um aumento desta variável
tanto no aquecimento a 42ºC, como a 44ºC, não sendo
observadas diferenças estatisticamente significativas
entre as duas temperaturas (Tabela II).
found for the peak, trough and post-stimulus periods
(p=0.004, p=0.004 and p=0.026, respectively) (Table
I). As for the TEWL (Figure 2), an increase was found
in the variable with heating to 42ºC and heating to 44ºC,
but no statistically significant differences were
observed between the two temperatures (Table II).
LDF
42 ºCvs 44ºC
PTEA / TEWL
42ºC vs 44ºC
250.00
16.00
14.00
200.00
)
2
.m
/h
(g
L
W
E
T
/
A
E
T
P
150.00
)
U
/A
A
(U 100.00
F
D
L
12.00
10.00
8.00
6.00
4.00
Média/Mean 42ºC
50.00
Média/Mean 44ºC
2.00
Média/Mean 44ºC
Média/Mean 42ºC
0.00
0.00
0.00
0.00
10.00
20.00
30.00
40.00
50.00
10.00
20.00
60.00
30.00
40.00
50.00
60.00
Tempo/Time (min)
Tempo/Time (min)
Figura 1 - Evolução do LDF durante o protocolo
experimental. Média dos 10 voluntários. As barras verticais
correspondem ao início e final do período de estímulo.
Figure 1 - LDF levels during the experimental protocol.
Mean of the 10 volunteers. Vertical bars indicate the
beginning and end of the stimulus period.
Figura 2 - Evolução da PTEA durante o protocolo
experimental. Média dos 10 voluntários. As barras verticais
correspondem ao início e final do período de estímulo.
Figure 2 - TEWL levels during the experimental protocol.
Mean of the 10 volunteers. Vertical bars indicate the
beginning and end of the stimulus period.
Tabela 1 - Estatística descritiva e comparação das variáveis nas diferentes fases do protocolo para os dados de LDF
(*p< 0,05; N.S.: não significativo).
Table 1 - Descriptive statistics and comparison of variables in the different phases of the protocol for the LDF data
(*P< 0.05; N.S.: not significant).
Basal
Baseline
42ºC
Pico
Peak
44ºC
42ºC
7,36±
5,79±
3,22
1,91
0,131 (N.S.)
Vale
Valey
44ºC
42ºC
58,19±
93,18±
13,87
28,45
0,004 (*)
Pós-estímulo
Post stimulation
42ºC
44ºC
44ºC
52,82±
111,74±
18,39
32,06
0,004 (*)
70,76±
112,81±
37,79
32,38
0,026 (*)
Tabela 2 - Estatística descritiva e comparação das variáveis nas diferentes fases do protocolo para os dados de PTEA
(*p< 0,05); N.S.: não significativo)
Table 2 - Descriptive statistics and comparison of variables in the different phases of the protocol for the TEWL data
(*P< 0.05); N.S.: not significant)
Basal
Baseline
42ºC
9,34±
2,16
64
Estímulo
Stimulation
44ºC
10,59±
1,71
* 0,041(*)
42ºC
44ºC
11,96±
3,25
12,13±
2,58
N.S.
Pós-estímulo
Post stimulation
42ºC
44ºC
10,55±
2,66
11,36±
2,33
N.S.
Avaliação do efeito da temperatura sobre a dinâmica da resposta microcirculatória cutânea
Assessment of the effect of temperature on the dynamics of cutaneous microcirculatory response
Discussão
Discussion
As alterações vasomotoras na microcirculação cutânea
implicadas no aquecimento local estão descritas para a
temperatura de 42ºC[21-23]. No entanto alguns dos
mecanismos dessa resposta permanecem por
esclarecer, em particular o comportamento da
microcirculação cutânea em indivíduos saudáveis, a
temperaturas superiores e em pele glabra [3] .
Considerando que a microcirculação cutânea assume
um papel central no diagnóstico da doença vascular[1114]
, uma vez que ao se quantificar o fluxo periférico de
sangue se permite avaliar a viabilidade dos tecidos[11],
estes mecanismos adquirem uma relevância superior.
Os resultados mostram um perfil bifásico típico na
resposta vascular ao aquecimento a 42ºC[21-22]. O pico
inicial que ocorre aos 2m ± 1m40s é coincidente com os
resultados já obtidos por outros grupos[21-23], parecendo
estar dependente da actividade dos nervos sensoriais
aferentes[24-28]. Após um decréscimo moderado que
ocorre aos 4 m ± 1m40s segue-se uma subida lenta que
atinge um máximo a partir dos 18m± 1m 40 s. Esta
resposta parece estar dependente da libertação local de
Óxido Nítrico, um potente vasodilatador[28-30]. A
resposta aos 44ºC de aquecimento apresenta um perfil
substancialmente diferente sugerindo por isso o
envolvimento de outros mecanismos regulatórios.
Neste caso atinge-se de imediato um platô (Figura 1),
não se verificando a típica subida e descida da resposta
a 42ºC. Alguns trabalhos têm sugerido o envolvimento
dos nociceptores na resposta a temperaturas superiores
a 42ºC[23,31] o que produziria uma vasodilatação
máxima. A hipótese da libertação precoce do óxido
nítrico após aquecimento a 44ºC não parece correcta
uma vez que esta é tipicamente uma resposta lenta[29-30].
Em termos estatísticos foram observadas diferenças
significativas entre os 42º e os 44ºC nas fases do pico,
vale e pós aquecimento, o que confirma as diferenças
entre os perfis observados . O facto do período de pós
estímulo ser diferente entre as duas temperaturas
sugere também a existência de uma diferença de
amplitude nos valores de LDF que é proporcional à
temperatura utilizada. As variações encontradas no
fluxo de sangue, por estarem provavelmente
dependentes de diferentes mecanismos de regulação,
poderão assim ser utilizadas não só como teste
indicador de cada um dos sistemas envolvidos, mas
também como um indicador dos mecanismos
fisiológicos envolvidos na regulação.
A PTEA é um importante indicador da integridade da
barreira cutânea e considerada como uma das variáveis
que melhor representam a fisiologia da pele[15-18].
Estando esta variável influênciada por alterações
hemodinâmicas locais, embora a relação entre o fluxo
de sangue local e a PTEA seja ainda pouco
The vasomotor changes in cutaneous microcirculation
involved in local heating are described for the 42ºC
temperature[21-23]. However, some of the response
mechanisms have yet to be clarified, in particular, the
behavior of cutaneous microcirculation in healthy
individuals at higher temperatures and in the glabrous
skin[3]. Considering that cutaneous microcirculation
plays a pivotal role in diagnosing vascular disease[11-14]
and that by quantifying peripheral blood flow we can
assess tissue viability[11], these mechanisms assume
even greater importance.
Our results show a typical biphasic profile in the
vascular response to heating to 42ºC[21-22]. The initial
peak observed at 2m ± 1m40s coincides with results
previously obtained for other groups[21-23] and appears to
be a function of afferent sensorial nerve activity[24-28].
After a moderate drop that occurs at 4 m ± 1m40s, there
is a slow rise that reaches a maximum at around 18m±
1m 40 s. This response appears to be due to the local
release of nitric oxide, a potent vasodilator[28-30]. The
response to 44ºC of heat produces a quite different
profile, suggesting involvement of other regulatory
mechanisms. In this case, a plateau is achieved
immediately (Figure 1), without the typical rise and fall
in response seen at 42ºC. Some studies have suggested
that nociceptors may be involved in the response to
temperatures above 42ºC[23,31], which would produce
maximum vasodilation. The hypothesis of early release
of nitric oxide after heating 44ºC does not appear to be
correct, as nitric oxide typically produces a slow
response[29-30].
Statistically significant differences were observed
between the 42ºC and 44ºC stimuli in the peak, trough
and post-heating phases, which confirms the
differences observed in the profiles. The fact that there
is a difference in the post-stimulus periods between the
two temperatures also suggests the existence different
amplitudes in the LDF values that are proportional to
the temperature used. As the differences found in blood
flow are most likely the result of different regulatory
mechanisms, they may therefore be exploited not only
as a test of each of the systems involved, but also as an
indicator of the physiological mechanisms involved in
regulation.
TEWL is an important indicator of the integrity of the
skin barrier and is considered to be one of the variables
that best reflects the physiology of the skin[15-18]. This
variable is influenced by local hemodynamic changes,
although the relationship between local blood flow and
TEWL is poorly understood[19]. It is therefore important
to learn more about its dependence on local
temperature.
Changing the local temperature increases perfusion,
65
Pedro Pinto et al.
[19]
conhecida , é pois importante esclarecer a sua
depêndincia da temperatura local.
A alteração da temperatura local, ao aumentar a
perfusão, provoca um aumento da saída de água
(Figura 2). Neste caso não foram observadas diferenças
estatisticamente significativas entre as duas
temperaturas de aquecimento, sugerindo por isso um
mecanismo de libertação de água não dependente da
variação da temperatura. Foi descrita a existência de
uma eventual relação inversa entre o LDF e a PTEA à
temperatura normal da pele que se mantém após
hiperémia reactiva[18-20]. Nos resultados apresentados,
após o aquecimento, esta relação inversa não é
observada, provavelmente por força da intensa
vasodilatação que altera os mecanismos homeostáticos
locais.
Conclusão
O aquecimento da pele a diferentes temperaturas
parece colocar em evidência diferentes mecanismos de
regulação da temperatura local os quais podem ser
alterados por patologia vascular.
causing more water to be lost (Figure 2). Statistically
significant differences were not found between the two
heating temperatures, which suggests a water loss
mechanism that is independent of the temperature
change mechanism. The existence of a possible inverse
relationship between LDF and TEWL has been
described at normal skin temperature that is maintained
after reactive hyperemia[18-20]. In the results presented
here, this inverse relationship is not observed after
heating, probably due to the presence of intense
vasodilation, which alters local homeostatic
mechanisms.
Conclusion
Heating the skin to different temperatures appears to
activate different mechanisms of local temperature
regulation which may be altered in the presence of
vascular disease.
Acknowledgements
The authors would like to thank all the volunteers who
took part in the study.
Agradecimentos
Os autores desejam agradecer a todas as voluntárias
que cooperaram no desenvolvimento do estudo .
Referências / References
[1]. Christopher J, Abularrage MD, Sidawy N, Aidinian G, Singh N., Weiswasser JM, and Arora S. Evaluation of the
microcirculation in vascular disease. REVIEWARTICLE. J Vasc Surg, 2005, 42:574-81.
[2]. Wright CI, Kroner CI, Draijer R. Non-invasive methods and stimuli for evaluating the skin's microcirculation. Journal of
Pharmacological and Toxicological Methods, 2006 54:1-25.
[3]. Vinik AI, Erbas T, Park TS, Pierce KK, Stansberry KB.Methods for Evaluation of Peripheral Neurovascular Dysfunction.
Diabetes Technology & Therapeutics, 2001, 3(1):29-50.
[4]. Economides PA, Caselli A, Zuo C. S., Sparks, C., Khaodhiar, L.,Katsilambros, N., et al.Kidney oxygenation during water
dieresis and endothelial function in patients with type 2 diabetes and subjects at risk to develop diabetes. Metabolism, 2004,
53:222 -227.
[5]. Farkas K., Kolossva´ry E, Ja´rai Z.,Ja´nos N, & Farsang C. Noninvasive assessment of microvascular endothelial function
by Laser Doppler flowmetry in patients with essential hypertension.Atherosclerosis, 2004, 173, 97-102.
[6]. Generini S., Del Rosso A., Pignone A., & Cerinic M. Current treatment options in Raynaud's phenomenon. Current
Treatment Options in Cardiovascular Disease. Medicine, 2003, 5; 147-161.
[7]. Belch, J.. Raynaud's phenomenon. Cardiovascular Research, 1997, Jan; 33;25- 30.
[8] .Belch, J. J. & Ho, M. Pharmacotherapy of Raynaud's phenomenon.Drugs, 1996, 52, 682-695.
[9]. Smyth AE, Bell AL, Bruce IN, McGrann S. and Allen A. Phenomenon concentrations in primary and secondary Raynaud's
Digital vascular responses and serum endothelin-1.Ann Rheum Dis, 2000, 59;870-874.
[10]. Berghoff, M., Kathpal, M., Kilo, S., Hilz, M. J., Freeman, R., Vascular and neural mechanisms of ACh-mediated
vasodilation in the forearm cutaneous microcirculation, JAppl Physiol, 2002, 92:2, 780-788.
[11]. Rossi M., Carpi A., Galetta F, Franzoni F., Santoro G. The investigation of skin blood flowmotion: a new approach to study
the microcirculatory impairment in vascular diseases. Biomedicine & Pharmacotherapy, 2006, 60:437-442.
[12]. BircherA.J., de Boer E.M.,Agner T., Wahlberg J.E., Serup J.: Guidelines for measurement of cutaneous blood flow by laser
Doppler flowmetry: A report from the Standardization Group of the European Society of Contact Dermatitis. Cont. Derm., 1994,
30: 65-72.
66
Avaliação do efeito da temperatura sobre a dinâmica da resposta microcirculatória cutânea
Assessment of the effect of temperature on the dynamics of cutaneous microcirculatory response
[13]. Kvandal, P. Stefanovska, A. Veber, M. Kvernmo, H. D. Kirkeboen, K. A., Regulation of human cutaneous circulation
evaluated by laser Doppler flowmetry, iontophoresis, and spectral analysis: importance of nitric oxide and prostaglandins,
Microvasc Res, 2003, 65:3, 160-171.
[14]. Van Den Brande P, Von Kemp K., De Coninck A, Debing E. Laser Doppler flux characteristics at the skin of the dorsum of
the foot in young and in elderly healthy human subjects. Microvasc Res., 1997, 53(2):156-62.
[15]. Lévêque JL.Measurement of trans-epidermal water loss;. In: Lévêque JL, ed., Cutaneous investigation in health and
disease: non-invasive methods and instrumentation, New Yourk: Marcel Dekker; 1989, 135-153.
[16]. Lavrijsen APM, Oestmann E, Hermans J, Boddé HE, Vermeer BJ, Ponec M. Barrier function parameters in various
keratinisation disorders: teansepidermal water loss and vascular response to hexyl nicotinate. Br J Dermatol., 1993, 124: 547554.
[17]. Treffel P, Gabard B. Stratum corneum dynamic function measurements after moisturizer or irritant application. Arc
Dermatol Res., 1995, 287: 474-479.
[18]. Pinto PC, Pereira LM, Minós R, Rodrigues LM. Testing the discriminative capacity of compartimental modelling for the
analysis of the in vivo epidermal water content changes following a topical intervention. IFSCC Mag . 2002, 5: 87-92.
[19]. Rodrigues LM, Pinto PC, Magro JM, Fernandes M, Alves j. Exploring the influence of skin perfusion on transepidermal
water loss. Skin Res Technol, 2004, 10:257-262.
[20]. Rodrigues LM, Pinto PC, Leal A. Transcutaneous flow related variables measured in vivo: the effects of gender, BMC
Dermatol, 2001, 1;4. Epub.
[21]. Kellogg DL, Jr. In vivo mechanisms of cutaneous vasodilation and vasoconstriction in humans during thermoregulatory
challenges. JAppl Physiol., 2006, 100:1709-1718.
[22]. Charkoudian N. Skin Blood Flow in Adult Human Thermoregulation: How It Works, When It Does Not, and Why. Review.
Mayo Clin Proc., 2003, 78:603-612.
[23]. Golay S. et all. Local heating of human skin causes hyperaemia without mediation by muscarinic cholinergic receptors or
prostanoids. JAppl Physiol., 2004, 97: 1781-1786.
[24]. Pergola PE, Kellogg DL Jr, Johnson JM, Kosiba WA and Solomon DE. Role of sympathetic nerves in the vascular effects of
the local temperature in human forearm skin.Am J Physiol. Heart Circ. Physiol 1993, 265:H785-H792.
[25]. Holzer P. Neurogenic Vasodilatation and Plasma Leakage in the Skin, Gen. Pharmac., 1998, Vol. 30, No. 1, pp. 5-11.
[26]. Charkoudian N., et all. Effects of chronic sympathectomy on locally mediated cutaneous vasodilation in humans. J Appl
Physiol., 2002, 92: 685-690.
[27]. Mirakhur RK, Jones CJ, and Dundee JW. Effects of intravenous administration of glycopyrrolate and atropine in
anaesthetized patients.Anaesthesia 1981, 36: 277-281.
[28]. Arildsson M, G. E. Nilsson, and T. Stromberg Effects on Skin Blood Flow by Provocation during Local Analgesia.
Microvascular Research, 2000, 59, 122130.
[29]. Kellogg DL, Liu JR, Kosiba F. and O`Donnel D. Role of nitric oxide in the vascular effects of local warming of the skin in
humans . J.Appl Physiol, 1999, 86:1185-1190.
[30]. Minson CT, Berry LT, and Joyner MJ. Nitric Oxide and neurally mediated regulation of skin blood flow during local
heating. JAppl Physiol, 2001, 91: 1619-1626.
[31]. Brain SD, Grant AD. Vascular actions of calcitonin gene-related peptide and adrenomedullin. Physiol Rev., 2004, 84:90334.
[32]. Bonelli RM, Koltringer P. Autonomic nervous function assessment using thermal reactivity of microcirculation. Clinical
Neurophysiology, 2000, 11: 1880-1888.
[33]. Abu-Own, A. Scurr, J. H. Coleridge Smith, P. D. Effect of leg elevation on the skin microcirculation in chronic venous
insufficiency, J Vasc Surg, 1994, 20:5, 705-710.
[34]. de Graaff, J. C., Ubbink, D. T., van der Spruit, J. A., Lagarde, S. M., Jacobs, M. J. Influence of peripheral arterial disease on
capillary pressure in the foot, , J Vasc Surg, 2003, 38:5, 1067-1074Workplace-based cardiovascular risk management by
community pharmacists: impact on blood pressure, lipid levels, and weight. Pharmacotherapy. 2006 Oct;26(10):1511-7.
67
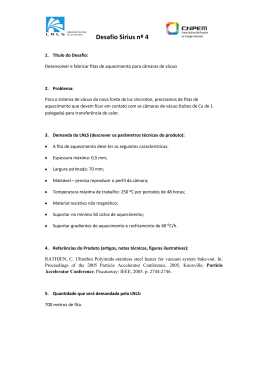
Download