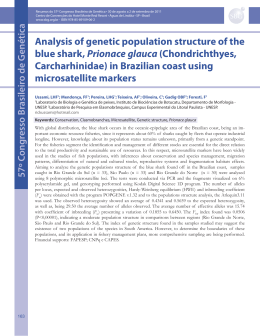
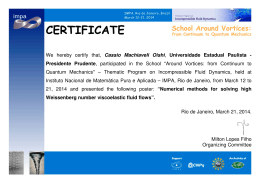
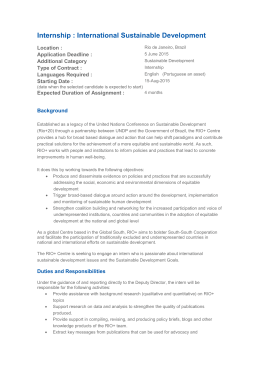
th Proceedings of the 17 Physics of Estuaries and Coastal Seas (PECS) conference, Porto de Galinhas, Pernambuco, Brazil, 19–24 October 2014 Wave Climate and Events Migration Mud at Cassino Beach, RS, Brazil: An Investigation MACHADO, D.M.1, VINZON, S.B.2, PARENTE, C.E.2 1 2 Oceanic Engineering Program, Federal University of Rio Grande (FURG), Rio Grande, RS, Brazil. ph +55 53 3233 6766. Email: [email protected] Oceanic Engineering Program, Federal University of Rio de Janeiro (UFRJ), Rio de Janeiro, RJ, Brazil. ph/fax +55 21 2562 8748. Email:[email protected]; [email protected] Keywords: wave climate, events migration mud SUMMARY This work presents a correlation between the mud migration events to the beach and the local wave climate. The aim is to achieve a better understanding of the mechanisms that lead to the remobilization of the mud banks. The methodology employed consists of analyses of measured data by a directional wave meter, wind data from NCEP/NCAR (reanalysis II) and modeled data with Wavewatch III. Results suggest that the Bad Weather from Southwest is the sea state present in the majority of mud events on the beach. 1. INTRODUCTION The occurrence of mud at Cassino Beach has always raised the curiosity of the local community and the interest of researchers. The phenomenon is natural/anthropogenic origin, have been reported by several authors since 1972. Sedimentological data show that the Patos Lagoon is the major source of fine sediment to the inner shelf adjacent [1] [2] [3]. This lagoon receives contributions from a continental drainage basin of approximately 200.000 km2, contributing annually with approximately 4.5 million tonnes of suspended particulate matter [4]. These sediments are transported in the form of a coastal plume during periods of high river discharge and northeast wind, depositing on the Inner Continental Shelf where, during high energy waves associated with the passage of cold fronts, common to the region, can be remobilized and released to the beach, making important effects of short and long duration on the beach characteristics [5] and bringing negative consequences to the ecosystem and tourism in the region. In last decades the phenomenon had been more frequent, occurring at least once a year, starting in 1998 [6]. More recently studies [7] have associated these events with migration of anthropogenic origin (dredging the access to the Port of Rio Grande channel). Owing to economic and environmental consequences observed in the region each deposition, is essential to understand the mechanisms that control the dynamics of these deposits. This dynamic is directed linked to the wave climate of the region [8]. This study aims to investigate the wave climate, linking it with mud migration events that occur at Cassino Beach, proposing for the first time categories for the existing states of the sea in the region, from the active weather systems, the energies for high and low frequency and the directional stability of the waves at different frequencies, by applying a spectral technique (DAAT). 2. STUDY AREA Cassino Beach (Figure 1), the area of interest of this study, is located in Rio Grande, RS, forming the northern portion of a sandy barrier, 220 km long, limited to the south by Chuy Bar, at the border BrazilUruguay border, and north, the west jetty of Rio Grande Bar [9]. Oriented NE-SW, the coast line of the RS is straight and smooth contour and is characterized by a continuous strip of sandy ocean beaches with a width varying between 50 and 100 meters [10]. th Proceedings of the 17 Physics of Estuaries and Coastal Seas (PECS) conference, Porto de Galinhas, Pernambuco, Brazil, 19–24 October 2014 According to the bottom morphology, the Inner Continental Shelf presents three distinct regions: a central region extremely homogeneous and smooth in the mouth of the lagoon, 50 km south of Rio Grande Bar, one to the north of this area, with topographic irregularities longer represented by sandy banks and parallel to the shoreline and another further south, which features shorter and perpendicular to the shoreline banks [3] [10]. The subtropical climate is temperate, with influence of polar and tropical air. As for rainfall, this is well distributed throughout the year, getting around 1300-1500 mm for the study area [11]. Figure 1 - Location of the study area. 3 METHODOLOGY The wind data (zonal and meridional components) were obtained from the database of the NCEP (Reanalysis II) and correspond to a period of 16 years (1996-2011). The wave data were measured by a directional wave meter, placed at 15 m depth, located opposite the east jetty of Rio Grande Bar, corresponding to a period of approximately 3 years (October 1996 to June 1999). In order to characterize the mud migration events occurring from the year 2000 and due to limited data, the model Wavewatch III (WW3), version 3.14 [12], was used for the reconstruction of sea states (in terms of H s, Tp, and Dp) present in the Casino Beach. The model was configured with four nested numerical grids, with different dimensions and spatial resolutions (Table 1). These grids were constructed based on the results from the ETOPO1 bathymetric model. From the numerical grids and wind fields at 10 m, the model was processed for each of the events occurring mud deposition (from 1998 to 2011). To characterize the wave climate of the region, the DAAT technique (Directional Analysis with Adaptive Techniques) was used. This is a spectral DAAT for the directional wave analysis developed by Parente [13], in order to improve the spatial resolution in the analysis of directional wave data technique. Thus, for a given frequency band, it is possible to detect the occurrence of waves coming from different Table 1 – Computational domain used for WW3. directions, resulting the energy distribution as function of the direction for each frequency. The parameters of the main direction, spectra and directional spread for each frequency band are calculated by generating a Morlet wavelet function type. The main wave direction is calculated from the technique of Maximum Entropy (MEM) in order to improve the resolution of the spectral analysis. To complement the technique, [13] developed the PLEDS (Plotting the Evolution of Directional Spectrum) consisting of monthly graph the evolution of directional spectrum. 4 RESULTS AN DISCUSSION The use of DAAT (Figure 2) allowed us to propose categories of sea to the Casino, from the plot of the monthly evolution of directional spectra and wind and directional stability of waves in different frequency bands. Each frequency band is representative of a sea state: Band 1 (red) represents a swell, band 2 (pink) represents a swell with smaller fetch, band 3 (yellow) can either be a swell generated not far as a local sea with strong winds, bands 4 and 5 (green and blue, respectively) are representative of the local sea. The criteria adopted for the separation of the different seas in the region were observed: the dominant atmospheric systems, the energy of the different sea states for high and low frequency and directional stability of waves in the different frequency bands. From the results obtained with the DAAT (using data th Proceedings of the 17 Physics of Estuaries and Coastal Seas (PECS) conference, Porto de Galinhas, Pernambuco, Brazil, 19–24 October 2014 measured wave), four categories of sea states were proposed to the Cassino: Good Weather without Swell, Good Weather with Swell, Bad Weather from Southeast and Bad Weather of Southwest (Table 2). Table 2 – Sea states for Cassino Beach. From 1972 to 2011, more than 20 deposition events along the Cassino Beach were recorded (Table 3). From the dates of occurrence of these Figure 2 – Directional wave spectrum (PLEDS) – events, confirmed in local newspapers archives, January – 1997. a study was carried out to identify the synoptic conditions at the time of the events occurrence. From the thirteen cases of deposition/erosion were studied (Table 4), 77% are associated with cyclones and anticyclones 23%. Table 3 - Historical survey of the occurrence of mud at Cassino. Confirmed dates in local newspapers. Table 4 - Atmospheric systems associated with the deposition of mud and the proposed sea states. The results obtained by WW3 (Tp between 9 and 13s, Hs ranging between 0.9 and 1.5 m and Dp around 150°), together with the analysis of the active atmospheric systems, compared with the results of the category of Bad Weather SW (obtained by measured data), where we have Tp ranging from 9 e13s, Hs ranging between 1.4 and 2.0 m and Dp between SW-SE, supports the hypothesis that the migration mud events occur preferentially with the Bad Weather from Southwest (Figure 3), with the majority of extratropical cyclone very close to the southern Brazil coast (Figure 4), usually on the day of the cyclone formation. These cyclones remain stationary and not produce great fetches, but have sufficient intensity and duration for the formation of more energetic waves, which may be an indication that the positioning of the atmospheric system is more important than the fetch, mud migration events modeled by WW3. th Proceedings of the 17 Physics of Estuaries and Coastal Seas (PECS) conference, Porto de Galinhas, Pernambuco, Brazil, 19–24 October 2014 0S5 17/04/1999-12Z VENTO10M-REANAL.NCEP - >0m/s >1m/s >3m/s >5m/s >7m/s >9m/s >11m/s>13m/s 10 m/s 10152025303540455055606570-| 80W Figure 3 – Bad Weather SW (red ellipse) – April 1999 – Cassino Beach. | 75 | 70 | 65 | 60 | 55 | 50 | 45 | 40 | 35 | 30 | 25 | 20 | 15 Figure 4 – Extratropical Cyclone (black arrow) Bad Weather SW. 5 CONCLUSION This study aimed to correlate the migration events occurring mud at Cassino Beach, RS, with the wave climate of the region. By applying the technique DAAT and active weather systems in the region of interest, four categories of sea states were proposed to Cassino Beach: Good Weather with and without Swell and Bad Weather in the Southeast and Southwest. The results of the analyzes for both the measured data and for the data modeled by WW3, showed that in most cases the Bad Weather from Southwest is the category of this sea in the migration of mud. 6 REFERENCES [1] Calliari, L.J., et al., 2000. The mud banks of Cassino Beach, Southern Brazil: Characteristics, Processes and Effects. ICS 2000. Proceedings, pp.1-9, New Zealand. [2] Pereira, P.S., et al., 2002. A tempestade de Iemanjá, 01 de fevereiro de 2002, e a deposição de lama na Praia do Cassino. Simpósio Brasileiro de Oceanografia. Instituto Oceanográfico da Universidade Federal de São Paulo. Resumo em CD, arquivo ocgeo 03. [3] Calliari, L.J., et al., 2009. Fine grain sediment transport and deposition in the Patos Lagoon–Cassino beach sedimentary system. Continental Shelf Research. Vol.29, No 3, pp.515-529. [4] Hartmann, C. and Schettini, C., 1996. Cronologia Sobre o Estudo do Material em Suspensão no Sistema Lagunar Patos Mirim e Plataforma Continental Adjacente, RS, Brasil. Technical Notes, 9: 12-20. LOG/DEGEO/FURG. [5] Calliari, L.J., et al., 2007. The Influence of Mud on the Inner Shelf, Shoreface, Beach e and Surf Zone Morphodynamics – Cassino, Southern Brazil. Proceedings. Coastal Sediments ’07. [6] Machado, D.M., 2013. Um estudo sobre o clima de ondas e o transporte de lama ao largo da Praia do Cassino, RS. PhD thesis, Federal University of Rio de Janeiro, COPPE/UFRJ, Rio de Janeiro. 322p. [7] Calliari, L.J., 2010. Da relação da deposição de 2009 e sua relação com volumes calculados com base nos dados dos depósitos submersos mapeados em 2005. Technical Notes, 1: 1-9. IO/LOG/FURG. [8] Villwock, J.A.; Martins, L.R.S., 1972. Depósitos lamíticos de pós-praia, Cassino, RS. Research, 1: pp. 69-85. [9] Guedes, R.M.C., 2006. Morfodinâmica de Alta Frequência de um Sistema Praial com Bancos Triplos Durante o Experimento Cassino 2005. Graduation dissertation. Federal University of Rio Grande, FURG, Rio Grande, RS, Brasil. 84p. [10] Fachin, S., 1998. Caracterização do Perfil de Equilíbrio da Antepraia na Costa do Rio Grande do Sul. MSc thesis in Geociências. Federal University of Rio Grande do Sul, UFRGS, Porto Alegre, RS, Brasil. 105p. [11] Camargo, O.A., et al., 2002. Atlas Eólico do Rio Grande do Sul. Secretaria de Energia, Minas e Comunicações. Porto Alegre / RS. 70 p. Disponível em http://www.semc.rs.gov.br/atlas. [12] Tolmam, H. L., 2009, “User Manual and System Documentation of WAVEWATCH III version 3.14”, NOAA / NWS / NCEP / MMAB Technical Note 276, 194 pp + Appendices. [13] Parente, C.E., 1999. Uma Nova Técnica Espectral para Análise de Ondas. PhD thesis, Federal University of Rio de Janeiro, COPPE/UFRJ, Rio de Janeiro.
Baixar