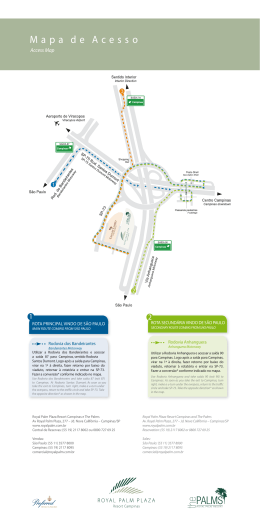
RESEARCH ARTICLES Availability and consumption of groundwater resources in the Campinas Region, SP, Brazil Sueli Yoshinaga Pereira Institute of Geosciences University of Campinas UNICAMP [email protected] Annkarin Aurélia Kimmelmann e Silva Bandeirantes University UNIBAN ABSTRACT This study presents an evaluation of the availability of groundwater resources in the Campinas Metropolitan Region, SP, Brazil, through the estimation of rates of groundwater reserves and consumption. The region is characterized by low permeability aquifer systems, such as: Tubarão Aquifer Systems (glacial and post glacial consolidated sediments), Crystalline Aquifer Systems (granites, migmatites and gnaisses) and diabase sills and dikes. These aquifer systems present the following median values of productivity: 0.1 m3/h/m, 0.11 m3/h/m and 0.06 m3/h/m, respectively, and 0.07 m3/h/m for wells exploiting two or more aquifers. The region has a population of 2,151,543 inhabitants, is highly industrialized and it is located in the Piracicaba River Hydrographic Basin. The chronic scarcity of water reflects incalculable human interference, such as the water transpositions by Cantareira System. The total availability of groundwater resources was estimated at 3,22 m3/s (1996) and the consumption was estimated at 1,73 m3/s, representing an exploitation of 54%. Now, this rate is estimated at 72%. It is predicted that in 5 years this exploitation will reach the total reserve. Finally this study concludes with the discussion of the quality and quantity of information, since the most recent data are from 1994/95 and this was the last update of well records in the region. KEYWORDS Introduction groundwater resources, availability, Campinas Metropolitan Region The Campinas Metropolitan Region is located 150 km from the state capital, São Paulo, between parallels 22 o 25S and 23 o15S and meridians 46o30W and 47o35W. The cities considered part of this region are: Americana, Artur Nogueira, Campinas, Cosmópolis, Engenheiro Coelho, Holambra, Hortolândia, Indaiatuba, Jaguariúna, Monte Mor, Nova Odessa, Paulínia, Pedreira, Santa Bárbara dOeste, Santo Antonio da Posse, Sumaré, Valinhos and Vinhedo. This region is defined by EMPLASA (1993) as the Campinas Region Metropolitan Area. This study chose the area proposed by EMPLASA (1993) due to the inclusion of cities with rural profile at the initial stages of the metropolitan process. A general evaluation of the occupation process was obtained at the territorial level, and more specifically, a complete and updated situation analysis of groundwater resources in urban areas as well as in agricultural and livestock areas. TERRÆ, 1(1):34-43, 2004 TERRÆ, 1(1):34-43, 2004 PEREIRA, S.Y., KIMMELMANN E SILVA, A. It was necessary to calibrate the different sets of real data analyzed, because of the date of the last record in the region (1994) and the age of the database (DAEE 1981). With the earlier and the updated values in hand, a correction value was defined that considered the demographics of each city. Regarding water resources management, the area is located inside Management Unit 5 (UGRHI), composed of the Piracicaba, Capivari and Jundiaí hydrographic basins (State Law number 9034, from December 27th, 1994). The main access routes to the region are the following highways: Bandeirantes (SP-348), Anhangüera (SP-330), Dom Pedro I (SP-065) and Marechal Rondon highway (SP-300). The local map is shown in Figure 1. a) Estimate of groundwater availability The calculation procedures for groundwater availability were based on the method proposed by Lopes (1994). Volume calculation of available groundwater is done through the following expression, adopted by the Geological Institute (IG, 1993) for Campinas city: Methodological procedures The studies of the groundwater availability and consumption consisted of the use of the SIPO Database, from the Geological Institute, where data recorded for some cities were found, such as Campinas (1993), Sumaré, Hortolândia, Holambra, Paulínia, Jaguariúna, Americana, Nova Odessa and Cosmópolis (1994). For the remaining cities, the records of the Water and Electrical Energy Department (DAEE) from 1981 were employed. The population data were compiled from SEADE 1995. Qavailable = S. Q7,10 .f, where: l l l Figure 1 Localization map of Campinas Region 35 Q = flow in cubic meters of available groundwater per unit of time in seconds. S = recharge area in square kilometers. Q7,10 = minimum seven-day average flow and return period of 10 years, which is similar to the multi-annual transitory recharge values for the aquifer. It is the average amount of water PEREIRA, S.Y., KIMMELMANN E SILVA, A. TERRÆ, 1(1):34-43, 2004 that passes through the aquifer from precipitation and it constitutes the base flow of the superficial drainage system of the area considered (in cubic meter per second per square kilometer). l l l f = percent factor that represents the maximum amount of water to be exploited from the recharge due to technical and hydrogeological limiting factors. This value varies empirically between 0.2 (fractured rocks Crystalline and Diabase aquifer) and 0.25 (sedimentary rocks Itararé and Cenozoic aquifers). Study area Campinas Metropolitan Region Campinas was founded in the 18th Century as a lodging place for the colonists (Bandeirantes). In 1774 the city was called Nossa Senhora da Conceição de Campinas. At that time, the sugar cane crop in several farms was the most important economic activity, surpassing mining, in decay by that time. In 1797 Campinas began to be considered a village, and was called São Carlos until 1842, when it was raised to the status of a city, and called Campinas. From this period until the end of the 19th Century, coffee was responsible for prosperity, making Campinas a center for the coffee trade and the main state railroad intersection, with the intersection of the Paulista, Mogiana and Sorocabana railroads. b) Groundwater consumption an estimate of consumption is based on the IG (1995) and Lopes (1994) methods, through the following expression: CONSUMPTION = Qz . Nwells . Tpump/24, where: l Tpump = average pumping time in hours per day, considering the type of water use (9 hours per day). The number of wells in the study area was based on a calculated estimate by IG (1993, 1995) and Lopes (1994) for 1994 (closing date for Wells Recording). The consumption estimate was calculated for several economic activities in the region and matched with the data available for groundwater, in order to obtain an updated picture of the situation and its perspectives. The percentage of wells used for this type of economic activity (primary, secondary and tertiary) and for public distribution and private distribution were determined taking the existing numbers in the Record (Table 1). The resulting values were used to estimate the number of wells, the consumption per economic activity and finally the total consumption of groundwater in the study area. For each area, the attributed pumping time is: cattle raising and agriculture 8h/ day; industry 18h/day; trade 6h/day; public supply 24h/day and private distribution 2h/day. The per capita consumption (estimated at 300 liters/day) results in a total estimate of superficial water for the calculation of losses in the water supply network, considering that 90% of the total population in the study area is provided by waterworks companies. In the Campinas Metropolitan Region a total population of 1,912,782 was considered; the water consumption estimated was 6.0 m3/s, considering that 90% of the population is supplied with superficial water. Therefore, the calculated loss is 1.02 m3/s or 3.2 million cubic meters per year. The available flow is considered the multi-annual and transitory recharge of the aquifer, equivalent to the water volume infiltrated to the aquifer by precipitation in a sub-basin that acts directly on the base flow of the superficial water bodies. In other words, it is the water volume located between the potentiometric surface and the base level of drainage from a determined region. This volume becomes the potential renewable groundwater reservoir of a basin (Lopes 1994). The study area was divided according to the subbasins that compose the Piracicaba, Capivari and Tietê river basins, and the base flow data were collected by the river flow monitoring database of DAEE (1982). Availability was also calculated for the system aquifer/Tubarão aquifer, Crystalline, Diabase and Cenozoic. On the resulting calculated availability, a 17 percent value is added to the total volume of treated and distributed water that corresponds to losses in the water distribution network, and is part of the water that infiltrates to the groundwater. The water loss in the water distribution network that infiltrates to the aquifer varies from 10 to 25%, depending on each citys situation; 17% was considered an average for the calculation in this study. This total value is an estimate. l Nwells = total number of active wells in the studied area. CONSUMPTION = total volume of groundwater exploited by the wells in the city in cubic meters by time in seconds. Qz = average discharge (m3/s) of the wells in the studied area (6.0 m3/h). 36 TERRÆ, 1(1):34-43, 2004 PEREIRA, S.Y., KIMMELMANN E SILVA, A. Table 1 Estimates of numbers of wells by economic activities in the Campinas Region SP, Brazil Municipalities Population Number of wells registered Number of wells estimated Cattle raising/ agriculture Campinas Vinhedo Monte-Mor Valinhos Indaiatuba Pedreira S.Bárbara Oeste Artur Nogueira/ Eng. Coelho 873,612 35,844 27,976 71,166 110,515 28,791 160,582 672 27 36 126 43 15 42 806 110 182 363 168 45 105 137 26 60 51 39 9 5 8 5 0 0 0 40 0 21,045 13 70 27 S.Antônio Posse Americana Nova Odessa Sumaré Hortolândia Paulínia Cosmópolis 14,828 158,526 36,484 157,887 99,510 40,068 36,606 5,960 24,295 1,910,782 7 106 56 101 89 81 25 124 83 1,646 28 120 60 115 95 87 28 125 85 2,592 4 1 5 10 9 4 7 120 26 540 Holambra Jaguariúna Total These railroads were responsible for the transportation of coffee to Santos Port. The industrialization process started in 1850 with the installation of the first Melting Stations necessary for the processing of coffee and the manufacturing of parts for the maintenance of the railroads (EMPLASA 1993). At the beginning of the 20th Century, coffee was still outstanding among the most important economic activities. Production was decreasing because of the depletion of the soil and the increase in cotton farming, which ended up taking coffees place as the main agricultural product. The industrialization process continued due to the strategic position of Campinas, its transportation benefits and its importance as a consumer market. In the 30s and 40s, urban commercial activities, industries and services were the most important activities, surpassing agricultural production. Urban centers and housing for workers expanded, creating an urban orientation, consolidated by the Prestes Maia state government in 1934 with the implementation of urban planning. According to EMPLASA (1993), in the 50s and 60s there was an implementation of large industries, such as Singer, General Electric, Bosch, Clark and Rhodia, among others. The industrialization of Trade Private supply Public supply 209 37 36 77 32 3 30 137 0 5 29 3 0 0 217 37 76 181 94 12 35 98 5 5 25 0 3 35 0 6 10 10 17 0 0 1 1 3 2 0 0 7 45 4 47 34 52 36 46 3 0 6 658 0 11 5 7 1 26 2 0 8 244 20 56 11 42 39 6 15 5 35 891 0 5 4 3 7 3 1 0 3 214 Mining Industry Campinas occurred mainly along the regional road axis, such as the Anhangüera Highway, followed by roads such as Santos Dumont, D. Pedro I, Bandeirantes and on the roads linking Campinas with Mogi Mirim, and Campinas with Paulínia. The consolidation of Campinas industrial profile turned this city into the interior industrial center, its urban shadow expanded into the surrounding industrial areas and in the 60s the city was considered to be one of the best in the country by urban standards. In the 70s, Campinas became a large city and the population concentration extended towards the neighboring cities that were located along the Anhangüera Highway: Valinhos, Vinhedo, Sumaré, Nova Odessa, Santa Bárbara dOeste and Americana. The implementation of REPLAN- Petroleum Refining (known as Refinaria do Planalto) in Paulínia and public investments in the region such as COHAB, as well as the creation of incentives and agricultural policies, installation of research centers and universities, and the opening of the Viracopos Airport were the hallmarks of this period in the region. Agricultural activity was also present in this region. Now, the main seasonal cultivations are: sugar cane, corn, tomatoes, and rice. The main producing 37 PEREIRA, S.Y., KIMMELMANN E SILVA, A. TERRÆ, 1(1):34-43, 2004 tive growth of these cities was 341.3%, 147.0% and 162.6%, respectively (EMPLASA 1993). This industrialization process created a high urbanization level in the region, where the rate reached values above 90% in 1991 for some component cities, such as the cities of Americana, Campinas, Indaiatuba, Nova Odessa, Pedreira, Santo Antonio da Posse, Sumaré and Vinhedo, and high values (above 75% with the exception of Artur Nogueira) for the remaining cities (EMPLASA 1993, SEADE 1993). Quality of life was reduced, with the disorderly growth characteristic of the occupation during the last decades; national economical instability was an important factor in this decline. In the 80s - 90s, there was a decrease in the growth rhythm in the region. The growth rate was 3.5% versus 6.6% in the past decade, reflecting the worsening of the Brazilian economic crisis. This reduction was more significant in the large urban centers (Americana and Campinas); the population redistribution phenomena was observed across the state, where there was a migration from large centers to medium and small cities (EMPLASA 1993). The Campinas Metropolitan Region always had economic importance and social responsibilities, because it was situated in a strategic location with access to the interior of São Paulo and Minas Gerais State, making possible the participation of historic processes of predominant economic activities, such as coffee cultivation and industrialization, which resulted in the consequent urban expansion. The increased industrialization in the region, its structural consolidation with the implementation of modern industries, and the amplification of traditional industries that occurred from the 70s through the 90s, were responsible for the urbanization process in Campinas, and the consequent co-urbanization in the region that extended as far as Piracicaba. This process explained the growth and the behavior of the economically active population. In the 80s, the growth rate of Campinas Metropolitan Region declined reflecting the national economic crisis. However, its participation at the state level was increasing, keeping in mind that other industrialized areas, such as the São Paulo Metropolitan area, reduced in participation in the state. In the 90s, there was a reactivation of industrial growth, which promoted the amplification of the industries already implemented, the automation of other industries, mainly the textiles industries, and the implementation of petrochemical and thermoelectrical industries in the region. cities are: Santa Bárbara dOeste, Cosmópolis, Monte Mor; Campinas, Indaiatuba, Artur Nogueira and Sumaré. There is some permanent cultivation, such as: oranges, coffee, tangerines, pears and grapes, and the producing cities are Cosmópolis, Santo Antonio da Posse, Santa Bárbara dOeste, Indaiatuba, Campinas, Vinhedo and Valinhos. Holambra is important in this region due to the history of Dutch colonization and the main agricultural and livestock economic activity, with diversified and significant production of products such as ornamental plants, oranges, pig breeding and aviculture. The growth process of this region was followed by the decrease in quality of life, with larger slums and poor areas in Campinas and surrounding cities explained by intense industrialization, which was also responsible for the high level of urbanization. The cities of Sumaré, Nova Odessa, Americana and Santa Bárbara dOeste, located on Anhangüera axle, were responsible for the highest registered population growth rate, caused by the industrialization of the region. This population growth was caused in part by migration, specifically to the cities of Sumaré, Santa Bárbara dOeste, Nova Odessa, Artur Nogueira, Campinas and Vinhedo, which went from negative growth in the 60s to values higher than 60% of absolute total growth. In the 80s, the metropolitan process of Campinas was evident. The implementation of industries such as computers, microelectronics, telecommunications and fine chemistry, as well as the increase of traditional industries (metals, machinery, transportation material, paper and cellulose, among others), occurred not only in Campinas, but also in the cities of Americana, Indaiatuba, Paulínia, Santa Bárbara dOeste, Sumaré, Valinhos and Vinhedo. The courbanization process that was initiated in the 70s settled in the next period, with the dislocation of the population of Campinas to the neighboring cities. Growth practically doubled in the period of the 70s and 80s (the population rose from 652,450 in the 70s to 1,235,124 inhabitants in the 80s). This sudden increase in population was the result of intense migration caused by the high rate of job offers with the increase and significant diversification of the industrial activities in the region. The migration rate in this period reached 69.1% of 89% total population growth in the region, against 59.1% of 68.5% of growth in the earlier decade. The city that received the most migrants was Sumaré, followed by Santa Bárbara dOeste and Nova Odessa; the rela- 38 TERRÆ, 1(1):34-43, 2004 PEREIRA, S.Y., KIMMELMANN E SILVA, A. are difficult to analyze according to spatial and layering parameters. This system is considered an aquifer of regional extension, with primary porosity. It is a free to semi-confined aquifer, which is heterogeneous, discontinuous and anisotropic. In the study area, the wells located in this aquifer system presented median specific capacity and discharge values of 0.11 m3/h/m and 6.0 m3/h, respectively. It is interesting to mention the presence of wells with specific capacity values in the interval 0.1 to 0.2 m3/h/m and discharge between the interval of 1 to 12 m3/h, which can be considered as limited productivity for this aquifer system. The influence of the rock structures in well productivity is also important, and it is represented by the median specific capacity value (0.14 m3/h/m) and discharge value obtained in wells located in drainage lines (12 m3/h) against 0.125 m3/h/m and 7.0 m3/h of median values for these parameters obtained in wells located outside of drainage lines. The analysis of geological profiles of wells determined the thickness of sandstone and the percentage of the sandstone thickness, which were correlated to the wells productivity. There is a tendency to increase the productivity values in function of the presence of sandstone in higher percentages. The Diabase Aquifer showed the lowest average specific capacity values and flow (0.06 m3/h/m and 4.5 m3/h) found in the metropolitan region. The distribution for the specific capacity and discharge values indicated larger concentrations at a lower interval (0 to 0.01 m3/h/m and between 0 to 1 m3/h, respectively). This aquifer productivity depends on the existent rock fracturing, corroborated with the determination of a median of the specific capacity of 0.12 m3/h/m in wells located inside the drainage line, in comparison with the obtained value of 0.05 m3/h/ m, averaged from the determined values in wells located outside these lines. The large number of wells that draw from more than one aquifer system (around 271 deep tubular wells) justified separate hydrodynamic and productivity analyzes in the study area. This situation results from the geological state of the area: it is on the edge of the Paraná Sedimentary Basin, the sediments of which are still not very thick, and therefore the crystalline rocks are found at low depths. Besides this, there are diabase occurrences in the surface and subsurface in bodies of limited extension, which increases the complexity of this border basin region. Results 1. Aquifer systems characterization The Campinas Metropolitan Region has two large aquifer systems with regional characteristics: the Crystalline Aquifer System, with fissure porosity, which occurs in the eastern portion of the area, and the Tubarão Aquifer System, specifically the Itararé Aquifer, of primary porosity, situated in the central and western portion. Second, the diabase bodies are considered local aquifers, due to their occurrence in bodies of various dimensions and depths; their productivity is associated with fracturing in the rock. Finally, the sediments of the Cenozoic deposits, which occur in the top of large hills, and the alluvionar sediments, on the banks of rivers, are aquifers of primary porosity. In general they are not exploited by the wells from the region, and therefore are not evaluated in this study. The Tubarão, Crystalline and the Diabase aquifer systems are analyzed below, as well as areas where there are wells that explore more than one aquifer. The Crystalline Aquifer System is presented in the literature as an aquifer of regional extension, with secondary porosity (groundwater circulation occurs in the rock fractures), it is anisotropic and heterogeneous, and displays various behaviors, from semiconfined to non-confined. In the hydrodynamic characterization of the 312 wells that draw exclusively from this aquifer, a median specific capacity of 0.1 m3/h/m (average of 0.28 m3/h/m) and median discharge of 5.2 m3/h (average of 7.3 m3/h) were found. In the distribution of the specific capacity and discharge, the values were concentrated in intervals of 0.05 to 0.5 (mainly in the interval 0.05 to 0.2) m3/h/m and 1 to 10 m3/h (relevant at the interval between 1 to 6 m3/h). In seven wells, the transmissibility values calculated varied from 0.13 to 6.85 m3/day/m. The largest median specific capacity and discharge values for wells were located close to the drainage line (that points out rock fracturing), indicating the relationship between the productivity and the presence of structures in the hosting rocks. The Tubarão Aquifer System Itararé Aquifer has high hydrogeological complexity due to the deposition of its sediments and the consequent occurrence of cross-bedding sedimentary geometry which 39 PEREIRA, S.Y., KIMMELMANN E SILVA, A. TERRÆ, 1(1):34-43, 2004 In general, the median of specific capacity obtained for this area was 0.07 m3/h/m (average flow 4.8 m3/h). In the distribution of the specific capacity values by the number of wells, a concentration of values in the interval 0.05 to 0.3 m3/h/m were observed, where approximately 108 specific capacity values were found in this first interval (0.05 m3/h/m). The influence of the fracturing that exists in this area on tubular well productivity was not noticed at first, with the median values obtained similar to the specific capacity and flow for wells located inside and outside the drainage lines (approximately 0.07 m3/h/m and 4.5 m3/h, respectively). The tubular wells that explore both the Tubarão Aquifer System and the Diabase presented the best productivity, capable of median specific capacity values (0.1 m3/h/m) as opposed to the wells that explore the Crystalline, Tubarão and Diabase Systems. Transmissivity was calculated for three mixed wells that exploit the Tubarão and Crystalline Systems and values of 0, 1.13, 2.77 and 0.71 m3/day/m were obtained. The wells that exploit more than one aquifer system/aquifer presented very distinct zones of productivity. The lower potential region was located across the crystalline emergence contact area, followed by an area of high productivity and one of intermediate values. In the region that contains the cities of Engenheiro Coelho, Artur Nogueira and Santa Bárbara dOeste, high well productivity was again present. 2. Groundwater flow recharge and discharges conditions The groundwater exploited by wells in the Metropolitan Region belongs to a flow system with local characteristics, with strong influence from the topographic variations of the terrain (relief). The outcroppings, located on the east of the area, presented terrains topographically more elevated and consequently had the highest hydraulic gradients in the area. The diverging direction of flow to the less Table 2 Groundwater availability from aquifer systems/aquifers by base flow data interpretation from mean rivers sub-basins in the Campinas Region (modified from Lopes 1994) Annual Available 3 6 3 discharge (m /s) storage (10 m ) Stream Gauge Base flow 3 2 (m /s/km ) Aquifer (% area) Aquifer area (km2) Index (%) 626150 Jaguariúna 0.0047 Crystalline (100) 230 20 0.39 12.30 4D 0001 Jaguariúna 0.0074 Diabase (15) Itararé (55) Crystalline (30) 55 203 111 20 25 20 0.01 0.21 0.05 0.31 6.60 1.60 3D 003 Atibaia 0.0100 Crystalline (100) 397 20 0.41 13.00 4D 009 Atibaia 0.0049 Cenozoic (3) Diabase (30) Itararé (42) Crystalline (25) 10 97 135 81 25 20 25 20 0.0004 0.0300 0.0700 0.0200 0.011 0.897 2.200 0.624 4D 010 Piracicaba 0.0049 Cenozoic (49) Diabase (12) Itararé (32) Crystalline (7) 388 95 253 55 25 20 25 20 0.230 0.010 0.100 0.004 7.300 0.352 3.100 0.119 62420 Capivari 0.0039 Cenozoic (17) Itararé (57) Crystalline (26) 65 218 100 25 25 20 0.01 0.12 0.02 0.338 3.800 0.636 627070 Piracicaba 0.0039 Cenozoic (57) Diabase (10) Itararé (32) Crystalline (1) 476 84 267 8 25 20 25 20 0.260 0.006 0.083 0.006 8.300 0.204 2.600 0.195 623950 Jundiaí 0.0061 Cenozoic (28) Itararé (27) Crystalline (45) 90 87 146 25 25 20 0.040 0.036 0.080 1.2 1.1 2.5 40 TERRÆ, 1(1):34-43, 2004 PEREIRA, S.Y., KIMMELMANN E SILVA, A. elevated terrain and the spaced disposition of the equipotentials, observed mainly in the south portion of this area, indicated the presence of a groundwater divisor and the recharge area of the region. In the central and northern region, some local recharge areas can be visualized through the divisors located between the Capivari and Atibaia rivers and in terrains located on the right bank of the Jaguari river. The gradual decrease of topographical altitude was followed by equipotentials, which are spaced according to terrain declivity. The recharge areas are located in the centralwest and southeast portions, in the largest rivers such as the Atibaia and the Jaguari (Salto Grande Dam and surrounding areas), the Capivari, the Quilombo river (left bank affluent of the Piracicaba river), and the Jundiaí river. Table 3 Groundwater availability by aquifer system in the Campinas Region Annual Available Storage discharge 6 3 3 (10 m /year) (m /s) Aquifer System Total area 2 (km ) Cenozoic 1,029 0.540 17.00 Diabase 331 0.056 1.77 Itararé 1,163 0.620 19.50 Crystalline 1,127 0.980 30.90 Total 3,650 2.200 69.20 Table 4 Groundwater exploitation estimates by aquifer system in the Campinas Region Aquifer System 3. Availability and consumption of groundwater resources The availability of groundwater resources was calculated according to the procedures proposed by Lopes (1994) and adapted to the study region. Table 2 shows the results of availability for the aquifer and for the sub-basins. The total available discharge found for Campinas Metropolitan Region was 2.2 m3/s, or 69.2 x 10⁶ m3/ year, where approximately 0.54 m3/s (17 million cubic meters) comes from the Cenozoic aquifer, 0.056 m3/s (1.77 million cubic meters) from the Diabase, 0.62 m3/s (19.5 million cubic meters) from Itararé and 0.98 m3/s (30.9 million cubic meters) from the Crystalline System (Table 3). The value obtained for the Cenozoic Aquifer is significant, compared with the other values; however, its thickness and its layer architecture (in relation to the other aquifer systems) and topography (in the tops of hills) qualify this aquifer as a source area (recharge) for the other aquifers. The biggest groundwater storage is contained in the Crystalline Aquifer System, followed by Itararé. The values of natural availability can be added to the losses of the treated water distribution system in urban areas, 17% (1.02 m3/s), producing a total of 3.22 m3/s (101.5 x 10⁶ m3/year) for Campinas Metropolitan Region. The estimate of groundwater consumption was based on the number of wells planned for 1994 in the region, where 70% (1,814 wells) were considered Estimated Estimated Number of wells exploitation exploitation 6 3 3 (10 m /year) (m /s) estimated Itararé 637 0.57 18.0 Crystalline 568 0.53 16.7 Diabase 86 0.06 1.8 active, at an average flow of 6.0 m3/h, taking in consideration the average pumping time according to the type of economic activity. The resulting product, 1.73 m3/s or 54.6 million cubic meters, is an estimate of the total consumption of groundwater in the study area. This consumption corresponds to a very high exploitation rate 79% of the natural active reserve, or 54% of the total reserve. The exploitation of groundwater by aquifer system is shown in Table 4. The estimate of groundwater exploration reveals a higher consumption for the Itararé Aquifer, followed by the Crystalline Aquifer. These results represent the following rates of utilization of aquifers: Itararé 92%, Crystalline 55%, Diabase 1.0%. The elevated utilization value for the Diabase Aquifer is uncertain regarding the estimated values, due to the low number of wells explored in the region, as well as the chaotic disposition of the Diabase bodies of low extension at the surface and subsurface. For the wells in the Itararé and Crystalline Systems, the values obtained for exploitation were added for the mixed wells. 41 PEREIRA, S.Y., KIMMELMANN E SILVA, A. TERRÆ, 1(1):34-43, 2004 These utilization rates indicated a high groundwater consumption level in the aquifer systems in the region, mainly in the sediments of Itararé, justified by the localization of more populated cities and the regions industrial area. However, the significant contribution of the Cenozoic deposits to the Itararé sediments were not considered. These deposits have an active reserve of 17.0 x 10⁶ m3/year; in the case where there is total contribution, the utilization rate of the Itararé aquifer is smaller and the value is reduced by half. In addition, the industrial sector is the largest groundwater consumer in the study area, with exploitation of 0.82 m3/s, followed by the public supplying (0.36 m3/s), the primary sector (0.33 m3/s) and finally by the private use and the tertiary sector (0.12 and 0.10 m3/s, respectively). The regions formed by Campinas, Valinhos, Hortolândia, Sumaré, Paulínia, Nova Odessa, followed by the cities of Santa Bárbara dOeste, Americana, Monte Mor and Indaiatuba, presented the highest levels of groundwater consumption in the study area, because they contain the industrial area of this Metropolitan Region. The secondary sector was the largest groundwater user, followed by private use; the cattle raising and agriculture sector appeared as a large consumer in the northeast portion of the area, especially Holambra, with 96% of wells used by agricultural and livestock operations. The remaining cities, such as Engenheiro Coelho, Artur Nogueira, Cosmópolis, Santo Antonio da Posse, Jaguariúna and Pedreira were characterized by low groundwater consumption, in which the main user was still the sector essentially characterized by agricultural and livestock activities. It is interesting to note that groundwater consumption by the trade sector was only relevant in Campinas, which is the leader for industrial and urban human occupation in the region and probably the commercial center of the region; it is believed that an increase in the number of groundwater consumers in this sector would occur with the profile of economic activity in the city. In the agriculture and livestock activities sector, the largest users consisted of small and large farms (fowl, cattle, pigs and horses); in Holambra, pig breeding and avicultivation, and the cultivation of flowers and ornamental plants are the most important users. In Pedreira, the main groundwater user was mining activity (mainly ceramics). In the most industrialized area, in the central and western portion of the metropolitan region, the textile industry, chemical/petrochemical, electronics, metallurgical, civil and food, among others, were the largest users. Most of the industries in the region use water from sources other than the public system, using groundwater or neighboring drainage resources. The private users were characterized by people that use the groundwater for domestic supply of water; condominiums, vacation homes, and residences that generally do not use the public water supply system. The users from the trade sector are commerce (stores, gas stations, restaurants, clubs, hotels/motels, etc.). The public supply is the municipal services (SEMAE, SAEE, SAMAE and SABESP) that exploit the groundwater for supplying communities that do not have public distribution system. Final considerations and discussion The evaluation studies of the availability of water or groundwater resources had problems regarding the lack of dependable and updated data. The dispersion and access to the information also reflected lack of organization, and indirectly the absence of control and management of this resource can be observed. As far as the data is concerned, there is a history of lack of investment regarding basic data and its updating. The absence of systematic hydrogeological databases (for this study in particular) interfered in essential studies for the elaboration of public policies, as well as decisions that are necessary for the economic development of the region. The existent information about groundwater in São Paulo State is the product of favorable political moments, such as the studies for groundwater developed by DAEE at the end of the 70s and beginning of the 80s, and the initiative and effort of a few individuals and academic institutions. The most dependable well databases are 6 years old in the study region. The remaining areas were normalized by a real record procedure from some cities. An update of the data for the year 2000 considers the average growth rate for wells at 20% per year (since 1996), and the current population of 2,151,543 inhabitants (FUNDAÇÃO SEADE 2000). The loss of water from the system (17%) would have an increase of 1.27 m3/s (or 0.4 x 10⁸ m3/year), and the availability would have an increase 42 TERRÆ, 1(1):34-43, 2004 PEREIRA, S.Y., KIMMELMANN E SILVA, A. of 3.47 m 3/s (or 11 x 10 7 m 3/year). However, groundwater consumption becomes 2.49 m3/s or 7.8 x 10⁷ m3/year, with an exploitation rate of 72%. Therefore the groundwater consumption could reach the annual storage in less than 5 years, if the rates of growth, the number of wells and the population are considered. This proportion is not distributed homogeneously throughout the whole region. There are cities with intense exploitation, such as Holambra, where the water is mostly used for agricultural and livestock activities. In some areas such as the outskirts of Americana on the Atibaia river bank, there is alarming dewatering of the potentiometric level in high density locations in which tubular wells exist. On the other hand, there are cities such as Cosmópolis, with low number of existing wells and therefore with local reserves that havent been exploited. Even with the limitation exposed above for the availability calculations and consumption estimates, it is possible to determine that the situation in the Campinas Metropolitan region is serious, mainly in the most urbanized and industrialized cities, with intense agricultural and livestock activities. The region is within the Piracicaba River Basin and has a lot of restrictions regarding the availability of superficial water resources. Keeping this scenario in mind regarding the limited availability of water resources, it will be necessary to optimize use, and all parties involved (i.e. public institutions, private and civil society) will be obligated to participate in the integrated management of these resources. Acknowledgments Thanks are extended to the Geological Institute, Environmental Secretariat of São Paulo State, especially to the Head of Hydrogeology Office, Geologist Geraldo Hideo Oda. Thanks to Geologist Élcio Linhares Silveira from the Department of Water and Electric Power (DAEE). References DAEE. 1981. Estudo de Águas Subterrâneas, Região Administrativa 5 (Campinas), SP. São Paulo: Departamento de Águas e Energia Elétrica (DAEE). 2v. EMPLASA. 1993. Cenário regional, Região de Campinas, Área de Metropolização Aspectos Físico-Ambientais e Sociais. Technical report. EMPLASA, v1. 199 p. IG-SMA. 1993. Subsídios do meio físico-geológico ao planejamento do município de Campinas (SP). Technical report. Instituto Geológico (IG-SMA), 2v. IG-SMA. 1995. Subsídios para o planejamento regional e urbano do meio físico na porção média da Bacia do rio Piracicaba, SP. Technical report. Instituto Geológico (IG-SMA), 2v. Lopes, M.F.C. 1994. Condições de ocorrência de água subterrânea nas bacias dos rios Piracicaba e Capivari. MSc dissertation. Campinas: Fac. Engenharia Civil, UNICAMP. 83 p. Yoshinaga-Pereira, S. 1996. Proposta de representação cartográfica na avaliação hidrogeológica para o estudo de planejamento e meio ambiente, exemplo da Região Metropolitana de Campinas, SP. PhD thesis. São Paulo: Instituto de Geociências, Universidade de São Paulo (USP). 190 p. Submitted in November 2002 Accepted in January 2003 CEPETRO CEPETRO CENTER FOR PETROLEUM STUDIES UNICAMP Education and research on Petroleum Science. Visit our website: theses, dissertations and other publications since 1988 w w w. c e p e t r o . u n i c a m p . b r 43
Download
