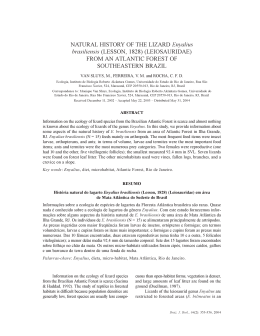
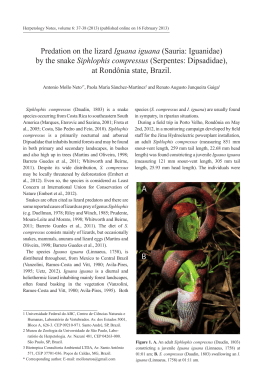
Comparative Biochemistry and Physiology Part A 127 (2000) 71 – 80
www.elsevier.com/locate/cbpa
How does the European common lizard, Lacerta 6i6ipara,
survive the cold of winter?
Claude J. Grenot a,*, Laurence Garcin a, Jérôme Dao a, Jean-Pierre Hérold b,
Bernard Fahys c, Huguette Tséré-Pagès a
a
Laboratoire d’Ecologie, C.N.R.S. UMR 7625, Ecole Normale Supérieure, F-75005 Paris, France
Laboratoire d’Ecophysiologie Animale, Faculté des Sciences, Uni6ersité de Franche-Comté, F-25030 Besançon, France
c
Laboratoire d’Electrochimie des Solides, Faculté des Sciences, Uni6ersité de Franche-Comté, F-25030 Besançon, France
b
Received 16 March 1999; received in revised form 5 June 2000; accepted 8 June 2000
Abstract
Although the European common lizard, Lacerta 6i6ipara, is among the most common Eurasian reptile species, we
know little about how these lizards cope with very low temperatures. In this study we examined microenvironmental
conditions, body temperature, behavior, and cold strategies to see whether strategies of freezing and supercooling, while
normally considered to be mutually exclusive, may in fact be adopted simultaneously by the common lizard. Following
up on an earlier study of a lowland population, this time we used a mountain population (850 m) to discover differences
in overwintering strategies between the two populations. Differential scanning calorimetry conducted during the
hibernation period (vs. the activity period) showed that the blood of highland lizards had an increased ability to resist
ice formation, confirming an ecophysiological effect most likely mediated by physical properties of the blood. Mean
blood glucose level of unfrozen L. 6i6ipara in the field increased significantly (about fourfold) from 8.5 9 0.7 mmol l − 1
in September to 33.2 95.6 mmol l − 1 in March. The blood glucose level then experienced a significant decline as it fell
to 6.290.8 mmol l − 1 after hibernation in April. Glucose, in conclusion, seems to play a role of cryoprotectant rather
than antifreeze. © 2000 Published by Elsevier Science Inc.
Keywords: Lacerta 6i6ipara; Hibernation; Hibernaculum; Water balance; Differential scanning calorimetry; Cold tolerance; Supercooling; Blood glucose level
1. Introduction
Most studies on the cold tolerance of ectotherm
vertebrates, amphibians and reptiles have been
carried out in laboratories (Bauwens, 1981;
Bidault, 1982; Claussen et al., 1990; Churchill and
Storey, 1991; Costanzo et al., 1995; Costanzo and
Lee, 1995; Gregory, 1982; Halpern, 1979). Rela* Corresponding author. Tel.: + 33-1-44323702; fax: +331-44323885.
E-mail address: [email protected] (C.J. Grenot).
tively little is known, however, about the physiology of the european common lizard Lacerta
6i6ipara, which is surprising in view of its relative
abundance (Bauwens, 1981; Costanzo et al., 1995;
Grenot et al., 1996; Grenot and Heulin, 1988,
1990; Grenot et al., 1987; Patterson, and Davies,
1978; Van Damme et al., 1987).
L. 6i6ipara is an adaptable species inhabiting a
wide range of habitats and probably has the
largest geographical range of all lizards. Its presence extends from the mountains of northwest
Spain to Sakhalin on the Pacific coast and from
1095-6433/00/$ - see front matter © 2000 Published by Elsevier Science Inc.
PII: S 1 0 9 5 - 6 4 3 3 ( 0 0 ) 0 0 2 3 6 - 1
72
C.J. Grenot et al. / Comparati6e Biochemistry and Physiology, Part A 127 (2000) 71–80
the north of Spain beyond the Arctic Circle.
Moreover, it is found in a wide range of humid
habitats including meadows, peatbogs, and heathlands from sea level to 3000 m.
This small lacertid lizard has an adult body
mass (BM) of 3–4 g, reaching 6 g in gravid
females. The size of the lizard allows us to distinguish between three age classes (Grenot et al.,
1987; Van Damme et al. 1987). In this long-term
study of a highland population in the Jura Mountains, northeastern France, we investigated the
cold tolerance of L. 6i6ipara in outdoor enclosures. We contrast our results with those from an
earlier study of a lowland population in Brittany,
western France (Heulin, 1985; Grenot et al., 1987;
Grenot and Heulin, 1988).
In the previous lowland study, we discovered
overwintering hibernacula sites of L. 6i6para in a
peatbog using 22Na marked animals and calculated the lizards’ winter energy budget (Grenot
and Heulin, 1988). The lizards were generally
found under 2–4 cm of mossy or grassy litter,
often in the middle of a large grass clump or a
small mammal burrow (Bauwens, 1981; Grenot
and Heulin, 1988; Grenot et al., 1996). Observing
that the dormant lizards were unfrozen, we speculated that L. 6i6ipara survives natural exposure to
subfreezing temperature by supercooling. During
hibernation, from November to February, the
animals’ level of 22Na remained stable, suggesting
that they were not feeding and that their body
mass remained constant.
We also showed (using tritiated water) that the
lowland lizards had among the highest water flux
rates (WFR, more than 200 ml kg − 1 d − 1 in
summer) recorded for a terrestrial lizard, which
might be expected in an animal inhabiting humid
habitats. All ages and sexes showed decreased
water fluxes in autumn (100 ml kg − 1 d − 1). The
apparent WFR was 27 ml kg − 1 d − 1 during the
cold season, about 5 – 10 times less than the values
observed between June and September (Grenot et
al., 1996).
To continue and extend our earlier study, this
time we studied a highland population in the Jura
Mountains, looking at microenvironmental conditions in overwintering sites, behavior, thermal relationships, fluctuation of blood glucose and
differential scanning calorimetry (DSC) of the
blood. We expected that extreme mountain conditions would be stressful and that the lizards would
require specific physiological adaptation to survive overwintering.
2. Study area
The highland population was located in Bonnevaux (Doubs) at the Biological Station of
Franche-Comté University at an altitude of 850 m
(Pernot-Visentin, 1978), and where winters are
very severe. The average maximum and minimum
annual temperatures at the site were 12.5 and
2.5°C, respectively, and the mean annual precipitation was between 1500 and 2000 mm (PernotVisentin, 1978; Bidault, 1982). Snowfall normally
occurs between December and March and with a
snowdepth of up to 1 m, creating a perfect location to study the cold-hardiness strategies of
lizards. The Frasne-Bonnevaux peatbog is characterized by Sphagnum, Carex, moss litter, and
other plants (Grenot et al., 1996).
3. Material and methods
The experiments were conducted in two outdoor enclosures of about 30 m2 built at locations
where we observed the L. 6i6ipara during the
prehibernation period. The enclosures were of
sheet aluminum 1 m high, buried 10 cm in the
earth, and contained undisturbed peat bog substrate. In each case approximately 20 lizards were
placed in each enclosure, supplementing the number originally found there. Because the experiments were conducted at the end of the warm
weather season, lizard activity was greatly reduced
and no interactions among individuals were
observed.
The enclosures and sampling regime closely resembled those in the earlier study, however this
time we sampled more frequently than in the
earlier work. In the present experiments, we sampled the lizards once or twice a week until we
were sure they were hibernating, after which we
sampled them three times weekly until April (cf.
Grenot and Heulin, 1988).
We recorded temperature and relative humidity
(RH) at 30 cm height at 30 min intervals with a
mechanical thermohygrometer. We simultaneously observed the temperature and the RH of
microclimates using a datalogger ELPRO (Hot
Dog) equipped with a small external probe for
temperature and RH measurements. The sensor
probe, which is the size of a pen, was buried in the
soil in one of the enclosures.
C.J. Grenot et al. / Comparati6e Biochemistry and Physiology, Part A 127 (2000) 71–80
Each of the L. 6i6ipara captured was weighed,
measured, and toe-clipped. A blood sample (5 – 10
ml) was taken from the infraorbital sinus. We
collected reference blood samples from several L.
6i6ipara in September within 3 min of their first
capture. After the initial sampling, additional
monthly blood samples were collected in the same
way from animals in the enclosures. Blood glucose concentrations were measured using blood
glucose test strips (Glucotide) with a Glucometer
4 (Bayer/Ames). The test reaction is based on the
hexokinase method using dry reagent technology
and provides a quantitative measurement of glucose in blood and plasma (0.5 – 33.3 mmol l − 1
with an accuracy of 90.2 mmol l − 1).
In the two enclosures, we studied 18 adult and
20 juvenile lizards, recording their body temperatures and the temperature of their microclimates
during and shortly after hibernation. We used a
datalogger with five thermocouple inputs and
recorded observations continuously throughout
the experiment. One probe was buried at the
surface of the moss while others were located at
depths of 10–20 cm, against the skin underneath
the abdomen in overwintering bogsites of L.
6i6ipara (Grenot et al., 1996). Temperatures were
recorded at 30 min intervals. The lizards may
have been disturbed by sampling at the outset of
the hibernation period because they sometimes
moved slightly when sampled. However, during
very cold periods the majority of lizards did not
move. We took care at every observation to avoid
disturbing the lizards and their hibernacula.
3.1. Differential scanning calorimetry
Differential scanning calorimetry (DSC) is
based on heating (or cooling) a sample and a
reference at a pre-set rate, while keeping their
temperatures the same, and measuring the compensating heat flux that keeps the temperature of
the sample within the limit of a predetermined
program. Experimental DSC curves show heat
flux (in mJ s − 1) or the specific heat capacity Cp
(in J g − 1 K − 1) against temperature (or in isothermal experiments, against time). These temperature
measurements are then used to correct the compensating heat flux, which is directly proportional
to the change in the internal energy (enthalpy) of
the specimen. We used DSC to measure first the
equilibrium freezing point and then the crystallization temperature of each lizard’s blood (Block,
73
1994). Thermal analysis was used to measure the
heat flow between a sample and a reference pan.
This variation in enthalpy indicates the change in
state of the sample when it is subjected to crystallization or melting.
We used a Mettler DSC-30 calorimeter with a
calibrated scale and a pan containing indium.
Each sample was successively frozen at a speed of
− 1°C min − 1, then defrosted at + 1°C min − 1.
Standard aluminum pans of 40 ml were used, with
2–5 ml of blood in the sample pan. The rough
values given by the calorimeter were processed by
a computer program supplying an analytical thermal curve that identified the freezing temperature
(Tsol) and the melting point (Tfus) for each freezing
or heating test. Freezing temperature was defined
as the beginning of the exothermic peak of crystallization as temperature decreased, corresponding to the spontaneous conversion of a liquid
phase to a solid phase. The melting point, or
equilibrium freezing point (Tfus), was defined as
the maximum of the endothermic curve of melting
ice as the temperature increased. According to the
manufacturer, the instrument obtains these readings with 4% precision and 1% reproducibility.
Because liquids may be supercooled below their
freezing temperatures, a thermodynamically stable
phase may not be achieved on account of the
kinetic stabilization that occurs in the absence of
nucleation centers. The body fluid osmolality then
corresponds to the equilibrium freezing point, a
thermodynamic parameter. Undercooling capacity, which indicates the capacity of blood to remain liquid below the equilibrium freezing point
(Tfus), is calculated from the difference between
the melting point (Tfus) in equilibrium and the
freezing temperature (Tsol).
Lizard blood was sampled from November–
January (hibernating period) and from May–June
(activity period). Animals were collected in the
enclosure and kept in the laboratory, in an
isothermal box with bog, moss and herbs, for less
than 24 h before each DSC sampling. Blood was
taken from the orbital sinus with a microcapillary
treated with heparin and introduced into the
calorimeter in B 15 min after sampling. We verified that the presence of anticoagulant did not
interfere with the characteristics of the blood as
reference Ringer’s solution, with and without heparin, showed the same crystallization temperature.
We used unpaired Student’s t-test for all statistical comparisons. Each result is shown as a mean
74
C.J. Grenot et al. / Comparati6e Biochemistry and Physiology, Part A 127 (2000) 71–80
Fig. 1. Temperature and relative humidity (datalogger Hot Dog) inside an hibernaculum (bog) of L. 6i6ipara, at the beginning of March:
(a) during a sunny day, minimal air temperature at 30 cm above the ground −11°C; (b) during a cloudy day, minimal air temperature
at 30 cm above the ground −4°C.
value with a standard deviation. The number of
individuals (n) used for the calculation of each
mean is given in brackets.
4. Results
The hibernacula of the highland population in
the Jura Mountains were much deeper below the
ground than those of the lowland population
(Grenot et al., 1996). In January and February,
mean daily temperatures at the overwintering sites
and at the soil surface were identical, near 0°C.
However, thermal fluctuations at the soil surface
were more prominent than at depth (9 and 0.9°C,
respectively). The thermocouples were protected
in winter by the snow pack, and thermal fluctuations were accordingly lower than those registered
30 cm above ground. The overwintering sites were
covered by 10 cm of bog and often by several
centimeters of snow (up to a maximum depth of
40 cm in mid-February), which are both absorbent substrates. These substrates displayed stable temperatures (about 0°C), which helped keep
the RH constant (near the water saturation point)
(Fig. 1a). However, temperature variations between −1 and − 4°C were observed in the hibernacula during the cold periods when the snow
cover was thin and the air temperature low
( B −10°C) (Fig. 1b). Beginning in March, the
temperature at the overwintering sites increased at
the same rate as the air temperature. Mean daily
temperature in April increased from + 1.5°C in
March to + 6°C.
During the experiments, thermal differences increased but stayed lower than those at the soil
surface. The ground (bog) acted as a ‘buffer’ by
keeping temperatures lower during the daytime
and warmer at night than those temperatures
observed at the soil surface. Given weather conditions such as those that occurred in April, daily
thermal differences occasionally climbed as high
as 40°C at the surface of dry grass (Molinia
coerulea) (Fig. 2).
4.1. Freeze tolerance
We used the following criteria to determine
whether a lizard was frozen. The general aspect of
the animal: frozen animals became hard, their
skin color was dark instead of brown and they
assumed a characteristic rolled-up position with
the snout against the vent. The consistency of the
Fig. 2. Temperature and relative humidity (datalogger Hot
Dog) near the surface of a tuff of dry Graminea, Molinia
coerulea in a peatbog at Bonnevaux (Jura Mountains 850 m).
C.J. Grenot et al. / Comparati6e Biochemistry and Physiology, Part A 127 (2000) 71–80
75
Fig. 3. A frozen and isolated L. 6i6ipara (male adult) near the peatbog of Bonnevaux-Frasne in January: (a) in situ, after removing a
tuff of moss with bog of about 15 cm deep; dorsal view, the skin is black; (b) ventral view, with layer of ice crystals (the animal seems
dead); (c) the lizard just after its thaw, moves very slowly with uncoordinated movements.
body: frozen animals became as hard as ice and
were often covered with ice crystals.
Of 15 lizards found in January in the enclosure,
three (one juvenile and two adults) were discov-
ered frozen in their overwintering sites. We
learned that lizards that froze during the night
often began to thaw the next afternoon and that
the state of freezing therefore rarely exceeded 48 h
76
C.J. Grenot et al. / Comparati6e Biochemistry and Physiology, Part A 127 (2000) 71–80
Fig. 4. Ventral temperatures of L. 6i6ipara recorded in three different overwintering sites, and air temperature at the surface of the soil,
at Bonnevaux (Jura Mountains, 850 m).
(Fig. 3). At least several frozen lizards were observed alive a week later.
Some individuals (e.g. male number 3) did not
seem to freeze even though they were in contact
with snow crystals. We thus saw two contrasting
strategies, freezing and supercooling, occurring at
the same temperatures, most often between −0.5
and − 4.0°C (Fig. 4).
We observed only rarely a single individual
using both strategies in the same winter. Female
number 20 nevertheless did so. She stayed supercooled in January and February when the temperature of the overwintering site stayed at about
− 4°C, and was then frozen in March when the
temperature of the hibernaculum varied between
− 1.2 and −1.5°C.
Variations in the temperature and the RH at an
overwintering site often depended on weather
conditions in the same period (beginning of
March, Fig. 1). On one sunny day (March 5)
when the minimum ambient temperature was
−11°C, the hibernaculum temperature rose from
−2.9°C to −0.1°C (between 7:00 h and 13:00 h),
an increase of almost 3°C in 5 h. Two days later,
even though the minimum ambient temperature
was − 4°C and the weather cloudy, the thermal
range of the hibernaculum was almost constant
from −0.1 to −0.5°C.
We also followed temperature and RH of the
hibernacula during the emergence of the lizards
from hibernation, which normally occurs at the
end of March (between the 18th and 25th). The
determining factor for emergence seemed to be a
period of sunshine in early spring that warmed the
soil in depth. For example, female lizard (number
15) left her hibernaculum on March 23 (Fig. 5).
At that time, the temperature of the ground deepened to the level of the overwintering sites. Beginning on 19 March, the daily maximum
temperature began to cycle between + 2°C
(March 19) and + 8°C (March 23), the latter
corresponding to the date when the first lizard
emerged. During this time, the RH did not vary
much and stayed above 95%.
Mean cloacal temperatures of active lizards in
the field were 32°C in April, and the time range
of surface activity was from 07:00 h to 17:00 h
Fig. 5. Temperature and relative humidity (Hot Dog) inside an
hibernaculum (bog) of Lacerta 6i6ipara, during a period of
sunny days. The female number 15 placed in its hibernaculum
went out, on March 23 (the maximal temperature of the bog
was +8°C).
C.J. Grenot et al. / Comparati6e Biochemistry and Physiology, Part A 127 (2000) 71–80
77
Table 1
Comparison among physical parameters of the blood of Lacerta 6i6ipara between two periods of the life cycle (n = 7)a
December–March May–October
Freezing temperature
Tsol (°C)
Equilibrium freezing
point Tfus (°C)
Supercooling capacity
(°C)
a
Fig. 6. Mean daily cloacal temperatures (n= 7), during three
consecutive sunny days in April 19, 20 and 21; after emergence
from the bog (Jura Mountains, 850 m).
(Fig. 6). Some of the animals enclosed in the
frozen bog and cooled to about −2°C froze when
they came in contact with ice crystals. Most of the
lizards tolerated sub-zero temperatures (B −
2°C) by maintaining a state of supercooling for
several days. In another study Costanzo et al.
(1995) observed supercooling lasting more than 21
days at − 3.5°C. When they were uncovered in
December (with a daylight temperature of 1.5 –
2.0°C), their eyes were closed but they were able
to make uncoordinated movements and could dig
into the peat.
4.2. Differential scanning calorimetry (DSC)
DSC measurements on total blood of L.
6i6ipara did not show significant differences between males and females (Table 1). The mean
freezing onset Tsol (kinetic parameter) was lower
during the overwintering period than during the
lizards’ period of activity. The mean melt or
equilibrium freezing point onset (Tfus) (thermodynamic parameter) was also lower during the overwintering period than during the period of
activity. The supercooling capacities (Tfus −Tsol)
were quite different (T =2.3°C) between the two
periods and were higher during the overwintering
period (Table 1).
−12.790.2
−8.190.2
−3.890.2
−1.59 0.2
8.9
6.6
Relevant test T: PB0.005.
blood glucose level of frozen lizards was as high
as that in unfrozen lizards. The maximum value
found in an unfrozen lizard in January was 37.9
mmol l − 1. The blood glucose level for one of the
frozen L. 6i6ipara was 32.8 mmol l − 1 the same
month. In this case, the blood sample was collected when the lizard was thawed before a new
daily freeze–thaw cycle.
We felt that hyperglycemia that we observed
was not a stress response to frequent handling
because blood was taken at most once a month in
the enclosures. Moreover, blood glucose levels
indicated considerable individual heterogeneity. In
the field, a few weeks before hibernation in October, for example two adults of 3.6 and 2.5 g,
respectively measured 5.8 and 28.6 mmol l − 1.
Later, during hibernation in January, two adults
of the same BM measured 13.8 and 37.9 mmol
l − 1. Blood glucose levels did not differ between
adults and juveniles nor between sexes.
The maximum and minimum glucose values of
L. 6i6ipara were 50.1 mmol l − 1 in March and 4.5
mmol l − 1 in September. After hibernation in
April, blood glucose levels were characterized by
4.3. Blood glucose
The mean blood glucose level of L. 6i6ipara
held in our enclosures increased significantly from
September to March, from 8.5 9 0.7 to 33.2 95.6
mmol l − 1 (P\ 0.001) (Fig. 7). During winter, the
Fig. 7. Seasonal field blood glucose level in a highland population (Jura Mountains, 850 m) of unfrozen L. 6i6ipara (n),
9 S.E.M.
C.J. Grenot et al. / Comparati6e Biochemistry and Physiology, Part A 127 (2000) 71–80
78
a drop in the mean blood glucose level of 11
mmol l − 1 (P\0.001), the level was close to the
value observed in September.
5. Discussion
In the past, winter dormancy in reptiles was
considered simply a cold-induced torpor resulting
from the animal’s inability to maintain a high
body temperature at low ambient temperatures.
Today we realize that dormancy may be accompanied by important changes in body composition
comparable, but not identical to, those observed
in hibernating mammals (Gregory, 1982).
Weigmann (1929) showed that the wall lizard,
Podarcis muralis, avoids freezing during winter.
Some individuals of an isolated population of P.
muralis in Ohio could tolerate brief freezing
episodes of 10–120 min with body temperatures
from −0.6 to − 1.0°C (Claussen et al., 1990)
(Table 2). Today we also know that many animals
with reduced freezing points in winter create antifreeze substances which prevent the growth of
deleterious ice crystals within their bodies (Grenot
and Heulin, 1990).
The values for the freezing points we obtained
in these experiments are significantly lower than
those measured for amphibians, for example such
temperatures for frogs range from −0.5 to
− 1.5°C (Hérold et al., 1994; Somme, 1995).
Laboratory studies by Costanzo et al. (1995)
showed the importance of hyperglycemia to sur-
vival of frozen lizards. In the present study, the
two-to-fivefold higher levels of blood glucose in
both frozen and unfrozen L. 6i6ipara indicate that
this species uses glucose both during supercooling
and during freezing. Elevated glucose levels persist long after thawing and begin before freezing.
This persistence may reflect a much stronger
freeze-induced elevation of intracellular glucose
levels. The cryoprotective system of L. 6i6ipara
seems to be very different from that of Rana
syl6atica (Storey and Storey, 1986), which rapidly
increases its glucose level to more than 300 mmol
l − 1 at the beginning of freezing.
Supercooling and freeze tolerance were formerly considered alternate strategies for coping
with subzero temperatures (Costanzo and Lee,
1995). Our study suggests that L. 6i6ipara has
developed a capacity for both supercooling and
freeze tolerance. We were lucky to observe, on
March 4, three lizards located next to each other
under the same mound of bog: the first frozen, the
second supercooled, and a third which was half
and half. The posterior part of its body was
frozen, whereas the anterior part was unfrozen
with the head driven into the bog. The two strategies of freezing and supercooling were thus encountered in the same microclimate. Moreover
these observations suggest that the strategy used
by an animal depends above all on its physiological capability. Our results also suggest that further
study should be directed to discovering additional
antifreezes or absence of ice nucleators to expand
our knowledge of freeze avoidance strategies.
Table 2
Cold tolerance of some species of ecthoterm vertebrates
Species
Chrysemys picta juveniles
Chrysemys picta
Terrapene carolina
Sceloporus jarro6i
Lacerta 6i6ipara
Thamnophis sirtalis
Thamnophis sirtalis
Rana syl6atica
Rana syl6atica
Hyla 6ersicolor
a
Supercooling capacity
Freeze tolerance
Abdominal temperature (°C)
Duration
Abdominal temperature (°C)
Duration
−12.0 (1)a
about 12 days
−4.0 (2)
−2.5 (3)
−0.83 to −3.60 (4)
\24 h
3 days
72 h
−3.0 (5)
−3.5 (6)
about 30 h
]21 days
B−3.0
−0.75 to −1.20 (7)
−2.5 (8)
−2.5 to −3.0 (3)
−1.5 (9)
−2.5 (10)
\3 days
48 h
3 to 5 h
3 to 13 days
\11 days
13 days
(1) Packard and Packard, 1993; (2) Storey et al., 1988; (3) Storey and Storey, 1986; (4) Costanzo and Claussen, 1990; (5) Halpern,
1979; (6) Costanzo et al., 1995; (7) Costanzo and Claussen and Lee, 1988; (8) Churchill and Storey, 1991; (9) Laynes et al., 1998; (10)
Storey and Storey, 1985.
C.J. Grenot et al. / Comparati6e Biochemistry and Physiology, Part A 127 (2000) 71–80
One of the most striking characteristics of overwintering lizards during cold-hardiness is their
capacity to accumulate a high concentration of
glucose. Our data for L. 6i6ipara, which represent
the longest record of supercooling for any vertebrate, suggest that they can maintain a body
temperature of − 3.5°C for at least 3 weeks
(Table 2). However, it does not mean that lizards
remained supercooled throughout the whole
winter.
Acknowledgements
We are particularly grateful to the staff of the
C.P.I.E. at Bonnevaux Station (Haut-Doubs) for
providing us with a welcoming environment, and
to F. Sottile for valuable assistance. We wish to
thank Dr Jerry Freilich for comments and for
improving our manuscript. The authors also wish
to thank the reviewers for constructive and helpful criticism. Studies performed here were not
supported by any grant from our laboratory
(C.G.).
References
Bauwens, D., 1981. Survivorship during hibernation in
the European common lizard Lacerta 6i6ipara.
Copeia 3, 741–744.
Bidault, M., 1982. Les zones humides du secteur
Frasne-Bonnevaux Doubs. Bull. Ecol. 13 (2), 241–
263.
Block, W., 1994. Differential scanning calorimetry in
ecophysiological research. Acta Oecol. 15, 13–22.
Churchill, T.A., Storey, K.B., 1991. Metabolic responses to freezing by garter snakes. Cryo-Lett. 12,
359–366.
Claussen, D.L., Townley, M.D., Bausch, R.G., 1990.
Supercooling and freeze tolerance in the European
wall lizard, Podarcis muralis, with a revisional history of the discovery of freeze tolerance in vertebrates. J. Comp. Physiol. B 160, 137–142.
Costanzo, J.P., Claussen, D.L., 1990. Natural freeze
tolerance in the terrestrial turtles, Terrapene carolina. J. Exp. Zool. 254, 228–232.
Costanzo, J.P., Claussen, D.L., Lee, R.E., 1988. Natural freeze tolerance in a reptile. Cryo-Lett. 9, 380–
385.
Costanzo, J.P., Grenot, C., Lee, R.E., 1995. Supercooling and freeze tolerance promote winter survival of
the European common Lizard, Lacerta 6i6ipara. J.
Comp. Physiol. B 165, 238–244.
79
Costanzo, J.P., Lee, R.E. (1995). Supercooling and ice
nucleation in vertebrates ectotherms. In: Lee, R.E.,
Warren, G.J., Gusta, L.V. (Eds.), Biological Ice
Nucleation and Applications. Am. Phytopathol.
Soc. Press, Minnesota, chapter 12.
Gregory, P.T. (1982). Reptilian hibernation. In: Gans
C., Pough, F.H. (Eds.), Biology of the Reptilia, vol.
13. Academic Press, New York, pp. 53 – 154.
Grenot, C., Heulin, B., 1990. Sur la plasticité écophysiologique du lézard vivipare, Lacerta 6i6ipara (Reptilia, Lacertidae). Bull. Soc. Herp. Fr. 54, 190 – 204.
Grenot, C., Garcin, L., Tséré-Pagès, H. (1996). Coldhardiness and behavior of the European Common
Lizard, Lacerta 6i6ipara, from French populations
during the winter. In: Geiser, F., Hulbert, A.J.,
Nicol, S.C. (Eds.), Adaptations to the Cold: Tenth
International Hibernation Symposium. University
of New England Press, Armidale, pp. 115 – 121.
Grenot, C., Heulin, B., 1988. Emploi de radioisotopes
pour la localisation de Lacerta 6i6ipara et l’étude de
son métabolisme au cours de l’hivernage. C.R.
Acad. Sci. Paris. Ser. III 307, 305 – 310.
Grenot, C., Heulin, B., Pilorge, T., Khodadoost, M.,
Ortega, A., Mou, Y.P., 1987. Water budget in some
populations of the European common lizard, Lacerta 6i6ipara Jacquin. Funct. Ecol. 1, 131 – 138.
Halpern, E.A., 1979. Supercooling in the iguanid lizard
Sceloporus jarro6i. Physiol. Zool. 52, 190 – 204.
Hérold, J-P., Dao, J., Grenot, C., Fahys, B., 1994.
Variations altitudinales du point de congélation du
sang et du plasma chez la grenouille rousse (Rana
temporaria L.). Bull. Soc. Herp. Fr. 71 – 72, 33 – 37.
Heulin, B., 1985. Démographie d’une population de
Lacerta 6i6ipara de basse altitude. Acta Oecol.
Oecol. Gener. 6, 261 – 280.
Laynes, J.R., Costanzo, J.P., Lee, R.E., 1998. Freeze
duration influences postfreeze survival in the frog
Rana syl6atica. J. Exp. Zool. 280, 197 – 201.
Packard, G.C., Packard, M.J., 1993. Hatchling painted
turtles (Chrysemys picta) survive exposure to subzero temperatures during hibernation by avoiding
freezing. J. Comp. Physiol. B 163, 147 – 152.
Patterson, J.W., Davies, P.M.C., 1978. Energy expenditure and metabolic adaptation during winter dormancy in the lizard Lacerta 6i6ipara Jacquin. J.
Thermal. Biol. 3, 183 – 186.
Pernot-Visentin, O., 1978. Climatologie et microclimatologie de quelques biotopes caractéristiques de la
région de Bonnevaux-Frasne-Bouverans. Publication du CUER 2, 67 – 107.
Somme, L. (1995). Invertebrates in hot and cold environments? Adaptations of Desert Organisms.
Springer.
Storey, K.B., Storey, J.M., 1985. Adaptation of
metabolism for freeze tolerance in the gray tree
frog, Hyla 6ersicolor. Can. J. Zool. 63, 49 – 54.
80
C.J. Grenot et al. / Comparati6e Biochemistry and Physiology, Part A 127 (2000) 71–80
Storey, K.B., Storey, J.M., 1986. Freeze tolerant frogs:
cryoprotectant and tissue metabolism during freeze/
thaw cycles. Can. J. Zool. 64, 49–56.
Storey, K.B., Storey, J.M., Brooks, S.P.J., Churchill,
T.A., Brooks, R.J., 1988. Hatchling turtles survive
freezing during winter hibernation. Proc. Natl.
Acad. Sci. USA 85, 8350–8354.
.
Van Damme, R., Bauwens, D., Verheyen, R.F., 1987.
Thermoregulatory responses to environmental seasonality by the lizard Lacerta 6i6ipara. Herpetologica 43, 405 – 415.
Weigmann, R., 1929. Die Wirkung starker Abkühlung
auf Amphibien und Reptilien. Z. Wiss. Zool. 134,
641 – 692.
Baixar