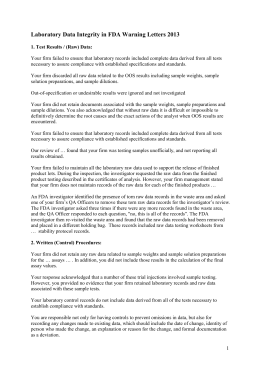
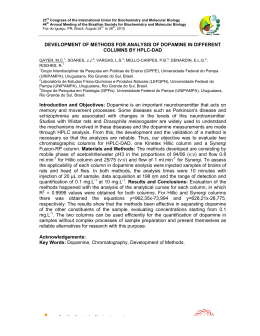
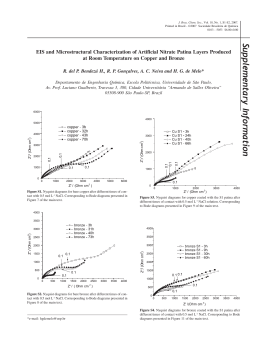
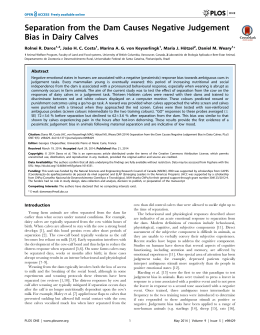
Anal. Chem. 2010, 82, 1162–1165 Electrochemical Detection in a Paper-Based Separation Device Rafaela Fernanda Carvalhal,†,‡ Marta Simão Kfouri,§ Maria Helena de Oliveira Piazetta,§ Angelo Luiz Gobbi,§ and Lauro Tatsuo Kubota*,†,‡ Analytical Chemistry Department, Institute of Chemistry State University of Campinas-UNICAMP, SP, P.O. Box 6154, Campinas, Brazil, Instituto Nacional de Ciência e Tecnologia de Bioanalítica, Institute of Chemistry State University of Campinas - UNICAMP, Campinas, SP, P.O. Box 6154, Brazil, and Microfabrication Laboratory, National Synchrotron Light Laboratory-LNLS, SP, P.O. Box 6192, Campinas, Brazil Prototypes of microfluidic paper-based separation devices with amperometric detection were developed and evaluated. Photolithography was used to make a gold electrochemical microcell on polyester and that microcell was coupled to a strip of paper where a chromatographic separation occurs. The device performance was demonstrated with the separation and quantification of uric and ascorbic acid in mixtures. The method provides an analytical alternative for the determination of compounds where low cost and simplicity are essential. A number of rapid, simple, and inexpensive testing devices, such as paper-based indicators, dipstick test assays, and even paper chromatography, were introduced between the 17th and 19th centuries.1-6 Most of these techniques are still in use due to their intrinsic attribute of performing reliable on-site analysis. Paper-based assays have long used for a variety of simple diagnostic tests, and more recently, paper has been patterned into channels using photoresist, polydimethylsiloxane (PDMS), or wax, creating microfluidic devices for multiple bioassays.7-11 A remarkable paper by Whitesides’ group described a method for quantifying multiple analytes using a patterned paper coupled with digital * Corresponding author. Tel: (+55) 19 35213127. E-mail address: kubota@ iqm.unicamp.br. † Analytical Chemistry Department, Institute of Chemistry State University of Campinas-UNICAMP. ‡ Instituto Nacional de Ciência e Tecnologia de Bioanalı́tica, Institute of Chemistry State University of Campinas-UNICAMP. § National Synchrotron Light Laboratory-LNLS. (1) Boyle, R. Experiments Upon Colors. In Indicators; Bishop, E., Ed.; Pergamon Press: Oxford, 1972. (2) Stock, R.; Rice, C. B. F. Chromatographic Methods; John Wiley & Sons: New York, 1974. (3) Clegg, D. L. Anal. Chem. 1951, 22, 48–59. (4) Muller, R. H. Anal. Chem. 1949, 21, 1429–1430. (5) Muller, R. H.; Clegg, D. L. Anal. Chem. 1951, 23, 396–403. (6) Singer, J. M.; Plotz, C. M. Am. J. Med. 1956, 21, 888–892. (7) Martinez, A. W.; Philips, S. T.; Whitesides, G. M. Proc. Natl. Acad. Sci. USA 2008, 105, 19606–19611. (8) Bruzewicz, D. A.; Reches, M.; Whitesides, G. M. Anal. Chem. 2008, 80, 3387–3392. (9) Carrilho, E.; Martinez, A. W.; Whitesides, G. M. Anal. Chem. 2009, 81, 7091–7095. (10) Lu, Y.; Shi, W.; Jiang, L.; Qin, J.; Lin, B. Electrophoresis 2009, 30, 1497– 1500. (11) Carrilho, E.; Philips, S. T.; Vella, S. J.; Martinez, A. W.; Whitesides, G. M. Anal. Chem. 2009, 81, 5990–5998. 1162 Analytical Chemistry, Vol. 82, No. 3, February 1, 2010 transmission of images to off-site diagnosticians.12 They introduced the term “µPADs” for microfluidic paper-based analytical devices, and they focus on paper devices whose sample or standards are introduced by capillary action without the need of pumps. Electrochemistry has always provided analytical techniques characterized by instrumental simplicity, moderate cost, and portability. Because of these features, its integration with paperbased microfluidics seems likely to be advantageous. The Henry group successfully fabricated electrodes at the end of a microfluidic channel on filter paper and demonstrated the chronoamperographic determination of glucose, lactate, and uric acid in urine using oxidase enzyme reactions.13 Patterned paper has provided an inexpensive and versatile platform for point-of-care testing, but it can also be used as a chromatographic support to separate analytes. The µPADs are a new class of microfluidic systems capable of performing truly disposable, inexpensive, and portable total analysis, especially since the microzone plates patterned on paper can now be used for sample pretreatment and separation. Strips of paper or patterned strips of paper work as chromatographic columns that can be coupled to thin-layer electrodes printed (or not) on paper. In general, that integration creates a multifunctional device that can be used in point-of-care testing or in the environmental or industrial monitoring of different analytes. Herein, we demonstrate the combination of paper chromatography with electrochemical detection in quantitative microscale analysis, creating inexpensive paper-based separation devices with amperometric detection. Specifically, we report the separation and detection of ascorbic acids (AA) and uric acids (UA) by chronoamperography. However, many other substances that were useful for medical diagnosis can be determined since they were electroactive or even nonelectroactive if a coupled reaction was done to generate an electroactive species. EXPERIMENTAL SECTION Materials and Equipment. Ascorbic acid (AA) and uric acid (UA) were purchased from Sigma. Sodium acetate anhydrous and acetic acid were supplied by Merck. Whatman cellulose chro(12) Martinez, A. W.; Philips, S. T.; Carrilho, E.; Thomas, S. W.; Sindi, H.; Whitesides, G. M. Anal. Chem. 2008, 80, 3699–3707. (13) Dungchai, W.; Chailapakul, O.; Henry, C. S. Anal. Chem. 2009, 81, 5821– 5826. 10.1021/ac902647r 2010 American Chemical Society Published on Web 01/07/2010 Scheme 1. Schematic View of the Experimental Setupa a The first design of the paper-based separation device. WE, working electrode; RE, reference electrode; CE, counter electrode. Inset A shows a picture of the integrated electrochemical cell with its dimensions. matographic paper, grade 1Chr with a thickness of 0.18 mm, and an insulating tape from 3M, 810 Scotch, were employed. Purified water was obtained from a Millipore Milli-Q filtering system. All reagents were used as received without further purification. Electrochemical measurements were performed with a potentiostat (Autolab PGSTAT10) interfaced to a computer, but this apparatus can be easily replaced by a simple handheld amperometer. The original cell cable connector for the indicator, auxiliary, and reference electrodes was replaced by a homemade cable adapted by means of a DIN connector on the potentiostat hardware and a slot that allows the connection to the paper-based separation device. Gold Electrochemical Microcell Assembly. Gold electrodes were assembled on 100 µm polyester films. The substrate was cleaned and then covered with a positive photoresist (S1811, Shipley Co.) in a spinner. The substrate was fixed on a glass support in order to be properly held by the spinner, and the process was concluded in 30 s at 4000 rpm. After that, the photoresist solvent was volatilized by placing the substrate on a heating plate at 90 °C for 5 min. The substrate was exposed for 15 min to UV light using an aligner (JMS, Karl Süss) whose lamp intensity is about 9.5 mW cm-2. The photomask was designed to define the traditional three-electrode configuration disposed on the same strip. The revelation step was carried out by putting the photoresist layer in contact with a diluted developer solution (AZ 351, Clariant). A layer of approximately 200 Å of Ti and a second layer of 1000 Å of Au upon the substrate was deposited by electron-beam evaporation and, by the lift-off technique, all the photoresist under the deposited metallic layer was removed from the substrate, leaving the design of the electrode. The design of the microcell is simple and is exactly the same for all devices: the auxiliary and reference electrodes are rectangular with a geometric area of 3 mm2, and the indicator electrode is 1.5 mm2 with an electrochemical surface area of 3.7 ± 0.1 mm2. Paper-Based Separation Device. Different designs were investigated and will be presented in this work. The simplest separation device developed is shown in Scheme 1. It was fabricated by pressing a narrow strip (60 × 6 mm) of Whatman cellulose chromatographic paper onto the interface of a thin-layer gold electrochemical microcell. RESULTS AND DISCUSSION First, stock solutions of 1.0 mmol L-1 AA and UA were prepared in acetic acid and sodium acetate, respectively. Then, solutions with known concentrations of AA and UA were prepared in acetate buffer. Exactly 2 µL of samples were spotted onto the chromatographic paper. One end of the paper was soaked in the eluent (acetate buffer 0.1 mol L-1, pH 4.5). The separation was developed throughout the paper column, and amperometric detection was initiated when the solution began to flow onto the electrodes. The applied potential of +0.4 V vs Au was chosen voltammetrically by verifying the AA and UA oxidation peaks on the gold electrochemical microcell in hydrostatic conditions. In general, as the solvent rises through the paper by capillary action, it meets and dissolves the sample mixture, which will then travel up the paper with the solvent according to its solubility in the solvent and its adsorption to the polar cellulose fibers.14,15 The pH of the eluent was adjusted to 4.5, just between the pKa values of AA (4.1) and UA (5.4). As a result, the AA became ionized and much more soluble in the mobile phase than UA. Moreover, due to the molecular geometry and the presence of fewer polar bonds in the ascorbate ion, it is less polar than the UA. So, the retention of UA in the cellulose fibers was stronger, as shown in Figure 1. The type of paper, its thickness, and its column length greatly influence the separation efficiency. The column length was stated as the distance between the sample injection point and the paper region that rested on the electroactive surface of the gold microcell. Three different column lengths (5, 10, 20 mm) were tested. In the shorter column, the AA and UA peaks were partially overlapped, and in the longer one, the UA peak presented a long tail. In the 10 mm column, the AA and UA were completely separated, as shown in Figure 1D. In Figure 2, the chronoamperographies of the AA and UA mixtures are shown at different eluent pH values. As the pH rises, the height of the AA peak diminishes. At pH 3.4, the solubility of UA in the mobile phase is critical, being completely retained by the paper stationary phase. At pH 4.5, AU is in its molecular form, but at pH 5.9, it is ionized. The ionic strength of the mobile phase showed a strong effect on the peak height of AA and UA. It was observed that the height of the AA peak increased until the ionic strength rose from 0.05 to 0.20 mol L-1 and then decreased for higher values (data not shown). Conversely, the UA peak height increased when the ionic strength rose from 0.05 to 0.10 but remained constant for higher values. The repeatability in the measurements of both analytes improved when an ionic strength of 0.10 mol L-1 was employed. At present, a typical HPLC separation of AA and AU requires analysis times of at least 5 min per run, while 16 min are necessary to accomplish the paper-based separation of both analytes.6 By definition, the retention time is the time needed for the analyte to reach the detector from the time it was injected into a separation column. Consequently, in Figure 1, the retention time is the recorded time plus the time needed by the solvent to travel up the paper column to reach the detector (2.5 ± 0.1 min) for a column length of 10.0 mm (7.0 mm width). In the present (14) Wilson, I. D. Encyclopedia of Separation Science; Academic Press: New York, 2000. (15) Li, X.; Franke, A. A. J. Chromatogr., B 2009, 877, 853–856. Analytical Chemistry, Vol. 82, No. 3, February 1, 2010 1163 Figure 2. Dependence of the separation performance on the eluent pH for 0.4 mmol L-1 AA and UA. Aliquot of sample: 2 µL of sample was spotted on the paper. Applied potential: 0.4 V vs Au. Eluent: 0.10 mol L-1 acetate buffer. Figure 1. Performance of the device in the separation and detection of AA and UA. Samples: (A) eluent (0.10 mol L-1 acetate buffer, pH 4.5); (B) 0.10 mmol L-1 UA prepared in acetate buffer; (C) 0.10 mmol L-1 AA prepared in 0.1 mol L-1 of acetate buffer, and (D) 0.10 mmol L-1 AA and UA diluted in acetate buffer. Aliquot of sample: 2 µL of sample was spotted on the paper. Applied potential: 0.4 V vs Au. approach, the detection time obtained using the proposed device is a little bit longer if compared to HPLC determination, but on other hand, the paper-based device does not require sophisticated instrumentation and is cheaper, portable, and easy to handle. Moreover, different configurations of the paper-based device could possibly shorten the time. The main claim of µPADs is that they are the least expensive of the disposable analytical microdevices. The inclusion of gold electrodes into those devices increased the cost per unit, but if the production in high scale is considered or other materials were employed, then the cost will be still low. Calibration curves were calculated for each compound in order to determine the uniformity of the analytical response over the range of concentrations (Figure 3). Either the height or the area under the AA and UA peaks could be employed to build up the analytical curve, as they give similar sensitivity. The peak height was chosen due to the greater ease of performing the measurement. Uric and ascorbic acid had similar detection limits of about 0.02 mmol L-1, so amounts as low as 40 pmols of AA and UA can be accurately determined. The detection limit was determined using 3σ/slope, where σ is the standard deviation.16 The (16) Analytical Methods Committee Analyst 1987, 112, 199-204. 1164 Analytical Chemistry, Vol. 82, No. 3, February 1, 2010 sensitivity (152 nA L mmol-1 for AA and 64 nA L mmol-1 for UA) and the linear range were higher for AA, as shown in the inserted plots in Figure 3. The normal level of uric acid in serum is in the range of 0.1-0.4 mmol L-1, while the normal level of vitamin C is in a more narrow range of 0.05-0.1 mmol L-1.17,18 Our device should, therefore, be comprehensive for the determination of those analytes in serum, taking into account that further experiments must be carried out to validate the methodology for the sample matrix. Other designs were developed by sputtering gold on 1Chr Whatman paper covered with a physical mask made of copper. The mask was then removed, leaving the shape of the three gold electrodes on the paper. Next, on the back of the paper and perpendicular to the electrochemical microcell, two straight lines were made with a resin by silk screen, as shown in Scheme 2. Several types of resin were tested, such as Futurex and AZ4620 photoresists and even silk-screen ink for glass. All of them were efficient in creating hydrophobic barriers with a nominal width of at least 1.0 ± 0.3 mm. The barrier patterned walls showed defects due to the fact that paper is not a uniform porous material. The distance between the two parallel lines was studied because the separation efficiency of AA and UA is a function of the column width and length, as described above for the simpler device. The possibility of creating a chromatographic column on SU-8 hydrophobized paper by the use of plasma treatment in conjunction with a mask was also evaluated. This technique allows the (17) Tsuji, H.; Seabra, M. E. G.; Matsubara, B. B.; Burini, R. C. Rev. Bras. Patol. Clin. 1993, 29, 83–86. (18) Tietz, N. W. Clinical Guide to Laboratory Tests; W. B. Saunders Company, London, 1995. Figure 3. Chronoamperographies of AA and UA mixtures at a variety of concentrations in the range of 0-0.4 mmol L-1. Plots of ∆i (peak height) versus the concentration of AA and UA are also shown. Aliquot of sample: 2 µL was spotted on the paper. Applied potential: 0.4 V vs Au. Scheme 2. Design of a Prototype Paper-Based Separation Device That Is Able to Separate and Amperometrically Detect Electroactive Compoundsa a The gold electrochemical microcell was fabricated on paper, and the gold electrode area was delimited by the walls of resins disposed by silk-screen. formation of very straight barriers, but impregnated photoresist residues interfere in the paper chromatographic separation. More detailed studies must be carried out to control and evaluate the photoresist removal from the paper. CONCLUSIONS To summarize, this work has described the construction and the use of devices capable of simultaneously performing the chromatographic separation and the quantitative determination of electroactive compounds, such as ascorbic and uric acids, in paper-based separation devices associated with electrochemical detection. The real strength of this work is the development of a (19) Pussard, E.; Neveux, M.; Guigueno, N. Clin. Biochem. 2009, 42, 536–539. (20) Adam, T.; Lochmann, P.; Friedecky, D. J. Chromatogr., B 2002, 767, 565– 571. (21) Shapovalova, E. N.; Yaroslavtseva, L. N.; Merkulova, N. L.; Yashin, A. Y.; Shpigun, O. A. J. Anal. Chem. 2009, 64, 164–170. (22) Portela, D. C.; Pereira, I. M. F.; Delerue-Matos, P. P. C.; Vaz, M. C. V. F. Anal. Bioanal. Chem. 2003, 377, 356–361. very simple, selective, disposable, and inexpensive device that can solve challenging analytical problems that usually require sophisticated instrumentation. Thus, the system presented here is not limited to clinical diagnostics but will be useful to accomplish quantitative analytical determinations necessary in forensic, (agro)industrial, or environmental applications because it can be adapted to a number of assays in a wide range of conditions. There are some medically relevant electroactive metabolites like urinary free catecholamines, purines, and pirimidines that can be separated and determined using the developed device for the early detection of cancer.19,20 The adequacy of the device to the analysis of electroactive xenobiotics widely used in agrochemical practice such as thiran and linuron21 and methyl-carbamates22 is also possible. We anticipate that the utility of the method can be improved by performing such analyses in a closed system to control the vapor pressure of the eluent and, consequently, enhance the efficiency of the separation as well as decrease the time spent in each chronoamperographic run. ACKNOWLEDGMENT The authors gratefully acknowledge financial support from FAPESP, CNPq, and INCTBIO (Instituto Nacional de Ciência e Tecnologia de Bioanalı́tica). Received for review November 18, 2009. Accepted December 21, 2009. AC902647R Analytical Chemistry, Vol. 82, No. 3, February 1, 2010 1165
Baixar