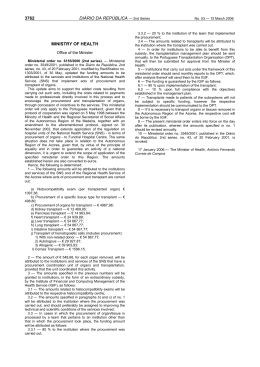
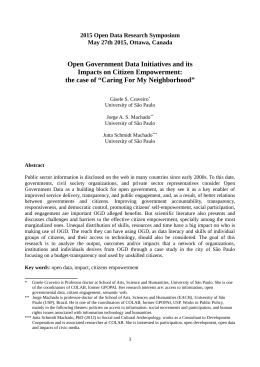
The Global Gender Gap Index 2015
The Global Gender Gap Index was first introduced by
the World Economic Forum in 2006 as a framework for
capturing the magnitude of gender-based disparities
and tracking their progress. This year is the 10th edition
of the Index, allowing for time-series analysis on the
changing patterns of gender equality around the world and
comparisons between and within countries.
The Index benchmarks national gender gaps
on economic, political, education and health criteria,
and provides country rankings that allow for effective
comparisons across regions and income groups. The
rankings are designed to create greater awareness among
a global audience of the challenges posed by gender
gaps and the opportunities created by reducing them. The
methodology and quantitative analysis behind the rankings
are intended to serve as a basis for designing effective
measures for reducing gender gaps.
The first part of this chapter reviews the underlying
concepts employed in creating the Global Gender Gap
Index and outlines the methods used to calculate it. The
second part presents the 2015 rankings, global patterns,
regional performance and notable country cases. This
includes an analysis on country performance over time,
particularly for those countries that have been included
in the Index since 2006. Next, we provide information on
the key trends that can be observed through a decade of
data for the 109 countries that have been covered since
the first Index, by analysing data along subindex, income
and regional lines. The fourth part of this chapter lays out
the economic case for gender equality, including links
between gender gaps and the economic performance of
countries. In the fifth and final part, we provide information
on implications for public policy and business practices.
The Country Profiles contained in Part 2 of this Report
give a more detailed picture of the relative strengths and
weaknesses of each country’s performance compared
with that of other nations and relative to its own past
performance. The first page of each profile contains key
demographic and economic indicators as well as detailed
information on the country’s performance in 2015, including
a comparison within its income group. The second page
of the Country Profiles shows the trends between 2006
and 2015 on the overall Index and four subindexes, as well
as over 55 gender-related indicators that provide a fuller
context for the country’s performance. These indicators
include information on employment & leadership; education
and technology; health; family; and rights and norms.
MEASURING THE GLOBAL GENDER GAP
The methodology of the Index has remained stable since
its development in 2006, providing robust comparative and
intra-country information.
Three underlying concepts
There are three basic concepts underlying the Global
Gender Gap Index, forming the basis of how indicators
were chosen, how the data is treated and the scale
used. First, the Index focuses on measuring gaps
rather than levels. Second, it captures gaps in outcome
variables rather than gaps in input variables. Third, it
ranks countries according to gender equality rather than
women’s empowerment. These three concepts are briefly
outlined below. For a description of how these concepts
are captured by the construction techniques used in the
creation of the Index, please see the “Construction of the
Index” section below.
Gaps vs. levels
The Index is designed to measure gender-based gaps
in access to resources and opportunities in countries
rather than the actual levels of the available resources and
opportunities in those countries. We do this in order to
make the Global Gender Gap Index independent from the
countries’ levels of development. In other words, the Index
is constructed to rank countries on their gender gaps not
on their development level. For example, rich countries,
generally speaking, are able to offer more education and
health opportunities to all members of society, although
this is quite independent of the gender-related gaps that
may exist within those higher levels of health or education.
The Global Gender Gap Index rewards countries for
smaller gaps in access to these resources, regardless
of the overall level of resources. Thus, in the case of
education, the Index penalizes or rewards countries based
The Global Gender Gap Report 2015 | 3
Part 1: Measuring the Global Gender Gap
on the size of the gap between male and female enrolment
rates, but not for the overall levels of education in the
country.
Outcomes vs. inputs
The second basic concept underlying the Global Gender
Gap Index is that it evaluates countries based on outcomes
rather than inputs or means. Our aim is to provide a
snapshot of where men and women stand with regard to
some fundamental outcome indicators related to basic
rights such as health, education, economic participation
and political empowerment. Indicators related to countryspecific policies, rights, culture or customs—factors that we
consider “input” or “means” indicators—are not included
in the Index, but they are displayed in the Country Profiles.
For example, the Index includes an indicator comparing
the gap between men and women in high-skilled jobs such
as legislators, senior officials and managers (an outcome
indicator) but does not include data on the length of
maternity leave (a policy indicator).
Gender equality vs. women’s empowerment
The third distinguishing feature of the Global Gender Gap
Index is that it ranks countries according to their proximity
to gender equality rather than to women’s empowerment.
Our aim is to focus on whether the gap between women
and men in the chosen indicators has declined, rather than
whether women are “winning” the “battle of the sexes”.
Hence, the Index rewards countries that reach the point
where outcomes for women equal those for men, but
it neither rewards nor penalizes cases in which women
are outperforming men in particular indicators in some
countries. Thus a country that has higher enrolment for
girls rather than boys in secondary school will score equal
to a country where boys’ and girls’ enrolment is the same.
The four subindexes
The Global Gender Gap Index examines the gap
between men and women in four fundamental categories
(subindexes): Economic Participation and Opportunity,
Educational Attainment, Health and Survival and Political
Empowerment. Table 1 (page 5) displays all four of
these subindexes and the 14 different indicators that
compose them, along with the sources of data used for
each.
Economic Participation and Opportunity
This subindex contains three concepts: the participation
gap, the remuneration gap and the advancement gap. The
participation gap is captured using the difference between
women and men in labour force participation rates. The
remuneration gap is captured through a hard data indicator
(ratio of estimated female-to-male earned income) and a
qualitative indicator gathered through the World Economic
Forum’s Executive Opinion Survey (wage equality for similar
work). Finally, the gap between the advancement of women
4 | The Global Gender Gap Report 2015
and men is captured through two hard data statistics (the
ratio of women to men among legislators, senior officials
and managers, and the ratio of women to men among
technical and professional workers).
Educational Attainment
In this subindex, the gap between women’s and men’s
current access to education is captured through ratios of
women to men in primary-, secondary- and tertiary-level
education. A longer-term view of the country’s ability to
educate women and men in equal numbers is captured
through the ratio of the female literacy rate to the male
literacy rate.
Health and Survival
This subindex provides an overview of the differences
between women’s and men’s health through the use of
two indicators. The first is the sex ratio at birth, which
aims specifically to capture the phenomenon of “missing
women” prevalent in many countries with a strong son
preference. Second, we use the gap between women’s
and men’s healthy life expectancy. This measure provides
an estimate of the number of years that women and men
can expect to live in good health by taking into account
the years lost to violence, disease, malnutrition or other
relevant factors.
Political Empowerment
This subindex measures the gap between men and women
at the highest level of political decision-making through
the ratio of women to men in minister-level positions and
the ratio of women to men in parliamentary positions. In
addition, we include the ratio of women to men in terms
of years in executive office (prime minister or president)
for the last 50 years. A clear drawback in this category
is the absence of any indicators capturing differences
between the participation of women and men at local
levels of government. Should such data become available
at a globally comparative level in future years, they will be
considered for inclusion in the Index.
Construction of the Index
The overall Global Gender Gap Index is constructed
using a four-step process, outlined below. Some of the
indicators listed in Table 1 require specific construction or
modification in order to be used in the Index. For further
information on the indicator-specific calculations, please
refer to the How to Read the Country Profiles section in
Part 2 of this Report.
Convert to ratios
Initially, all data are converted to female/male ratios. For
example, a country with 20% of women in ministerial
positions is assigned a ratio of 20 women /80 men, thus a
value of 0.25. This is to ensure that the Index is capturing
Part 1: Measuring the Global Gender Gap
Table 1: Structure of the Global Gender Gap Index
Subindex
Variable
Source
Economic Participation
and Opportunity
Ratio: female labour force participation over male value
International Labour Organisation (ILO) Key Indicators of the Labour
Market (KILM) database, 6th edition; ILO estimates, 2013
Wage equality between women and men for similar work
(converted to female-over-male ratio)
World Economic Forum Executive Opinion Survey (EOS) 2015
Ratio: female estimated earned income over male value
World Economic Forum calculations based on United Nations
Development Programme methodology (refer to Human Development
Report 2007/2008)
Ratio: female legislators, senior officials and managers over male value
International Labour Organisation ILOStat database, 2014 or latest
available data; United Nations Development Programme Human
Development Report 2009, most recent year available between 1999
and 2007
Ratio: female professional and technical workers over male value
International Labour Organisation ILOStat database, 2014 or latest
available data; United Nations Development Programme Human
Development Report 2009, most recent year available between 1999
and 2007
Ratio: female literacy rate over male value
United Nations Educational, Scientific and Cultural Organization
(UNESCO) Institute for Statistics Education indicators datababase,
2015, or latest available data; United Nations Development
Programme Human Development Report 2009, most recent year
available between 1997 and 2007; and Human Development Report
2008, most recent year available between 1999 and 2006
Ratio: female net primary enrolment rate over male value
UNESCO Institute for Statistics Education indicators database, 2014
or latest data available
Ratio: female net secondary enrolment rate over male value
UNESCO Institute for Statistics Education indicators database, 2014
or latest data available
Ratio: female gross tertiary enrolment ratio over male value
UNESCO Institute for Statistics Education indicators database, 2014
or latest data available
Sex ratio at birth (converted to female-over-male ratio)
Central Intelligence Agency The CIA World Factbook, 2015 (data
updated weekly)
Ratio: female healthy life expectancy over male value
World Health Organization Global Health Observatory database, 2013
Ratio: females with seats in parliament over male value
Inter-Parliamentary Union Women in Politics: 2015, reflecting
elections/appointments up to 1 June 2015
Ratio: females at ministerial level over male value
Inter-Parliamentary Union Women in Politics: 2015, reflecting
elections/appointments up to 1 June 2015
Ratio: number of years of a female head of state (last 50 years) over
male value
World Economic Forum calculations, 30 June 2015
Educational Attainment
Health and Survival
Political Empowerment
gaps between women and men’s attainment levels, rather
than the levels themselves.
Truncate data at equality benchmark
As a second step, these ratios are truncated at the
“equality benchmark”. For all indicators, except the two
health indicators, this equality benchmark is considered
to be 1, meaning equal numbers of women and men.
In the case of the sex ratio at birth variable, the equality
benchmark is set to be 0.944,1 and the healthy life
expectancy benchmark is set to be 1.06.2 Truncating the
data at the equality benchmarks for each indicator assigns
the same score to a country that has reached parity
between women and men and one where women have
surpassed men.
The type of scale chosen determines whether the Index
is rewarding women’s empowerment or gender equality.3
To capture gender equality, two possible scales were
considered. One was a negative-positive scale capturing the
size and direction of the gender gap. This scale penalizes
either men’s advantage over women or women’s advantage
over men, and gives the highest points to absolute equality.
The second choice was a one-sided scale that measures
how close women are to reaching parity with men but
does not reward or penalize countries for having a gender
gap in the other direction. We find the one-sided scale
more appropriate for our purposes, as it does not reward
countries for having exceeded the parity benchmark.
The Global Gender Gap Report 2015 | 5
Part 1: Measuring the Global Gender Gap
Table 2: Calculation of weights within each subindex
ECONOMIC PARTICIPATION AND OPPORTUNITY SUBINDEX
Ratio
Standard deviation
Standard deviation per 1% point change
Weight
Ratio: female labour force participation over male value
0.160
0.063
0.199
Wage equality between women and men for similar work (converted to female-over-male ratio)
0.103
0.097
0.310
Ratio: female estimated earned income over male value
0.144
0.069
0.221
Ratio: female legislators, senior officials and managers over male value
0.214
0.047
0.149
Ratio: female professional and technical workers over male value
0.262
0.038
0.121
TOTAL..........................................................................................................................................................................................................................................1
EDUCATIONAL ATTAINMENT SUBINDEX
Ratio
Standard deviation
Standard deviation per 1% point change
Weight
Ratio: female literacy rate over male value
0.145
0.069
0.191
Ratio: female net primary enrolment rate over male value
0.060
0.167
0.459
Ratio: female net secondary enrolment rate over male value
0.120
0.083
0.230
Ratio: female gross tertiary enrolement ratio over male value
0.228
0.044
0.121
TOTAL..........................................................................................................................................................................................................................................1
HEALTH AND SURVIVAL SUBINDEX
Ratio
Standard deviation
Standard deviation per 1% point change
Weight
Sex ratio at birth (converted to female-over-male ratio)
0.010
0.998
0.693
Ratio: female healthy life expectancy over male value
0.023
0.441
0.307
TOTAL..........................................................................................................................................................................................................................................1
POLITICAL EMPOWERMENT SUBINDEX
Ratio
Standard deviation
Standard deviation per 1% point change
Weight
Ratio: females with seats in parliament over male value
0.166
0.060
0.310
Ratio: females at ministerial level over male value
0.208
0.048
0.247
Ratio: number of years with a female head of state (last 50 years) over male value
0.116
0.086
0.443
TOTAL..........................................................................................................................................................................................................................................1
Note: Calculations are based on the Global Gender Gap Report 2006.
Calculate subindex scores
The third step in the process involves calculating the
weighted average of the indicators within each subindex
to create the subindex scores. Averaging the different
indicators would implicitly give more weight to the measure
that exhibits the largest variability or standard deviation. We
therefore first normalize the indicators by equalizing their
standard deviations. For example, within the Educational
Attainment subindex, standard deviations for each of the
four indicators are calculated. Then we determine what a
1% point change would translate to in terms of standard
deviations by dividing 0.01 by the standard deviation for
each indicator. These four values are then used as weights
to calculate the weighted average of the four indicators.
This way of weighting indicators allows us to make
sure that each indicator has the same relative impact
on the subindex. For example, an indicator with a small
variability or standard deviation, such as primary enrolment
rate, gets a larger weight within the Educational Attainment
6 | The Global Gender Gap Report 2015
subindex than an indicator with a larger variability, such as
tertiary enrolment rate. Therefore, a country with a large
gender gap in primary education (an indicator where most
countries have achieved near-parity between women and
men) will be more heavily penalized. Similarly, in the case
of the sex ratio indicator (within the Health and Survival
subindex), where most countries have a very high sex ratio
and the spread of the data is small, the larger weight will
penalize more heavily those countries that deviate from this
value. Table 2 displays the values of the weights used.4
Calculate final scores
In the case of all subindexes, the highest possible score is
1 (equality) and the lowest possible score is 0 (inequality),
thus binding the scores between inequality and equality
benchmarks.5 An un-weighted average of each subindex
score is used to calculate the overall Global Gender Gap
Index score. As in the case of the subindexes, this final
value ranges between 1 (equality) and 0 (inequality), thus
Part 1: Measuring the Global Gender Gap
allowing for comparisons relative to ideal standards of
equality in addition to relative country rankings.6 The
equality and inequality benchmarks remain fixed across
time, allowing the reader to track individual country
progress in relation to an ideal standard of equality.
Furthermore, the option of roughly interpreting the final
Index scores as a percentage value that reveals how a
country has reduced its gender gap should help make the
Index more intuitively appealing to readers.7
Figure 1: Global performance, 2015
ECONOMY
1.00
0.80
0.60
0.40
0.20
POLITICS
THE GLOBAL GENDER GAP INDEX RESULTS IN 2015
Country Coverage 2015
We aim to include a maximum number of countries in the
Report every year, within the constraints posed by data
availability. To be included in the Report, a country must
have data available for a minimum of 12 indicators out
of the 14 that make up the Index. In 2015, we have been
able to include 145 countries in the Report. Of these, 109
have been included in the Report since the first edition
published in 2006.
Nearly 200 countries were considered for inclusion this
year. Out of the 145 ultimately covered in this Report, 19
countries had one data point missing and 31 countries had
two data points missing. Missing data is clearly marked on
each relevant Country Profile.
Last year we included 142 countries in the Index. This
year, we were able to include three new countries—Benin,
Cameroon and The Gambia —resulting in a total of 145
countries.
Figure 1 is a global snapshot of the gender gap in the
four subindexes. It shows that the 145 countries covered
in the Report have closed almost 96% of the gap in health
outcomes between women and men and 95% of the gap
in educational attainment. However, the gap between
women and men on economic participation and political
empowerment remains wide: only 59% of the economic
outcomes gap and 23% of the political outcomes gap have
been closed.
Global Results
Table 3 (page 8) displays the 2015 index and subindex
rankings, organized from highest to lowest by rank, on
the overall index. No country in the world has fully closed
the gender gap, but four out of the five Nordic countries
and Ireland have closed more than 80% of it. Yemen, the
lowest ranking country has closed over 48% of the gender
gap. For further analysis of countries, refer to the Country
Results section.
Figure 2 (page 12) illustrates the spread of country
scores for the overall Index. The population-weighted
global average is highlighted by the blue diamond. Iceland
holds the top spot, followed closely by Norway and
Finland. At the other end are Pakistan, Syria and Yemen,
which is the lowest-scoring country in the Index.
EDUCATION
0.00
HEALTH
sample average (0.00 = inequality, 1.00 = equality)
Source: Global Gender Gap Index 2015.
Performance by Subindex, 2015
Table 4 (page 10) displays the rankings by subindex,
organized highest to lowest by rank per subindex. In 2015,
25 countries have fully closed the gap on the Educational
Attainment subindex, the same number as the last two
years. Angola, Yemen, Guinea, Benin and Chad hold the
last five spots on this subindex, with Benin and Chad
having closed less than 70% of their education gender
gap. In total, there are 21 countries where women still have
less than 90% of the education outcomes that men have.
Thirty-five countries are below world average (weighted
by population) on this subindex. While the Index takes
into account four key indicators to measure the gender
gap on education outcomes, the Country Profiles provide
additional information on the gaps between women and
men, on out-of-school children of primary school age,
education attainment rates, STEM education and PhD
degrees.
Forty countries (five more than last year) have fully
closed their gender gap on the Health and Survival
subindex. Mali, Albania, India, Armenia and China are
the lowest-ranked countries, and no country currently
has a gap bigger than 90% on this subindex. Only
nine countries are below world average (weighted by
population) on this subindex. While the index takes into
account two key measures of gender gaps, this year we
are presenting additional contextual information in the
Country Profiles that reveals differences between male
and female outcomes from cardiovascular disease, cancer,
diabetes, respiratory disease, HIV, malaria, tuberculosis
and malnutrition. Additionally, the Country Profiles contain
detailed information on maternal health and fertility.
The Global Gender Gap Report 2015 | 7
Part 1: Measuring the Global Gender Gap
Table 3: Global rankings, 2015
GLOBAL INDEX
ECONOMIC PARTICIPATION
AND OPPORTUNITY
EDUCATIONAL ATTAINMENT
HEALTH AND SURVIVAL
POLITICAL EMPOWERMENT
Country
Rank
Score
Rank
Score
Rank
Score
Rank
Score
Rank
Score
Iceland
1
0.881
5
0.836
1
1.000
105
0.970
1
0.719
Norway
2
0.850
1
0.868
32
1.000
70
0.974
3
0.559
Finland
3
0.850
8
0.815
1
1.000
1
0.980
2
0.607
Sweden
4
0.823
4
0.836
54
0.996
71
0.974
5
0.486
Ireland
5
0.807
26
0.777
44
0.998
56
0.979
6
0.474
Rwanda
6
0.794
14
0.808
112
0.944
91
0.972
7
0.452
Philippines
7
0.790
16
0.799
34
1.000
1
0.980
17
0.382
Switzerland
8
0.785
17
0.798
69
0.993
74
0.974
18
0.376
Slovenia
9
0.784
24
0.778
29
1.000
79
0.973
16
0.385
New Zealand
10
0.782
30
0.768
1
1.000
105
0.970
15
0.390
Germany
11
0.779
38
0.737
88
0.987
56
0.979
11
0.413
Nicaragua
12
0.776
100
0.619
1
1.000
1
0.980
4
0.506
Netherlands
13
0.776
39
0.732
1
1.000
104
0.970
13
0.401
Denmark
14
0.767
20
0.788
1
1.000
107
0.970
29
0.309
France
15
0.761
56
0.699
1
1.000
1
0.980
19
0.365
Namibia
16
0.760
27
0.775
1
1.000
1
0.980
33
0.287
South Africa
17
0.759
72
0.670
85
0.987
1
0.980
14
0.400
United Kingdom
18
0.758
43
0.724
37
1.000
66
0.974
23
0.335
Belgium
19
0.753
34
0.762
1
1.000
66
0.974
35
0.275
Latvia
20
0.752
21
0.784
1
1.000
1
0.980
40
0.246
Estonia
21
0.749
47
0.711
39
0.999
1
0.980
30
0.308
Bolivia
22
0.749
96
0.634
101
0.967
1
0.980
10
0.415
Burundi
23
0.748
3
0.845
131
0.857
68
0.974
28
0.314
Barbados
24
0.744
2
0.848
46
0.998
1
0.980
77
0.150
Spain
25
0.742
67
0.674
47
0.998
93
0.972
26
0.326
Moldova
26
0.742
18
0.797
50
0.996
42
0.979
58
0.195
Mozambique
27
0.741
29
0.773
129
0.860
114
0.968
21
0.361
United States
28
0.740
6
0.826
40
0.999
64
0.975
72
0.162
Cuba
29
0.740
119
0.579
26
1.000
63
0.975
12
0.407
Canada
30
0.740
28
0.773
1
1.000
109
0.969
46
0.218
Lithuania
31
0.740
35
0.759
66
0.994
42
0.979
45
0.227
Luxembourg
32
0.738
31
0.766
1
1.000
71
0.974
53
0.212
Ecuador
33
0.738
66
0.677
53
0.996
1
0.980
31
0.297
Belarus
34
0.734
10
0.813
33
1.000
42
0.979
79
0.146
Argentina
35
0.734
105
0.615
55
0.996
1
0.980
22
0.347
Australia
36
0.733
32
0.766
1
1.000
74
0.974
61
0.193
Austria
37
0.733
52
0.705
1
1.000
1
0.980
39
0.246
Costa Rica
38
0.732
118
0.587
1
1.000
64
0.975
20
0.365
Portugal
39
0.731
46
0.712
60
0.995
79
0.973
41
0.244
Bahamas
40
0.728
7
0.823
1
1.000
1
0.980
98
0.110
Italy
41
0.726
111
0.603
58
0.995
74
0.974
24
0.331
Colombia
42
0.725
37
0.746
61
0.994
42
0.979
64
0.180
Bulgaria
43
0.722
55
0.701
72
0.992
42
0.979
48
0.215
Panama
44
0.722
57
0.698
62
0.994
1
0.980
51
0.214
Serbia
45
0.720
74
0.669
52
0.996
79
0.973
43
0.242
Trinidad and Tobago
46
0.720
53
0.704
59
0.995
1
0.980
56
0.201
Kazakhstan
47
0.719
36
0.749
28
1.000
1
0.980
78
0.148
Kenya
48
0.719
25
0.778
113
0.942
85
0.973
62
0.182
Tanzania
49
0.718
49
0.709
126
0.894
55
0.979
32
0.292
Cape Verde
50
0.717
115
0.591
99
0.970
1
0.980
25
0.329
Poland
51
0.715
75
0.667
38
1.000
42
0.979
52
0.213
Lao PDR
52
0.713
11
0.811
116
0.935
92
0.972
84
0.132
Israel
53
0.712
71
0.671
51
0.996
69
0.974
54
0.205
Singapore
54
0.711
9
0.814
111
0.945
122
0.967
92
0.119
Botswana
55
0.710
15
0.800
1
1.000
87
0.973
126
0.068
Mongolia
56
0.709
22
0.783
73
0.992
1
0.980
117
0.084
Zimbabwe
57
0.709
51
0.707
97
0.974
1
0.980
66
0.175
Uganda
58
0.708
84
0.653
117
0.930
1
0.980
36
0.271
Croatia
59
0.708
78
0.664
65
0.994
42
0.979
60
0.193
Thailand
60
0.706
19
0.794
67
0.994
1
0.980
131
0.057
Lesotho
61
0.706
68
0.672
1
1.000
1
0.980
68
0.172
El Salvador
62
0.706
92
0.639
78
0.991
1
0.980
49
0.214
Ghana
63
0.704
13
0.808
119
0.924
87
0.973
96
0.112
Bangladesh
64
0.704
130
0.462
109
0.948
95
0.971
8
0.433
Jamaica
65
0.703
64
0.678
42
0.998
1
0.980
75
0.155
Guyana
66
0.702
124
0.569
1
1.000
1
0.980
37
0.261
Ukraine
67
0.702
40
0.731
30
1.000
42
0.979
107
0.098
Malawi
68
0.701
12
0.809
124
0.910
78
0.973
95
0.113
Macedonia, FYR
69
0.701
70
0.671
80
0.990
120
0.967
65
0.178
Albania
70
0.701
69
0.671
98
0.972
142
0.947
50
0.214
Mexico
71
0.699
126
0.545
75
0.991
1
0.980
34
0.281
Senegal
72
0.698
65
0.678
133
0.833
124
0.967
27
0.316
Chile
73
0.698
123
0.570
36
1.000
41
0.979
42
0.243
8 | The Global Gender Gap Report 2015
Part 1: Measuring the Global Gender Gap
Table 3: Global rankings, 2015 (cont’d.)
GLOBAL INDEX
Country
ECONOMIC PARTICIPATION
AND OPPORTUNITY
EDUCATIONAL ATTAINMENT
HEALTH AND SURVIVAL
POLITICAL EMPOWERMENT
Rank
Score
Rank
Score
Rank
Score
Rank
Score
Rank
Score
Madagascar
74
0.698
59
0.696
95
0.981
90
0.973
80
0.142
Russian Federation
75
0.694
42
0.731
27
1.000
42
0.979
128
0.066
Kyrgyz Republic
76
0.693
80
0.658
81
0.989
79
0.973
76
0.153
Romania
77
0.693
50
0.708
64
0.994
42
0.979
113
0.090
Venezuela
78
0.691
82
0.657
79
0.990
1
0.980
82
0.139
Montenegro
79
0.689
73
0.670
49
0.997
62
0.975
94
0.114
Honduras
80
0.688
101
0.617
1
1.000
61
0.976
74
0.160
Czech Republic
81
0.687
94
0.636
1
1.000
42
0.979
83
0.134
Georgia
82
0.687
60
0.692
31
1.000
120
0.967
114
0.089
Vietnam
83
0.687
41
0.731
114
0.941
139
0.950
88
0.124
Sri Lanka
84
0.686
120
0.577
57
0.995
1
0.980
59
0.193
Brazil
85
0.686
89
0.642
1
1.000
1
0.980
89
0.123
Dominican Republic
86
0.686
86
0.648
91
0.984
98
0.971
81
0.140
Greece
87
0.685
87
0.644
56
0.996
56
0.979
91
0.120
Brunei Darussalam
88
0.684
23
0.780
70
0.993
131
0.966
145
0.000
Peru
89
0.683
110
0.603
87
0.987
101
0.970
67
0.173
Cameroon*
90
0.682
44
0.724
130
0.857
115
0.968
63
0.180
China
91
0.682
81
0.657
83
0.988
145
0.919
73
0.162
Indonesia
92
0.681
114
0.593
89
0.986
60
0.976
71
0.168
Uruguay
93
0.679
91
0.639
48
0.997
1
0.980
106
0.101
Suriname
94
0.678
103
0.616
45
0.998
1
0.980
90
0.120
Tajikistan
95
0.675
48
0.709
120
0.922
127
0.966
103
0.104
Azerbaijan
96
0.675
54
0.701
90
0.984
139
0.950
129
0.063
Slovak Republic
97
0.675
93
0.638
1
1.000
79
0.973
115
0.087
Gambia, The*
98
0.674
58
0.697
118
0.926
85
0.973
108
0.098
Hungary
99
0.672
62
0.685
76
0.991
42
0.979
139
0.035
Cyprus
100
0.671
88
0.643
41
0.998
73
0.974
124
0.069
Japan
101
0.670
106
0.611
84
0.988
42
0.979
104
0.103
Swaziland
102
0.670
107
0.608
1
1.000
133
0.961
100
0.109
Belize
103
0.668
85
0.651
68
0.994
1
0.980
135
0.048
Malta
104
0.668
122
0.573
1
1.000
108
0.970
86
0.128
Armenia
105
0.668
79
0.664
35
1.000
144
0.939
125
0.068
Guatemala
106
0.667
98
0.627
108
0.953
1
0.980
99
0.109
Paraguay
107
0.666
102
0.616
63
0.994
1
0.980
122
0.075
India
108
0.664
139
0.383
125
0.896
143
0.942
9
0.433
Cambodia
109
0.662
63
0.681
127
0.891
1
0.980
109
0.098
Nepal
110
0.658
121
0.575
122
0.917
94
0.972
70
0.169
Malaysia
111
0.655
95
0.634
100
0.967
110
0.969
134
0.051
Liberia
112
0.652
99
0.620
136
0.806
119
0.967
47
0.216
Maldives
113
0.652
117
0.589
43
0.998
130
0.966
133
0.055
Burkina Faso
114
0.651
45
0.721
134
0.831
117
0.967
118
0.083
Korea, Rep.
115
0.651
125
0.557
102
0.965
79
0.973
101
0.107
Zambia
116
0.650
83
0.656
128
0.863
77
0.974
102
0.107
Kuwait
117
0.646
104
0.615
77
0.991
137
0.957
141
0.022
Bhutan
118
0.646
90
0.641
121
0.921
126
0.966
132
0.056
United Arab Emirates
119
0.646
128
0.519
86
0.987
133
0.961
93
0.115
Mauritius
120
0.646
127
0.534
74
0.991
1
0.980
120
0.078
Fiji
121
0.645
129
0.512
71
0.992
1
0.980
110
0.097
Qatar
122
0.645
97
0.632
96
0.977
137
0.957
144
0.013
Bahrain
123
0.644
113
0.597
94
0.981
133
0.961
138
0.037
Ethiopia
124
0.640
108
0.608
140
0.741
59
0.978
44
0.232
Nigeria
125
0.638
61
0.691
137
0.802
133
0.961
111
0.097
Angola
126
0.637
116
0.590
141
0.726
1
0.980
38
0.251
Tunisia
127
0.634
133
0.444
107
0.953
111
0.969
69
0.170
Algeria
128
0.632
137
0.410
110
0.946
128
0.966
55
0.205
Benin*
129
0.625
33
0.764
144
0.700
117
0.967
127
0.067
Turkey
130
0.624
131
0.459
105
0.957
1
0.980
105
0.103
Guinea
131
0.618
76
0.666
143
0.707
116
0.967
85
0.130
Mauritania
132
0.613
132
0.447
132
0.839
87
0.973
57
0.195
Côte d'Ivoire
133
0.606
112
0.603
138
0.773
113
0.968
119
0.081
Saudi Arabia
134
0.605
138
0.387
82
0.988
129
0.966
121
0.077
Oman
135
0.604
134
0.441
92
0.984
100
0.971
142
0.021
Egypt
136
0.599
135
0.441
115
0.935
97
0.971
136
0.048
Mali
137
0.599
109
0.605
139
0.755
141
0.949
116
0.086
Lebanon
138
0.598
136
0.439
104
0.963
103
0.970
143
0.021
Morocco
139
0.593
140
0.378
123
0.914
95
0.971
97
0.110
Jordan
140
0.593
142
0.350
93
0.983
132
0.966
123
0.073
Iran, Islamic Rep.
141
0.580
141
0.357
106
0.954
99
0.971
137
0.037
Chad
142
0.580
77
0.666
145
0.591
112
0.968
112
0.093
Syria
143
0.568
144
0.279
103
0.965
102
0.970
130
0.059
Pakistan
144
0.559
143
0.330
135
0.813
125
0.967
87
0.127
Yemen
145
0.484
145
0.225
142
0.720
123
0.967
140
0.026
* New countries 2015
The Global Gender Gap Report 2015 | 9
Part 1: Measuring the Global Gender Gap
Table 4: Rankings by subindex, 2015
ECONOMIC PARTICIPATION AND OPPORTUNITY
EDUCATIONAL ATTAINMENT
Country
Rank
Score
Country
Rank
Score
Country
Rank
Score
Country
Rank
Score
Norway
1
0.868
Serbia
74
0.669
Australia
1
1.000
Mauritius
74
0.991
Barbados
2
0.848
Poland
75
0.667
Austria
1
1.000
Mexico
75
0.991
Burundi
3
0.845
Guinea
76
0.666
Bahamas
1
1.000
Hungary
76
0.991
Sweden
4
0.836
Chad
77
0.666
Belgium
1
1.000
Kuwait
77
0.991
Iceland
5
0.836
Croatia
78
0.664
Botswana
1
1.000
El Salvador
78
0.991
United States
6
0.826
Armenia
79
0.664
Brazil
1
1.000
Venezuela
79
0.990
Bahamas
7
0.823
Kyrgyz Republic
80
0.658
Canada
1
1.000
Macedonia, FYR
80
0.990
Finland
8
0.815
China
81
0.657
Costa Rica
1
1.000
Kyrgyz Republic
81
0.989
Singapore
9
0.814
Venezuela
82
0.657
Czech Republic
1
1.000
Saudi Arabia
82
0.988
Belarus
10
0.813
Zambia
83
0.656
Denmark
1
1.000
China
83
0.988
Lao PDR
11
0.811
Uganda
84
0.653
Finland
1
1.000
Japan
84
0.988
Malawi
12
0.809
Belize
85
0.651
France
1
1.000
South Africa
85
0.987
Ghana
13
0.808
Dominican Republic
86
0.648
Guyana
1
1.000
United Arab Emirates
86
0.987
Rwanda
14
0.808
Greece
87
0.644
Honduras
1
1.000
Peru
87
0.987
Botswana
15
0.800
Cyprus
88
0.643
Iceland
1
1.000
Germany
88
0.987
Philippines
16
0.799
Brazil
89
0.642
Latvia
1
1.000
Indonesia
89
0.986
Switzerland
17
0.798
Bhutan
90
0.641
Lesotho
1
1.000
Azerbaijan
90
0.984
Moldova
18
0.797
Uruguay
91
0.639
Luxembourg
1
1.000
Dominican Republic
91
0.984
Thailand
19
0.794
El Salvador
92
0.639
Malta
1
1.000
Oman
92
0.984
Denmark
20
0.788
Slovak Republic
93
0.638
Namibia
1
1.000
Jordan
93
0.983
Latvia
21
0.784
Czech Republic
94
0.636
Netherlands
1
1.000
Bahrain
94
0.981
Mongolia
22
0.783
Malaysia
95
0.634
New Zealand
1
1.000
Madagascar
95
0.981
Brunei Darussalam
23
0.780
Bolivia
96
0.634
Nicaragua
1
1.000
Qatar
96
0.977
Slovenia
24
0.778
Qatar
97
0.632
Slovak Republic
1
1.000
Zimbabwe
97
0.974
Kenya
25
0.778
Guatemala
98
0.627
Swaziland
1
1.000
Albania
98
0.972
Ireland
26
0.777
Liberia
99
0.620
Cuba
26
1.000
Cape Verde
99
0.970
Namibia
27
0.775
Nicaragua
100
0.619
Russian Federation
27
1.000
Malaysia
100
0.967
Canada
28
0.773
Honduras
101
0.617
Kazakhstan
28
1.000
Bolivia
101
0.967
Mozambique
29
0.773
Paraguay
102
0.616
Slovenia
29
1.000
Korea, Rep.
102
0.965
New Zealand
30
0.768
Suriname
103
0.616
Ukraine
30
1.000
Syria
103
0.965
Luxembourg
31
0.766
Kuwait
104
0.615
Georgia
31
1.000
Lebanon
104
0.963
Australia
32
0.766
Argentina
105
0.615
Norway
32
1.000
Turkey
105
0.957
Benin*
33
0.764
Japan
106
0.611
Belarus
33
1.000
Iran, Islamic Rep.
106
0.954
Belgium
34
0.762
Swaziland
107
0.608
Philippines
34
1.000
Tunisia
107
0.953
Lithuania
35
0.759
Ethiopia
108
0.608
Armenia
35
1.000
Guatemala
108
0.953
Kazakhstan
36
0.749
Mali
109
0.605
Chile
36
1.000
Bangladesh
109
0.948
Colombia
37
0.746
Peru
110
0.603
United Kingdom
37
1.000
Algeria
110
0.946
Germany
38
0.737
Italy
111
0.603
Poland
38
1.000
Singapore
111
0.945
Netherlands
39
0.732
Côte d'Ivoire
112
0.603
Estonia
39
0.999
Rwanda
112
0.944
Ukraine
40
0.731
Bahrain
113
0.597
United States
40
0.999
Kenya
113
0.942
Vietnam
41
0.731
Indonesia
114
0.593
Cyprus
41
0.998
Vietnam
114
0.941
Russian Federation
42
0.731
Cape Verde
115
0.591
Jamaica
42
0.998
Egypt
115
0.935
United Kingdom
43
0.724
Angola
116
0.590
Maldives
43
0.998
Lao PDR
116
0.935
Cameroon*
44
0.724
Maldives
117
0.589
Ireland
44
0.998
Uganda
117
0.930
Burkina Faso
45
0.721
Costa Rica
118
0.587
Suriname
45
0.998
Gambia, The*
118
0.926
Portugal
46
0.712
Cuba
119
0.579
Barbados
46
0.998
Ghana
119
0.924
Estonia
47
0.711
Sri Lanka
120
0.577
Spain
47
0.998
Tajikistan
120
0.922
Tajikistan
48
0.709
Nepal
121
0.575
Uruguay
48
0.997
Bhutan
121
0.921
Tanzania
49
0.709
Malta
122
0.573
Montenegro
49
0.997
Nepal
122
0.917
Romania
50
0.708
Chile
123
0.570
Moldova
50
0.996
Morocco
123
0.914
Zimbabwe
51
0.707
Guyana
124
0.569
Israel
51
0.996
Malawi
124
0.910
Austria
52
0.705
Korea, Rep.
125
0.557
Serbia
52
0.996
India
125
0.896
Trinidad and Tobago
53
0.704
Mexico
126
0.545
Ecuador
53
0.996
Tanzania
126
0.894
Azerbaijan
54
0.701
Mauritius
127
0.534
Sweden
54
0.996
Cambodia
127
0.891
Bulgaria
55
0.701
United Arab Emirates
128
0.519
Argentina
55
0.996
Zambia
128
0.863
France
56
0.699
Fiji
129
0.512
Greece
56
0.996
Mozambique
129
0.860
Panama
57
0.698
Bangladesh
130
0.462
Sri Lanka
57
0.995
Cameroon*
130
0.857
Gambia, The*
58
0.697
Turkey
131
0.459
Italy
58
0.995
Burundi
131
0.857
Madagascar
59
0.696
Mauritania
132
0.447
Trinidad and Tobago
59
0.995
Mauritania
132
0.839
Georgia
60
0.692
Tunisia
133
0.444
Portugal
60
0.995
Senegal
133
0.833
Nigeria
61
0.691
Oman
134
0.441
Colombia
61
0.994
Burkina Faso
134
0.831
Hungary
62
0.685
Egypt
135
0.441
Panama
62
0.994
Pakistan
135
0.813
Cambodia
63
0.681
Lebanon
136
0.439
Paraguay
63
0.994
Liberia
136
0.806
Jamaica
64
0.678
Algeria
137
0.410
Romania
64
0.994
Nigeria
137
0.802
Senegal
65
0.678
Saudi Arabia
138
0.387
Croatia
65
0.994
Côte d'Ivoire
138
0.773
Ecuador
66
0.677
India
139
0.383
Lithuania
66
0.994
Mali
139
0.755
Spain
67
0.674
Morocco
140
0.378
Thailand
67
0.994
Ethiopia
140
0.741
Lesotho
68
0.672
Iran, Islamic Rep.
141
0.357
Belize
68
0.994
Angola
141
0.726
Albania
69
0.671
Jordan
142
0.350
Switzerland
69
0.993
Yemen
142
0.720
Macedonia, FYR
70
0.671
Pakistan
143
0.330
Brunei Darussalam
70
0.993
Guinea
143
0.707
Israel
71
0.671
Syria
144
0.279
Fiji
71
0.992
Benin*
144
0.700
South Africa
72
0.670
Yemen
145
0.225
Bulgaria
72
0.992
Chad
145
0.591
Montenegro
73
0.670
Mongolia
73
0.992
* New countries 2015
10 | The Global Gender Gap Report 2015
Note: Countries highlighted in blue have
reached parity on that subindex.
* New countries 2015
Part 1: Measuring the Global Gender Gap
Table 4: Rankings by subindex, 2015 (cont’d.)
HEALTH AND SURVIVAL
POLITICAL EMPOWERMENT
Country
Rank
Score
Country
Rank
Score
Country
Angola
1
0.980
Rank
Score
Country
Rank
Score
Switzerland
74
0.974
Iceland
1
0.719
Honduras
74
Argentina
1
0.160
0.980
Australia
74
0.974
Finland
2
0.607
Jamaica
75
Austria
0.155
1
0.980
Italy
74
0.974
Norway
3
0.559
Kyrgyz Republic
76
0.153
Bahamas
1
0.980
Zambia
77
0.974
Nicaragua
4
0.506
Barbados
77
0.150
Barbados
1
0.980
Malawi
78
0.973
Sweden
5
0.486
Kazakhstan
78
0.148
Belize
1
0.980
Slovenia
79
0.973
Ireland
6
0.474
Belarus
79
0.146
Bolivia
1
0.980
Portugal
79
0.973
Rwanda
7
0.452
Madagascar
80
0.142
Brazil
1
0.980
Serbia
79
0.973
Bangladesh
8
0.433
Dominican Republic
81
0.140
Cambodia
1
0.980
Kyrgyz Republic
79
0.973
India
9
0.433
Venezuela
82
0.139
Cape Verde
1
0.980
Slovak Republic
79
0.973
Bolivia
10
0.415
Czech Republic
83
0.134
Ecuador
1
0.980
Korea, Rep.
79
0.973
Germany
11
0.413
Lao PDR
84
0.132
El Salvador
1
0.980
Kenya
85
0.973
Cuba
12
0.407
Guinea
85
0.130
Estonia
1
0.980
Gambia, The*
85
0.973
Netherlands
13
0.401
Malta
86
0.128
Fiji
1
0.980
Ghana
87
0.973
South Africa
14
0.400
Pakistan
87
0.127
Finland
1
0.980
Botswana
87
0.973
New Zealand
15
0.390
Vietnam
88
0.124
France
1
0.980
Mauritania
87
0.973
Slovenia
16
0.385
Brazil
89
0.123
Guatemala
1
0.980
Madagascar
90
0.973
Philippines
17
0.382
Suriname
90
0.120
Guyana
1
0.980
Rwanda
91
0.972
Switzerland
18
0.376
Greece
91
0.120
Jamaica
1
0.980
Lao PDR
92
0.972
France
19
0.365
Singapore
92
0.119
Kazakhstan
1
0.980
Spain
93
0.972
Costa Rica
20
0.365
United Arab Emirates
93
0.115
Latvia
1
0.980
Nepal
94
0.972
Mozambique
21
0.361
Montenegro
94
0.114
Lesotho
1
0.980
Bangladesh
95
0.971
Argentina
22
0.347
Malawi
95
0.113
Mauritius
1
0.980
Morocco
95
0.971
United Kingdom
23
0.335
Ghana
96
0.112
Mexico
1
0.980
Egypt
97
0.971
Italy
24
0.331
Morocco
97
0.110
Mongolia
1
0.980
Dominican Republic
98
0.971
Cape Verde
25
0.329
Bahamas
98
0.110
Namibia
1
0.980
Iran, Islamic Rep.
99
0.971
Spain
26
0.326
Guatemala
99
0.109
Nicaragua
1
0.980
Oman
100
0.971
Senegal
27
0.316
Swaziland
100
0.109
Panama
1
0.980
Peru
101
0.970
Burundi
28
0.314
Korea, Rep.
101
0.107
Paraguay
1
0.980
Syria
102
0.970
Denmark
29
0.309
Zambia
102
0.107
Philippines
1
0.980
Lebanon
103
0.970
Estonia
30
0.308
Tajikistan
103
0.104
South Africa
1
0.980
Netherlands
104
0.970
Ecuador
31
0.297
Japan
104
0.103
Sri Lanka
1
0.980
Iceland
105
0.970
Tanzania
32
0.292
Turkey
105
0.103
Suriname
1
0.980
New Zealand
105
0.970
Namibia
33
0.287
Uruguay
106
0.101
Thailand
1
0.980
Denmark
107
0.970
Mexico
34
0.281
Ukraine
107
0.098
Trinidad and Tobago
1
0.980
Malta
108
0.970
Belgium
35
0.275
Gambia, The*
108
0.098
Turkey
1
0.980
Canada
109
0.969
Uganda
36
0.271
Cambodia
109
0.098
Uganda
1
0.980
Malaysia
110
0.969
Guyana
37
0.261
Fiji
110
0.097
Uruguay
1
0.980
Tunisia
111
0.969
Angola
38
0.251
Nigeria
111
0.097
Venezuela
1
0.980
Chad
112
0.968
Austria
39
0.246
Chad
112
0.093
Zimbabwe
1
0.980
Côte d'Ivoire
113
0.968
Latvia
40
0.246
Romania
113
0.090
Chile
41
0.979
Mozambique
114
0.968
Portugal
41
0.244
Georgia
114
0.089
Belarus
42
0.979
Cameroon*
115
0.968
Chile
42
0.243
Slovak Republic
115
0.087
Moldova
42
0.979
Guinea
116
0.967
Serbia
43
0.242
Mali
116
0.086
Lithuania
42
0.979
Benin*
117
0.967
Ethiopia
44
0.232
Mongolia
117
0.084
Colombia
42
0.979
Burkina Faso
117
0.967
Lithuania
45
0.227
Burkina Faso
118
0.083
Ukraine
42
0.979
Liberia
119
0.967
Canada
46
0.218
Côte d'Ivoire
119
0.081
Russian Federation
42
0.979
Georgia
120
0.967
Liberia
47
0.216
Mauritius
120
0.078
Romania
42
0.979
Macedonia, FYR
120
0.967
Bulgaria
48
0.215
Saudi Arabia
121
0.077
Bulgaria
42
0.979
Singapore
122
0.967
El Salvador
49
0.214
Paraguay
122
0.075
Hungary
42
0.979
Yemen
123
0.967
Albania
50
0.214
Jordan
123
0.073
Poland
42
0.979
Senegal
124
0.967
Panama
51
0.214
Cyprus
124
0.069
Croatia
42
0.979
Pakistan
125
0.967
Poland
52
0.213
Armenia
125
0.068
Czech Republic
42
0.979
Bhutan
126
0.966
Luxembourg
53
0.212
Botswana
126
0.068
Japan
42
0.979
Tajikistan
127
0.966
Israel
54
0.205
Benin*
127
0.067
Tanzania
55
0.979
Algeria
128
0.966
Algeria
55
0.205
Russian Federation
128
0.066
Ireland
56
0.979
Saudi Arabia
129
0.966
Trinidad and Tobago
56
0.201
Azerbaijan
129
0.063
Germany
56
0.979
Maldives
130
0.966
Mauritania
57
0.195
Syria
130
0.059
Greece
56
0.979
Brunei Darussalam
131
0.966
Moldova
58
0.195
Thailand
131
0.057
Ethiopia
59
0.978
Jordan
132
0.966
Sri Lanka
59
0.193
Bhutan
132
0.056
Indonesia
60
0.976
Nigeria
133
0.961
Croatia
60
0.193
Maldives
133
0.055
Honduras
61
0.976
Swaziland
133
0.961
Australia
61
0.193
Malaysia
134
0.051
Montenegro
62
0.975
Bahrain
133
0.961
Kenya
62
0.182
Belize
135
0.048
Cuba
63
0.975
United Arab Emirates
133
0.961
Cameroon*
63
0.180
Egypt
136
0.048
United States
64
0.975
Qatar
137
0.957
Colombia
64
0.180
Iran, Islamic Rep.
137
0.037
Costa Rica
64
0.975
Kuwait
137
0.957
Macedonia, FYR
65
0.178
Bahrain
138
0.037
Belgium
66
0.974
Vietnam
139
0.950
Zimbabwe
66
0.175
Hungary
139
0.035
United Kingdom
66
0.974
Azerbaijan
139
0.950
Peru
67
0.173
Yemen
140
0.026
Burundi
68
0.974
Mali
141
0.949
Lesotho
68
0.172
Kuwait
141
0.022
Israel
69
0.974
Albania
142
0.947
Tunisia
69
0.170
Oman
142
0.021
Norway
70
0.974
India
143
0.942
Nepal
70
0.169
Lebanon
143
0.021
Sweden
71
0.974
Armenia
144
0.939
Indonesia
71
0.168
Qatar
144
0.013
Luxembourg
71
0.974
China
145
0.919
United States
72
0.162
Brunei Darussalam
145
0.000
Cyprus
73
0.974
China
73
0.162
Note: Countries highlighted in blue have
reached parity on that subindex.
* New countries 2015
* New countries 2015
The Global Gender Gap Report 2015 | 11
Part 1: Measuring the Global Gender Gap
Figure 2: Global Gender Gap Index, 2015
Yemen
Pakistan
Sweden
Syria
0.0
0.2
Iceland
Norway, Finland
0.4
0.6
Global Gender Gap Index score (0.0–1.0 scale)
0.8
1.0
Source: Global Gender Gap Index 2015.
Note: Blue diamond corresponds to the global average.
While 10 countries—Austria, Bahamas, Brazil,
France, Finland, Guyana, Latvia, Lesotho, Nicaragua, and
Namibia—have fully closed the gap on both the Health
and Survival and Educational Attainment subindexes, no
country has closed either the Economic Participation and
Opportunity or Political Empowerment gaps.
On the Economic Participation and Opportunity
subindex, 14 countries, including four from Sub-Saharan
Africa and five from Europe and Central Asia, have closed
more than 80% of the gap. Norway, Barbados, Burundi,
Sweden and Iceland occupy the top five spots on this
subindex. Sixteen countries have closed less than 50% of
the economic participation and opportunity gap, including
11 from the Middle East and North Africa region. Iran,
Jordan, Pakistan, Syria and Yemen hold the last five
spots on this subindex. Thirty-one countries are below
world average (weighted by population) on that subindex.
The Country Profiles include further data on employment
and leadership, such as part-time employment, workers
in informal employment or the percentage of female top
managers.
On the Political Empowerment subindex, only Iceland
and Finland have closed more than 60% of the gender
gap; 39 countries have closed less than 10% of the
gap. Yemen, Kuwait, Oman, Lebanon, Qatar, and Brunei
Darussalam have the lowest rankings on this subindex,
having closed less than 3% of the political gender gap. 101
countries are below world average (weighted by population)
and Brunei Darussalam still has a score of zero on that
subindex, with no representation of women. The Country
Profiles also present detailed information on parliamentary
quota type and voluntary political party quotas.
Figure 3 illustrates the range of country scores for
the four subindexes. The population-weighted average for
each subindex is highlighted by blue diamonds. Health
and Survival is the closest to reaching universal gender
parity, followed by Educational Attainment, Economic
Participation and Opportunity, and, lastly, Political
Figure 3: Global Gender Gap subindex, 2015
Yemen
Syria
Pakistan
Norway
Economic Participation
and Opportunity
Chad
Benin
Educational Attainment
China
Health and Survival
Brunei Darussalam
Nicaragua
Finland
Iceland
Political Empowerment
Norway
0.0
Source: Global Gender Gap Index 2015.
Note: Blue diamonds correspond to subindex averages.
12 | The Global Gender Gap Report 2015
0.2
0.4
0.6
Global Gender Gap Index score (0.0–1.0 scale)
0.8
1.0
Part 1: Measuring the Global Gender Gap
Empowerment. The widest range in scores is found on the
Political Empowerment subindex, followed by Economic
Participation and Opportunity. Norway tops the Economic
Participation and Opportunity subindex and Yemen is the
worst performing country. Chad clearly lags behind the
rest of the world on Educational Attainment and China
is the worst performing country on Health and Survival.
Iceland tops the Political Empowerment subindex, followed
by Finland and Norway. Brunei Darussalam is the worst
performing country in this subindex, with a score of 0.
Performance by Region, 2015
Table 5 (page 15) displays the rankings by regional
classification, organized by rank within each regional
group. In 2015, eight out of the 24 countries from Asia
and the Pacific have closed over 70% of the gap, with
the Philippines, New Zealand and Australia in the lead. At
the bottom end of the rankings, two countries from the
region—Iran and Pakistan—have closed less than 60% of
the gender gap. In Latin America and the Caribbean, 14 of
the 26 countries in the region have closed over 70% of the
gender gap. Nicaragua, Bolivia and Barbados occupy the
top three spots. The lowest-ranked country in the region—
Paraguay—has closed a little over 65% of its gender gap.
In the Middle East and North Africa region, only Israel has
closed over 70% of the gender gap, while six countries
have closed less than 60% of the gender gap. Canada
and the United States have both closed nearly 75% of the
gender gap. In Sub-Saharan Africa, out of 28 countries
covered, 14 have closed over 70% of the gender gap, with
Rwanda, Namibia and South Africa in the lead, while two
countries—Mali and Chad—have closed less than 60% of
the gap. In Europe and Central Asia, out of 46 countries,
five countries have closed over 80% of the gap, while 15
countries have closed less than 70%.
Figures 4 through 8 (page 14) show the range of
scores for the overall Index and the four subindexes by
region. In addition population-weighted group averages
are provided in each figure. Readers should note that the
figures for the Global Index, Economic Participation and
Opportunity subindex and Political Empowerment subindex
display the full scale of 0.00 to 1.00 while the figures
for the Health and Survival and Educational Attainment
subindexes display the scale from 0.50 to 1.00 in order to
improve visual clarity. This particular distinction in scales
for the four subindexes is used in all relevant figures in this
chapter.
Figure 4 shows the range of country scores within
each region as well as regional averages on the overall
Global Gender Gap Index. North America holds the
top spot, with the United States and Canada at almost
the same score. Europe and Central Asia is next with a
wide spread among the 46 countries covered. The Latin
America and the Caribbean region follows, with a regional
group average of just over 70% of the gap being closed.
Next is Sub-Saharan Africa, followed by Asia and the
Pacific. Last in order of average scores is the Middle East
and North Africa.
Figure 5 displays the Economic Participation and
Opportunity subindex results by region. North America has
the highest average score (82% of its economic gender
gap is closed), followed by Sub-Saharan Africa, Europe
and Central Asia, Latin America and the Caribbean, Asia
and the Pacific and Middle East and North Africa, where
only 40% of the economic gender gap has been closed.
There are significant variations within regions, with clear
laggards and leaders.
Figure 6 displays the Educational Attainment subindex
results by region. North America is again in the lead,
followed by Latin America and the Caribbean and Europe
and Central Asia. Each of these regions has closed
over 99% of the gender gap. Asia and the Pacific and
Middle East and North Africa follow next, having closed,
respectively, 95% and 93%of the education gender gap. The
lowest average comes from Sub-Saharan Africa at 84%.
Figure 7 displays the Health and Survival subindex
results by region. While all regions are close to parity,
differences in averages are driven primarily by a few
underperforming countries in some regions, particularly in
Asia and the Pacific, Sub-Saharan Africa and Europe and
Central Asia.
Figure 8 displays the Political Empowerment subindex
results by region. In terms of averages, the highestranking region is Asia and the Pacific (26% of its political
empowerment gender gap is closed), followed by Europe
and Central Asia (23%), although the three highest scoring
countries are in Europe and Central Asia. In order of
regional averages, Latin America and the Caribbean (20%),
Sub-Saharan Africa (19%), North America (17%) and Middle
East and North Africa (9%) follow next.
Performance by Income Group, 2015
Table 6 (page 17) displays the rankings by income
group (Table A2 in Appendix A displays the income group
categories used). In 2015, among the 52 countries in the
high-income group, the Nordic countries lead the way
while Bahrain, Saudi Arabia and Oman are the lowest
performing countries in this category. Among the 39
countries in the upper-middle income group, Namibia,
South Africa, Cuba, Ecuador and Belarus lead the way;
Algeria, Turkey, Lebanon, Jordan and Iran occupy the
last spots. In the lower-middle income group, out of 35
countries, Philippines, Nicaragua, Bolivia, Moldova, and
Kenya take the top five places, whereas Morocco, Syria,
Pakistan, Yemen and Zambia occupy the last five spots.
In the low-income group, out of 18 countries, Rwanda,
Burundi, Mozambique, Tanzania, and Zimbabwe come out
on top and Ethiopia, Benin, Guinea, Mali and Chad hold
the last spots.
Figures 9 through 13 (page 18) show the range
of scores for the overall Index and the four subindexes
The Global Gender Gap Report 2015 | 13
Part 1: Measuring the Global Gender Gap
Figure 4: Global Gender Gap Index 2015, by region
Asia and the Pacific
Latin America and the Caribbean
Middle East and North Africa
Sub-Saharan Africa
Europe and Central Asia
North America
0.0
0.2
0.4
0.6
0.8
1.0
Global Gender Gap Index score (0.0–1.0 scale)
Figure 5: Economic Participation and Opportunity subindex
2015, by region
Figure 6: Educational Attainment subindex 2015, by region
Asia and
the Pacific
Asia and
the Pacific
Latin America
and the Caribbean
Latin America
and the Caribbean
Middle East and
North Africa
Middle East and
North Africa
Sub-Saharan
Africa
Sub-Saharan
Africa
Europe and
Central Asia
Europe and
Central Asia
North America
North America
0.0
0.2
0.4
0.6
0.8
0.5
1.0
0.6
Economic Participation and Opportunity
subindex score (0.0–1.0 scale)
0.7
0.8
0.9
1.0
Educational Attainment
subindex score (0.0–1.0 scale)
Figure 7: Health and Survival subindex 2015, by region
Figure 8: Political Empowerment subindex 2015, by region
Asia and
the Pacific
Asia and
the Pacific
Latin America
and the Caribbean
Latin America
and the Caribbean
Middle East and
North Africa
Middle East and
North Africa
Sub-Saharan
Africa
Sub-Saharan
Africa
Europe and
Central Asia
Europe and
Central Asia
North America
North America
0.5
0.6
0.7
0.8
Health and Survival
subindex score (0.0–1.0 scale)
0.9
1.0
0.0
0.2
0.4
0.6
0.8
Political Empowerment
subindex score (0.0–1.0 scale)
Source (Figures 4–8): Global Gender Gap Index 2015; World Bank World Development Indicators (WDI) online database, accessed July 2015.
Notes (Figures 4–8): Colored diamonds correspond to regional averages. Regional classification details are in Appendix A. The X axis has been truncated on Figures 6 and 7 to enhance readability.
14 | The Global Gender Gap Report 2015
1.0
Part 1: Measuring the Global Gender Gap
Table 5: Rankings by region, 2015
ASIA AND THE PACIFIC
Country
Philippines
New Zealand
Australia
Lao PDR
Singapore
Mongolia
Thailand
Bangladesh
Vietnam
Sri Lanka
Brunei Darussalam
China
Indonesia
Japan
India
Cambodia
Nepal
Malaysia
Maldives
Korea, Rep.
Bhutan
Fiji
Iran, Islamic Rep.
Pakistan
LATIN AMERICA AND THE CARIBBEAN
Overall rank
Overall score
7
10
36
52
54
56
60
64
83
84
88
91
92
101
108
109
110
111
113
115
118
121
141
144
0.790
0.782
0.733
0.713
0.711
0.709
0.706
0.704
0.687
0.686
0.684
0.682
0.681
0.670
0.664
0.662
0.658
0.655
0.652
0.651
0.646
0.645
0.580
0.559
Country
Nicaragua
Bolivia
Barbados
Cuba
Ecuador
Argentina
Costa Rica
Bahamas
Colombia
Panama
Trinidad and Tobago
El Salvador
Jamaica
Guyana
Mexico
Chile
Venezuela
Honduras
Brazil
Dominican Republic
Peru
Uruguay
Suriname
Belize
Guatemala
Paraguay
MIDDLE EAST AND NORTH AFRICA
Overall rank
Overall score
12
22
24
29
33
35
38
40
42
44
46
62
65
66
71
73
78
80
85
86
89
93
94
103
106
107
0.776
0.749
0.744
0.740
0.738
0.734
0.732
0.728
0.725
0.722
0.720
0.706
0.703
0.702
0.699
0.698
0.691
0.688
0.686
0.686
0.683
0.679
0.678
0.668
0.667
0.666
Country
Israel
Kuwait
United Arab Emirates
Qatar
Bahrain
Tunisia
Algeria
Mauritania
Saudi Arabia
Oman
Egypt
Lebanon
Morocco
Jordan
Syria
Yemen
Overall rank
Overall score
53
117
119
122
123
127
128
132
134
135
136
138
139
140
143
145
0.712
0.646
0.646
0.645
0.644
0.634
0.632
0.613
0.605
0.604
0.599
0.598
0.593
0.593
0.568
0.484
(Continued on next page)
by income group. In addition, population-weighted group
averages are provided.
Figure 9 (page 18) shows the range of country
scores within each income group as well as income-group
averages on the overall Global Gender Gap Index. Highincome countries have the highest average score (72%),
followed by upper middle-income countries (68%), lowincome countries (68%) and lower middle-income countries
(nearly 66%).
Figure 10 (page 18) displays the Economic
Participation and Opportunity subindex scores by income
group. High-income countries (71%) are again in the lead,
followed by low-income countries (68%). Next are upper
middle-income countries (63%) and in the last place are
lower middle-income countries (49%).
Figure 11 (page 18) displays the Educational
Attainment subindex scores by income group. High-income
countries have nearly closed the gap in education (99.5%)
while upper-middle income countries are close behind
(98.4%). Lower-middle income countries, however, have
more mixed performance, with countries that have fully
closed the gap as well as countries that have closed just
a little over 70% of it and a mean of 90.6%. Low-income
countries are farthest behind at 84%.
Figure 12 (page 18) displays the Health and Survival
Subindex scores by income group. All income groups,
except the upper-middle income group have closed over
95% of the health gap, with high-income countries in the
lead followed by low income, lower-middle income and
upper-middle income countries. Because the averages
are weighted by population size, and in an otherwise
fairly homogenous subindex, India and China’s poor
performances in the upper-middle and lower-middle
income categories drive the income group order by
average.
Figure 13 (page 18) displays the Political
Empowerment subindex scores by income group. Lowermiddle income (30%) and low-income (21.4%) countries
trump high-income (21.0%) countries by a few decimal
points and upper-middle income (16.3%) countries on
Political Empowerment averages by income group.
Nonetheless, the highest scoring country on this subindex
belongs to the high-income group.
Appendix B illustrates the spread in 2015 of the data
for male and female values for all 14 indicators used in the
Index in a single visualization. Appendix C contains detailed
data tables, in rank order, for all 14 indicators included in
the Index for all countries where data was available in 2015.
Country Results
Country results are organized by region in this section.
Europe and Central Asia
Europe and Central Asia has closed 72% of its overall
gender gap. The region continues to rank second globally
behind North America. Out of the 46 countries of the
region, 32 countries have increased their overall score
compared to last year, while 14 have seen it decreasing.
The Global Gender Gap Report 2015 | 15
Part 1: Measuring the Global Gender Gap
Table 5: Rankings by region, 2015 (cont’d.)
SUB-SAHARAN AFRICA
Country
Rwanda
Namibia
South Africa
Burundi
Mozambique
Kenya
Tanzania
Cape Verde
Botswana
Zimbabwe
Uganda
Lesotho
Ghana
Malawi
Senegal
Madagascar
Cameroon*
Gambia, The*
Swaziland
Liberia
Burkina Faso
Zambia
Mauritius
Ethiopia
Nigeria
Angola
Benin*
Guinea
Côte d'Ivoire
Mali
Chad
EUROPE AND CENTRAL ASIA
Overall rank
Overall score
6
16
17
23
27
48
49
50
55
57
58
61
63
68
72
74
90
98
102
112
114
116
120
124
125
126
129
131
133
137
142
0.794
0.760
0.759
0.748
0.741
0.719
0.718
0.717
0.710
0.709
0.708
0.706
0.704
0.701
0.698
0.698
0.682
0.674
0.670
0.652
0.651
0.650
0.646
0.640
0.638
0.637
0.625
0.618
0.606
0.599
0.580
* New countries 2015
Country
Iceland
Norway
Finland
Sweden
Ireland
Switzerland
Slovenia
Germany
Netherlands
Denmark
France
United Kingdom
Belgium
Latvia
Estonia
Spain
Moldova
Lithuania
Luxembourg
Belarus
Austria
Portugal
Italy
Bulgaria
Serbia
Kazakhstan
Poland
Croatia
Ukraine
Macedonia, FYR
Albania
Russian Federation
Kyrgyz Republic
Romania
Montenegro
Czech Republic
Georgia
Greece
Tajikistan
Azerbaijan
Slovak Republic
Hungary
Cyprus
Malta
Armenia
Turkey
The region’s score has improved compared to 2014 on
all subindexes except Educational Attainment. Similar
to last year, the biggest improvement is on the Political
Empowerment subindex. Having closed 69% of its
economic gender gap, the region ranks third on this
subindex just after North America and Sub-Saharan
Africa. It also ranks third on the Educational Attainment
subindex, although 99% of the education gender gap has
been closed. On both the Health and Survival and Political
Empowerment subindexes, the region ranks second,
having closed 98% and 23% of the gap, respectively.
Forty countries from the region have been included
in the Index since 2006. Compared to the other regions,
16 | The Global Gender Gap Report 2015
NORTH AMERICA
Overall rank
Overall score
1
2
3
4
5
8
9
11
13
14
15
18
19
20
21
25
26
31
32
34
37
39
41
43
45
47
51
59
67
69
70
75
76
77
79
81
82
87
95
96
97
99
100
104
105
130
0.881
0.850
0.850
0.823
0.807
0.785
0.784
0.779
0.776
0.767
0.761
0.758
0.753
0.752
0.749
0.742
0.742
0.740
0.738
0.734
0.733
0.731
0.726
0.722
0.720
0.719
0.715
0.708
0.702
0.701
0.701
0.694
0.693
0.693
0.689
0.687
0.687
0.685
0.675
0.675
0.675
0.672
0.671
0.668
0.668
0.624
Country
United States
Canada
Overall rank
Overall score
28
30
0.740
0.740
Europe and Central Asia has experienced the fourth largest
absolute increase on the overall Index. On the Economic
Participation and Opportunity subindex, the region shows
the third largest absolute increase after both North America
and Latin America and the Caribbean. On the Educational
Attainment subindex, the region experienced the smallest
absolute score increase relative to other regions. On the
Health and Survival subindex, the region shows the second
largest absolute increase, and on the fourth subindex, it
has demonstrated the fourth largest increase, ahead of
Sub-Saharan Africa and North America.
Similar to last year, the top five spots on the overall
Index are occupied by countries from this region. Out
Part 1: Measuring the Global Gender Gap
Table 6: Rankings by income group, 2015
LOW INCOME
(US$ 1,045 OR LESS)
Country
Rwanda
Burundi
Mozambique
Tanzania
Zimbabwe
Uganda
Malawi
Madagascar
Gambia, The*
Cambodia
Nepal
Liberia
Burkina Faso
Ethiopia
Benin*
Guinea
Mali
Chad
LOWER-MIDDLE INCOME
(US$ 1,046–4,125)
Overall rank
Overall score
6
23
27
49
57
58
68
74
98
109
110
112
114
124
129
131
137
142
0.794
0.748
0.741
0.718
0.709
0.708
0.701
0.698
0.674
0.662
0.658
0.652
0.651
0.640
0.625
0.618
0.599
0.580
Country
Philippines
Nicaragua
Bolivia
Moldova
Kenya
Cape Verde
Lao PDR
Lesotho
El Salvador
Ghana
Bangladesh
Guyana
Ukraine
Senegal
Kyrgyz Republic
Honduras
Georgia
Vietnam
Sri Lanka
Cameroon*
Indonesia
Tajikistan
Swaziland
Armenia
Guatemala
India
Zambia
Bhutan
Nigeria
Mauritania
Côte d'Ivoire
Egypt
Morocco
Syria
Pakistan
Yemen
UPPER-MIDDLE INCOME
(US$ 4,126–12,735)
Overall rank
Overall score
7
12
22
26
48
50
52
61
62
63
64
66
67
72
76
80
82
83
84
90
92
95
102
105
106
108
116
118
125
132
133
136
139
143
144
145
0.790
0.776
0.749
0.742
0.719
0.717
0.713
0.706
0.706
0.704
0.704
0.702
0.702
0.698
0.693
0.688
0.687
0.687
0.686
0.682
0.681
0.675
0.670
0.668
0.667
0.664
0.650
0.646
0.638
0.613
0.606
0.599
0.593
0.568
0.559
0.484
Country
Namibia
South Africa
Cuba
Ecuador
Belarus
Costa Rica
Colombia
Bulgaria
Panama
Serbia
Kazakhstan
Botswana
Mongolia
Thailand
Jamaica
Macedonia, FYR
Albania
Mexico
Romania
Montenegro
Brazil
Dominican Republic
Peru
China
Suriname
Azerbaijan
Belize
Paraguay
Malaysia
Maldives
Mauritius
Fiji
Angola
Tunisia
Algeria
Turkey
Lebanon
Jordan
Iran, Islamic Rep.
HIGH INCOME
(US$ 12,736 OR MORE)
Overall rank Overall score
16
17
29
33
34
38
42
43
44
45
47
55
56
60
65
69
70
71
77
79
85
86
89
91
94
96
103
107
111
113
120
121
126
127
128
130
138
140
141
0.760
0.759
0.740
0.738
0.734
0.732
0.725
0.722
0.722
0.720
0.719
0.710
0.709
0.706
0.703
0.701
0.701
0.699
0.693
0.689
0.686
0.686
0.683
0.682
0.678
0.675
0.668
0.666
0.655
0.652
0.646
0.645
0.637
0.634
0.632
0.624
0.598
0.593
0.580
Country
Iceland
Norway
Finland
Sweden
Ireland
Switzerland
Slovenia
New Zealand
Germany
Netherlands
Denmark
France
United Kingdom
Belgium
Latvia
Estonia
Barbados
Spain
United States
Canada
Lithuania
Luxembourg
Argentina
Australia
Austria
Portugal
Bahamas
Italy
Trinidad and Tobago
Poland
Israel
Singapore
Croatia
Chile
Russian Federation
Venezuela
Czech Republic
Greece
Brunei Darussalam
Uruguay
Slovak Republic
Hungary
Cyprus
Japan
Malta
Korea, Rep.
Kuwait
United Arab Emirates
Qatar
Bahrain
Saudi Arabia
Oman
Overall rank Overall score
1
2
3
4
5
8
9
10
11
13
14
15
18
19
20
21
24
25
28
30
31
32
35
36
37
39
40
41
46
51
53
54
59
73
75
78
81
87
88
93
97
99
100
101
104
115
117
119
122
123
134
135
0.881
0.850
0.850
0.823
0.807
0.785
0.784
0.782
0.779
0.776
0.767
0.761
0.758
0.753
0.752
0.749
0.744
0.742
0.740
0.740
0.740
0.738
0.734
0.733
0.733
0.731
0.728
0.726
0.720
0.715
0.712
0.711
0.708
0.698
0.694
0.691
0.687
0.685
0.684
0.679
0.675
0.672
0.671
0.670
0.668
0.651
0.646
0.646
0.645
0.644
0.605
0.604
Note: Income classifications are taken from the World Bank, which classifies economies into four income categories based on GNI per capita: high income, upper-middle income, lower-middle income and
low income.
* New countries 2015
of the top 20 performing countries on the index, 14 are
from the region (two more than last year). Austria, Finland,
France and Latvia are the four countries from the region
that have fully closed both their Educational Attainment and
Health and Survival gender gaps. Out of the 25 countries
that have fully closed their Educational Attainment gender
gaps, 12 countries are from this region. However, on the
Health and Survival subindex, Azerbaijan, Albania and
Armenia are among the 10 lowest-performing countries.
On the Economic Participation and Opportunity subindex,
eight countries from the region are among the top 20
performing countries, which is one more than last year. The
lowest-performing countries on that subindex are Malta
and Turkey. Ten out of the 20 top-performing countries
The Global Gender Gap Report 2015 | 17
Part 1: Measuring the Global Gender Gap
Figure 9: Global Gender Gap Index 2015, by income group
High income
Upper-middle income
Lower-middle income
Low income
0.0
0.2
0.4
0.6
Global Gender Gap Index score (0.0–1.0 scale)
Figure 10: Economic Participation and Opportunity subindex
2015, by income group
High income
Upper-middle
income
Upper-middle
income
Lower-middle
income
Lower-middle
income
Low income
Low income
0.2
0.4
0.6
0.8
1.0
0.5
0.6
Economic Participation and Opportunity
subindex score (0.0–1.0 scale)
High income
Upper-middle
income
Upper-middle
income
Lower-middle
income
Lower-middle
income
Low income
Low income
0.7
0.8
Health and Survival
subindex score (0.0–1.0 scale)
0.9
0.8
0.9
1.0
Figure 13: Political Empowerment subindex 2015, by income
group
High income
0.6
0.7
Educational Attainment
subindex score (0.0–1.0 scale)
Figure 12: Health and Survival subindex 2015, by income
group
0.5
1.0
Figure 11: Educational Attainment subindex 2015, by income
group
High income
0.0
0.8
1.0
0.0
0.2
0.4
0.6
0.8
1.0
Political Empowerment
subindex score (0.0–1.0 scale)
Source (Figures 9–13): Global Gender Gap Index 2015.
Notes (Figures 9–13): Colored diamonds correspond to income group averages. Details on income groups can be found in Appendix A. The X axis has been truncated on Figures 11 and 12 to enhance
readability.
18 | The Global Gender Gap Report 2015
Part 1: Measuring the Global Gender Gap
on the Political Empowerment subindex—including four
countries in the top five: Iceland, Finland, Norway and
Sweden—are from Europe and Central Asia. On the Labour
force participation indicator, eight countries from the region
are part of the 20 best-performing countries. On the Sex
ratio at birth indicator, six out of the 10 lowest performing
countries are from the region, with Armenia ranking in the
second last position. On the Women in ministerial positions
indicator, 13 out of the 20 best-performing countries are
from the region, with Finland ranking in first place.
Iceland (1) is for the seventh year in a row the top
performer country on the overall Index. From 2006, the
country experienced a steady increase of its overall score,
except last year when the country showed a decrease
mostly due to a slight fall on the Health and Survival and
Political Empowerment subindexes. Iceland is among the
top three countries from the region that have improved
the most compared to 2006 on their overall Index and
Political Empowerment subindex scores. This year,
Iceland’s improvement on the Economic Participation
and Opportunity subindex score translated into a gain of
two ranks (from the 7th to the 5th position). As of 2009,
the country has fully closed its educational gender gap
and ranks first on the Political Empowerment subindex.
In Iceland, 41% of parliamentarians are women, 44% of
ministers are women and, out of the last 50 years, 20
were spent with a female head of state. Iceland ranks
105th on the Health and Survival subindex, gaining 23
places compared to last year. Iceland’s low score on that
subindex is due to its performance on the Healthy life
expectancy indicator. Iceland is also a strong performer
on the contextual indicators provided in the report but
not included in the Index. Iceland is among the top three
countries on the ability of women to rise to positions of
enterprise leadership. It is also the country with the longest
paternity coverage, with 90 calendar days entitled to new
fathers, one among many policies in the country (and in
other Nordic countries) to help parents combine work and
family.
Norway (2) is back in the second position after
having lost that place to Finland for three consecutive
years. This gain comes mainly from improvements in
Economic, Health and Political subindexes. Norway is the
highest-ranking country on the Economic Participation and
Opportunity subindex and the third highest on the Political
Empowerment subindex. The country ranks 32nd on the
Educational Attainment subindex and 70th on the Health
and Survival subindex—due to very small differences in
performance of the countries near the top—but scores
very high. The country is among the top twenty best
performers on the following five indicators: Labour force
participation, Wage equality for similar work, Women in
parliament, Women in ministerial position and Years with
female head of state. Norway is also the top country overall
on the share of women on boards of listed companies, with
37%, as well as the second best-performing country on
the Ability of women to rise to positions of leadership. The
country presents as well the smallest difference between
the average minutes spent per day on unpaid work by men
and women.
Finland (3) fell one place and now sits in the third
position on the overall Index. Finland however remains
the highest-ranked country from the European Union. It
ranks 8th on the Economic Participation and Opportunity
subindex, gaining 13 places compared to last year, mostly
due to improvements on the Wage equality for similar work
indicator. Finland is one of four countries from the region
that has fully closed gender gaps on both the Educational
Attainment and Health and Survival subindexes. Similar
to last year, Finland ranks second on the Political
Empowerment subindex. It is the third-ranked country from
the region on both the Labour force participation and Wage
equality for similar work indicators. Finland is also the topperforming country on the Women in ministerial positions
indicator and has a government that is 63% women.
Sweden (4) ranks fourth for the seventh consecutive
year. The country ranks 4th on the Economic Participation
and Opportunity subindex, an increase of 11 places
compared with last year, due to improvements on the
Perceived wage equality for similar work, the Estimated
earned income and the Legislators, senior officials and
managers indicators. The country has seen its subindex
score on Educational Attainment decrease slightly due to
a drop on the Enrolment in secondary education score.
On the other hand, its Health and Survival subindex score
improved from last year. The country continues to rank
5th on the Political and Empowerment subindex. Despite
its high score on that subindex, Sweden is one of three
countries from the region with a smaller score increase
compared to 2006.
Ireland (5) gained three places compared to last
year, mainly due to improvements on the Economic and
Political subindexes. Ireland is among the top 10 bestperforming countries on the Political Empowerment
subindex. It is also one of the best three climbers from
the region on the Health and Survival subindex compared
to 2006. Finally, Ireland is the highest-ranked country
from the region (ranking 3rd overall) on the Years with
female head of state indicator. Switzerland (8) re-enters
the top 10, gaining three places compared to last year.
This is mostly due to improvements on the Economic
Participation and Opportunity as well as the Education and
Political subindexes. This year, Switzerland ranks 17th on
the Economic and Opportunity subindex and 18th on the
Political Empowerment subindex. Switzerland is among
the top 20 top-performing countries on both Women in
ministerial positions and Years with female head of state
indicators. Compared with 2006, Switzerland is among
the top three climbers from the region on the Educational
Attainment subindex. Switzerland continues to be the
fourth-highest ranked country overall on the percentage of
The Global Gender Gap Report 2015 | 19
Part 1: Measuring the Global Gender Gap
female part-time employment compared to the total female
employment.
Next is Slovenia (9), which enters for the first time
the top 10 countries on the overall Index. Out of the 109
countries that have been part of the Index since 2006,
Slovenia has shown the fourth largest increase and the
largest increase from the Europe and Central Asia region.
Since 2006, all its subindexes scores have improved. The
biggest improvements have come from the Economic
Participation and Opportunity subindex and, in particular,
the Political Empowerment subindex. This year, Slovenia
ranks 21st on the Women in parliament indicator and
10th on the Women in ministerial positions indicator, with
women representing 44% of ministers (whereas it was 18%
last year). After Iceland, Slovenia has the second highest
length of paid paternity leave.
Germany (11) follows next. The country has seen its
overall score slightly increase compared to last year, due
to better performance on the Health and Survival and
the Political Empowerment subindexes. The increase has
been offset by a decrease on the Economic Participation
and Opportunity and Educational Attainment subindexes.
The country’s ten-year evolution is characterized by two
ups and downs; however, compared to 2006, Germany’s
overall score has improved. This year, the country ranks
38th on the Economic Participation and Opportunity
subindex, and 11th (similar to last year) on the Political
Empowerment subindex. Out of the 40 countries that
have provided data on the percentage share of women
on boards of listed companies, Germany has one of the
lowest percentages (2.8%). Germany shares with 10 other
countries the second lowest total fertility rate (1.4 children
per woman).
The Netherlands (13) ranks thirteenth on the overall
Index this year, gaining one position. It remains the
country with the highest percentage of female part-time
employment compared to total female employment (77%).
Despite the high level of male part-time employment,
Netherlands is the country with the largest difference
between female and male part-time employment. Next is
Denmark (14) at the fourteenth position, its lowest place
since the creation of the Index. Compared to 2006, its
overall score has steadily improved, but there have been
significant decreases from last year on the Economic,
Health and Political subindexes. Denmark remains the
country with the highest average minutes spent per day
by men on unpaid work. Denmark is followed by France
(15), which gained one place compared to last year due
to improvement on the Political Empowerment subindex.
This improvement has been slightly offset by a decrease
on the Economic Participation and Opportunity subindex.
Compared to 2006, France’s evolution is characterized
by two peaks, one in 2008 and one this year. France
is the second country from the region with the highest
increase compared to 2006 on the overall Index but also
on the Economic Participation and Opportunity subindex.
20 | The Global Gender Gap Report 2015
France has also achieved the third highest increase from
the region on the Political Empowerment subindex. In this
year’s ranking, France is among the four countries from the
region that have closed both their Educational and Health
gender gaps. France is also among the four countries that
rank first on the Women in Ministerial positions, with 50%
of Women in ministerial position. France is the lowestranked country from the region on the Wage equality for
similar work indicator, sitting at 132nd position out of 134
countries. Regarding the share of women on boards of
listed companies, France is ranked second, after Norway.
The United Kingdom (18) re-enters the top 20
countries on the overall Index, gaining eight places over
last year. This increase is due to improvements on the
Economic, Health and Political subindexes. The country’s
ten-year evolution is characterized by three decreases: in
2008, 2012 and 2014. Next are Belgium (19) and Latvia
(20). Belgium lost nine places and Latvia five places
compared to 2014. In the case of Belgium, this is mostly
due to a decrease on the Health and Survival and Political
Empowerment subindexes. The percentage of women in
ministerial position has dropped from 42% to 23% in a
year. For Latvia, the reason is a decrease on the Economic
Participation and Opportunity and Political Empowerment
subindexes. Latvia remains one of the four countries from
the region that has closed both its Educational Attainment
and Health and Survival gender gaps. In addition, Latvia is
among the three countries with the highest percentage of
female research and development personnel.
Estonia (21) made the largest score improvement from
the region compared to 2014, mostly due to significant
improvement on the Political Empowerment subindex.
The percentage of women in parliament increased from
19% to 24% and the percentage of women in ministerial
positions increased from 17% to 46%. This year’s score
is the highest Estonia has achieved in the past 10 years.
Spain ranks 25th, followed by Moldova (26). Over the past
10 years, Spain experienced an increase on its Economic
Participation and Opportunity subindex score, whereas
the Political Empowerment subindex score has gradually
decreased, despite a peak in 2010 and 2011. Spain
experienced the second largest decrease on this subindex
over the past 10 years. Its overall Index score has mirrored
that peak during the same years.
Lithuania (31), Luxembourg (32) and Belarus (34)
follow next. This year, Lithuania ranks 14th globally on the
Labour force participation indicator, between Sweden and
Denmark. Luxembourg is the country from the region with
the largest improvement on the Economic Participation
and Opportunity subindex compared to 2006. Belarus
is the highest-ranked country from the region on the
Legislators, senior officials and managers and Professional
and technical workers indicators, with 44% of leadership
positions held by women and 73% of Professional and
technical workers occupied by women. Belarus is also the
top country from the region in the upper-middle income
Part 1: Measuring the Global Gender Gap
group. Out of the 95 countries that have provided data
for the Firms with female top manager indicator, Belarus
has the third largest percentage overall after Mongolia and
Bahamas.
Austria (37) has seen a small decrease from 2014
of its overall score. Austria is the third country from the
region with the largest improvement on the Economic
Participation and Opportunity subindex over the past 10
years.
Austria is followed by Portugal (39) and Italy (41).
Italy has shown a steady increase on its overall score
with the exceptions of 2010 and 2012. The increase of
the overall score has been driven over the past three
years by improvements on the Political Empowerment
subindex. Italy gained 28 positions over 2014, mostly on its
Political Empowerment subindex due to an increase in the
percentage of women in parliament and women holding
ministerial positions. This year, Italy is again among the
three lowest-performing countries from the region on the
Economic Participation and Opportunity subindex (together
with Malta and Turkey). This year, the country ranks 91st
overall on the Labour force participation indicator and
109th on wage equality for similar work. Bulgaria (43)
is next at the 43rd position. Bulgaria had experienced
last year a peak in its overall score, which was due to
improvements on both the Economic Participation and
Opportunity and Political Empowerment subindexes. This
year, these two subindexes have seen their score decrease
again, influencing the overall score in the same direction.
Following next are Serbia (45), Kazakhstan (47), Poland
(51) and Croatia (59). Croatia is the country from the region
with the largest decrease on the overall Index compared to
2006.
Ukraine’s (67) overall score has fallen from 2014
due to decreases on the Economic Participation and
Opportunity and Political Empowerment subindexes.
Macedonia, FYR follows, ranking 69th. It continues to
have the highest percentage of female R&D personnel
(FTE) compared to men. Albania stands in the 70th
position. Albania has improved its overall ranking by 13
positions since 2014; however, it is also the country from
the region that has progressed the least over the past
10 years on the Educational Attainment and Health and
Survival subindexes. Russian Federation (75) improved
its overall score compared to 2006, having peaked in
2010 and 2011. Compared to last year, the country’s
overall score slightly improved with no impact on its overall
rank. This year, the Russian Federation ranks 42st on the
Economic Participation and Opportunity subindex (similar
to last year) and 128th on the Political Empowerment
subindex. Similar to last year, the country remains among
the three lowest-ranking countries of the region on this
subindex. The country ranks first on the Healthy life
expectancy indicator, with a female-to-male ratio of 1.20.
Next is the Kyrgyz Republic (76). Its best
performance over the last 10 years was in 2009.
Compared to 2006, the Kyrgyz Republic is among the
three countries from the region with the lowest increase on
the Economic, Education and Health subindexes. Following
next are Romania (77) and Montenegro (79). The Czech
Republic (81) gained 15 places this year compared to
last year, mostly due to improvements on the Economic
Participation and Opportunity and Political Empowerment
subindexes. The percentage of women in ministerial
positions improved from 7% to 19%. Georgia (82) follows,
with Greece (87) and Tajikistan (95) next. Georgia is the
country from the region that has made the most progress
on the Health and Survival subindex since 2006. Greece’s
highest overall score over the past 10 years was in 2011.
Similar to last year, Greece ranks 87th on the Economic
Participation and Opportunity subindex. On the Political
Empowerment subindex, however, the country gained 17
places over last year, ranking this year at the 91st position.
Tajikistan is the lowest-performing country from the region
on the Enrolment in tertiary education and Healthy life
expectancy indicators.
Next are Azerbaijan (96), Slovak Republic (97),
Hungary (99) and Cyprus (100). Azerbaijan is the secondlowest ranked country from the region on the Political
Empowerment subindex, in 129th place. On the Health and
Survival subindex, it is the third-lowest performing country
from the region, ahead of Albania and Armenia. Out of the
95 countries that have provided data for the Firms with
female top managers indicator, Azerbaijan presents the
third-smallest percentage overall, just ahead of Jordan
and Yemen. It is also, overall, the country with the lowest
percentage of firms with female participation in ownership.
Slovak Republic lost seven places this year, due to
decreases on the Economic Participation and Opportunity
and Political Empowerment subindexes. The Slovak
Republic is among the five countries in the world that
don’t have any women in ministerial positions. Hungary
lost six places this year due to a drop on the Political
Empowerment subindex, where it is again this year the
region’s lowest performing country, ranking 139th. Hungary
is the region’s lowest-ranked performer on the Women in
parliament indicator, with only 10% of its parliament made
up of women. It is also among the five countries in the
world that don’t have any women in ministerial positions.
The final positions in the region are occupied by Malta
(104), Armenia (105) and Turkey (130). Malta’s overall
highest score over the past 10 years was in 2013. This year
Malta lost five places, due to a decrease on the Political
Empowerment subindex. Armenia continues to be the
lowest-performing country from the region on the Health
and Survival subindex. Armenia has the second lowest
female-to-male sex ratio at birth score in the world, just
above China’s. However Armenia has a high percentage
(64%) of female professional and technical workers. Turkey
has experienced a steady improvement of its overall score
since 2010. Compared to 2006, the country is among the
top three climbers from the region on the Education and
The Global Gender Gap Report 2015 | 21
Part 1: Measuring the Global Gender Gap
Health subindexes. Over the past 10 years, the evolution of
its Economic Participation and Opportunity subindex score
forms a U shape, with its lowest point in 2010. Turkey is
again the lowest-performing country from the region on the
Economic Participation and Opportunity subindex. Out of
the 29 countries that have provided data on the average
minutes spent per day in unpaid work, Turkey has the
third-largest difference between women and men, following
Mexico and India.
Latin America and the Caribbean
The Latin America and Caribbean region has closed 70%
of the overall gender gap. It is the third-best performing
region on the overall Index after North America and
Europe and Central Asia. It is also the best performer
on Health and Survival and second best on Educational
Attainment. Compared to 2014, the region has slightly
progressed on Political Empowerment and regressed
on Economic Participation and Opportunity, with more
than 20% and 62%, respectively, of the gender gaps
now closed. The Educational Attainment and Health and
Survival gender gaps remain roughly the same at 99% and
98%, respectively. When compared to 2006, the region
has shown the most improvement on the overall Index
and second-most improvement on both the Economic
Participation and Opportunity and Political Empowerment
subindexes. The region is also home to the best climber
of the world on the overall Index, Nicaragua, and the
best climber of the world on the Political Empowerment
subindex, Bolivia.
Nicaragua (12) remains the best performer of the
region for the fourth year in a row despite dropping six
places from 2014 to 2015. It has closed the gender gap
fully on both Educational Attainment and Health and
Survival. Furthermore, on Political Empowerment it is the
highest-ranking country of the region and fourth in the
world, with more than 50% of the gender gap now closed.
Since 2006, it is the world’s most improved country on
the overall Index and third-most improved of the world on
Political Empowerment. Bolivia (22) moves up 36 places
from last year, making it the second-best performer of the
region, with nearly 75% of the gender gap now closed. This
is mostly due to an increase on the Political Empowerment
score, resulting from a doubling of women in parliament
(from 25% to 53%). The country is now the second-highest
ranked country in the region on the Political Empowerment
subindex, with 42% of the gender gap now closed. On
the Health and Survival subindex it has fully closed its
gender gap, but on Educational Attainment it is the region’s
second-worst performer. Since 2006, the country is the
world’s most improved country on Political Empowerment
and second-most improved on the overall Index.
Barbados (24) moves up nine places from last year,
overtaking Cuba, Ecuador and Argentina on the regional
rankings. This is mostly due to an increase of its Economic
Participation and Opportunity score, resulting from a rise
22 | The Global Gender Gap Report 2015
in the number of female legislators, senior officials and
managers as well as professional and technical workers.
It is now the best-performing country of the region and
second in the world on this subindex. It has also fully
closed its Health and Survival gender gap. Within the
region, it scores above average on all subindexes except
Political Empowerment. Cuba (29) moves up one spot
from last year. This is partly due to an increase in the
number of women in ministerial positions (from 23%
to 31%). It has nearly closed the gender gap on the
Educational Attainment subindex and ranks third in the
region on Political Empowerment with 40% of the gender
gap now closed. Ecuador (33) has regressed since last
year, dropping 12 places in rank. This is partly due to a
slight decrease in the female-to-male ratio of estimated
earned income. In Health and Survival it has fully closed
the gender gap. When compared to 2006, it is the secondmost improved country in the region and the fourth-most
improved of the world on the Economic Participation and
Opportunity subindex.
Argentina (35) has slightly progressed since last
year despite dropping four places in rank. This is due to
a slight increase on the Political Empowerment subindex,
resulting from more women in ministerial positions and
an additional year with a female head of state. It has fully
closed its gender gap on the Health and Survival subindex.
Since 2006 it has improved across all subindexes except
Educational Attainment, where there has been no change
in score. Costa Rica (38) has improved over last year
and moves up 10 places with 73% of the gender gap
now closed. This is due to a near doubling of women in
ministerial positions (from 25% to 41%). It has also fully
closed its gender gap on the Educational Attainment
subindex, but ranks among the bottom three in the region
on Health and Survival. Since 2006, it has improved in all
subindexes except Health and Survival where it has slightly
regressed. Bahamas (40) drops five places since last year
but slightly increased its score. It has closed the gender
gap fully on the Educational Attainment and Health and
Survival subindexes, and is the second-best performing
country in the region on Economic Participation and
Opportunity, with more than 82% of the gender gap now
closed.
Colombia (42) has made progress over last year,
moving up 11 places in rank. This is due to improvements
in wage equality for similar work and estimated earned
income. It is now the third-best performing country in
the region on the Economic Participation an Opportunity
subindex, with more than 74% of the gender gap now
closed. Since 2006, it has made almost no improvement
on Health and Survival and Political Empowerment and
has actually regressed on Educational Attainment. Both
Panama (44) and Trinidad and Tobago (46) made slight
progress over last year, with more women in parliament.
Both countries have also fully closed their gender gap on
Health and Survival in 2015. In fact, since 2006, they have
Part 1: Measuring the Global Gender Gap
improved on all subindexes except Educational Attainment,
where they have regressed. El Salvador (62) rises 22
places, with more women in parliament and in ministerial
positions (from 7% to 21%). Since 2006 it has fully closed
its Health and Survival gender gap and has improved
across all indicators.
Jamaica (65) has dropped 13 places on the Economic
Participation and Opportunity subindex, mostly due to
recently available data for the number of female legislators,
senior officials and managers. It has closed the gender
gap fully on Health and Survival and is the most improved
country of the region on this subindex since 2006. It has
also improved on Political Empowerment but is the region’s
least improved country on Economic Participation and
Opportunity and on the overall Index. Guyana (66) follows
and drops two places from last year, without any major
changes in score besides slight improvements in literacy
rate, wage equality and the number of women in ministerial
positions. Its Educational Attainment and Health and
Survival gender gaps remain fully closed but the country
is the region’s second-worst performer on Economic
Participation and Opportunity.
Mexico (71) moves up nine places from last year with
more women in parliament. Slight improvements have also
been made in estimated earned income and the number
of female legislators, senior officials and managers, but
it remains the region’s lowest-ranked country on the
Economic Participation and Opportunity subindex, with
less than 55% of the gender gap closed. Since 2006 it
has fully closed its Health and Survival gender gap and
ranks among the top five most-improved countries in the
region on the overall Index and Political Empowerment
subindex. It has slightly regressed on Educational
Attainment. Chile (73) hasn’t changed in score despite
dropping seven places from last year. The number of
legislators, senior officials and managers has improved,
as has the number of years with a female head of state,
but there are fewer women in ministerial positions. It
ranks among the bottom three in the region on Economic
Participation and Opportunity. Since 2006 it has improved
on all subindexes except Health and Survival and ranks
among the region’s top five most-improved countries on
Educational Attainment. Venezuela (78) moves up eight
places in rank, with 69% its gender gap now closed.
While it has regressed on Economic Participation and
Opportunity, improvements have been made on Political
Empowerment, as it has added more women in ministerial
positions. Most of the progress made since 2006 has
occurred on these two subindexes. Honduras (80) drops
seven places in rank, with less wage equality for similar
work. It has fully closed the gender gap on the Educational
Attainment subindex. Since 2006 it has improved across all
subindexes except Health and Survival where it has slightly
regressed.
Brazil (85) has slightly regressed, dropping 14 places
since 2014. This is likely due to a fall in the number of
women in ministerial positions (from 26% to 15%). Yet its
Educational Attainment and Health and Survival gender
gaps remain fully closed, and, since 2006, it has improved
across all subindexes, with the most progress being
made on Political Empowerment. Dominican Republic
(86) is ranked next and has similarly regressed, dropping
eight places since last year. While improvements have
been made to its Political Empowerment score, with more
women in ministerial positions, Economic Participation
and Opportunity has suffered, with less wage equality for
similar work. Since 2006, it is the least improved country
of the region and third least improved globally on the
Educational Attainment subindex. It is also the region’s
least improved on the Health and Survival subindex,
ranking in the region’s bottom three today. Peru (89) has
also regressed, dropping 44 places since last year. This is
mostly due to halving the number of women in ministerial
positions (from 44% to 22%). However, since 2006, it has
improved across all subindexes except Health and Survival
where it has regressed. It is the worst performing country
of the region in this category, with 97% of the gender gap
closed.
Uruguay (93) drops 11 places in 2015, with fewer
female legislators, senior officials and managers. Some
progress has been made in the percentage of women in
parliament and in ministerial positions but the country is
still one of the region’s three worst performers on these
indicators. Since 2006 it has fully closed its gender gap
on Health and Survival and has advanced across all
subindexes. Suriname (94) follows, but has risen 15 places
since last year. This can be attributed to an increase in the
number of female legislators, senior officials and managers
and the number of professional and technical workers,
as well as a doubling of women in parliament (from 12%
to 25%). Since 2012 it has fully closed its Health and
Survival gender gap. Belize (103) drops three places from
last year due to a slight decrease in female enrolment in
secondary education. It is the worst performing country of
the region on Political Empowerment, with less than 5% of
the gender gap closed. The gender gap on the Health and
Survival subindex has remained fully closed since 2007.
Guatemala (106) has regressed, dropping 17 places from
last year, with fewer women in ministerial positions. When
compared to 2006, the country is the most improved of the
region and third-most improved globally on the Economic
Participation and Opportunity subindex. Similarly, while it
is the region’s lowest-performing country on Educational
Attainment, it has improved the most since 2006. The
gender gap on Health and Survival remains fully closed.
Paraguay (107) drops 26 places from last year and is the
worst performing country of the region, with less than
67% of the gender gap closed. It has regressed across
most of the indicators in Economic Participation and
Opportunity—with wage equality for similar work being the
exception. The number of women in ministerial positions
has also nearly halved (from 25% to 8%) making it the
The Global Gender Gap Report 2015 | 23
Part 1: Measuring the Global Gender Gap
second-worst performing country of the region on the
Political Empowerment subindex. However, it improved on
Health and Survival, fully closing the gender gap this year.
Since 2006, it is the second-most improved country of the
region on Educational Attainment but the least improved
on Political Empowerment.
North America
North America has closed 74% of its overall gender gap,
remaining the best performer on the global Index. It is also
the best performer on the Economic Participation and
Opportunity subindex, with 82% of the gender gap closed,
and on the Educational Attainment subindex, where it
has nearly achieved parity. On the Health and Survival
subindex it ranks third in the world; yet on the Political
Empowerment it ranks second-to-last, with less than 17%
of the gender gap closed. In fact, when compared to
2006, North America is the second-least improved region
on the overall index and on the Health and Survival and
Political Empowerment subindexes. It is, however, the
most improved region on the Economic Participation and
Opportunity subindex.
The United States (28) falls eight places this year and
drops out of the top 20, mostly due to a decrease on its
Political Empowerment score, where it has demonstrated
fewer women in ministerial positions (from 32% to 26%).
On the Economic Participation and Opportunity subindex,
the country also drops out of the top five, with slightly less
wage equality for similar work. It ranks in the top 10 on the
Estimated earned income and Professional and technical
workers indicators, and top 25 on the Legislators, senior
officials and managers indicator. The country has not
reached full parity on either the Educational Attainment or
Health and Survival subindexes. Over the past 10 years,
its overall score has fluctuated, with a peak in 2014. It has
improved across all subindexes except Health and Survival,
where it has slightly regressed.
Canada (30) falls 11 places this year, mainly due to a
decrease on its Economic Participation and Opportunity
score, with less wage equality for similar work as well, as
on its Political Empowerment score, where it has slightly
less women in ministerial positions. It ranks among the top
25 on the labour force participation and estimated earned
income indicators. The country continues to rank first in
the world with full parity on the Educational Attainment
subindex, but ranks below the regional average on Health
and Survival, with less than 97% of the gender gap
closed. Looking back to 2006, Canada’s overall score is
characterized by similar fluctuations in score with a peak
in 2014. Like the United States, Canada has improved on
all subindexes except Health and Survival, where it has
slightly regressed.
The Middle East and North Africa
The Middle East and North Africa region has closed almost
60% of the overall gender gap. However, it ranks last
24 | The Global Gender Gap Report 2015
globally on the overall Index; on the Economic Participation
and Opportunity subindex, with only 40% of the gender
gap closed; and on the Political Empowerment subindex,
with only 9% of the gender gap closed. Four of the five
world’s lowest-ranking countries on this latter subindex
belong to this region. On both Educational Attainment
(93% of the gender gap closed) and Health and Survival
(nearly 97% of the gender gap closed) it ranks fifth
globally—surpassing Sub-Saharan Africa and Asia and
the Pacific, respectively. Still, no country from the region
has fully closed its gender gap on either subindex. When
compared to 2006, the region has shown the most
improvement on the Educational Attainment subindex, but
the least improvement on the overall Index as well as on
the Economic Participation and Opportunity and Political
Empowerment subindexes. The region is also home to the
best climber of the world on the Economic Participation
and Opportunity subindex: Bahrain.
Israel (53) continues to hold the top spot in the
Middle East and North Africa region and moves up 12
places on the overall ranking due to improvements on
the Economic Participation and Opportunity, Health
and Survival, and Political Empowerment subindexes It
is the region’s best-performing country across all four
subindexes. It is also the best performer on the Labour
force participation and Legislators, senior officials and
managers indicators, but the second-worst performer on
the Wage equality for similar work indicator. The country is
the region’s second most improved country on the Health
and Survival subindex since 2006. Kuwait (117) drops four
places this year. It is the region’s second-best performing
country on Educational Attainment and the third-best
performer on Economic Participation and Opportunity.
On Health and Survival it is the lowest-performing country
along with Qatar, with less than 96% of the gender gap
closed. It has improved across all subindexes since 2006,
with Educational Attainment and Health and Survival
the exceptions. The United Arab Emirates (119) follows
closely. It scores above the regional average across all
subindexes except Health and Survival, where it is the
third-lowest ranked country, with 96% of the gender gap
closed. It ranks first in the region on literacy rate and
third on wage equality for similar work. Since 2006 it
has improved across all subindexes except Health and
Survival. Next is Qatar (122), the region’s second-best
performing on Economic Participation and Opportunity, but
the second-lowest performer on Health and Survival and
lowest performer on Political Empowerment, where it has
closed only 1.3% of the gender gap.
Bahrain (123) scores above the regional average
on Economic Participation and Opportunity, with
the region’s highest score on the Wage equality for
similar work indicator. It also scores above average on
Educational Attainment with the second-highest score
on the Enrolment in tertiary education indicator. It is
the world’s most improved country on the Economic
Part 1: Measuring the Global Gender Gap
Participation and Opportunity subindex, and the secondmost improved of the region on the overall Index since
2006. Nevertheless, it is also the least improved since
2006 on both the Educational Attainment and Political
Empowerment subindexes. Tunisia (127) scores above the
regional average across all subindexes and ranks best in
the region for healthy life expectancy and second best on
the percentage of female legislators, senior officials and
managers. Since 2006, it has shown the region’s most
improvement on the Health and Survival subindex. Algeria
(128) is the region’s second-best performing country on
Political Empowerment, with the highest percentage of
women in parliament (32). In fact, it is the second-most
improved country on this subindex when compared with its
2006 performance.
Mauritania (132) is the region’s second-best
performing country on the Health and Survival subindex
and the third-best performer on Political Empowerment
where it has the highest percentage of women in ministerial
positions (27). It is the most improved of the region in
this subindex since 2006. Still, it is the second lowest
performing country on Educational Attainment, with the
lowest enrolment of women in tertiary education. Saudi
Arabia (134) drops four places from last year, mainly due to
a decrease on its Economic Participation and Opportunity
and Health and Survival scores. It is the region’s thirdbest performing country on Educational Attainment, with
parity across enrolment in primary, secondary, and tertiary
education. Still, it ranks below the regional average across
the rest of the subindexes. Since 2006, the country has
shown the region’s largest improvement on the overall
Index and the second-largest improvement on Economic
Participation and Opportunity. On Educational Attainment,
it is the fifth-most improved country in the world; however,
it is the world’s fifth-least improved country on Health and
Survival.
Oman (135) drops seven places from last year, due
to regression on Economic Participation and Opportunity.
It ranks above the regional average across all subindexes
except Political Empowerment, where it is the thirdlowest performing country of the region. Egypt follows
in 136th position this year, with scores above average
on all subindexes except Political Empowerment. Since
2006, the country has improved on three out of the four
subindexes; the lone exception, the Health and Survival
subindex. Lebanon (138) has improved over 2014, with
the second highest percentage of female professional and
technical workers in the region and more female ministers.
Still, it is the region’s second-lowest performer on Political
Empowerment, with only 3% of female parliamentarians.
Morocco (139) is the third-best performing country of the
region on Health and Survival, but also the third-lowest
performing country on Educational Attainment, where it
has closed less than 92% of the gender gap. Since 2006
it has improved across all subindexes except Economic
Participation and Opportunity, where it is the world’s
third-least improved country. Jordan (140) is the region’s
third-lowest performing country on Economic Participation
and Opportunity, with 35% of the gender gap closed.
It ranks below the regional average across the rest of
the subindexes except Educational Attainment. While
improvements have been made on Educational Attainment
and Political Empowerment since 2006, it is the world’s
second-least improved country on the overall Index as
well as on the Economic Participation and Opportunity
subindex.
Syria (143) drops four places from last year and
remains in the bottom five of the global ranking. It is the
region’s second-lowest performing country on Economic
Participation and Opportunity, with the region’s lowest
score on the Labour force participation indicator. Yemen
(145) continues to occupy the last place in the region
and on the global Index since 2006. It is the lowest
performing country of the region across the Economic
Participation and Opportunity subindex and fourth-lowest
in the world on Educational Attainment. It has made some
improvements, though, and since 2006 it has been the
most improved country of the region and fourth in the
world on Educational Attainment. Still, it is also the least
improved of the region and fourth-least improved of the
world on the Health and Survival subindex.
Asia and the Pacific
The Asia and the Pacific region has closed more than
67% of its overall gender gap. It has improved its Political
Empowerment performance since 2014 and remains first
globally with more than 25% of the gender gap closed.
However, the region ranks second from the bottom on the
overall Index and Economic Participation and Opportunity
subindex, with 54% of the gender gap closed. On Health
and Survival, the region has regressed since 2014 and,
once again, scores last with less than 95% of the gender
gap closed. When compared to 2006, the region is the
most improved on Political Empowerment and secondmost improved on Educational Attainment and on the
overall Index. It is the least improved on Health and
Survival despite being home to three of the five mostimproved countries on this subindex. Of the 24 countries
in the region, 17 have improved and seven have regressed
since 2006. The region is also home to one of the top
five climbers on the overall Index and on Educational
Attainment: Nepal.
The Philippines (7) has made progress from last
year and continues to rank among the top 10 on the
overall index and first in the region with 79% of its gender
gap closed. This can be explained by an increase on its
Economic Participation and Opportunity score, which
is due to more female legislators, senior officials and
managers as well as professional and technical workers.
It now ranks third-best in the region on this subindex.
Improvements have also been made on the Political
Empowerment subindex, due to more women in ministerial
The Global Gender Gap Report 2015 | 25
Part 1: Measuring the Global Gender Gap
positions. The Health and Survival gender gap remains fully
closed while the Educational Attainment gap, which had
been fully closed since 2006, reopens slightly. Since 2006,
the country has progressed across all categories except
Educational Attainment, where it has slightly regressed.
New Zealand (10) similarly improves and moves up
three places from last year, joining the top 10 on the overall
Index with more than 78% of its gender gap closed. The
country has also improved on Economic Participation and
Opportunity, with better wage equality for similar work
and more equal estimated earned income. Improvements
have also been made on Political Empowerment, and
the country now ranks third best in the region in this
subindex. Its Educational Attainment gender gap remains
fully closed. Since 2006, the country has progressed
across all categories except Health and Survival where it
has slightly regressed. Australia (36) follows and drops
12 places from where it ranked in 2014, with 73% of
the gender gap now closed. This can be explained by a
decrease on its Economic Participation and Opportunity
score, due to a drop in estimated earned income. Since
2006, its Educational Attainment gender gap has remained
fully closed. The country has shown progress across
all subindexes except Health and Survival where it has
slightly regressed. Lao PDR (52) moves up by eight places,
closing 71% of its overall gender gap. The country has
increased its Economic Participation and Opportunity
score, with improvements to the Estimated earned income
indicator score, and now ranks second best in the region
on this subindex. Its Educational Attainment score has
also improved, due to higher literacy rates and more equal
enrolment in secondary and tertiary education.
Singapore (54) moves up five places from last year
due to improvements to its Economic Participation and
Opportunity score, where it has increased wage equality
for similar work and added more female legislators,
senior officials and managers as well as professional
and technical workers. The country now ranks first in the
region on this subindex. Yet on Educational Attainment
and Political Empowerment it scores below the regional
average. Singapore has made progress across all
subindexes since 2006 and is the most improved
country in the region on Economic Participation and
Opportunity. Mongolia (56) falls twelve spots from last
year. The decrease can mainly be seen on the Political
Empowerment score, with fewer women in ministerial
positions (from 17% to 11%). The Health and Survival
gender gap remains fully closed. When compared to
2006, the country has demonstrated improvements across
all subindexes except Educational Attainment where it
has regressed. Thailand (60) moves down one rank but
slightly improves its overall score, due to an increase on
the Economic Participation and Opportunity subindex—in
particular, more female legislators, senior officials and
managers in the workforce. The country’s Health and
Survival gender gap is fully closed. When compared
26 | The Global Gender Gap Report 2015
to 2006, the country has shown progress across all
subindexes except Political Empowerment, where it has
regressed.
Bangladesh (64) moves up four places from 2014 to
2015, showing improvement across all subindexes except
Economic Participation and Opportunity. After a steady
increase in score from 2006 to 2010, the country has
regressed on this subindex since 2013. Its Educational
Attainment score continues to rise, due to higher literacy
rates and enrolment in tertiary education. On the Health
and Survival subindex, the country ranks first in the region
and, since 2006, is the second most-improved country in
the world. Improvements have also been made on Political
Empowerment, with more years with a female head of
state; since 2006, it has been the second-most improved
country of the region on this subindex. Bangladesh is also
the region’s second-most improved country on the overall
Index.
Vietnam (83) has fallen seven places on the overall
ranking. While its Economic Participation and Opportunity,
Political Empowerment and Health and Survival scores
have remained almost unchanged, its Educational
Attainment score has decreased. This may be attributed
to a decrease in female literacy rates. Sri Lanka (84) drops
five positions—it has less wage equality for similar work
and fewer female legislators, senior officials and managers.
The country’s Political Empowerment performance has
also regressed, with fewer years with a female head
of state, even though there are now more women in
ministerial positions. The Health and Survival gender gap
is fully closed. Since 2006 the country is the region’s
least improved country on the overall Index, and the least
improved in the world, on the Political Empowerment
subindex.
Brunei Darussalam (88) moves up by 10 places
from 2014, with an improved Economic Participation and
Opportunity score due to more female legislators, senior
officials and managers as well as female professional
and technical workers. However, it ranks last in the world
on Political Empowerment, with no women in ministerial
positions or years with a female head of state. China
(91) drops four places from last year, slightly regressing
in score due to a decrease in female sex ratio at birth.
It is the world’s lowest-ranked country on this indicator.
China has slightly improved its Economic Participation
and Opportunity performance, with more wage equality
for similar work, as well as its Political Empowerment
score, where it has seen an increase in the percentage of
women in ministerial positions. Since 2006 it has shown
progress across all subindexes except Health and Survival
where it is now the third-least improved country in the
world. Indonesia (92) moves up five places, due to a near
doubling of women in ministerial positions (from 12% to
23%). Since 2006, the country has been steadily improving
across all subindexes except Economic Participation and
Opportunity, where it has regressed.
Part 1: Measuring the Global Gender Gap
Japan (101) moves up three places from 2014 due to
a similar near doubling of women in ministerial positions
(from 11% to 22%). The Health and Survival gap remains
unchanged since 2012, at almost 98%, and the Economic
Participation and Opportunity score has decreased since
2014, due to lower wage equality for similar work and
fewer female legislators, senior officials and managers.
Since 2006 the country has demonstrated progress across
all subindexes except Health and Survival where it has
slightly regressed. India (108) moves up six positions from
2014 with more than double the percentage of women in
ministerial positions (from 9% to 22%). It now ranks second
in the region on this subindex. While the Educational
Attainment and Health and Survival scores have also
improved, the country ranks third-lowest in the region and
third-lowest in the world on both subindexes. Economic
Participation and Opportunity has declined due to a
decrease in wage equality for similar work and less female
labour force participation, placing the country third-lowest
in the region. Since 2006 the country has improved across
most subindexes, and in fact is the region’s most-improved
country on Political Empowerment. Nevertheless, it has
regressed on Economic Participation and Opportunity and
is the world’s least-improved country on the Health and
Survival subindex.
Cambodia (109) slightly improves its Economic
Participation and Opportunity score, showing consecutive
growth with more wage equality for similar work. The
country has also improved on the Political Empowerment
subindex, adding more women in ministerial positions.
While higher literacy rates have boosted Educational
Attainment, it is the region’s second-lowest ranking
country on this subindex. The country has reached gender
parity on the Health and Survival subindex. Since 2006
the country has improved across all subindexes. Nepal
(110) moves up two spots from last year, with improved
Economic Participation and Opportunity and Educational
Attainment scores. There have been no major fluctuations
on Health and Survival but its Political Empowerment
score has decreased slightly. Since 2006 the country
has improved across all subindexes, and ranks as the
second-most improved country in the world on Educational
Attainment and third-most improved globally on the overall
Index and on Health and Survival. It is also the region’s
second-most improved on Economic Participation and
Opportunity.
Malaysia (111) slightly improves in score despite
falling four places in rank. Improvements across Economic
Participation and Opportunity are a likely cause but the
country has slightly regressed on Political Empowerment,
where it now ranks third lowest. It has also regressed
slightly on the Educational Attainment subindex; in fact,
since 2006, it is the world’s least improved country on
this subindex. Over the last decade it has also regressed
on both Health and Survival and Political Empowerment.
The Maldives (113) drops eight places in rank due, in
part, to less equal estimated earned income and fewer
women in ministerial positions. The country ranks above
the regional average across all subindexes except Political
Empowerment, where less than 6% of its gender gap has
closed.
Korea, Rep. (115) moves up two places with 65% of
its overall gender gap now closed. This is likely triggered
by progress across nearly all indicators on the Economic
Participation and Opportunity subindex. Regarding Political
Empowerment however, there has been a near halving of
women in ministerial positions (from 12% to 6%). When
compared to 2006, the country has improved across all
subindexes, with the most progress being made on the
Economic Participation and Opportunity subindex. Bhutan
(118) also moves up two positions in rank, with the most
improvement being made on Educational Attainment,
which has been boosted by a higher literacy rate and
enrolment in tertiary education. Its Heath and Survival and
Political Empowerment scores remain the same as last
year. Fiji (121) has seen more estimated earned income
and a greater number of women in ministerial positions.
Full gender parity has been reached on the Health and
Survival subindex.
Iran, Islamic Rep. (141) slightly regresses and joins
the world’s bottom five on the overall Index. It is also
the region’s second lowest performer on the Economic
Participation and Opportunity and Political Empowerment
subindex, with under 36% and 4% of the respective
gender gaps closed. When compared to 2006 it has
made almost no improvements in any category and has
actually regressed on the Economic Participation and
Opportunity and Health and Survival subindexes. Pakistan
(144) has slightly improved its 2014 performance, but still
ranks second–to-last in the world on the overall Index. On
the Economic Participation and Opportunity subindex,
the country has improved wage equality for similar work
but still remains last in the region and, when compared
to 2006, has improved the least of any country in the
region. Similarly, improved literacy rates and enrolment in
tertiary education have boosted educational attainment
but the country remains last in the regional rankings. When
compared to 2006, though, it is the region’s second-most
advanced on this subindex. It is also one of the top five
most-improved countries in the world on the Health and
Survival subindex.
Sub-Saharan Africa
By 2015, the Sub-Saharan Africa region has closed 68% of
its overall gender gap, showing a slight increase compared
to 2014. Out of six regions measured, it ranks fourth
behind North America, Europe and Central Asia, and Latin
America and the Caribbean. The region has closed 97% of
its Health and Survival gap, showing the second absolute
largest increase compared to last year. Eighty-four percent
of its Educational Attainment gender gap has closed, the
largest absolute improvement over 2014. This year, 69%
The Global Gender Gap Report 2015 | 27
Part 1: Measuring the Global Gender Gap
of its Economic Participation and Opportunity gender
gap and 19% of the gap on the Political Empowerment
have been closed. Since 2006, the region (17 countries
were included from 2006 to 2015) has experienced an
increase of its overall score from 0.64 to 0.67, which is
the fourth-largest absolute increase after North America,
Latin America and the Caribbean and Europe and Central
Asia. On the Economic Participation and Opportunity
and Political Empowerment subindexes, the region has
demonstrated the fourth largest absolute increase, and
the third-largest absolute improvement on the Educational
Attainment subindex. On Health and Survival however, the
region improved more than any of the five regions. Thirtyone countries from the region are included in the 2015
index; three—Benin, Cameroon and The Gambia—are
new this year. In 2015, Rwanda (6), Namibia (16) and South
Africa (17) rank among the top 20 countries on the overall
Index, with Namibia climbing from 40th in 2014 into the top
20 for the first time. Mali (137) and Chad (142) are among
the 10 countries at the bottom.
Among the top 20 performing countries on the
Economic Participation and Opportunity subindex are
Burundi, Malawi, Ghana, Rwanda and Botswana. Nine
countries from Sub-Saharan Africa are in the top 20 on
the Labour force participation indicator, with Malawi,
Mozambique, Rwanda and Burundi demonstrating a
higher representation of women in the labour force
than men. Globally, Rwanda is the country with the
best wage equality for similar work, followed by Norway
and then Zambia. Namibia and Lesotho are the only
two countries from the region that have closed their
Educational Attainment and Health and Survival gender
gaps. Botswana, Lesotho, Namibia, and Swaziland are
among the world’s 25 countries that have fully closed their
Educational Attainment gender gaps, while Benin and
Chad rank the lowest overall on that subindex. Six of the
10 lowest-ranked countries on the literacy rate indicator
are from the region. Whereas 16 countries in the region
have closed their gender gap for primary education, only
nine have closed it for secondary education and seven for
tertiary education. On the Health and Survival subindex,
Namibia, Cape Verde, Zimbabwe, Lesotho, South Africa,
Uganda, Angola and Mauritius are among the 40 countries
that have closed their gender gap. In 141st position, Mali
ranks among the 10 lowest-performing countries on
that subindex. On the Political Empowerment subindex,
Rwanda and South Africa are the two countries from the
region in the top 20. Rwanda, Senegal, South Africa and
Namibia are among the 10 top-ranked countries on the
Women in parliament indicator. In fact, Rwanda is ranked
first globally and one of only two countries (including
Bolivia) worldwide that have more women in parliament
than men.
Rwanda (6) is included in the Global Gender Gap
Index for the second year and gained one place in
2015. It is the strongest performer from the region and
28 | The Global Gender Gap Report 2015
the only country from the region ranked in the top 10.
Its high ranking can be explained by Rwanda’s strong
performance on the Political Empowerment subindex (7th)
and good performance on the Economic Participation and
Opportunity subindex (14th). However, this performance
is slightly offset by lower scores and wider gender gaps
on Health and Survival and Educational Attainment.
Rwanda has closed its gender gap on the Labour force
participation, Enrolment in primary education, Sex ratio
at birth and Women in parliament indicators. It is also the
best-performing country overall on the Perceived wage
equality for similar work indicator.
Namibia (16) climbed from 40th in 2006 to 16th in
2015 on the overall Index, the region’s largest overall score
improvement. The country is also the region’s best climber
on the Economic Participation and Opportunity subindex
compared to 2006. It is one of two countries from the
region that has closed its gender gaps on the Educational
Attainment and Health and Survival subindexes. The
country has also closed its literacy rate gender gap.
Compared to 2006, the country has improved on all four
subindexes. Following Namibia, South Africa (17) is the
third Sub-Saharan country in the top 20. Compared to
last year, South Africa increased its overall performance
by one ranking due to improvements on the Economic
Participation and Opportunity and Political Empowerment
subindexes. Its gender gap on Health and Survival
subindex remains closed. The country ranks 85th on
the Educational Attainment subindex and 72nd on the
Economic Participation and Opportunity subindex. On the
Political Empowerment subindex, South Africa is among
the top 20 performers, ranking 14th, due to high scores on
both the Women in parliament and Women in ministerial
positions indicators.
Burundi (23) is ranks in the top five on Economic
Participation and Opportunity and shows a strong
performance on Political Empowerment (28). Compared
to last year, scores on three of four subindexes have
decreased—the exception being Political Empowerment.
The country is one of four countries that has closed its
gender gap on the Labour Participation indicator, but is
among the 10 lowest-performing countries with regard
to enrolment in both primary and tertiary education.
Mozambique (27) remains at the same rank as last year
despite a slight increase of its overall score. It, too, is one
of four countries that have closed the gender gap on the
Labour force participation indicator. Yet it is among the 20
lowest-performing countries globally on the Literacy rate
and Enrolment in primary and tertiary education indicators.
Kenya (48) dropped eleven places on the overall rankings
this year, mostly due to a decrease on both the Wage
equality for similar work and Women in ministerial positions
indicators. The country ranks 25th on the Economic
Participation and Opportunity subindex, 62nd on the
Political Empowerment subindex, 85th on the Health and
Part 1: Measuring the Global Gender Gap
Survival subindex, and 113th on the Educational Attainment
subindex.
Tanzania (49) moves two places down from last
year despite no changes to its overall score. Compared
to last year, it has slightly improved its performance
on Educational Attainment, Health and Survival and
Economic Participation and Opportunity subindexes, while
decreasing slightly on Political Empowerment. Tanzania
is the country with the biggest decrease overall on the
Economic pillar over the last 10 years. Tanzania ranks 5th
overall on the Labour force participation and 10th on the
Estimated earned income indicators, while it is the lowestperforming country from the region on the Legislator,
senior officials and managers indicator. Cape Verde (50)
maintains its position this year despite a slight overall
score increase. Cape Verde demonstrates a particularly
strong performance on Health and Survival where it
has closed its gender gap. It ranks 25th on the Political
Empowerment subindex, where it has the region’s highest
percentage—53%--of women in ministerial positions.
Botswana (55) moves a few places down from last year.
The country closed its Educational Attainment gap and
continues to demonstrate a strong performance on the
Economic Participation and Opportuniy subindex, ranking
15th. It has closed its literacy gender gap. Compared to
10 years ago, Botswana is the country that has made the
region’s biggest improvement on the Health and Survival
subindex but also the largest decrease on the Political
Empowerment subindex.
Zimbabwe (57) climbed six places from 2014 to
2015. This is mainly due to an increase in performance
on the Educational Attainment subindex; in particular,
improvements on the Literacy rate and Enrolment in
secondary and tertiary education indicators (Zimbabwe has
closed its gender gap on Enrolment in primary education).
Zimbabwe is one of eight countries in the region that has
closed its gender gap on Health and Survival. Uganda
(58) climbed 30 places this year and is the region’s thirdmost improved country from 2014. The country has also
improved its Economic Participation and Opportunity,
Educational Attainment and Health and Survival subindex
scores, while it its Political Empowerment subindex
performance has decreased. Uganda is among the top 10
performers on the Labour force participation indicator, but
is the region’s lowest-ranked performer on the Estimated
earned income indicator. Lesotho (61) drops 23 places in
the ranking compared to last year. Though the country has
closed its Educational Attainment and Health and Survival
gaps, it ranks 68th on both the Economic Participation and
Opportunity and Political Empowerment subindexes; on
the former subindex, the country experienced its second
lowest score of the past 10 years. Lesotho is one of
four countries from the region that has closed its literacy
gender gap. Ghana (63) climbed 38 places in 2015 and
improved its performance on all subindexes. It has shown
the region’s second-largest improvement after Namibia.
Ghana improved most noticeably on the Economic
participation and Opportunity subindex and is among the
top 10 countries on the Labour force participation indicator
and the region’s best performer on the Legislators, senior
officials and managers indicator, where it has closed the
gender gap.
Next are Malawi (68), Senegal (72) and Madagascar
(74). Malawi drops 34 places compared to last year,
mainly due to a decline on the Economic Participation
and Opportunity and Political Empowerment subindexes,
though it improved, slightly, its performance on the other
two subindexes. The country is one of four countries
that have closed the gender gap on the Labour force
participation indicator. Senegal has slightly improved its
performance over the last year with increased scores for
all subindexes except for Health and Survival, which fell
slightly in 2015. Madagascar sees a significant drop of 33
places in the ranking compared to last year. The country
decreased its score on both the Economic Participation
and Opportunity and Political Empowerment subindexes,
while showing a stable performance on the Health and
Survival subindex and a slight increase on the Educational
Attainment subindex.
Due to a lack of data Cameroon (90) was not included
in last year’s Report. In 2013, however, it ranked 100th,
which means that it gained 10 places over the last two
years, mainly because of improvements on the Political
Empowerment subindex. Similarly, The Gambia (98) reenters the rankings after a gap of two years due to newly
available data. When last included in 2012, the country
ranked 93rd. The Gambia has experienced a slight
decrease on its Economic Participation and Opportunity,
Health and Survival and Political Empowerment subindex
scores compared to 2012. On the other hand, it has
improved its Educational Attainment performance. It is the
region’s lowest-performing country on the Professional and
technical workers indicator.
Swaziland (102), included for the first time in 2014,
improved its Educational Attainment score, whereas its
Economic Participation and Opportunity and Heath and
Survival subindexes scores fell. Swaziland is the secondlowest performing country on Health and Survival, ahead
of Mali. It has maintained the same score on the Political
Empowerment subindex.
Next are Liberia (112), Burkina Faso (114) and
Zambia (116). Liberia is included for the second time
in the rankings and has dropped one place from 2014
despite a slight overall increase of its score The country’s
performance on the Economic Participation and
Opportunity subindex decreased, while its Educational
Attainment and Political Empowerment subindex scores
improved slightly. Its Health and Survival score remains
unchanged. Liberia is the world’s worst performing country
on the Literacy rate indicator. Burkina Faso fell four places
this year, but is the country that has shown the largest
improvement on the Educational Attainment subindex over
The Global Gender Gap Report 2015 | 29
Part 1: Measuring the Global Gender Gap
the last 10 years. Zambia climbed three places from 2014,
and is among the top 10 on the wage equality survey.
Mauritius (120) follows, though it has dropped 14 places
from 2014 due to decreases on the Economic Participation
and Opportunity and Political Empowerment subindexes.
The country has closed its gender gap on the Health and
Survival subindex. It is the lowest performing country from
the region on the Labour force participation indicator.
Ethiopia (124) has moved up three places from 2014.
The country ranks 44th on the Political Empowerment
subindex and 59th on the Health and Survival subindex,
but only 108th on the Economic Participation and
Opportunity and 140th on the Educational Attainment
subindexes. Ethiopia has seen the region’s biggest
improvement on the Political Empowerment subindex
since 2006. Nigeria (125) lost seven places in 2015,
due to a decrease on all subindexes except the
Educational Attainment subindex. However, the country
has demonstrated the region’s largest decrease on this
subindex over the last 10 years. Today, it ranks 61st on
the Economic Participation and Opportunity subindex.
It is among the 10 worst performing countries on the
Educational Attainment subindex and has the region’s
lowest percentage of female parliamentarians. Angola
(126) has dropped five places despite an overall score
improvement. The country has closed its gender gap on
the Health and Survival subindex and ranks 38th on the
Political Empowerment subindex. Angola is among the five
lowest performing countries on the Educational Attainment
subindex and ranks 116th on the Economic Participation
and Opportunity subindex. Angola is the lowest performing
country on the Perceived wage equality for similar work
and Enrolment in primary education indicators. However,
it does rank among the world’s top 25 countries on the
Women in parliament indicator.
Benin (129) re-enters the rankings after a one-year
absence due to missing data. The country ranks 33rd on
the Economic Participation and Opportunity subindex and
is second-to-last on the Educational Attainment subindex.
It is also second-to-last on the Literacy rate indicator
and part of the bottom 10 countries on the Enrolment
in primary, secondary and tertiary education indicators.
Included for the first time last year, Guinea (131) made
small progress in its overall performance this year. The
final positions in the region are occupied by Côte d’Ivoire
(133), Mali (137) and Chad (142). Côte d’Ivoire gained three
places over last year. The country is among the bottom
10 countries on the Educational Attainment subindex. It
is the fifth-lowest performing country on the Enrolment in
secondary education indicator. Mali gained one place in
rank over 2014, improving on all four subindexes except the
Health and Survival subindex. Mali has seen the region’s
largest score decrease since 2006 on both the overall
Index as well as on the Health and Survival subindex. This
year, Mali is also the worst performing country globally on
the Healthy life expectancy indicator. Chad continues to
30 | The Global Gender Gap Report 2015
be the region’s lowest ranked country on the overall Index,
as well as the lowest-performing country overall on the
Educational Attainment subindex.
TRACKING THE GENDER GAP OVER TIME
Since 2006, the Global Gender Gap Report has served as
a benchmark for different stakeholders to track a country’s
standing in gender parity over time—whether relative to
other countries or to themselves. As we consider 10 years
of data, it is possible to assess the speed of progress
and understand more about the nature of the changes
underway.
The aggregate figures allow for an estimate of the
state of gender parity across the world as a whole. In
2006, the Index showed that the world had closed 64% of
the gender gap. In the past 10 years, the gap has closed
by a further 4%. There is variation across regions, with
some moving ahead faster than others, but no region has
managed to change its overall placement since 2006. The
Latin America and the Caribbean region, which closed its
gap by over 4% in the past 10 years, has made the most
progress. Asia and the Pacific is next, but started with a
wider gap. Sub-Saharan Africa, Europe and Central Asia,
and North America follow next, having closed 3.7%, 3.6%
and 3.5% of their gaps, respectively. The Middle East and
North Africa region has made the least progress, at 2.9%.
Nordic countries had some of the smallest gender
gaps in 2006. In 2015, they remain the countries with
some of the smallest gender gaps in the world—but their
progress towards parity has been uneven. Finland and
Norway, the countries with the second and third smallest
gender gaps in 2006, have closed them by 5% over the
past 10 years, making steady progress. In 2006, Sweden
had the narrowest gender gap in the world. However
over the past 10 years, it has closed it by a mere 1%.
Its neighbour Iceland has overtaken it by making 10%
progress to top the rankings. As it currently has the
narrowest gender gap in the world—having closed it by
88%—if Iceland were to make similar progress in the next
10 years, it will be in a position to close its gender gap fully.
Progress has emerged from both high- and lowranked countries. For example, Iceland’s strong progress
is matched by that of Nicaragua, Bolivia, and Nepal,
who are among the countries that have made the most
progress on reducing their gender gap in the past 10 years
(by 10–12%). Nicaragua leads the way, having closed its
political gender gap by 32% and its economic gender gap
by 16%. Bolivia has made similar progress. Nepal started
its transition from having the 5th largest gap (55% overall)
and has now closed its political gender gap by 13% and its
education gender gap by 18%. While Yemen has remained
the lowest-ranked country throughout the 10 years, it has
made progress—from having closed a mere 46% of its
gender gap in 2006 to closing the gap by a further 2.5%
today. In 2006, Chad and Saudi Arabia had the second
and third widest gender gaps in the world. The past 10
Part 1: Measuring the Global Gender Gap
Figure 14: Distance from gender parity 2015, by region
Figure 15: Distance from gender parity 2015, by subindex
100
30%
28%
26%
33%
41%
3%
4%
4%
4%
3%
69%
63%
–1%
32%
40%
4%
2%
3%
71%
66%
57%
64%
Gender Gap Index (percent)
33%
Gender Gap Index (percent)
5%
100
4%
77%
3%
92%
95%
64%
56%
9%
14%
0
Asia and
the Pacific
Europe and
Central Asia
Latin America
and the
Caribbean
Middle East
and
North Africa
n n n n n n remaining gap
North
America
Sub-Saharan
Africa
n closed gap, 2015
n closed gap, 2006
0
INDEX
ECONOMY
EDUCATION
n remaining gap
n widening gap, 2015
HEALTH
POLITICS
n closed gap, 2015
n closed gap, 2006
Source (Figures 14–15): Global Gender Gap Index 2015.
years has seen both countries make strong progress by
narrowing their gender gaps by 5.5% and 8%, respectively.
In fact, Saudi Arabia has progressed past Pakistan, Chad,
Iran, Jordan, Morocco and Mali.
Sri Lanka, Jordan, Mali, the Slovak Republic and
Croatia form the 6% of countries that have widened their
gender gaps over the past 10 years. In Jordan and Sri
Lanka the gap has widened by more than 1%. In other
countries progress has stalled. For example, Iran’s gender
gap stands at 58% today, just as it did in 2006; and
Pakistan’s slow progress in gender parity has seen it fall
behind Saudi Arabia and Chad. It now has the second
widest gap of the 109 countries we have traced over the
past 10 years.
Both the starting points and progress look different
across the four subindexes of the Index. Gender gaps are
widest in Economic Participation and Opportunity and
Political Empowerment, while the average gap to parity is
a mere 2% in Health and Survival and 5% in Educational
Attainment. However, progress has been most pronounced
on Political Empowerment, with the world closing this
by 9% in the last 10 years. On the other hand, progress
in the second widest gap—Economic Participation and
Opportunity has been slower and more turbulent. When
it comes to women’s economic participation, the world
today is back to where it was in 2010 after a peak at 60%
in 2013.
Across the world’s regions, the range of the economic
gender gap is especially wide compared with the political,
economic and educational gender gaps. The regional
average varies by as much as 40%. North America, as
well as Latin America and the Caribbean have improved
economic parity the most. Over the past 10 years, the
economic gender gap has been decreased by 7%,
standing at 82% today. Europe and Central Asia and SubSaharan Africa are not far behind, having shrunk the gap
by roughly 6%, over the past 10 years, and by 62–63%
overall. Women’s economic participation is least improved
in the Middle East and North Africa—where the economic
gap has been reduced by 1%. The Asia and the Pacific
region has also made little progress in closing its gender
gap on this subindex, with a similar 1% increase. To reach
gender parity in economic participation in the future, Asia
and the Pacific would need to close a 47% gap and the
Middle East and North Africa, 59%. Figure 22 (page 35)
displays the relative positions of regions according to their
economic gender gap between 2006 and 2015.
Across the 109 counties we have covered since 2009,
87% have narrowed their economic gender gaps. Bahrain,
Luxemburg and Guatemala have closed the economic
gender parity gap fastest. Bahrain now has 26% more
female professional and technical workers, and 14% more
female legislators, senior officials and managers. Iran and
Saudi Arabia have also narrowed their gender gaps and
are no longer in the cohort of countries with the three
widest economic gender gaps—where they were in 2006.
On the other hand, Tanzania, Jordan, Morocco and Mali
have significantly widened their economic gender gaps—
Tanzania by as much as 10% and Mali by as much as 6%.
In Jordan, the female labour force participation rate has
decreased by 12%, while Mali has seen an even larger
decrease of 23%. The change in labour force participation
has decreased alongside wage equality for similar work
and parity in the gender breakdown of legislators, senior
officials and managers. In the case of Tanzania, the
marked decline has emerged from adjustments to the data
The Global Gender Gap Report 2015 | 31
Part 1: Measuring the Global Gender Gap
Figure 16: Global Gender Gap Index and subindexes evolution 2006-2015
Health
1.0
Global Gender Gap Index score
(0.0–1.0 scale)
Education
0.8
Index
0.6
Economy
0.4
Politics
0.2
0.0
2006
2007
2008
2009
2010
2012
0.62
1.00
0.60
0.98
0.58
0.56
0.54
2014
2015
0.96
0.94
0.92
0.90
0.52
2006 2007 2008 2009 2010 2011 2012 2013 2014 2015
Figure 19: Health and Survival subindex evolution 2006–2015
2006 2007 2008 2009 2010 2011 2012 2013 2014 2015
Figure 20: Political Empowerment subindex evolution
2006–2015
1.00
0.24
0.98
Economic Participation and Opportunity
subindex score (0.0–1.0 scale)
Economic Participation and Opportunity
subindex score (0.0–1.0 scale)
2013
Figure 18: Educational Attainment subindex evolution
2006–2015
Economic Participation and Opportunity
subindex score (0.0–1.0 scale)
Economic Participation and Opportunity
subindex score (0.0–1.0 scale)
Figure 17: Economic Participation and Opportunity subindex
evolution 2006–2015
2011
0.96
0.94
0.92
0.90
0.22
0.20
0.18
0.16
0.14
2006 2007 2008 2009 2010 2011 2012 2013 2014 2015
Source (Figures 16 –20): Global Gender Gap Index 2015.
Note (Figures 17–20): The Y axis has been truncated to enhance readability.
32 | The Global Gender Gap Report 2015
2006 2007 2008 2009 2010 2011 2012 2013 2014 2015
Part 1: Measuring the Global Gender Gap
for the Legislators, senior officials and managers indicator,
highlighting the need for improved data collection and
comparability in international statistics.
On the Labour force participation of women indicator
across the past 10 years, 81% of countries have made
progress. Nepal has had the largest increase of female
labour force participation. In 2006 it had closed 64% of
the gender gap on this indicator; in the past 10 years
it has improved by 30% (from 0.637 to 0.935). Other
countries that have shown particularly strong growth
include Botswana, Nigeria, Spain, Nicaragua, South Africa
and Lesotho. Guatemala and Bahrain have both made
strong progress relative to their starting points (16% and
13% respectively). On the other end of the scale, Iran has
increased its labour force participation gender gap the
most—by about 30% in the past 10 years (0.520 to 0.229).
Similarly, Mali, Argentina and Mauritania have increased
their labour force participation gender gap by more than
20%. Of the three, Mali used to perform particularly well in
2006, when it had closed 86% of the gender gap on that
indicator. Among the BRICS, South Africa has improved its
labour force participation gap by 18%, Japan by 11%, while
India has widened its gap by 7%.
When it comes to women’s ability to rise to positions
of authority, over the past 10 years, 68% of countries
have made progress towards a more equal cohort of
legislators, senior officials and mangers. During this
period, Colombia and Ghana have both reached parity,
with scores of 0.613 and 0.515, respectively. Ghana, in
particular, has made a significant jump of 50%. In 2006,
France had a notably low level (0.075) of female legislators,
senior officials and managers. Yet it has made significant
improvements—rising by 41%. On skilled roles—specifically
professional and technical workers—50% of countries
have reached parity. Of that cohort, 36% were already at
parity in 2006. Among those who have recently reached
parity are Bulgaria—spanning a gap of 48%—as well as
the Dominican Republic and Guatemala. France is nearing
parity, from an initial score in 2006 of 0.667. In 2006,
both Nepal and Bahrain had only closed 22–24% of their
gender gaps for professional and technical workers. Ten
years later, they have both improved past the 42% mark
and are on the way to closing half of the gap. A number of
countries are significantly overshooting parity, with around
12% of the 109 having a ratio higher than 1.5 women /
men. These include Lithuania, Moldova, Venezuela, Latvia,
the Russian Federation, Ukraine, Estonia, Mongolia and
Georgia.
On education, to date 20% of countries have closed
their education gender gaps, and 39% have narrowed
the gap down to 1%. In 2006 only 14% had fully closed
their gender gaps on education. Europe and Central Asia,
North America, and Latin America and the Caribbean are
a fraction of a percent away from full parity (having grown
by 0.7%, 1.5% and 1.3% respectively). The Middle East
and North Africa, and Asia and the Pacific have closed
the gap by 5% and are now 6% and 5% away from parity
respectively. Sub-Saharan Africa has the most persistent
gap, which has closed by a mere 2%, and it is 15% away
from parity. Figure 23 (page 35) displays the regions
relative positions in the Educational Attainment subindex.
Chad has closed 59% of its education gender gap,
12% over the past year by making strong improvements in
literacy and secondary education. Burkina Faso and Nepal
have closed their education gender gaps by 18–19% over
the past 10 years. Nepal has seen strong improvements
in its tertiary education rates. Yemen, Pakistan and Saudi
Arabia have made smaller, yet strong improvements in their
own education gaps of 10–12%. This brings Saudi Arabia
on the verge of parity—it has currently closed 99% of its
education gender gap. On the other end of the spectrum,
Malaysia, Albania, the Dominican Republic and Nigeria
have all increased their education gender gaps by more
than 10%. The Dominican Republic has reversed out of
parity while Albania has seen a decrease in the degree
to which women take part in tertiary education, a gap
increase of 26%. In Malaysia, the decrease is across both
secondary and tertiary education. Figure 28 (page 37)
displays selected countries trajectories between 2006 and
2015 on the Educational Attainment subindex.
Among the 109 countries we have covered for the
past 10 years, 30% of countries have closed the Health
and Survival Gap to date. In 2006, this figure stood at only
18% of countries. In the last 10 years, the health gap has
increased by a small fraction: while in 2006 the health gap
was closed by 96.2%, today it is closed by 95.6%. The
Asia and Pacific region has seen a gender gap increase
of 1%—unsurprising, since large and populous economies
such as India and China are the worst performers in
this area. North America and the Middle East have
both stepped back from near parity by 0.5% and 0.3%
respective. North America’s widening health gap is in
contrast to the region with which it used to share the top
spot in health in 2006, Latin America and the Caribbean.
Latin America and the Caribbean currently leads the Health
and Survival subindex, and has kept its general position
at near parity, having closed 98% of its health and survival
gap. Sub-Saharan Africa and Europe and Central Asia
are the only regions that have seen a decrease in their
gender gap. Sub-Saharan Africa’s gap decrease has seen
it overtake Middle East and North Africa in this aspect of
gender parity. Figure 24 (page 35) displays the Health
and Survival subindex evolution by region.
The countries that improved the most in health are
Nepal, Pakistan, Bangladesh and Botswana (starting from
a score of roughly 0.95, or a 3% gap from parity). The
countries that have declined the furthest on the Health and
Survival subindex are India, China and Albania. Since 2006,
India and China have widened their gender gaps by around
2% and, today, the countries with the largest gender gaps
in this subindex are, in fact, China, India and Albania (6%,
4%, 3% away from parity, respectively). Figure 29 (page
The Global Gender Gap Report 2015 | 33
Part 1: Measuring the Global Gender Gap
Figure 21: Global Index Evolution 2006–2015, by region
Global Gender Gap Index score
(0.0–1.0 scale)
0.8
0.7
0.6
Sub-Saharan Africa
Europe and Central Asia
Latin America and the Caribbean
North America
Asia and the Pacific
Middle East and North Africa
World
0.5
2006
2007
2008
2009
2010
2011
2012
2013
2014
2015
Source: Global Gender Gap Index 2015.
Notes: Regional classification details are in Appendix A. The Y axis has been truncated to enhance readability.
37) displays selected countries’ progress towards gender
parity on the Health and Survival subindex.
On average, the political participation gap has closed
the fastest in the past 10 years—by approximately 9%
(0.144 to 0.236). However, this gap is still wide across
the world. Asia and the Pacific has a political gender gap
that is narrower than the world average, and has closed
by over 10% in the last 10 years, but it still has to close
74% of the gap to reach parity. Until 2009, Europe and
Central Asia was growing at a similar rate; however, the
region has fallen behind the curve and currently performs
below Asia and the Pacific. Similarly, North America lags
behind Latin America and Sub-Saharan Africa for women’s
political participation after a brief increase in 2010–2011.
The momentary increase did not leave lasting change,
leaving Latin America and Sub-Saharan Africa to pull
significantly into the lead. Latin America has experienced
healthy progress, closing 9% of its political gender gap
over 10 years; it now has, on average, closed 20% of its
gender gap. On the other end of the spectrum, the Middle
East and North Africa has the widest remaining political
gap, having barely closed 9% of its gender gap. However,
countries across the Middle East and North Africa have
collectively closed 6% of the political gender gap since
2006, the second-largest progress among all regions.
Figure 25 (page 35) shows the Political Empowerment
subindex evolution by region.
While the overall trajectory on the Political
Empowerment subindex has been positive, it has the most
volatility across countries as political roles and systems are
subject to variation. Among the most improved countries
are Bolivia, Slovenia, Nicaragua, Iceland and France in the
top five, with Italy and Switzerland close behind. They have
closed between 20 and 35% of their gender gaps. Iceland,
34 | The Global Gender Gap Report 2015
Finland and Norway are both highly placed and have
made strong improvement. Slovenia has made the largest
increase from the lowest base. In 2006, it had closed
15% of its political gender gap; today the figure stands
at 38%. It is followed by France, which had closed 10%
and now has gone on to close 37%. Iceland significantly
outperforms all other countries. Iceland had closed 46% in
2006, and in the past 10 years it has come to close 72%.
Bolivia’s improvement stems from the larger participation of
women in parliament, where the country has now reached
parity—up from 34% in the past—but is offset by its
ministerial score halving since 2012.
Only two countries have gender equality in ministerial
roles currently, the same as in 2006. France’s recent
improvement is largely due to a parity cabinet, similar to its
rise in 2008 and 2009. In 2006, Spain had achieved parity
on the Women in ministerial positions indicator, as had
Sweden. While Sweden has sustained this position, Spain’s
ministerial parity has dropped sharply. It currently stands
56% away from parity. Nicaragua’s progress across this
indicator has been stable thus far.
Ten years ago, 62% of countries had never had a
female head of state, today that figure has dropped to
50%. Australia, Brazil, Costa Rica, Denmark, Kyrgyz
Republic, Malawi, Mali, Mauritius, Moldova, Slovak
Republic, Slovenia, Thailand, and Trinidad and Tobago
have all elected a female head of state for the first time
since 2006. Countries’ performance on the Political
Empowerment subindex is closely related to the presence
of political quotas. For example, Nicaragua, Bolivia and
France have all put into place voluntary political quotas.
Figure 30 (page 37) displays the evolution of selected
countries within the Political Empowerment subindex.
Part 1: Measuring the Global Gender Gap
Figure 23: Educational Attainment subindex
evolution 2006–2015, by region
Figure 22: Economic Participation and Opportunity
subindex evolution 2006–2015, by region
1.0
0.8
0.9
0.7
Sub-Saharan Africa
Educational Attainment
subindex score (0.0–1.0 scale)
Economic Participation and Opportunity
subindex score (0.0–1.0 scale)
World
North0.8
America
0.6
Middle East and North Africa
0.5
0.7
Latin America and the Carribbean
0.6
0.4
Europe and Central Asia
Asia and
0.5 the Pacific
0.3
2006 2007 2008 2009 2010 2011 2012 2013 2014 2015
2006 2007 2008 2009 2010 2011 2012 2013 2014 2015
Figure 24: Health and Survival subindex
evolution 2006–2015, by region
Figure 25: Political Empowerment subindex
evolution 2006–2015, by region
1.0
0.5
Political Empowerment
subindex score (0.0–1.0 scale)
Health and Survival
subindex score (0.0–1.0 scale)
0.9
0.8
0.7
0.4
0.3
0.2
0.6
0.1
0.5
0.0
2006 2007 2008 2009 2010 2011 2012 2013 2014 2015
2006 2007 2008 2009 2010 2011 2012 2013 2014 2015
Sub-Saharan Africa
Europe and Central Asia
Latin America and the Caribbean
North America
Asia and the Pacific
Middle East and North Africa
World
Source (Figures 22–25): Global Gender Gap Index 2015.
Notes (Figures 22–25): Regional classification details are in Appendix A. The Y axis has been truncated to enhance readability.
THE CASE FOR GENDER EQUALITY
The most important determinant of a country’s
competitiveness is its human talent—the skills and
productivity of its workforce. Similarly, an organization’s
performance is determined by the human capital that it
possesses and its ability to use this resource efficiently.
Ensuring the healthy development and appropriate use
of half of the world’s available talent pool thus has a vast
bearing on how competitive a country may become or how
efficient a company may be. There is clearly also a valuesbased case for gender equality: women are one-half of the
world’s population and deserve equal access to health,
education, economic participation and earning potential,
and political decision-making power. Gender equality is
thus fundamental to whether and how societies thrive.
The Global Gender Gap Report 2015 | 35
Part 1: Measuring the Global Gender Gap
Figure 31 (page 38) demonstrates the relationship
between GDP per capita and the Global Gender Gap Index
2015. Figure 32 (page 38) shows the links between the
Human Development Index 2014 and Global Gender Gap
Index 2015 and Figure 33 (page 39) illustrates the links
between the Global Competitiveness Index 2015–2016
and Global Gender Gap Index 2015. The graphs confirm a
correlation between gender equality and GDP per capita,
the level of competitiveness and human development.
The correlation is evident despite the fact that the Global
Gender Gap Index (unlike other gender indexes) explicitly
eliminates any direct impact of the absolute levels of any
of the indicators used in the Index (e.g. life expectancy,
educational attainment, labour force participation), as
these may be impacted by the relative wealth of a country.
While correlation does not prove causality, it is consistent
with the theory and mounting evidence that empowering
women means a more efficient use of a nation’s human
capital endowment and that reducing gender inequality
enhances productivity and economic growth.
The Global Gender Gap Index takes into account four
critical areas when measuring the gaps between women
and men’s access to resources and opportunities. For
each of these areas, there are economic or societal gains
from increased gender parity. This section summarizes
some of the key research findings on the broader
economic and societal case for gender equality. Figures 34
through 39 (starting on page 39) display some of the key
relationships.
The multiplier effect of girls’ education on several
aspects of development as well as its impact on economic
growth is now commonly accepted: education reduces
high fertility rates, lowers infant and child mortality rates,
lowers maternal mortality rates, increases labour force
participation rates and earnings, and fosters further
educational investment in children.8 Therefore, the cost
of girls’ exclusion from education considerably hinders
the productive potential of an economy and its overall
development. In the Asia and the Pacific region specifically,
it has been estimated that between US$16 billion to
US$30 billion is lost annually as a result of gender gaps in
education.9 Investing in advancing girls’ education would in
fact lead to lifetime earnings of today’s cohort of girls of up
to 68% of annual GDP. Similarly, closing the inactivity rate
between girls and boys would also increase GDP by up to
5.4% by some measures.10
The impact of health on economic growth is also well
documented. Studies have shown that a one-year increase
in health expectancy could raise GDP by up to 4%.11 More
spending on health significantly improves health outcomes,
which in turn contribute to reducing poverty and improving
overall growth. Similar to education, investing in health and
specifically in maternal, newborn and child health has a
multiplier effect.12
There is a strong case for broadening women’s
representation in politics. Research has found that
36 | The Global Gender Gap Report 2015
Figure 26: Global Gender Gap Index evolution 2006-2015,
selected countries
Finland: 85%
Norway: 85%
Sweden: 82%
Sweden: 81%
Norway: 80%
Finland: 80%
Nicaragua: 78%
South Africa: 76%
Bolivia: 75%
United States: 74%
Sri Lanka: 72%
South Africa: 71%
United States: 70%
Russian Federation: 68%
China: 66%
Nicaragua: 66%
Average: 65%
Brazil: 65%
Japan: 64%
Bolivia: 63%
India: 60%
Nepal: 55%
Pakistan: 54%
Brazil: 69%
Russian Federation: 69%
Sri Lanka: 69%
Average:68%
China: 68%
Japan: 67%
Nepal: 66%
India: 66%
Saudi Arabia: 60%
Pakistan: 56%
Saudi Arabia: 52%
Yemen: 48%
Yemen: 46%
'06 '07 '08 '09 '10 '11 '12 '13 '14 '15
Source: Global Gender Gap Index 2015.
inequality is lower in countries where more women
have been engaged in public life. The breadth of issues
women tend to advocate and prioritize investments
on, have broader societal implications relating to family
life, health and education, thereby fostering greater
credibility in institutions and producing more democratic
outcomes.13 There is also some evidence from India to
suggest that women in local government roles make
decisions with better outcomes for communities than men
do when charged with budget decisions.14 They obtain
more resources for their constituencies despite having
significantly lower education and relevant labor market
experience.15 More equal female representation in political
bodies also affects the participation of women in the
workforce, suggesting that greater participation of women
in politics could serve as a policy tool to positively impact
labour force participation by increasing supply and demand
of employment opportunities for women.16
Having more women in the workforce contributes
to economic performance through several pathways.
According to one study, greater female participation in the
U.S. workforce since 1970 accounts for a quarter of current
GDP).17 Another study indicates that the reduction in the
male-female employment gap has been an important driver
of European economic growth in the last decade. Closing
this gap would have massive economic implications for
Part 1: Measuring the Global Gender Gap
Figure 27: Economic Participation and Opportunity
subindex evolution 2006-2015, selected countries
Norway: 87%
Sweden: 84%
United States: 83%
Tanzania: 81%
Figure 28: Educational Attainment subindex
evolution 2006–2015, selected countries
Brazil, Russian Federation,
United States: 100%
China, Japan, South Africa: 99%
Russian Federation: 100%
Albania, Japan,
South Africa: 99%
United States: 98%
Brazil: 97%
China: 96%
Albania: 97%
Average: 95%
Nepal: 92%
Average: 92%
United States: 76%
India: 90%
Sweden: 73%
Norway: 73%
Russian Federation: 70%
Russian Federation: 73%
Tanzania: 71%
South Africa: 67%
China: 66%
Brazil: 64%
Guatemala: 63%
Japan: 61%
Bahrain: 60%
Average: 59%
China: 62%
Brazil: 60%
South Africa: 56%
Average: 56%
Japan: 55%
Burkina Faso: 83%
India: 82%
Ethiopia: 74%
Nepal: 73%
Ethiopia: 74%
Yemen: 72%
Burkina Faso: 65%
Jordan: 44%
Guatemala: 44%
Yemen: 60%
India: 40%
Bahrain: 38%
Iran: 36%
Chad: 59%
Saudi Arabia: 39%
India: 38%
Iran: 36%
Jordan: 35%
Chad: 47%
Saudi Arabia: 24%
'06 '07 '08 '09 '10 '11 '12 '13 '14 '15
'06 '07 '08 '09 '10 '11 '12 '13 '14 '15
Figure 30: Political Empowerment subindex
evolution 2006–2015, selected countries
Figure 29: Health and Survival subindex
evolution 2006–2015, selected countries
Brazil: 98%
Japan: 98%
United States: 98%
Russian Federation: 98%
Yemen: 98%
Saudi Arabia: 98%
South Africa: 98%
Brazil: 98%
South Africa: 98%
Japan: 98%
Russian Federation: 98%
Iceland: 72%
Yemen: 97%
Botswana: 97%
United States: 97%
Nepal: 97%
Pakistan: 97%
Bangladesh: 97%
Georgia: 97%
Saudi Arabia: 97%
Mali: 97%
India: 96%
Average: 96%
Botswana: 96%
Albania: 96%
Finland: 61%
Average: 96%
Nicaragua: 51%
Finland: 47%
Iceland: 46%
Nepal: 95%
Pakistan: 95%
Bangladesh: 95%
Mali: 95%
Albania: 95%
Spain: 42%
India: 43%
Bolivia: 41%
South Africa: 40%
Slovenia: 39%
Sri Lanka: 37%
South Africa: 33%
China: 94%
India: 94%
India: 23%
Spain: 33%
Average: 24%
Nicaragua: 19%
Georgia: 92%
China: 94%
'06 '07 '08 '09 '10 '11 '12 '13 '14 '15
Sri Lanka: 19%
United States: 16%
Paraguay: 14%
China: 16%
Average: 14%
Brazil: 12%
China: 11%
Japan: 10%
United States: 10%
Paraguay: 8%
Bolivia: 9%
Saudi Arabia: 8%
Hungary: 7%
Russian Federation: 7%
Japan: 7%
Brazil: 6%
Hungary: 3%
Slovenia: 6%
Kuwait: 2%
Russian Federation: 3%
Kuwait: 0% '06 '07 '08 '09 '10 '11 '12 '13 '14 '15
Saudi Arabia: 0%
Source (Figures 27–30): Global Gender Gap Index 2015.
The Global Gender Gap Report 2015 | 37
Part 1: Measuring the Global Gender Gap
Figure 31: GDP per capita vs Global Gender Gap Index 2015
Norway
United Arab Emirates
60,000
Switzerland
United States
Saudi Arabia
GDP per capita, PPP
(constant 2011 international $)
50,000
Germany
Oman
40,000
Korea
Iceland
Finland
United Kingdom
Japan
30,000
Russian Federation
Brazil
20,000
Mexico
Iran
China
Indonesia
Nigeria
10,000
0.5
Philippines
India
Pakistan
Chad
0
South Africa
Rwanda
0.6
0.7
0.8
0.9
1.0
Global Gender Gap Index score (0.0–1.0 scale)
Source: Global Gender Gap Index 2015 and the World Bank’s World Development Indicators (WDI) online database, accessed July 2015.
Notes: GDP per capita for Kuwait, Luxembourg, Norway, Qatar, Singapore and the United Arab Emirates has been capped at $60,000. Argentina is not included in the figure. The X axis has been
truncated to enhance readability.
Figure 32: Human Development Index vs Global Gender Gap Index 2015
1.0
Qatar
Germany
Japan
Russian Federation
Brazil
Mexico
United Arab Emirates
China
Indonesia
Saudi Arabia
0.8
Iran
Human Development Index
2014 values (0.0–1.0 scale)
United States
Korea
0.6
India
Pakistan
0.4
Norway
Finland
Iceland
United Kingdom
South Africa
Nicaragua
Rwanda
Nigeria
Burundi
Chad
0.2
0.0
0.5
0.6
0.7
0.8
0.9
1.0
Global Gender Gap Index score (0.0–1.0 scale)
Sources: Global Gender Gap Index 2015 and UNDP International Human Development Indicators online database, 2014 (accessed October 2015).
Notes: The X axis has been truncated to enhance readability. Angola, Bahamas, Barbados, Belarus, Belize, Brunei Darussalam, Burkina Faso, Cuba, Fiji, Maldives, Suriname, Syria and Yemen
are not included in the figure.
developed economies, boosting US GDP by as much as
9% and euro zone GDP by as much as 13%.18 Conversely,
limiting women’s access to labour markets is costly. For
example, Asia and the Pacific reportedly loses US$42
billion to US$47 billion annually as a region because of
women’s limited access to employment opportunities.19
Research by the World Bank demonstrates that similar
restrictions have also imposed massive costs throughout
the Middle East, where decades of substantial investment
have dramatically reduced the gender gap in education but
where the gender gap in economic opportunity remains
the widest in the world.20
38 | The Global Gender Gap Report 2015
There is also a growing business case for gender
diversity. As women become more economically
independent, they also become more significant
consumers of goods and services, including for the
majority of purchasing decisions of the household.
Research has also shown that women are more likely
than men to invest a larger proportion of their household
income to the education and health of their children.
The combined impact of growing gender equality, the
emerging middle class and women’s spending priorities
is expected to lead to rising household savings rates
and shifting spending patterns, affecting sectors such
Part 1: Measuring the Global Gender Gap
Figure 33: Global Competitiveness Index vs Global Gender Gap Index 2015
7
Global Competitiveness Index 2015–2016
score (1–7 scale)
6
Singapore United States
Japan
Saudi Arabia
5
Iran
4
China
Indonesia
India
Switzerland
Germany
Finland
United Kingdom
Russian Federation
Iceland
South Africa
Mexico
Brazil
Nigeria
Pakistan
3
United Arab Emirates
Malawi
Chad
Burundi
Guinea
2
1
0.5
0.6
0.7
0.8
0.9
1.0
Global Gender Gap Index score (0.0–1.0 scale)
Sources: Global Gender Gap Index 2015 and Global Competitiveness Index 2015–2016.
Notes: The X axis has been truncated to enhance readability. Angola, Bahamas, Barbados, Belarus, Belize, Brunei Darussalam, Burkina Faso, Cuba, Fiji, Maldives, Suriname, Syria and Yemen are not
included in the figure.
Figure 34: GDP per capita vs Economic Participation and Opportunity subindex 2015
United Arab Emirates
60,000
Norway
United States
Saudi Arabia
GDP per capita, PPP
(constant 2011 international $)
50,000
Germany
Oman
Iceland
United Kingdom Finland
40,000
Japan
Korea
30,000
Russian Federation
Brazil
20,000
Jordan
10,000
Botswana
Mexico
Iran
China
Indonesia
South Africa
Nigeria
Philippines
India
Pakistan
0
0.0
0.2
Burundi
0.4
0.6
0.8
1.0
Economic Participation and Opportunity subindex score (0.0–1.0 scale)
Sources: Global Gender Gap Index 2015 and the World Bank’s World Development Indicators (WDI) online database, accessed July 2015.
Notes: GDP per capita for Kuwait, Luxembourg, Norway, Qatar, Singapore and the United Arab Emirates has been capped at $60,000. Argentina is not included in the figure.
as food, healthcare, education, childcare, apparel,
consumer durables and financial services.21 In nearly 100
countries women now account for more than half of the
college and university graduates. As they begin to take
up half of entry-level positions in several industries—in
several OECD countries, for example—it is a loss for
companies if these highly skilled women are forced to
choose between work and family at later stages of their
career.22 Additionally, in a highly interconnected and
rapidly changing world, organizations and countries must
adapt strategies and innovate in order to remain relevant
and competitive, augmenting the need for the creativity
fostered by diversity.23 Diversity is also critical to informed
decision-making.
When it comes to leadership positions, companies
with top quartile representation of women in executive
committees in general perform better than companies
with no women at the top, by some estimates with a 47%
average return on equity.24 Links exists between having
more women directors and corporate sustainability, as
well as with economic growth. More diverse leadership
teams can cater to a broader array of stakeholder needs
and concerns.25 They are enriched by diverse leadership
The Global Gender Gap Report 2015 | 39
Part 1: Measuring the Global Gender Gap
Figure 35: Economic Participation and Opportunity subindex vs Educational Attainment subindex 2015
Economic Participation and Opportunity
subindex score (0.0–1.0 scale)
MEAN
1.0
0.6
Norway
United States
Burundi
0.8
Benin
MEAN
United Kingdom
Russian Federation
Brazil
Japan
Germany
South Africa
China
Indonesia
Korea
United Arab Emirates
Nigeria
Guinea
Chad
Mexico
Mauritania
0.4
India
Morocco
Pakistan
Iran
Saudi Arabia
Jordan
0.2
0.0
0.5
0.6
0.7
0.8
0.9
1.0
Educational Attainment subindex score (0.0–1.0 scale)
Sources: Global Gender Gap Index 2015 and the World Bank’s World Development Indicators (WDI) online database, accessed July 2015.
Notes: GDP per capita for Kuwait, Luxembourg, Norway, Qatar, Singapore, and the United Arab Emirates has been capped at $60,000. Argentina is not included in the figure. The X axis has been
truncated to enhance readability.
Figure 36: Economic Participation and Opportunity subindex vs Educational Attainment subindex 2015 (only G20 countries)
Economic Participation and Opportunity
subindex score (0.0–1.0 scale)
1.0
0.8
Germany
0.6
Korea
South Africa
China
Japan
Indonesia
France
United States
Canada
Australia
Russian Federation
United Kingdom
Brazil
Argentina
Italy
Mexico
Turkey
0.4
India
Saudi Arabia
0.2
0.8
0.9
1.0
Educational Attainment subindex score (0.0–1.0 scale)
Source: Global Gender Gap Index 2015.
Note: The X and Y axes have been truncated to enhance readability.
skills and capacities, are better positioned to reflect the
consumer and are more risk averse.26
The Global Gender Gap Index helps reveal which
countries are relatively strong or weak at integrating female
talent in the economy. Among the 145 countries covered,
almost 95% of the gap in educational attainment has been
closed. In nearly 100 of these countries, women make up
the majority of those in tertiary education. This means that,
though countries are ideally poised to maximize opportunities
for women’s participation in the labour market, many have
failed to reap the returns from this investment. In Figure 35
(page 40), we plot the Educational Attainment subindex
40 | The Global Gender Gap Report 2015
against the Economic Participation and Opportunity
subindex, while Figure 36 (page 40) specifically focuses
on G20 countries. The data reveals four broad groups of
countries: (1) countries that have closed or are generally
closing education gaps and show high levels of women’s
economic participation, (2) countries that have closed or
are generally closing education gaps but show low levels of
women’s economic participation, (3) countries that have large
education gaps as well as large gaps in women’s economic
participation and (4) countries that have large education gaps
but display small gaps in women’s economic participation.
Part 1: Measuring the Global Gender Gap
Figure 37: Economic Participation and Opportunity subindex vs Political Empowerment subindex 2015
Economic Participation and Opportunity
subindex score (0.0–1.0 scale)
1.0
0.8
Botswana
United States
Norway
Burundi
Finland
Russian Federation
United Kingdom
Nigeria
China
Brazil
Japan
Indonesia
Korea
Mexico
United Arab Emirates
0.6
South Africa
Nicaragua
Bangladesh
Oman
0.4
Iran
Iceland
Germany
Saudi Arabia
Pakistan
India
0.2
0.0
0.0
0.2
0.4
0.6
0.8
1.0
Political Empowerment subindex score (0.0–1.0 scale)
Source: Global Gender Gap Index 2015.
In the first broad group are countries that have
made investments in women’s health and education,
and generally see the returns on this investment in terms
of women’s economic and political participation. These
countries include the Nordic countries, the United States,
the Philippines, Canada, New Zealand and Australia.
These countries have not, however, fully closed economic
and participation gaps—in particular, the gaps in senior
positions, wages and leadership levels still persist. In the
second broad group are countries that have made key
investments in women’s education but have generally not
removed barriers to women’s participation in the workforce
and are thus not seeing returns on their investments in
the development of one half of their human capital. This
group includes Japan, United Arab Emirates, Chile and
Brazil. These countries have an untapped but educated
talent pool and would have much to gain through women’s
greater participation in the workforce. In the third and
fourth groups, the most basic investments in girls’ and
women’s education still need to be made, and fundamental
rights—including legal frameworks around inheritance,
reproductive rights and violence—are often inadequate.
The third group contains countries such as Yemen,
Pakistan, India, and Mauritania that have large education
as well as economic gender gaps. The fourth group
contains countries such as Guinea, Chad, Mozambique
and Burundi, which have large education gender gaps
but small economic ones, primarily due to high levels of
participation by women in low-skilled work. Compared
with the third group, women in these countries have
greater access to income and decision-making. However,
a substantial body of literature has shown that investing in
girls’ education is one of the highest-return investments a
developing economy can make—and, for these countries,
closing education gaps will remain an important factor
over time.
Finally, demographic changes are added drivers for
women’s economic participation. For example, in ageing
economies, as labour forces shrink and talent shortages
emerge, women’s integration into the economy is key to
promoting dynamism. In countries where it is relatively easy
for women to combine work with having children, female
employment and female fertility both tend to be higher.
Policies that allow women to combine work and family may
thus play a role in addressing the future problems posed by
ageing populations.27 A study has shown that closing the
gap between male and female employment would boost
Japanese GDP by as much as 16%. Figure 38 (page 42)
shows the old-age dependency ratio (as a percentage of
the working age population) plotted against the economic
gender gap, while figure 39 (page 42) should the youngage dependency ratio (as a percentage of the working age
population).
BUSINESS AND POLICY IMPLICATIONS
As detailed in the last section, a nation’s competitiveness
depends, among other things, on whether and how it
educates and utilizes its female talent. As this awareness
grows, coupled with better measurement, there is a
growing demand from and pressure on the public and
private sectors to learn from existing practices and innovate
to facilitate women’s integration into the workforce. There
is ample evidence from the last decade of policy levers
and business practices that have been effective in closing
economic gender gaps. Given the widespread benefits of
increased gender parity, the short term costs and tradeoffs associated with such practices should be viewed as a
long-term investment.
The Global Gender Gap Report 2015 | 41
Part 1: Measuring the Global Gender Gap
Figure 38: Old age dependency ratio vs Economic Participation and Opportunity subindex 2015
50
High old-age dependency,
narrow economic gender gap
MEAN
High old-age dependency,
wide economic gender gap
Japan
Age dependency ratio, old
(% of working-age population)
40
Italy
Greece
30
Germany
Malta
Sweden
United Kingdom
Norway
United States
20
Korea
MEAN
Lebanon
10
Saudi Arabia
Low old-age dependency,
wide economic gender gap
0
0.0
China
Brazil
South Africa
Indonesia
Nigeria
United Arab Emirates
Mexico
India
Pakistan
Russian Federation Iceland
Burundi
Qatar
0.2
0.4
0.6
0.8
Low old-age
dependency,
narrow
economic
gender gap
1.0
Economic Participation and Opportunity subindex score (0.0–1.0 scale)
Sources: Global Gender Gap Index 2015 and World Bank World Development Indicators database, accessed October 2015.
Notes: Age dependency ratio, old, is the ratio of older dependents—people older than 64—to the working-age population—those ages 15–64. Data are shown as the proportion of dependents per 100
working-age population. Angola, Bahamas, Barbados, Belarus, Belize, Brunei Darussalam, Burkina Faso, Cuba, Fiji, Maldives, Suriname, Syria and Yemen are not included in the figure.
Figure 39: Young age dependency ratio vs Economic Participation and Opportunity subindex 2015
Chad
High child dependency,
wide economic gender gap
MEAN
100
High child dependency,
narrow economic gender gap
Uganda
Mali
Burundi
Nigeria
Age dependency ratio, young
(% of working-age population)
80
Mauritania
Pakistan
60
40
MEAN
India
Saudi Arabia
Mexico
Oman
20
Japan
Korea
China
Qatar
United Kingdom
Russian Federation
Germany
United Arab Emirates
Low child dependency,
wide economic gender gap
0.0
United States
Brazil
Iran
0
South Africa
Indonesia
0.2
0.4
0.6
Norway
Low child dependency,
narrow economic gender gap
0.8
1.0
Economic Participation and Opportunity subindex score (0.0–1.0 scale)
Source: Global Gender Gap Index 2015.
Notes: Age dependency ratio, young, is the ratio of younger dependents—people younger than 15—to the working-age population—those ages 15–64. Data are shown as the proportion of dependents
per 100 working-age population. Angola, Bahamas, Barbados, Belarus, Belize, Brunei Darussalam, Burkina Faso, Cuba, Fiji, Maldives, Suriname, Syria and Yemen are not included in the figure.
Policy levers
Government policy is critical for shaping the type of
ecosystem that facilitates women’s economic participation,
and many governments now institute policies that
encourage women to work and make it easier for them to
do so. Such policies can range from non-discrimination
in hiring to maternity and paternity leave regimes to
quotas encouraging women’s participation in economic
life. For example personal income tax liability can affect
workers’ decisions about how much or whether to work.
Women, particularly those who are married, are more
negatively affected by income tax rules. In contrast,
42 | The Global Gender Gap Report 2015
childcare subsidies such as tax credits increase women’s
participation in the labour force.28 As policy outcomes are
better investigated, governments have a growing portfolio
of tools available to address gender equality in the labour
force.
From 2011–2013, the World Economic forum
conducted a survey of national policy frameworks relating
to parental leave, childcare assistance, type of taxation
and workplace equality.29 While these measures relate
directly to promoting women’s employment, they are not
exhaustive. In this section, we summarize some of the
main findings of the survey on the levers currently used by
Part 1: Measuring the Global Gender Gap
governments around the world to integrate more women
into the workforce. In addition, the Country Profiles contain
detailed supplementary information on policy and legal
frameworks.
Family Leave. Maternity, paternity and parental
leave—or any other type of additional shared leave—are
closely associated with women’s economic participation
in many parts of the world and are thus an important
element of policies aimed at more efficient use of the
country’s human capital pool. Parental benefits enabling
mothers, fathers or both to take paid or unpaid time off
to care for a child following birth can increase women’s
participation in the workforce and foster a more equitable
division of childrearing.30 For further details on the findings
of the survey, including duration and provider of maternity,
paternity and share leaves by region and income group
please refer to previous editions of the Report.
More women participate in the labour force in
economies with longer fully paid maternity and parental
leave available for mothers. However, these benefits,
above a certain threshold, can undermine women’s labour
force participation. For example, in economies where the
cumulative duration of paid maternity and parental leave
available for mothers exceeds two years, female labour
force participation is lower.31
Childcare assistance. Childcare is an important factor
in allowing women to reconcile professional and family
obligations because women tend to bear the majority
of the caregiving responsibilities in most countries. For
example, a well-established daycare system can be a longterm investment that supports women in the employment,
thereby improving the efficiency of labour markets. In some
parts of the developed world, research has shown that
daycare assistance may even impact fertility rates.
Among the 87 countries surveyed by the World
Economic Forum, childcare assistance varies between
economies and includes public daycare, private daycare
and homecare, for which there may or may not be
government assistance.32 Globally, public daycare with
allowance represents 25% as compared to 11% of public
daycare without allowance. Of the respondents, 21% say
that the country offers private daycare with allowance
as compared to 20% without allowance; and homecare
with allowance is offered by 10% of the respondents
as compared to 13% without allowance. A majority
of economies have public daycare assistance with
government allowance or subvention (66.7%) while there
are fewer countries that have government allowance for
private daycare (55.2%). With homecare, it is more likely
that there is no allowance offered. For further details about
childcare assistance by region, please refer to previous
editions of the Report.
Taxation systems. Tax legislation may contain
potentially discriminatory provisions that treat men and
women differently. For example, some forms of taxation
might alter the disposable income available to men and
women in a family and may thus have implications for the
economic and social decision-making at the household
level. The different forms of taxation on which questions
were asked include individual taxation, income-splitting33
and joint filing. Across regions, individual taxation tends to
be most favourable for women; joint taxation tends to be
least favourable. For further details about taxation system
by region and income group, please refer to previous
editions of the Report.
Equality at work and quotas. Legislative structures
may help prevent gender-biased discrimination in society
and create an ecosystem of support for women through,
among other policies, obligatory and voluntary quotas in
public and private entities, targeted subsidies to female
businesses and supervisory bodies monitoring the
implementation of national policies. Out of the responding
countries, 92% have legislation in place prohibiting genderbased discriminations, 88% have legislation imposing
gender-neutral practices in the workplace, 12% have
legislation for mandatory percentage of both genders on
corporate boards34 and 35% have legislation for mandatory
percentage of both genders in political assemblies.
Seventy-six percent of countries report having a monitoring
authority in place, 38% have gender equal labels and 36%
have allowances/subventions to female entrepreneurs.
Business Best Practices
For companies to put in place and leverage the benefits
of gender diversity, their leaders need to take a holistic
approach that often leads to fundamental reforms on
how to recruit and retain employees; how to mentor and
sponsor high-potential women; how to sensitize managers
to different leadership styles; how to manage work-life
balance policies so that they don’t disadvantage women;
how to empower women across supply chains; and how
to manage efficient corporate responsibility initiatives so
that they support women and girls. The World Economic
Forum’s Repository of Successful Practices for Gender
Parity pools information on the practices that have been
successfully used in leading companies worldwide to close
gender gaps at the corporate level, as well as along the
companies’ supply chain and in the communities where
companies are embedded.35 The repository suggests
six dimensions around which to focus an organization’s
gender parity efforts:
Leadership and company commitment. Visible
leadership by the chief executive and top management on
supporting women in management has proven to be one of
the most important levers for progress in achieving gender
diversity in a corporate context. This includes concrete and
symbolic actions by top management and, in many cases,
establishment of a position or department to lead diversity
efforts.36 Regular communications by senior management
on gender equality have been found to be critical.
Measurement and target setting. Achievable,
relevant recruitment and retention targets at all levels,
The Global Gender Gap Report 2015 | 43
Part 1: Measuring the Global Gender Gap
with an embedded accountability mechanism, are
critical. Developing a disaggregated database can help
to evaluate the causes of gender imbalances and track
progress. Transparent salary bands to track and address
male and female salary gaps are additional useful tools to
understand the status quo in organizations.
Awareness and accountability. The focus of many
companies on building awareness indicates that the
case for change still needs to be built to make progress.
Accountably of the senior management and transparency
of career paths and opportunities have proven to be
effective practices. Ensuring that management policies,
processes, systems and tools do not harbour genderbiased discrimination and enhancing the understanding
of unconscious biases can also make inclusive leadership
more tangible.
Work environment and work- life balance. Women
are often the primary caregiver for both children and the
elderly in most countries. Ensuring smooth on- and offramping and appropriate childcare options, and developing
guidelines on implementation of work-life balance policies
and mentoring for women going through a transition are
important levers to ensure a sustained career progression
towards management. For those companies that already
offer parental leave, flexible working hours and other worklife balance programmes, the next steps lie in accelerating
their use and acceptance of their female and male
employees.
Mentorship and training. Companies have benefitted
from programmes that promote guidelines on the value
of diversity as an underlying culture of the organization,
and impart knowledge on how to manage a more diverse
workforce and how to attract, retain and promote female
talent. These training programmes, for both men and
women, can be relevant for shaping an environment within
the broader employee base for women to successfully
lead. In addition, many companies have formal mentoring
schemes for women seeking leadership positions, although
they also find that high-potential women lack the sponsorship
and tailored training needed to move into the executive ranks.
A repositioning of the human resources directors beyond a
focus on systems and administration to talent development
and training can help address specific roadblocks for
women, in addition to better overall talent management.
Responsibility beyond the office. Many companies
have leveraged the opportunity to exercise external
influence along the value chain including diversity training
for suppliers, distributors and partners and training to
support women-owned businesses in the organization’s
value chain. External influence can also be exercised by
ensuring gender neutrality in advertising, engaging girls
and young women to display possible career paths and
developing partnerships with gender parity-focused civil
society and public sector initiatives.
It is important to emphasize that these interventions
do not work as a checklist of actions that will each
44 | The Global Gender Gap Report 2015
independently produce results.37 The right leadership
context is critical. It must be accompanied by a holistic
set of priorities and a long-term commitment, and with a
deep understanding of the corporate, industry, and cultural
context, as well as the organizational culture and local
policy environment. While some of the transformations
in corporate practices and public policies will entail
adaptation in the short term by families, companies and the
public sector, in the long term, the subsequent expansion
of opportunities for women has the potential to transform
economies, society and demography of countries.38
CONCLUSION
The Global Gender Gap Report 2015 provides a
comprehensive overview of current performance and
progress over the last decade. On average, in 2015, over
96% of the gap in health outcomes, 95% of the gap in
educational attainment, 59% of the gap in economic
participation and 23% of the gap in political empowerment
has been closed. No country in the world has achieved
gender equality. The highest ranked countries—Iceland,
Norway, Finland, Sweden and Ireland —have closed
over 80% of their gender gaps, while the lowest ranked
country—Yemen—has closed a little less than half of its
gender gap (48%).
The Index points to potential role models by revealing
those countries that—within their region or their income
group—are leaders in having divided resources more
equitably between women and men than other countries
have, regardless of the overall level of resources available.
The detailed Country Profiles allow users to understand
not only how close each country lies relative to the equality
benchmark in each of the four critical areas, but also
provide a snapshot of the legal and social framework within
which these outcomes are produced.
The Global Gender Gap Index was developed in
2006 partially to address the need for a consistent and
comprehensive measure for gender equality that can track
a country’s progress over time. This edition of the Global
Gender Gap Report reveals the trends observed in the
data over the past 10 years and seeks to call attention to
the need for more rapid progress in closing gender gaps.
Out of the 109 countries covered in the past near-decade,
104 have improved their performance, while five have
widening gaps. In some countries, progress is occurring
in a relatively short time, regardless of whether they are
starting out near the top or the bottom of the rankings, and
independent of their income; yet in other countries, change
is much slower or negligible. The Index points to potential
learnings from those that have been able to accelerate the
pace of change.
The Report continues to highlight the strong
correlation between a country’s gender gap and its
economic performance, and summarizes some of the
latest research on the economic and societal case for
gender equality. Because women account for one-half of a
Part 1: Measuring the Global Gender Gap
Figure 40: Chief Human Resource Officers’ projections, 2020,
women in junior-level positions
50
Percentage of female employees
40
30
20
10
0
Japan
United States
Italy
United Kingdom Mexico
China
n 2015 n projected
Figure 41: Chief Human Resource Officers’ projections, 2020,
women in mid-level positions
50
Percentage of female employees
40
30
20
10
0
Japan
United States
Italy
United Kingdom Mexico
China
n 2015 n projected
Figure 42: Chief Human Resource Officers’ projections, 2020,
women in senior-level positions
50
40
Percentage of female employees
country’s potential talent base, a nation’s competitiveness
in the long term depends significantly on whether and how
it educates and utilizes its women. The Report highlights
the message to policy-makers that, in order to maximize
competitiveness and development potential, each country
should strive for gender equality—that is, should give
women the same rights, responsibilities and opportunities
as men. Four broad groups of countries are evident in the
Index: (1) countries that are generally closing education
gaps and show high levels of women’s economic
participation, (2) countries that are generally closing
education gaps but show low levels of women’s economic
participation, (3) countries that have large education gaps
as well as large gaps in women’s economic participation
and (4) countries that have large education gaps but
display small gaps in women’s economic participation.
The magnitude of gender gaps in countries around
the world is the combined result of various socioeconomic,
policy and cultural variables. The Index does not seek
to set priorities for countries but rather to provide a
comprehensive set of data and a clear method for tracking
gaps on critical indicators so that countries may set
priorities within their own economic, political and cultural
contexts. We also provide information in the Report on
the policy levers and business practices currently in use
around the world to address the economic gender gap.
What might the next 10 years look like? According
to the current rates, reaching parity could take a century
or more. However, as many of the measures that are
expected to help accelerate change—from paternity
leave policies to boardroom targets—have only been
implemented in the last few years, they may take some
time to bear fruit. Furthermore, 10 years ago the same
level of social awareness did not exist around the issue
of gender equality and the current momentum gives
cause for hope of faster change. Indeed, in a survey
of the Chief Human Resource Officers of some of the
largest companies in the world on gender equality and
the future of jobs, we found optimistic forecasts around
gender equality across most levels in organizations and
in most of the key economies surveyed. However, there
was also recognition of the changing nature of labour
markets and a potential reversal of the gains in gender
equality unless women and girls are better prepared for
the type of occupations that are likely to grow in the future.
Figures 40–42 show the expectations of Chief Human
Resource Officers around gender equality in entry level,
middle management and senior roles by 2020.
We hope that the information contained in the Global
Gender Gap Report series will serve as a basis for
continued benchmarking by countries on their progress
towards gender equality, help support the case for closing
gender gaps and encourage further research on policies
and practices that are effective at promoting change.
30
20
10
0
Japan
United States
Italy
United Kingdom Mexico
China
n 2015 n projected
Source (Figures 40–42): Global Gender Gap Index 2015.
The Global Gender Gap Report 2015 | 45
Part 1: Measuring the Global Gender Gap
NOTES
1 This ratio is based on what is considered to be a “normal” sex ratio
at birth: 1.06 males for every female born. See Klasen and Wink,
“Missing Women: Revisiting the Debate”.
2 This ratio is based on the standards used in the UN’s Gender-Related
Development Index, which uses 87.5 years as the maximum age for
women and 82.5 years as the maximum age for men.
3 A first attempt to calculate the gender gap was made by the World
Economic Forum in 2005; see Lopez-Claros and Zahidi, Women’s
Empowerment: Measuring the Global Gender Gap. The 2005 Index,
which was attempting to capture women’s empowerment, used
a “feminist” scale that rewarded women’s supremacy over men
(highest score is assigned to the country with the biggest gap in
favour of women).
4 The weights derived for the 2006 Index were used again this year
and will be used in future years to allow for comparisons over time.
5 This is not strictly accurate in the case of the Health and Survival
subindex, where the highest possible value a country can achieve is
0.9796. However, for purposes of simplicity we will refer to this value
as 1 throughout the chapter and in all tables, figures and Country
Profiles.
6 Because of the special equality benchmark value of 0.9796 for
the Health and Survival subindex, it is not strictly accurate that the
equality benchmark for the overall index score is 1. This value is
in fact (1 + 1 + 1 + 0.9796) / 4 = 0.9949. However, for purposes
of simplicity, we will refer to the overall equality benchmark as 1
throughout this chapter.
7 Since the indicators in the subindexes are weighted by the standard
deviations, the final scores for the subindexes and the overall Index
are not a pure measure of the gap vis-à-vis the equality benchmark
and therefore cannot be strictly interpreted as percentage values
measuring the closure of the gender gap. However, for ease of
interpretation and intuitive appeal, we will be using the percentage
concept as a rough interpretation of the final scores.
8 See the Global Gender Gap Report 2013.
9 ILO and ADV. “Women and labour markets in Asia – Rebalancing for
Gender Equality”, 2011.
10 Jad Chaaban and Wendy Cunningham, “Measuring the Economic
Gain of Investing in Girls: The Girl Effect Dividend”, World Bank Policy
Research Working Paper, World Bank, August 2011. http://elibrary.
worldbank.org/doi/book/10.1596/1813-9450-5753.
11 David E Bloom, David Canning and Jaypee Sevilla, “The Effect of
Health on Economic Growth: A Production Function Approach”,
World Development, Vol. 32, No. 1, pp. 1–13, 2004. (http://www.
ppge.ufrgs.br/giacomo/arquivos/eco02072/bloom-canningsevilla-2004.pdf).
12 Karl Wilhelmson and Ulf-G Gerdtham, “Impact on Economic
Growth of investing in maternal and newborn health”, World Health
Organization, 2006.
13 OECD. “Women, Government and Policy Making in OECD Countries
- Fostering Diversity for Inclusive Growth”, 2014.
14 See Beaman et al., “Powerful Women”.
15 Munshi and Rosensweig, “The Efficacy of Parochial Politics”.
16 Ejaz Ghani, Anandi Mani and Stephen D. O’Connell, “Can Political
Empowerment Help Economic Empowerment? Women Leaders
and Female Labor Force Participation in India”, World Bank, Policy
Research Working Paper 6675, Oct 2013.
17 McKinsey, “Unlocking the full potential of women in the U.S. economy
2011”.
18 See Daly, “Gender Inequality, Growth and Global Ageing”.
19 ILO and ADV. “Women and labour markets in Asia–Rebalancing for
Gender Equality”, 2011.
20 See World Bank, “Gender and Development in the Middle East and
North Africa”.
21 Goldman Sachs Global Markets Institute. “The Power of the Purse”.
22 See Ibarra and Zahidi, The Corporate Gender Gap Report 2010.
46 | The Global Gender Gap Report 2015
23 Lauren Leader-Chivee, “New Study: Diversity Drives Serial
Innovation”, October 2013 and Deloitte, “Waiter, is that inclusion in
my soup? A new recipe to improve business performance”, 2012
(http://www.deloitte.com/assets/Dcom-Australia/Local%20Assets/
Documents/Services/Consulting/Deloitte_Diversity_Inclusion_
Report_V4_Nov_2012.pdf).
24 McKinsey & Company. “Women Matter 2013”.
25 Jeremy Galbreath, Are there Gender-Related Influences on Corporate
Sustainability? A study of women on Boards, Journal of Management
& Organization, Vol 17, No 1 (2011). (http://espace.library.curtin.edu.
au/R/?func=dbin-jump-full&object_id=158930&local_base=GEN01ERA02).
26 Credit Suisse Research Institute. “Gender diversity and corporate
performance”, 2012.
27 Daly, “Gender Inequality, Growth and Global Ageing”.
28 Women, Business and the Law 2014.
29 World Economic Forum. Global Gender Gap Report, Appendix E,
2006–2013.
30 Women, Business and the Law 2014.
31 Women, Business and the Law 2014.
32 Homecare assistance is when one parent stays home and the other
goes to work.
33 A form of family taxation where income can be transferred to family
members with more favourable tax brackets (with limits defined by
attribution rules).
34 “Six economies have established quotas for women on boards of
publicly listed companies. These quotas vary. Rwanda’s constitution
sets a minimum of 30% for women and men on boards of publicly
listed companies. In 2010 Iceland set a 40% quota for women’s
representation on corporate boards, and in 2011 Belgium and
Italy established 33% quotas. France’s law 2011-103, enacted in
January 2011, established a 20% quota, to be progressively raised
to 40%. Norway, which led the way on this issue in 2002, introduced
voluntary quotas in 2005 with the goal of reaching 40%. In 2005,
the average had only increased to 25%, so parliament amended
the Public Companies Act—making quotas mandatory with a new
deadline of 2008. The quotas were to be enforced by fines, then
deregistration from the Oslo Stock Exchange and, finally dissolution.
By 2008 more than 80% of listed firms had complied.” Women,
Business and the Law 2014..
35 The complete “Repository of Successful Practices for Gender Parity”
is available at: http://www.weforum.org/gender-parity/closing-gendergap.
36 World Economic Forum. “Toolkit for Corporate Practices for closing
gender gaps”, 2013.
37 World Economic Forum. “Closing the Gender Gap in Japan”, 2014.
38 World Economic Forum. “Closing the Gender Gap in Japan”, 2014.
REFERENCES
Bartlett, L A, Mawji, S, Whitehead, S, Crouse, C, Dalil, S, Ionete, D,
Salama, P and the Afghan Mortality Study Team. Where Giving
Birth is a Forecast of Death: Maternal Mortality in Four Districts of
Afghanistan, 1999–2002. In The Lancet, 2005, 365 (9462): 864–870.
Beaman, L, Chattopadhyay, R, Duflo, E, Pande, R, and Topaloya, P.
Powerful Women: Does Exposure Reduce Bias?. http://econ-www.
mit.edu/files/3122.
Bloom, David E., Canning, David and Sevilla, Jaypee. The Effect of Health
on Economic Growth: A Production Function Approach. World
Development Vol. 32, No. 1, pp. 1–13, 2004.
Catalyst. The Bottom Line: Connecting Corporate Performance and
Gender Diversity. 2004. http://www.catalyst.org/publication/82/
the-bottom-line-connecting-corporate-performance-and-genderdiversity.
Centre for Work Life Policy. http://www.worklifepolicy.org/.
Part 1: Measuring the Global Gender Gap
Chaaban Jad and Cunningham, Wendy. Measuring the Economic Gain
of Investing in Girls: The Girl Effect Dividend, World Bank Policy
Research Working Paper, World Bank, August 2011.
CIA (Central Intelligence Agency). The CIA World Factbook, 2011.
Coale, A J. Excess Female Mortality and the Balance of the Sexes in
the Population: An Estimate of the Number of Missing Females. In
Population and Development Review, 1991, 17 (3): 517–523.
Credit Suisse Research Institute. Gender diversity and corporate
performance. 2012.
Galbreath, Jeremy. Are there Gender-Related Influences on Corporate
Sustainability? A study of women on Boards. Journal of Management
& Organization, Vol 17, No 1 (2011). http://espace.library.curtin.edu.
au/R/?func=dbin-jump-full&object_id=158930&local_base=GEN01ERA02.
Jütting, J P, Morrisson, C Dayton-Johnson, J and Drechsler, D.
Measuring Gender (In)equality: Introducing the Gender, Institutions
and Development Data Base (GID). Working Paper No. 247.
OECD Development Centre, March, 2006. http://www.oecd.org/
dataoecd/17/49/36228820.pdf.
Daly, K. Gender Inequality, Growth and Global Ageing. Goldman Sachs
Global Economics Paper No. 154, April 2007.
Kilpatrick, S J, Crabtree, K E, Kemp, A and Geller, S. Preventability of
Maternal Deaths: Comparison between Zambian and American
Referral Hospitals. In Obstetrics & Gynecology, 2002, 100: 321–326.
Deloitte. Waiter, is that inclusion in my soup? A new recipe to improve
business performance. 2012. http://www.deloitte.com/assets/DcomAustralia/Local%20Assets/Documents/Services/Consulting/Deloitte_
Diversity_Inclusion_Report_V4_Nov_2012.pdf.
Klasen, S and Wink, C. Missing Women: Revisiting the Debate. In Feminist
Economics, 2003, 9 (2–3): 263–299.
LABORSTA Internet, online database, 2011.
Dervarics, C. Closing the Gap in Male-Female Schooling. Population
Reference Bureau, 2004. http://www.prb.org/Articles/2004/
ClosingtheGapinMaleFemaleSchooling.aspx (accessed October
2009).
Leader-Chivee, Lauren. New Study: Diversity Drives Serial Innovation. 2013
Duflo, E. Gender Equality in Development. BREAD Policy Paper No. 001,
December 2005. http://econ-www.mit.edu/files/799.
Mathers, C D, Iburg, K M Salomon, J A Tandon, A Chatterji, S Ustün, B
and Murray, C J L. Global Patterns of Healthy Life Expectancy in the
Year 2002. In BioMed Central Public Health, 2004, 4: 66. http://www.
biomedcentral.com/1471-2458/4/66.
Engendering Development through Gender Equality in Rights, Resources
and Voice. World Bank Policy Research Report No. 21776. 2001.
Washington, DC: World Bank.
ESCAP (Economic and Social Commission for Asia and the Pacific).
Economic and Social Survey of Asia and the Pacific 2007: Surging
Ahead in Uncertain Times. New York: United Nations, 2007.
Falkingham, J. The Impact of Maternal Health on Poverty. In id21 Health,
id21 Research Highlight, 2 August 2007. http://www.id21.org/zinter/
id21zinter.exe?a=0&i=InsightsHealth11art3&u=4ae36338.
Lopez-Claros, A and Zahidi, S. Women’s Empowerment: Measuring the
Global Gender Gap. Geneva: World Economic Forum, 2005.
Matthews, Z. Improving the Health of Mothers and Babies. In id21 insights,
health # 11, University of Sussex. http://www.id21.org/insights/
insights-h11/art00.html/.
McKinsey & Company. Unlocking the full potential of women in the U.S.
economy 2011.
———. Women Matter 2013.
Gertler, P, Martinez, S, Levine, D and Bretozzi, S. Lost Presence and
Presents: How Parental Death Affects Children. Princeton University,
2004.
Munshi, K and Rosensweig, R. The Efficacy of Parochial Politics: Caste,
Commitment, and Competence in Indian Local Governments. Center
Discussion Paper No. 964. Economic Growth Center, Yale University,
September 2008. http://www.econ.yale.edu/growth_pdf/cdp964.pdf.
Ghani, Ejaz, Mani, Anandi and O’Connell, Stephen D. Can Political
Empowerment Help Economic Empowerment?, Women Leaders and
Female Labor Force Participation in India. The World Bank Policy
Research Working Paper 6675, Oct 2013.
Nardo, M, Saisana, M, Saltelli, A, Tarantola, and Hoffmann, A and
Giovannini, E. Handbook on Constructing Composite Indicators:
Methodology and User Guide, OECD Statistics Working Papers,
2005/3, OECD Publishing. doi:10.1787/533411815016.
Goldman Sachs Global Markets Institute. The Power of the Purse: Gender
Equality and Middle-Class Spending. 5 August 2009.
Nike Foundation. The Girl Effect: Not Just about Girls: Engaging Men and
Boys Is Key to Girls’ Ability to Achieve their Full Potential, 2009.
http://www.nikefoundation.com/media_room.html (accessed October
2009).
Flabbi, Luca, Macis, Mario, Moro, Andrea, and Schivardi, Fabiano. Do
Female Executives Make a Difference? The Impact of Female
Leadership on Gender Gaps and Firm Performance, September 12,
2014. http://www.rotman.utoronto.ca/-/media/Files/Programs-andAreas/Strategy/papers/FMMS-femaleceos.pdf.
Greig, F, Hausmann, R, Tyson, L D and Zahidi, S. The Gender Gap Index
2006: A New Framework for Measuring Equality. In The Global
Gender Gap Report 2006. Geneva: World Economic Forum, 2006.
Hausmann, R and Székely, M. Inequality and the Family in Latin America.
In Population Matters: Demographic Change, Economic Growth, and
Poverty in the Developing World, edited by N. Birdsall, A C Kelley,
and S Sinding. New York: Oxford University Press, 2001.
Human Development Report 2006. Oxford: Oxford University Press, 2006.
Ibarra, H and Zahidi, S. The Corporate Gender Gap Report 2010. Geneva:
World Economic Forum, 2010.
ILO (International Labour Organization), International programme on the
elimination of child labour, World Day 2009. Give Girls a Chance: End
Child Labour, 2009, http://www.ilo.org/ipec/Campaignandadvocacy/
WDACL/WorldDay2009/lang--en/index.htm (accessed October
2009).
ILO (International Labour Organization) and Asia Development Bank,
Women and labour markets in Asia–Rebalancing for Gender Equality.
2011.
Inter-Parliamentary Union. National Women in Parliaments, July 2011.
OECD (Organisation for Economic Co-operation and Development).
Women, Government and Policy Making in OECD Countries Fostering Diversity for Inclusive Growth, 2014.
Parrotta, Pierpaolo, Pozzoli, Dario and Pytlikova, Mariola. The Nexus
between Labor Diversity and Firm’s Innovation. NORFACE
MIGRATION Discussion Paper No. 2011-5. http://www.norfacemigration.org/publ_uploads/NDP_05_11.pdf.
PLAN. Girls in the Global Economy: Adding It All Up, 2009.
Sen, A. Development as Freedom. Oxford: Oxford University Press, 1999.
Sen, A. Missing Women. In British Medical Journal, 1992, 7 March, 304
(6827): 587–588.
Sen, G, George, A, and Ostlin, P (eds). Engendering International Health:
The Challenge of Equity. Boston: MIT Press, 2002.
Summers, L. The Most Influential Investment. In Scientific American, 1992,
August: 132.
Switlick, N, Geeta, K and Lule E. Acceleration Progress Towards Achieving
the MDG to Improve Maternal Health: A Collection of Promising
Approaches. April, 2005. Washington, DC: World Bank.
Technical Note: Computing the Indices. In Human Development Report
2000. Oxford: Oxford University Press, 2000. http://hdr.undp.org/
reports/global/2000/en/.
The Global Gender Gap Report 2015 | 47
Part 1: Measuring the Global Gender Gap
UNAIDS (Joint United Nations Programme on HIV/AIDS) and WHO (World
Health Organization). AIDS Epidemic Update 2005. Joint Annual
Report. December, 2005. Geneva: Joint United Nations Programme
on HIV/AIDS (UNAIDS) and WHO. http://www.unaids.org/epi/2005/
doc/report_pdf.asp.
UNDP (United Nations Development Programme). Human Development
Report 2010.
UNESCO (United Nations Educational, Scientific and Cultural Organization).
Gender and Education for All: The Leap to Equality. Summary Report,
2003. Paris: UNESCO.
UNFPA (United Nations Population Fund). Safe Motherhood: Facts about
Safe Motherhood, 2008. http://www.unfpa.org/mothers/facts.htm
(accessed October 2009).
———. State of World Population 2004: Maternal Health. http://www.unfpa.
org/swp/2004/english/ch7/page2.htm.
UNICEF (United Nations Children’s Fund). The State of the World’s Children
2004. http://www.unicef.org/sowc04/sowc04_girls_left_out.html
(accessed October 2009).
———. The State of the World’s Children 2009: Maternal and Newborn
Health. New York: UNICEF, December 2008. http://www.unicef.org/
sowc09/docs/SOWC09-FullReport-EN.pdf.
United Nations Foundation. Why Invest in Adolescent Girls. http://www.
unfoundation.org/global-issues/women-and-population/investingadolescent-girls.html.
United Nations Secretariat, Population Division of the Department of
Economic and Social Affairs. World Population Prospects: The 2008
Revision. http://esa.un.org/unpp/ (accessed October 2009).
Varkey, S, Gupta, S S. How Gender (In)Sensitive Are the Gender-Related
Indices? In Bulletin of the World Health Organization, 2005, 83 (12):
954–956.
Wessel, H, Reitmaier, P, Dupret, A, Rocha, E, Cnattingius, S, Bergströmm,
S. Deaths among Women of Reproductive Age in Cape Verde:
Causes and Avoidability. In Acta Obstetricia et Gynecologica
Scandinavica, 1999, 78 (3): 225–232; 2009: 2.
Wilhelmson, Karl and Gerdtham, Ulf-G. Impact on Economic Growth of
investing in maternal and newborn health. World Health Organization,
2006.
World Bank. Gender and Development in the Middle East and North Africa.
2004.
———. Girl’s Education. http://web.worldbank.org/WBSITE/EXTERNAL/
TOPICS/EXTEDUCATION/0,,contentMDK:20298916~menuPK:617572
~pagePK:148956~piPK:216618~theSitePK:282386,00.html (accessed
October 2009).
———. Women, Business and the Law 2014. 2014.
———. World Data Bank: World Development Indicators & Global
Development Finance online database 2008 (accessed July 2010).
World Economic Forum. Closing the Gender Gap in Japan, 2014.
———. Global Gender Gap Report 2013. 2013. Geneva: World Economic
Forum.
———. The Global Competitiveness Report 2010–2011. 2010. Geneva:
World Economic Forum.
———. Online Repository of Successful Practices for Gender Parity, 2014.
http://www.weforum.org/gender-parity/closing-gender-gap (accessed
in October 2014).
———. Toolkit for Corporate Practices for Closing Gender Gaps, 2013.
Geneva: World Economic Forum.
WHO (World Health Organization). World Health Report: Working Together
for Health. April 2006, Geneva: WHO; p.xxiv in Merlin: All Mothers
Matter. http://www.merlin.org.uk/images/libimages/1755.pdf
(accessed October 2009).
———. Global Health Observatory database. Data from 2007.
———. The World Health Report 2007. 2007. Geneva: WHO (World Health
Organization).
48 | The Global Gender Gap Report 2015
———. The World Health Report 2001, Statistical Annex: Explanatory Notes.
2001. Geneva: WHO (World Health Organization).
Download