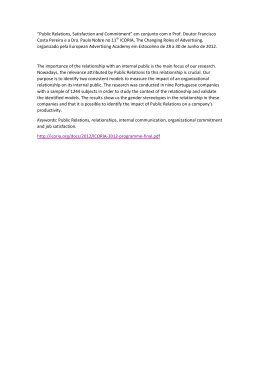
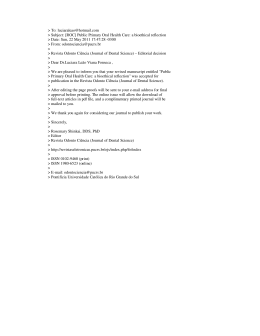
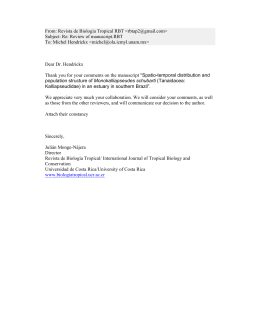
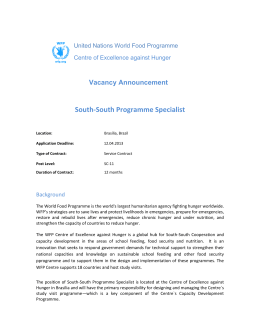
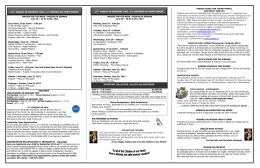
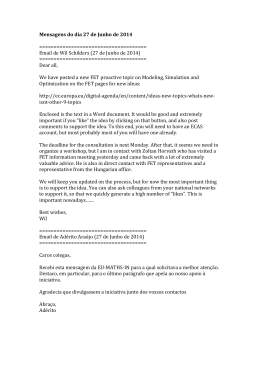
101 Biotemas, 23 (2): 101-110, junho de 2010 ISSN 0103 – 1643 Aspects of the feeding and population structure of Leporinus piau Fowler, 1941 (Actinopterygii, Characiformes, Anostomidae) of Taperoá II Dam, semi arid region of Paraíba, Brazil Ana Karla Araujo Montenegro1* Jane Enisa Ribeiro Torelli1 Randolpho Sávio de Araújo Marinho1 Maria Cristina Crispim1 Malva Isabel Medina Hernandez2 Universidade Federal da Paraíba/CCEN/ DSE/ PPG em Ciências Biológicas Campus I, CEP 58059-970, João Pessoa – PB, Brazil 2 Universidade Federal de Santa Catarina/CCB/ECZ, Florianópolis – SC, Brazil *[email protected] 1 Submetido em 14/08/2009 Aceito para publicação em 23/02/2010 Resumo Aspectos da estrutura populacional e alimentar de Leporinus piau Fowler, 1941 (Actinopterygii, Characiformes, Anostomidae) do Açude Taperoá II, na região do semi-árido da Paraíba, Brasil. Objetivouse determinar a estrutura populacional, estabelecer a relação peso-comprimento, a proporção sexual, a relação entre a atividade alimentar e o período reprodutivo, e identificar a dieta e o regime alimentar de Leporinus piau. Foram realizadas seis coletas, nos meses de outubro e dezembro de 2005; março, junho, agosto e outubro de 2006, utilizando-se tarrafas, redes de espera e arrasto. Alguns exemplares foram enviados à Coleção Ictiológica da UFPB. Foram coletados 89 indivíduos de comprimentos que variaram de 6,2cm a 22,0cm. O crescimento foi do tipo alométrico negativo. Houve um predomínio significativo de machos. A dieta alimentar de L. piau se mostrou variada, sugerindo onivoria e oportunismo. Unitermos: alimentação, Anostomidae, dinâmica populacional, ictiofauna, semi-árido Abstract The aim of this research was to determine the population structure, weight-length relationship and sexual ratio of Leporinus piau. It also attempted to evaluate the relationship between the alimentary activity and the reproductive period, and to identify the diet and alimentary regimen. Six collections were made in the months of October and December of 2005 and March, June, August and October of 2006, using casting, seining and gill nets. Some specimens were sent to the UFPB Ichthyological Collection. The 89 collected individuals presented lengths varying from 6.2cm to 22cm. The growth of the species was of the negative allometric type. There was a significant predominance of males. The alimentary diet of L. piau was apparently variable, suggesting omnivorousness. Key words: Food, Anostomidae, populatios dynamics, ichthyofauna, semi arid Revista Biotemas, 23 (2), junho de 2010 102 A. K. A. Montenegro et al. Introduction Specific knowledge of biology and population dynamics is needed for the preservation of natural fish stocks, aimed at their permanent exploitation. Besides providing information about these aspects, it is also important to obtain information about possible environmental alterations. Among the northeastern micro-regions, semi-arid areas suffer a great deficiency in their water resources due to low precipitation and high evaporation indices, increasing the water environments’ eutrophication process. The environments change from completely dry to overflowing in the majority of water systems, sometimes in a short period. In Paraiban semi-arid zones, the hydrological cycle has a great influence on the population structure of fish assembly, but only a few studies have been developed in this region, such as those of Montenegro et al. (2006) and Chaves et al. (2009). The aim of this work was to determine the population structure of Leporinus piau in Taperoá II Dam, Paraiban semi-arid region, based on length classes, establishing the weight/length relationship and sexual proportion. It also attempted to evaluate the feeding activity and reproduction period relationships, elucidating the feeding habits and feeding regime. Material and Methods Taperoá II Dam is part of the Taperoá River Basin and is located in Taperoá, in the center part of Paraíba State (Figure 1), between the coordinates 07°11’44”S and 07°13’44”S and 36°52’03”W and 36°50’09”W. It presents a capacity of 15,148,900m3 of water. FIGURE 1: Taperoá II Dam localization, Taperoá, Paraíba, Brazil. Revista Biotemas, 23 (2), junho de 2010 103 Feeding and population structure of Leporinus piau This region presents two well-defined seasons, the rainy season of 3 or 4 months, and the dry one throughout, the rest of the year. Following Köppen (1900), the region’s climate is semi-arid, hot and dry, with the rainy season in summer/autumn. It is the region with the lowest precipitation indices in Brazil, with about 300mm/year (Pimenta Filho et al., 2004). Six samplings were performed over 24h in the months of October and December (2005 – dry season), March and June (2006 – rainy season), and August and October (2006 – dry season). Figure 2 shows pluviometric indexes and dam volume for those months. Fish specimens were collected with the following fishing gear: cast nets and seining nets (15mm net between adjacent knots, nylon bags with 0.2mm of net open) and gillnets (meshes of 15, 20, 25, 35 and 40mm between adjacent knots). These gears were used to include fishes of all sizes and environments, since there are different species in the dam, occupying different niches. Organisms were fixed in a 10% formalin solution in the field and later taken to the Laboratory of Aquatic Ecology/DSE/UFPB, where the taxonomic identification was confirmed based on Britiski et al. (1984), as well as specialists in this area. Some representatives of species, were kept in the icthyological collection of UFPB (nº 6185). Population structure The population structure was expressed in terms of size of individuals by placing species into length classes (cm). The population of the fish assembly was established through the distribution of the length classes, in order to verify the relative frequency of juveniles and adults along the seasons, randomly. The identification of the maturation stages of the collected individuals was determined following Vazzoler (1996). One-way ANOVA was applied to test differences among the mean lengths of the various species among the seasons. The weight/length relationship was established based on the standard length (cm) and total weight (g). Individuals were sampled independently of sex. The mathematical expression Pt = a CPb (Santos, 1978) was used and the curve adjustment was performed using Excel 2003 software. Following Benedito-Cecílio and Agostinho (1997), the angular coefficient (b) for each species is generally constant and tends to be near 3.0, when there is similar increment in weight in the different fish body parts, expressing the type of growth called isometric. When (b) shows values higher than 3.0 it is FIGURE 2: Pluviometric indexes (bars) of Taperoá region and volume (line) of the Taperoá II Dam, registered during the studied period (Source: AESA, 2007). Revista Biotemas, 23 (2), junho de 2010 104 A. K. A. Montenegro et al. considered to represent a positive allometric growth, and when lower, negative allometric growth. Allometric growth is said to occur when the weight increment of the different body parts is dissimilar. The sex identification and gonadal stages of the collected individuals were determined following Vazzoler (1996), and subsequently the sexual proportion was established. This kind of analysis was developed in 38% of the individuals caught. To verify wheter there were significant differences among the sexual proportions in populations, Qui-Square (χ2) was applied along the seasons using the Statistica software, version 6.0 (Statsoft, 1998). experts. To determine the food items, the method of occurrence frequency, calculated by dividing the number of times each food item occured by the total number of analyzed stomachs (Zavala-Camim, 1996), was used, together with the points method (Hynes, 1950; Fugi et al., 1996; Resende et al., 2000; Peret, 2004). In this latter method, the score for each food item was multiplied by the respective stomach weight (Hynes, 1950). To evidence the most important feeding items in the food diet of the fishes, the Importance Alimentary Index (AIi) was used following Kawakami and Vazzoler (1980). Results Feeding structure In order to gain knowledge of the trophic structure (feeding habits and food regime) the stomachs of the same individuals used for sexual population structure analysis were employed (28 individuals), and these were immediately fixed in a 10% formalin solution injected into the stomachs. The stomach contents were removed in the laboratory and preserved in 75o GL ethanol, until its macroscopic and microscopic analyses could be developed. Food items were identified down to the lowest possible taxonomic level, based on specialized references (such as Edmonson, 1959; Germain, 1981; Menezes and Dias, 2001) along with consulting Population structure Leporinus piau individuals presented length values between 6.15 and 22cm (lowest and highest values, respectively), mode 15. Small individuals, juveniles between 6.2 and 12cm, predominated in the dry period (2005 and 2006), suggesting a recent recruitment (Figure 3). ANOVA analysis comparing the mean length values in the three studied seasons revealed that individuals of this species presented a higher mean length during the rainy period [F(2; 86) = 4.53; p = 0.013]. The Tukey test FIGURE 3: Number of individuals of Leporinus piau by length classes (cm) in the study period. Revista Biotemas, 23 (2), junho de 2010 300 2.734 105 Feeding and population structure of Leporinus piau showed that the individuals caught in the dry period of 2005 (mean length 12.6cm) and 2006 (12.8cm) were significantly shorter than individuals collected in the 2006 rainy period (mean length 17.7cm) (p < 0.03). Individuals of L. piau weighed from 9 to 271.1g, the lowest and highest total weight values, respectively, with a negative allometric growth, b = 2.73 (Figure 4), meaning that fish development does not present a proportional growth amongst all body parts. A significant dominance of L. piau males was observed along the study period [X2 = 9.93; g.l. = 1; p 300 In relation to the pattern growth of the individuals, the highest value was 22cm for females and 19cm for males. Nevertheless, significant differences between mean length (14.5cm for females and 12.9cm for males) were not observed (t = 1.67; g.l. = 56; p = 0.09). y = 0.054x2.734 R² = 0.952 250 Weight (g) < 0.01], in a proportion of 2.4:1.0 (Figure 5). In the dry periods of 2005 and 2006, a greater number of females were observed, the opposite of the rainy period (Table 1). The Qui Square test could not be applied because the data did not fulfill the test requirements. 200 150 100 50 0 0 5 10 15 20 25 Length (cm) FIGURE 4: Length/weight relationship of Leporinus piau in Taperoá II Dam, Taperoá – PB, along the study period. FIGURE 5: Sexual proportion of Leporinus piau in Taperoá II Dam, Taperoá – PB, along the study period. Revista Biotemas, 23 (2), junho de 2010 106 A. K. A. Montenegro et al. TABLE 1: Sexual proportion in Leporinus piau in Taperoá II Dam, Taperoá – PB, along the study period. Sex F M Total Dry/2005 Rainy/2006 Dry/2006 Total 3 3 11 17 50.0% 100.0% 22.5% 3 0 38 50.0% 0.0% 77.6% 6 3 49 41 58 Feeding structure During the entire study period, L. piau presented a high feeding activity, showing a decrease in March, coincidently with the reproductive period, although significant Speraman’s correlations were not presented [rs = -0.50; p = 0.39] (Figure 6). The length of the L. piau specimens used in stomach contents analysis (28 individuals) varied from 7.6cm to 22.0cm, mean 13.9. The diet food of L. piau counted a total of 59 items, 74.6% registered in the 2005 dry period, 22.0% in the 2006 rainy season and 66.1% in the 2006 dry season (Table 2). We could clearly observe a more expanded food diet in the dry periods (2005-2006) probably associated with the increase in the trophic state, which is observed in this period, allowing the presence of a greater variety and quantity of food items. In the 2005 dry period, the main food items in the L. piau diet were: vegetable remains (14.6%), Clorella vulgaris (11.1%), Cyclotella meneghiniana (11.2%), organic matter (8.2%) and eggs (8.2%). In the 2006 rainy period, the main food items were: vegetable remains (8.9%), eggs (8.1%), debris (5.4%) and seeds (5.3%). In the 2006 dry season, the main foods items were organic matter (20.4%), Melosira granulata (10.4%), insect remains (15.4%), Chironomidae larvae (12.6%) and Conchostraca (7.7%). The non- overlap of the main items in the different seasons reveals the fact that this species is highly versatile and uses whatever is most abundant in the environment. FIGURE 6: Feeding activity X reproductive activity of Leporinus piau in Taperoá Dam, Taperoá – PB, along the study period. Revista Biotemas, 23 (2), junho de 2010 107 Feeding and population structure of Leporinus piau TABLE 2: Frequency of occurrence (Fo), points frequency (Fp) and index of food importance (AIi – Alimentary Importance Index) of food items of Leporinus piau registered in Taperoá II Dam, Taperoá – PB, along the study period. Season Number of the stomachs Items Debris Fish scales Organic matter Eggs Vegetable remains Seeds PHYTOPLANKTON Bacylariophyceae Cyclotella meneghiniana Cymbella sp. Denticula sp. Ephitemia sp. Gomphonema sp. Gyrosigma sp. Mastogloia smithii Melosira granulata Melosira italica Navicula sp1. Navicula sp2. Nitzschia sp. Pinnularia sp. Surirella sp. Synedra sp2. Chlorophyceae Filamentous algaes Ankistrodemus convolutus Ankistrodesmus falcatus Chlorela vulgaris Chrocooccus sp. Coelastrum sp. Kirchneriella contorta Spyrogira sp. Cianophyceae Anabaena sp. Lyngbia sp. Mycrocistis aeruginosa Oscillatoria sp1. Oscillatoria sp2. Euglenophyceae Euglena sp. Fo 42.9 28.6 85.7 85.7 114.3 28.6 100.0 14.3 Fp 0.30 0.20 0.60 0.60 0.81 0.20 0.71 0.10 Dry/05 7 IAi 2.05 0.91 8.22 8.22 14.61 0.91 11.19 0.23 Fo 50 50 100 100 100 100 50 50 Rainy/06 2 Fp Iai 8.36 5.41 1.31 6.23 6.89 4.10 3.44 2.79 2.79 0.85 8.07 8.92 5.31 4.46 1.80 Fo 10.53 5.26 73.68 36.84 42.11 31.58 Fp 0.97 0.15 11.43 3.21 3.25 2.91 Dry/06 19 Iai 0.25 0.02 20.39 2.86 3.31 2.23 26.32 1.66 1.06 10.53 1.33 0.34 10.53 5.26 10.53 89.47 5.26 21.05 0.71 0.70 1.33 4.98 0.60 1.64 0.18 0.09 0.34 10.79 0.08 0.84 10.53 1.48 0.38 10.53 0.86 0.22 1.80 14.3 0.10 0.23 42.9 0.30 2.05 100 3.44 4.46 28.6 28.6 14.3 28.6 14.3 42.9 42.9 28.6 28.6 100.0 14.3 14.3 42.9 28.6 0.20 0.20 0.10 0.20 0.10 0.30 0.30 0.20 0.20 0.71 0.10 0.10 0.30 0.20 0.91 0.91 0.23 0.91 0.23 2.05 2.05 0.91 0.91 11.19 0.23 0.23 2.05 0.91 50 0.66 0.42 28.6 28.6 57.1 28.6 14.3 0.20 0.20 0.40 0.20 0.10 0.91 0.91 3.65 0.91 0.23 50 1.31 0.42 31.58 2.11 1.61 100 3.44 4.46 31.58 57.89 1.21 4.24 0.93 5.94 5.26 0.08 0.01 5.26 0.60 0.08 Revista Biotemas, 23 (2), junho de 2010 108 Phacus sp. Trachelomonas sp. ZOOPLANKTON Rotifera Conochilus sp. Brachionus sp. Keratella americana Keratella tropica Cladocera ZOOBENTHOS Arachnidae Chaoboriidae Diptera Ceratopogonidae Ephemeroptera Gastropoda Hydracarina Hymenoptera Chironomidae grub Melanoides tuberculata Nematoda Ironomidae Oligochaeta Odonata Insect remains Ostracoda Conchostraca Total items A. K. A. Montenegro et al. 14.3 71.4 28.6 14.3 0.10 0.50 0.20 0.10 0.23 5.71 0.91 0.23 28.6 0.20 0.91 14.3 0.10 0.23 28.6 0.20 0.91 42.9 14.3 14.3 14.3 0.30 0.10 0.10 0.10 2.05 0.23 0.23 0.23 28.6 57.1 57.1 28.6 0.20 0.40 0.40 0.20 0.92 3.65 3.65 0.91 44 Discussion In the 2005 dry period (Oct-Dec), the distribution of length classes was mainly represented by intermediate individuals, which means a juvenile population, while in the 2006 rainy period, especially in March, only four individuals were collected and all with greater body length (adults). In June, L. piau was not registered, which could be related to the reproductive migratory movements of this species. In the present study, the peak in the reproductive period was recorded in March 2006, coinciding with the record of individuals, and this matches with the higher pluviometric precipitation, suggesting that these events may be related. As Tavares and Godinho (1994) observed in a study in the Três Marias reservoir – São Francisco River basin, mature specimens of L. piau appeared Revista Biotemas, 23 (2), junho de 2010 50 0.66 0.42 13 15.79 1.55 0.59 5.26 5.26 10.53 0.51 0.05 0.77 0.06 0.01 0.20 10.53 10.53 15.79 10.53 5.26 5.26 57.89 15.79 21.05 5.26 5.26 31.58 63.16 0.75 0.32 6.58 0.79 0.7 1.4 9.01 2.25 1.32 1.20 0.32 8.47 10.09 0.19 0.08 2.52 0.20 0.09 0.18 12.63 0.86 0.67 0.15 0.04 6.48 15.43 42.11 7.53 7.68 39 between Dezember and February (rainy period). In the 2006 dry period (Aug-Oct) a greater variation in individual body length was observed, as well as the presence of smaller fishes, meaning a recent recruitment. According to Benedito-Cecílio and Agostinho (1997), inferences about recruitment can be obtained by the space-temporal frequency of juveniles. The relationship food versus reproductive activity showed that during the peak in the reproduction (March/2006) there was a decrease in feeding activity, indicating that in periods in which reproductive activity is not so intense, the species invests in food and consequently the acquisition of reserves to ensure reproduction, since the species is rheophilic (Luz, et al., 2009). A similar result was reported by Pereira et al. (2007), studying the species Leporinus copelandii 109 Feeding and population structure of Leporinus piau (Steindachner, 1875) in the basin of the lower Paraiba do Sul River, where the greater food intake occurred outside the period of reproduction. This species uses food items from substrate, showing a feeding preference. Nevertheless it used several food items, specially considering the temporal analyses, suggesting omnivorousness and opportunism, that are important strategies for survival through the semi-arid dynamics. Corroborant to these results, Lizama and Takemoto (2000), in a study about the influence of the feeding habit on the growing patterns in fish, state that L. piau is omnivorous. However, in a study conducted by Gurgel and Canan (1999), in the Jiqui Lagoon in Rio Grande do Norte State, L. piau presented a diet composed mainly by insects, followed by other unidentified items. Teixeira and Gurgel (2005), studying the ichthiofauna of the Riacho da Cruz Dam – RN, registered the species feeding on vegetables, algae, seeds and insect remains. Our results also agree with those from the study of Melo and Röpke (2004), with other species of the same genus in the Bananal floodplain whose food habits were generalistic, and the food type was dependent on the availability in the environment. The diet was similar to the diet of L. piau in this work. Balassa et al. (2004), studying four species of the Leporinus genus, verified that all of them presented a wide feeding spectrum, and that the diet was composed of vegetables, detritus, insects of different orders, aquatic invertebrates and fishes. Nevertheless, Alvim and Peret (2004) classified L. piau as a herbivorous species, together with Astyanax bimaculatus and A. fasciatus. According to Gomes and Verani (2003), in a study carried out in Três Marias Reservoir, L. piau was basically herbivorous, but with a great tendency towards omnivorousness, being the filamentous algae (associated with substrates, which can corroborate the benthivorous habit of this species) being the main items in the diet food. Mérona and Rankin-de-Mérona (2004), analyzing food resources of a fish assembly in a floodplain lake in central Amazonia, observed that Leporinus friderici and L. piau presented a diet composed by fruits, flowers and other vegetable materials. The first species was different because it showed a wider diet including insects, terrestrial invertebrates, aquatic invertebrates, shrimps, eggs and fish. Hypothetically, the major food items that vary with seasonality observed in habitats such as semi-arid zones and floodplains is the result of feeding adaptation to the changes in the environment that alter the degree of trophicity and availability of food throughout the hydrological cycle. Acknowledgments The authors are grateful to CNPq (National Council for Scientific and Technological Development) for their Support of Long Term Ecological Research (PELD/ Caatinga). Ana Karla Araujo Montenegro would like to thank CAPES (Federal Agency for Support and Evaluation of Postgraduate Education) for her master’s degree grant and CNPq for her doctoral grant. References AESA. 2007. Agência Executiva de Gestão das Águas do Estado da Paraíba. Available at <http://www2.aesa.pb.gov.br/meteoro/ chuvas.shtml>. Accessed on October 26, 2009. Alvim, M. C. C.; Peret, A. C. 2004. Food resources sustaining the fish fauna in a section of the upper São Francisco River in Três Marias, MG, Brazil. Brazilian Journal of Biology, 64 (2): 195202. Balassa, G. C.; Fugi, R.; Hahn, N. S; Galina, A. B. 2004. Dieta de espécies Anostomidae (Teleostei, Characiformes) na área de influência do reservatório de Manso, Mato Grosso, Brasil. Iheringia, Série Zoologia, 94 (1): 77-82. Benedito-Cecílio, E.; Agostinho, A. A. 1997. Estrutura das populações de peixes do reservatório de Segredo. In: Agostinho, A. A. & Gomes, L. C. (Eds.) Reservatório de Segredo: Bases ecológicas para o manejo. EDUEM, Maringá, Brazil, 387pp. Britiski, H. A.; Sato, Y.; Rosa, A. B. S. 1984. Manual de identificação de peixes da região de Três Marias: Com chaves de identificação para os peixes da Bacia do São Francisco. CODEVASF, Divisão de Piscicultura e Pesca, Brasília, Brazil, 143pp. Chaves, M. F.; Torelli, J.; Targino, C. H.; Crispim, M. C. 2009. Dinâmica reprodutiva e estrutura populacional de Hoplias aff. malabaricus (Bloch, 1794) (Characiformes, Erythrinidae) em açude da bacia do rio Taperoá, Paraíba. Biotemas, 22 (2): 85-89. Edmonson, W. T. 1959. Freshwater Biology. 2nd ed. John Wiley & Sons, INC., New York, London, USA and UK, 1248pp. Fugi, R.; Hahn, N. S.; Agostinho, A. A. 1996. Feeding styles of five species of bottom-feeding fishes of the high Paraná River. Environmental Biology of Fishes, 46: 297-307. Revista Biotemas, 23 (2), junho de 2010 110 A. K. A. Montenegro et al. Germain, H. 1981. Flore dês diatomées dês eaux douces et saumâtres. Société Nouvelle dês éditions Boubée, Paris, France, 444pp. Gomes, J. H. C.; J. R. Verani. 2003. Alimentação de espécies de peixes do reservatório de Três Marias, In: H. P. Godinho & Godinho, A. L. (Eds). Águas, peixes e pescadores do São Francisco das Minas Gerais. PUC Minas, Belo Horizonte, Brazil, p.195-227. Gurgel, H. C. B.; Canan, B. 1999. Feeding of six fish species in Jiqui Lagoon, eastern coast of Rio Grande do Norte, Brazil. Acta Scientiarum, 21(2):243-246. Hynes, H. B. N. 1950. The food of fresh-water sticklebacks (Gasterostreus aculeatus and Pygosteus pungitius), with a review of methods used in studies of the food of fishes. Journal Animal Ecology, 19 (1): 36-58. Kawakami, E.; Vazzoler, R. 1980. Método gráfico e estimativa de índice alimentar aplicado no estudo de alimentação de peixes. Boletim do Instituto Oceanográfico, 29: 205-207. Köppen, W. 1900. Classificação do clima de Köppen. Available at <http://tiosam.com/?q=Classifica%C3%A7%C3%A3o_do_clima_ de_K%C3%B6ppen>. Accessed on October 24, 2009. Lizama, M. A. P.; Takemoto, R. M. 2000. Relação entre o padrão de crescimento em peixes e as diferentes categorias tróficas: Uma hipótese a ser testada. Acta Scientiarum, 22 (2): 455-463. Luz, S. C. S.; El-Deir, A. S. A.; França, E. J.; Severi, W. 2009. Estrutura da assembléia de peixes de uma lagoa marginal desconectada do rio, no submédio Rio São Francisco, Pernambuco. Biota Neotropica, 9 (3): 1-12. Melo, C. E.; Röpke, C. P. 2004. Alimentação e distribuição de piaus (Pisces, Anostomidae) na planície do Bananal, Mato Grosso, Brasil. Revista Brasileira de Zoologia, 21 (1): 51-56. Menezes, M.; Dias, I. C. A. 2001. Biodiversidade de algas de ambientes continentais do estado Rio de Janeiro. Série Livros, nº 9. Museu Nacional do Rio de Janeiro, Rio de Janeiro, Brazil, 256pp. Mérona, B.; Rankin-de-Mérona, J. 2004. Food resource partitioning in a fish community of the central Amazon floodplain. Neotropical Ichthyology, 2 (2): 75-84. Revista Biotemas, 23 (2), junho de 2010 Montenegro, A. K. A.; Crispim, M. C.; Torelli, J.; Marinho, R. S. A. 2006. The influence of the methodology in the results of food diet analysis of Steindachnerina notonota (Miranda-Ribeiro, 1937), in Taperoá II dam, PB - Caatinga. Revista de Biologia e Ciências da Terra, 1 (Suplemento Especial): 180-191. Pereira, M. C.; Andrade, D. R.; Costa, A. P. R.; Vidal Jr., M. V.; Yasui, G. S. Índices de alimentação e ciclo reprodutivo em machos de piau-vermelho Leporinus copelandii (Steindachner, 1875) na bacia do baixo rio Paraíba do Sul. Ciência Animal Brasileira, 8 (4): 599-607. Peret, A. M. 2004. Dinâmica da alimentação de peixes piscívoros da represa de Três Marias (MG). Master’s Dissertation. Universidade Federal de São Carlos, Brazil, 60pp. Pimenta Filho, E. C.; Sarmento, J. L. R.; Ribeiro, M. N. 2004. Efeitos genéticos e ambientais que afetam a produção de leite e duração da lactação de cabras mestiças no estado da Paraíba. Revista Brasileira de Zootecnia, 33 (6): 1426-1431. Resende, E. K.; Pereira, R. A. C.; Almeida, V. L. L.; Silva, A. G. 2000. Peixes onívoros da planície inundável do rio Miranda, Pantanal, Mato Grosso do Sul, Brasil. Boletim de Pesquisa – Embrapa, n. 16, Pantanal – Corumbá, 44pp. Available at <http:// www.cpap.embrapa.br/publicacoes/online/BP16.pdf>. Accessed on October 26, 2009. Santos, E. P. dos. 1978. Dinâmica de populações aplicada à pesca e piscicultura. HUCITEC, Editora da Universidade de São Paulo, São Paulo, Brazil, 129pp. Statsoft, INC. 1998. Statistica for Windows (Computer Program Manual). Statsoft Inc., Tulsa, USA. Tavares, E. F.; Godinho, H. P. Ciclo reprodutivo o peixe piaugordura (Leporinus piau Fowler, 1941) da represa de Três Marias, rio São Francisco. Revista Ceres, 41 (233): 28-35. Teixeira, J. L. A. & Gurgel, H. C. B. 2005. Ocorrência e distrivuição temporal da ictiofauna do Açude Riacho da Cruz, no Rio Grande do Norte. Revistas Ceres, 1 (2): 1-8. Vazzoler A. E. A. M. 1996. Biologia da reprodução de peixes Teleósteos: Teoria e Prática. EDUEM, Maringá, Brazil, 169pp. Zavala-Camin, L. A. 1996. Introdução aos estudos sobre alimentação natural em peixes. EDUEM, Maringá, Brazil, 129pp.
Download