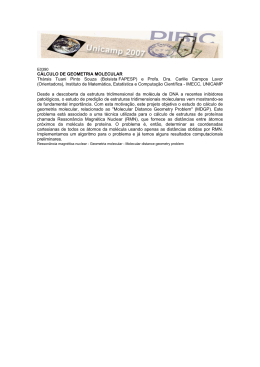
Universidade Federal do Rio Grande do Sul
Programa de Pós-Graduação em Genética e Biologia Molecular
Filogeografia e Sistemática Molecular de
Schizolobium parahyba (Vell.) Blake
(Guapuruvu) através do sequenciamento de
regiões cloroplásticas e nucleares
Andreia Carina Turchetto Zolet
Orientador: Dr. Rogério Margis
Co-Orientadora: Dra. Márcia Margis-Pinheiro
Tese de doutorado
Porto Alegre 2009
Universidade Federal do Rio Grande do Sul
Instituto de Biociências
Programa de Pós-Graduação em Genética e Biologia Molecular
Filogeografia e Sistemática Molecular de Schizolobium parahyba (Vell.) Blake
(Guapuruvu) através do sequenciamento de regiões cloroplásticas e nucleares.
Andreia Carine Turchetto Zolet
Orientador: Dr. Rogério Margis
Co-Orientadora: Dra. Márcia Margis-Pinheiro
Tese submetida ao Programa de Pós-Graduação
em Genética e Biologia Molecular da UFRGS
como requisito parcial para a obtenção do grau de
Doutor em Ciências.
Porto Alegre
Agosto de 2009
Este trabalho foi desenvolvido no Laboratório de Genomas e Populações de Plantas do
Centro de Biotecnologia da Universidade Federal do Rio Grande do Sul e também é parte
do projeto SEEDSOURCE, subvencionado por: Conselho Nacional de Desenvolvimento
Científico e Tecnológico (CNPq) e European Commission Sixth Framework Programme
(EU-FP6).
Agradecimentos
Inicio agradecendo a todas as pessoas e instituições que tornaram possível o
desenvolvimento deste trabalho que, de alguma maneira, me auxiliaram para o
desenvolvimento do mesmo.
Ao meu orientador Rogério Margis por ter me aceito em seu laboratório e
acreditado no meu trabalho. Pela sua excelente orientação e por ser um exemplo de
orientador, professor e pesquisador. Por jamais ter deixado faltar qualquer coisa necessária
para o trabalho e pelo acompanhamento diário no desenvolvimento do mesmo, inclusive
nas coletas.
À minha co-orientadora Marcia Márgis-Pinheiro pela sua dedicação,
carinho, pela força, apoio e pelos seus ensinamentos. Por acompanhar de perto o trabalho,
ler os artigos e também pela ajuda nas coletas.
Aos professores do Departamento de Genética e do Centro de Biotecnologia
da UFRGS, ministrantes das disciplinas cursadas durante o doutorado que contribuíram
para a minha formação.
À Fernanda Cruz por ter sido a minha melhor estagiária. Pela dedicação ao
trabalho e pelos excelentes PCRs e géis que fez durante sua estada no laboratório. Muitos
dos resultados obtidos são graças á sua fiel ajuda.
Aos meus colegas e amigos do laboratório de Genomas e Populações de
Plantas: Fernanda, Claúdia, Franceli, Cintia, Guilherme Loss, Guilherme Cordenonsi,
Júlio Cesar, Matheus, Felipe pela amizade, carinho e pelas grandes discussões
científicas, filosóficas e muitos outros assuntos que tornaram nossos dias de trabalhos
4
muito melhores. Pelas colaborações quando precisei de ajuda para guardar um PCR, tirar
foto de gel, etc. Em especial à Franceli, Claudia (Júlia), Fernanda e Cintia, meninas tão
especiais que conheci há pouco tempo, mas que já estão no meu coração como verdadeiras
irmãs. Pelo carinho que me dedicam e pela ajuda sempre que eu preciso. Valeu amigonas!
Aos amigos e vizinhos do Laboratório de Biologia Molecular Vegetal, dos
professores Giancarlo Pascuali e Jeverson Frazon, pela amizade, parceria e pelos vários
momentos em que precisei alguma coisa emprestada e todos sempre foram muito gentis e
solidários.
A todos os amigos e colegas do Núcleo de Genômica Funcional de Plantas,
pela amizade e pelas trocas de conhecimentos durante todo esse tempo.
Agradeço com muito carinho ao Elmo e à Elen, pela dedicação e eficiência
com que fazem seu trabalho. Pela recepção sempre cordial e pronta para ajudar.
Ao Fabiano Salgueiro, pela ajuda nas coletas e pelas discussões sobre o
trabalho.
Ao Giovanni G. Vendramin por ter me recebido em seu laboratório e pelas
correções de um dos artigos.
Ao Marcelo Simon pela grande ajuda na realização de algumas análises e
também pelas correções de um dos artigos.
Aos pesquisadores Maristerra Lemes, Rogério Gribel, Carlos Navarro,
Renato Valencia e Poliane Alfenas pelas coletas e envio de amostras.
À minha grande amiga Fernanda Sperb, uma pessoa muito especial e
querida, que considero uma irmã, pela sua amizade e carinho. Pelos nossos cafés de final
5
de tarde, pelos bate-papos que me ajudaram a discontrair e com certeza me fez muito mais
feliz. Obrigada amiga!
À minha querida irmã Caroline pelo seu amor e carinho, pelo apoio em
todas as horas e pela grande ajuda na realização de algumas análises, pelas discussões
sobre o trabalho...enfim, obrigada maninha!
Aos meus pais Vera e Alcides por terem me ensinado os grandes valores da
vida, pelo amor, carinho e compreensão, que mesmo estando distantes, sempre estiveram
presentes em todos os momentos. Obrigada meus amores!
Ao meu marido Renato por todo o amor que me fez ter forças sufuciente
para enfrentar qualquer obstáculo. Pelo apoio, incentivo e confiança que sempre me
dedicou. Pelo apoio técnico em informática e pelo apoio moral nas horas difíceis. Meu
amor, você é incrível! Obrigada por ser essa pessoa maravilhosa e que me faz acreditar
mais em mim mesma. Te Amo!
6
Sumário
RESUMO .............................................................................................................................. 8
ABSTRACT ....................................................................................................................... 10
CAPÍTULO I: INTRODUÇÃO GERAL ........................................................................ 12
FAMÍLIA FABACEAE.......................................................................................................... 13
GÊNERO SCHIZOLOBIUM.................................................................................................... 14
FLORESTAS NEOTROPICAIS ............................................................................................... 21
ESTUDO DE GENES RELACIONADOS AO ESTRESSE HÍDRICO EM PLANTAS ........................... 23
ESTUDOS FILOGEOGRÁFICOS ............................................................................................ 25
SISTEMÁTICA MOLECULAR............................................................................................... 26
MARCADORES MOLECULARES.......................................................................................... 27
OBJETIVO GERAL.............................................................................................................. 29
CAPÍTULO
II:
THE
EVOLUTION
OF
PYRROLINE-5-CARBOXYLATE
SYNTHASE IN PLANTS: A KEY ENZYME IN PROLINE SYNTHESIS ................ 30
CAPÍTULO
HISTORY
III:
OF
MOLECULAR
NEOTROPICAL
SYSTEMATICS
TREE
AND
EVOLUTIONARY
SCHIZOLOBIUM
(FABACEAE-
CAESALPINIOIDEAE) INFERRED FROM NUCLEAR AND CHLOROPLAST
DNA SEQUENCES. .......................................................................................................... 42
CAPÍTULO IV: PHYLOGEOGRAPHY OF THE DISJUNCT NEOTROPICAL
TREES
SCHIZOLOBIUM
(CAESALPINIOIDEAE)
SUGGESTS
PAST
INTERCONNECTIONS BETWEEN AMAZONIAN AND ATLANTIC FORESTS 81
CAPÍTULO V: CONSIDERAÇÕES FINAIS .............................................................. 115
ESTUDO DE GENES RELACIONADOS AO ESTRESSE HÍDRICO PARA ESPÉCIES ARBÓREAS.... 117
ESTUDO DE SISTEMÁTICA MOLECULAR, BIOGEOGRAFIA E FILOGEOGRAFIA ................... 120
CAPÍTULO VI: REFERÊNCIAS BIBLIOGRÁFICAS DOS CAPÍTULOS I E V .. 125
ANEXO I .......................................................................................................................... 137
7
Resumo
A Floresta Atlântica e a Floresta Amazônica estão entre as maiores e mais diversas
florestas tropicais do mundo, com muitas de suas espécies apresentando distribuição
disjunta. O estudo genético molecular dessas espécies é interessante, pois podem fornecer
informações sobre o relacionamento histórico entre essas diferentes regiões geográficas.
Entretanto, ainda poucos são os estudos sobre a distribuição da estrutura genética nestas
áreas, principalmente para espécies vegetais. O estudo da diversidade genética em espécies
arbóreas é de grande importância para a manutenção das fontes de germoplasma a serem
usados em práticas de reflorestamento e para espécies com uma ampla distribuição
geográfica que ocupam diferentes habitats que são componentes chaves na composição de
diversos ecossistemas. O gênero Schizolobium (Caesapinioideae) apresenta ampla
distribuição nos Neotrópicos e devido ao seu rápido crescimento é amplamente utilizado
em programas de reflorestamento, além de apresentar importância econômica pela
utilização da madeira. O presente estudo apresenta a primeira análise genética molecular
do gênero Schizolobium, incluindo uma ampla amostragem de populações ao longo de sua
distribuição geográfica. Um conjunto de 11 marcadores moleculares (cpDNA e ITS) foram
usados para investigar a evolução, posição sistemática, estimar o tempo de divergência
entre as duas variedades, verificar um possível evento de especiação, estudar os padrões
biogeográficos entre as florestas Atlântica e Amazônica, além de investigar a estrutura
filogeográfica em Schizolobium. Marcadores não-neutros também foram estudados na
tentativa de serem usados para investigar a variação adaptativa relacionada ao estresse
hídrico. Sequências parciais dos genes P5CS de quatro espécies arbóreas (Schizolobium
parahyba, Ceiba pentandra, Bombacopsis quinata e Cedrela Odorata) foram clonadas,
seqüenciadas e comparadas com sequências de outras espécies. A análise filogenética
indicou que eventos de duplicação ocorreram várias vezes e em diferentes frequências ao
longo da evolução das monocotiledôneas e dicotiledôneas. Apesar de ter sido detectada
seleção positiva em diferentes regiões do genes P5CS, uma pequena quantidade de
8
polimorfismo foi encontrado entre indivíduos de
Schizolobium e não foram
correlacionados com estresse hídrico. A monofilia do gênero Schizolobium foi bem
suportada pelas análises de maxima parsimônia e Baysiana das regiões de cpDNA e de
DNA nuclear. A idade do clado Schizolobium foi estimado em aproximadamente 15,6
milhões de anos (Mya) e as duas variedades divergiram a aproximadamente 3,1 Mya. Um
elevado nível de divergência genética foi observado entre as populações de Schizolobium e
os resultados indicam uma forte estruturação filogeográfica e um reduzido fluxo gênico
entre elas. Além disso, nenhum haplótipo nuclear e de cpDNA foi compartilhado entre as
duas variedades, evidenciando um isolamento entre elas. Foi observada similaridade nas
sequências de cpDNA entre indivíduos de algumas populações da var. parahyba na Mata
Atlântica (RJ3, ES, BA1, BA2 e BA3) com indivíduos das populações da var. amzonicum,
indicando a possibilidade da existência de retenção de polimorfismo ancestral com pouco
tempo para o acúmulo de divergência nestas regiões. Todos os dados moleculares
produzidos sugerem a separação das duas variedades dentro do gênero Schizolobium, e que
a sua atual divisão taxonômica necessita de revisão. Esses dados também fornecem
importantes informações genéticas que podem ser aplicadas no campo da conservação e
florestamento exploratório.
9
Abstract
The Atlantic and the Amazon rain forests encompass the most diverse tropical forests in
the world, with many species showing disjunct distribution. The molecular studies of
widespread and disjunct species present particular interest, as they can provide information
on the historical relationship between different geographical regions. However, there are
few records about genetic structure in these areas mainly in plants species. Studies of
genetic diversity of the tree species are very important to provide best practice policies for
sourcing germplasm for reforestation within a range of degraded landscapes and for trees
with a range of lifestyles that are key components of a diverse ecosystem composition.
Schizolobium (Caesalpinioideae) is a widespread genus found in Neotropical forest, with a
fast growing rate that make it extensively used in economically important reforestation
programs that employ native trees. This study presents the first extensive molecular
analysis within the genus Schizolobium, including a widespread sampling of populations
from throughout their geographic distribution. A set of 11 molecular markers (cpDNA and
nuclear) were used to address the evolution, systematic position, estimate the age of
divergence between the two varieties, to study the biogeographic patterns between Atlantic
and Amazonian rain forests and to investigate the phylogeographic structure of
Schizolobium. Furthermore, non neutral markers were studied to attempt of access the
adaptive variation in neotropical tree species. Partial sequences of P5CS genes from four
Neotropical trees (Schizolobium parahyba, Ceiba pentandra, Bombacopsis quinata e
Cedrela Odorata) were cloned and compared to those of other plant taxa. The molecular
phylogenetic analysis indicated that P5CS duplication events have occurred several times
following the emergence of flowering plants and at different frequencies throughout the
evolution of monocots and dicots. Besides, positive selection was observed at different
regions of P5CS paralogous genes, but a low polymorphism was found among individual
of different areas and did not associate with water stress. The monophyletic nature of
Schizolobium was well supported by both the Maximum Parsimony and Bayesian analyses
10
of the cpDNA and nuclear regions. The Schizolobium crown node was estimated to have
arisen 15.6 million years ago (Mya) and the two varieties has been diverged approximately
3.1 Mya. High levels of genetic divergence were found among the populations of
Schizolobium and the results indicate a strong phylogeographic structure and a reduced
gene flow between them. Besides, the cpDNA and nuclear haplotypes is not sharing
between the two varieties, indicated a genetic isolation between them. The cpDNA
sequence similarity of some populations from Atlantic forest (RJ3, ES, BA1, BA2 e BA3)
with the var. amazonicum was observed and this may be due retention of ancestral
polymorphisms with insufficient time for the accumulation of differences in these regions.
The molecular data suggest the separation of the two varieties of genus Schizolobium, and
current taxonomic status needs revision. These data also provides important genetic
information for conservation.
.
11
Capítulo I: Introdução Geral
12
INTRODUÇÃO
Família Fabaceae
A família Fabaceae - Leguminosae é uma das maiores famílias de plantas
dentre as angiospermas, com cerca de 730 gêneros e mais de 19.400 espécies. Os membros
desta família são representados em quase todos os biomas terrestres, em regiões tropicais e
temperadas, sendo que o principal elemento unificador da família é o fruto, a vagem. A
família inclui muitas espécies com importância agronômica, além da sua extrema
importância ecológica. A família Fabaceae é tradicionalmente dividida em três
subfamílias: Caesalpinioideae, Mimosoideae e Papilonoideae (Lewis et al., 2005).
Considerada uma família tropical, com possível origem no último Cretáceo (65-70 Mya),
as Leguminosas têm um abundante e contínuo registro fóssil desde o Terciário (Crepet,
Taylor, 1985; Crepet, Taylor, 1986). Registros de ocorrência sugerem que a maioria das
principais linhagens de leguminosas arbóreas tiveram maior diversificação a partir de
meados do Eoceno (HERENDEEN et al., 1992).
A subfamília Caesalpinioideae é parafilética e inclui aproximadamente 2250
espécies em 17 gêneros, os quais são principalmente árvores e arbustos distribuídos em
regiões tropicais e subtropicais. Essa subfamília encontra-se atualmente dividida em quatro
tribos: Cercideae, Deterieae, Cassiae e Caesalpineae (Lewis et al., 2005). A tribo
Caesalpineae encontra-se dividida em oito grupos, dentre eles o grupo Peltophorum, que
inclui 16 gêneros, sendo 8 deles restritos da América do Sul. Análises moleculares com o
gene rbcL sugerem que este grupo é parafilético (Kajita et al., 2001), o que foi suportado
13
com dados do intron trnL (Bruneau et al., 2001) e do espaçador plastidial trnL-trnF
(Haston et al., 2003; Haston et al., 2005).
Gênero Schizolobium
O gênero Schizolobium está incluso no grupo Peltophorum e apresenta
distribuição geográfica bastante ampla e disjunta, sendo encontrado desde a América
Central até o Sul do Brasil (Figura 1). Desde a criação do gênero Schizolobium, várias
espécies foram descritas e incorporadas: S. amazonicum, S. parahyba, S. glutinosum, S.
kellermaniy e S. excelsum. Entretanto, em 1996, Barneby assumiu que estas cinco espécies
são sinonímias da única espécie S. parahyba e, baseado em diferenças morfológicas,
dividiu a espécie em duas variedades: S. parahyba var. parahyba e S. parahyba var.
amazonicum. S. parahyba é popularmente conhecido como guapuruvu, pau-de-canoa,
pinho-branco, ficheira bacuru, bageiro ou faveiro, dentre outros nomes regionais
(Carvalho, 1994).
As características morfológicas que diferenciam uma variedade da outra
são: S. parahyba var. parahyba apresenta pedicelos não unidos e anteras com 2,3-3,2mm,
enquanto na var. amazonicum, os pedicelos são unidos a 2,0-6,5mm acima da base e as
anteras apresentam entre 1,3-2,3mm (Barneby, 1996). Além disso, as duas variedades
apresentam distribuição geográfica disjunta (Figura 1). S. parahyba var. amazonicum
ocorre na floresta amazônica brasileira, em áreas de floresta primária e secundária de terra
firme e em várzea alta dos estados do Pará, Rondônia, Amazonas e Mato Grosso e em
florestas subtropicais da America Central, Colômbia, Peru, Equador, Venezuela, e também
no México. Tem como sinônimo S. amazonicum Huber & Ducke. S. parahyba, var.
14
parahyba ocorre ao longo da Mata Atlântica, desde o Sul da Bahia até o Sul de Santa
Catarina (Barneby, 1996).
Figura 1: Distribuição geográfica de Schizolobium mostrando a distribuição
disjunta das duas variedades. Circulos represtam a distribuição da var. parahyba
e triângulos da var. amazonicum. A área pontilhada mostra os locais de
ocorrência.
15
O Schizolobium é uma árvore semicaducifolia, de rápido crescimento,
podendo alcançar até 40m de altura e 300cm de DAP (diâmetro à altura do peito). Quando
adulta apresenta copa muito ampla, de formato umbeliforme (Figura 2).
A
B
Figura 2: Árvore adulta de Schizolobium. (A) Período vegetativo. (B) Período de floração
As plantas de guapuruvu possuem raízes tabulares (Figura 3A) e o longo
tronco cilíndrico apresenta fuste com até 15m de comprimento, possuindo lenticelas
(Figura 3B). Apresenta folhas alternas, compostas, de até 1m de comprimento, bipinadas
(Figura 3C). Suas flores formam inflorescências agrupadas em racemos terminais de até 30
cm de comprimento (Figura 3D). Os frutos são obovado-oblongo achatados, coriáceos, de
coloração bege a marrom, com, em média, 16cm de comprimento e 6 cm de largura
(Figura 3E). Quando os frutos estão maduros suas valvas se abrem, liberando a semente
envolta pelo meso-endocarpo alado. As sementes são lisas, brilhantes, oblonga-achatadas,
com tegumento duro, geralmente solitárias, medindo de 2 a 3cm de comprimento e 1,5 a
2,0cm de largura (Figura 3F) (Barneby, 1996).
16
Figura 3: (A) Raízes tabulares. (B) Tronco com lenticelas. (C) Folhas compostas.
(D) Inflorescências. (E) Fruto tipo sâmara. (F) Sementes.
Figura 4: (A) Árvores em um fragmento de floresta Atlântica em Garopaba SC.
(B) Planta jovem mostrando sua característica pioneira.
17
É considerada espécie pioneira, ocorrendo preferencialmente em matas em
estágio inicial de sucessão, sendo essencialmente heliófita. Sua distribuição natural é
irregular e descontínua, ocorrendo em grupos de várias árvores na floresta (Figura 4A) e
individualmente nos estágios sucessionais (Figura 4B). Ocorre em áreas com precipitação
pluvial média anual variando de 1.100mm a 2.400mm e temperatura média anual de
18,8°C a 24,3°C, em tipos climáticos tropical, subtropical de altitude e subtropical úmido
(Carvalho, 1994).
Os indivíduos de guapuruvu são hermafroditas, polinizados principalmente
por espécies de abelhas pequenas (Apis mellifera, Friesella schrottkyi, Plebeia remota,
Paratrigona subnuda) (Morelatto, 1991). A floração ocorre de julho a dezembro e os
frutos amadurecem entre março e agosto. O início da floração e a frutificação acontecem
quando as plantas atingem entre 6 e 8 anos de idade. A dispersão dos frutos é barocórica e
anemocórica e as sementes são geralmente dispersas pelo vento.
A produtividade volumétrica máxima registrada em plantas aos 10 anos de
idade é de 45m3/ha/ano e sua madeira é considerada leve (0,32 a 0,40g/cm 3), com
superfície lisa, textura uniforme, alburno branco, com manchas amareladas e rosadas.
Apresenta baixa resistência a organismos xilófagos, porém, sua permeabilidade às soluções
preservantes é alta e é fácil de ser cortada e beneficiada. A madeira é bastante utilizada na
confecção de canoas e objetos para aeromodelismo, em função da baixa densidade e na
confecção de painéis, portas, brinquedos e caixas e também pode ser utilizada como chapas
de compensado e laminados, é empregada na construção civil e em obras internas, além de
ser considerada excelente para a produção de polpa e papel de fibra curta, levando a
vantagem de ter a madeira quase branca e mole (Pietrobom, Oliveira, 2004).
18
A espécie apresenta, ainda, papel de destaque em programas para o
reflorestamento misto de áreas degradadas visando a preservação permanente, devido
principalmente ao seu rápido crescimento no campo, podendo atingir dez metros de altura
no período de dois anos (Pietrobom, Oliveira, 2004).
A variedade amazonicum (paricá) é altamente cultivada pelas empresas
madeireiras da região norte e nordeste do Brasil, principalmente nos Estados do Pará e
Maranhão. Segundo o Centro de Pesquisa do Paricá (CPP) localizado no município de
Dom Eliseu, no sul do Pará, que representa a grande maioria dos plantadores de paricá dos
Estados do Pará e Maranhão, estima-se que, nestes Estados, existam em torno de 40.000
hectares da espécie plantados (Figura 5). No Equador, também existem muitas plantações
de Schizolobium, sendo que a origem dos germoplasmas cultivados tem origem da Costa
Rica (Canchignia-Martínes et al., 2007).
Figura 5: Utilização de Schizolobium em programas de reflorestamento na Amazônia.
Fonte: http://www.gruporosa.com.br/reflorestamento.html
19
Figura 6: Plantas de Schizolobium usadas para paisagismo
O Schizolobium também é utilizado em paisagismo, principalmente na
região sul do país, tendo sido eleita a árvore símbolo de Florianópolis. É considerada uma
espécie ornamental devido a sua intensa floração amarela e ao seu porte majestoso. Seu
uso é recomendado na arborização de parques e ruas, pois suas raízes causam poucos
danos a muros e calçamento, sendo também indicado para a restauração de mata ciliar em
locais não sujeitos a inundações.
Muitos trabalhos vêm sendo realizados com plantas de Schizolobium a
respeito de aspectos fisiológicos (Adami, Hebling, 2005; Coelho et al., 2006; Costa et al.,
20
2006; Cruz et al., 2007; de Carvalho, 2005; Filho et al., 2007; Locatelli et al., 2007; Melo
Marques et al., 2004), anatômicos (Marcati et al., 2008; Pietrobom, Oliveira, 2004),
bioquímicos e medicinais (de Carvalho et al., 2008; Mendes et al., 2008; Vale et al., 2008)
entre outros aspectos (Naumann et al., 2008; Soares et al., 2008; Zanuncio et al., 2004).
Entretanto, poucos trabalhos abordaram aspectos moleculares, entre eles (CanchigniaMartinez et al., 2007; Freire et al., 2007; Kamau et al., 2003; Turchetto-Zolet et al., 2009),
mas nenhum tratou de aspectos filogeográficos.
Florestas Neotropicais
A região Neotropical está entre as regiões de maior biodiversidade do
mundo e, por isso desperta preferência em estudos de origem da diversidade biológica
(Rull, 2008). A flora Neotropical compreende aproximadamente 37% das espécies de
plantas do mundo e muitas destas espécies são encontradas em florestas úmidas, as quais
têm maior diversidade de plantas do que qualquer outro habitat do planeta, com mais de
90.000 espécies de plantas (Thomas, 1999). A origem de toda essa diversidade ainda
permanece pouco explicada e por outro lado, algumas áreas neotropicais vêm sofrendo
grande perda da biodiversidade devido à grande exploração e, foram identificadas como
hotspots de biodiversidade e necessitam de atenção especial e programas de conservação
(Myers, 2003).
O tempo e o modo de origem das espécies e a sua biodiversidade nos dias
atuais ainda permanecem pouco explicadas, podendo ter sido efeitos de mudanças
climáticas ocorridas no Quaternário ou ciclos glaciais do Pleistoceno (Bennett, 2004;
Lovette, 2005). Muitos estudos tentam explicar o papel das mudanças climáticas
21
ambientais do Quaternário no mecanismo de especiação e dos modernos padrões de
biodiversidade encontrados, principalmente na região Neotropical (Lister et al., 2004). Os
eventos de glaciações sugerem hipóteses de especiação recente, sendo que uma delas é a
teoria de refúgios, onde teriam ocorrido diferenciações alopátricas entre as populações de
espécies de florestas úmidas, que se tornaram isoladas umas das outras por se adaptarem a
diferentes condições ambientais (Haffer, Prance, 2001; Prance, 1973). Algumas evidências
de especiação no Pleistoceno em espécies arbóreas de florestas úmidas são mostradas em
(Richardson et al., 2001).
As florestas tropicais são conhecidas pela sua ampla biodiversidade.
Exemplos de tais ecossistemas são a floresta Atlântica e Amazônica, que são as florestas
tropicais mais diversas do mundo. Entre estas duas florestas existe um corredor de
vegetação aberta, composto pela Caatinga ou Cerrado, que tem sido considerado uma
importante barreira para a migração de muitas espécies entre elas (Prado, Gibbs, 1993). Por
outro lado, estudos mostram que muitas espécies presentes nas florestas úmidas também se
distribuem através do cerrado, indicando que no passado, a floresta Atlântica e Amazônica
provavelmente foram contínuas e tornaram-se separadas após períodos de seca em que se
formaram as savanas (Ledru, 1993). Com relação à conectividade das duas maiores
florestas Neotropicais (Atlântica e Amazônica), estudos mostram que, do ponto de vista
biogeográfico, a região nordeste do Brasil é particularmente interessante no que diz
respeito à origem e as conexões passadas entre essas florestas (Behling, 2002; Behling et
al., 2000; Behling, Lichte, 1997).
A Mata Atlântica estendia-se de forma contínua ao longo da costa brasileira,
desde o nordeste até o Rio Grande do Sul, penetrando até o leste do Paraguai e nordeste da
Argentina. A Mata Atlântica engloba 2.428 municípios de 16 estados brasileiros. No
22
passado, chegou a cobrir mais de 1,5 milhões de Km2, com 92% desta área no Brasil
(Fundação SOS Mata Atlântica & INPE 2001). A Mata Atlântica é um dos ecossistemas
mais ameaçados no mundo e o que resta da sua cobertura florestal é estimado em 5% da
área original. Atualmente, encontra-se extremamente fragmentada, ficando reduzida a
manchas disjuntas, concentradas nas regiões Sudeste e Sul, principalmente em locais de
topografia acidentada. Estes remanescentes são o testemunho da formação florestal mais
antiga do Brasil, estabelecida há cerca de pelo menos 70 milhões de anos (Leitão-Filho,
1987).
Os fragmentos florestais remanescentes são expostos a mudanças
dramáticas nas condições microclimáticas, sendo o ambiente biótico e abiótico
intensamente alterado nas áreas limítrofes (efeito de borda). Para algumas espécies de
plantas, pequenas mudanças nas condições do solo e na disponibilidade de luz e água
podem afetar a estrutura demográfica das populações, particularmente no estabelecimento
de plântulas. Plantas de fecundação cruzada obrigatória, que dependem de polinizadores
especializados para a formação de frutos e sementes, podem ser mais suscetíveis à
fragmentação do habitat. Nestas espécies, a diminuição populacional e o aumento da
distância entre os indivíduos podem dificultar o encontro de parceiros compatíveis.
Estudo de genes relacionados ao estresse hídrico em plantas
O estresse hídrico em plantas é um fator limitante do desenvolvimento e
pode ocorrer tanto pela falta quanto pelo excesso de água, ocasionando várias respostas das
plantas, que
podem desenvolver mecanismos de adaptação e tolerância às novas
condições. Alguns desses mecanismos estão relacionados (i) à síntese de metabólitos e
23
osmorreguladores (prolina e trealose); (ii) à regulação do transporte de água (aquaporinas);
(iii) ao transporte de lipídios e (iv) à alterações hormonais. Todas essas mudanças
fisiológicas, morfológicas e de desenvolvimento em plantas têm uma base molecular e
genética, pois a adaptação e a aclimatação ao estresse ambiental resultam da integração
desses eventos. Portanto, genótipos que diferem em tolerância ao estresse hídrico, sejam
por falta ou por excesso de água, apresentarão diferenças qualitativas e quantitativas na
expressão gênica. Uma resposta fisiológica específica ao estresse hídrico representa, na
realidade, a combinação de eventos moleculares prévios, em resposta a percepção do sinal
de estresse. A compreensão de como esses eventos são ativados ou desativados, como
interagem entre si e quais genes estão envolvidos, é um fator de extrema importância.
A prolina é um dos osmorreguladores que se acumulam em plantas
submetidas a condições de estresse hídrico (Delauney, Verma, 1993; Jimenez-Bremont et
al., 2006) e alguns trabalhos relatam o aumento de expressão dos genes que codificam a
enzima bifuncional da rota biosintética da prolina em condições de estresse (Liu et al.,
1996; Silva-Ortega et al., 2008; Strizhov et al., 1997; Yamchi et al., 2007). O gene p5cs já
foi identificado em várias plantas, e em algumas delas foram descritas duas cópias,
conhecidas como p5cs1 e p5cs2, ambas codificando uma enzima bifuncional de extrema
importância na rota biossintética da prolina. Entretanto, em bactérias e algas, foi descrita
apenas uma cópia do gene p5cs. Estas informações ressaltam a importância do estudo da
evolução destes genes, pelos mesmos poderem ser usados em análises de biodiversidade
adaptativa.
24
Estudos filogeográficos
A filogeografia é o campo de estudos envolvido com os princípios e os
processos que governam a distribuição geográfica de linhagens genéticas, especialmente
aquelas dentro e entre as espécies (Avise, 2000). Inferências filogeográficas podem
contribuir para um amplo estudo de ecologia e evolução em vários aspectos, tal como a
identificação de regiões evolutivamente independentes. Tais abordagens ainda podem
fornecer um contexto evolutivo e geográfico para as espécies e populações,
compreendendo as comunidades ecológicas, permitindo a determinação das influências
históricas e espaciais nas amostras de riquezas de espécies (Bermingham, Moritz, 1998;
Brown, 1994; Young, 1996). Além disso, estudos filogeográficos permitem o
entendimento e a identificação da história de áreas isoladas evolutivamente, podendo
orientar estratégias e as prioridades para a conservação das mesmas (Bermingham, Moritz,
1998; Moritz, 2002).
Vários são os exemplos de estudos filogeográficos em plantas que discutem
um panorama evolutivo de grandes áreas, sendo a maioria deles relacionados a florestas
temperadas (Aoki et al., 2006; Bauert et al., 2007; Bettin et al., 2007; Chen et al., 2008a;
Chen et al., 2008b; Chen et al., 2008c; Fujii, 2007; Ikeda, Setoguchi, 2007; Li et al., 2008;
Naciri, Gaudeul, 2007; Ortiz et al., 2008; Ronikier et al., 2008; Weising, Freitag, 2007).
Por outro lado, um número limitado de estudos abordam padrões filogeográficos de
espécies presentes em florestas Neotropicais (Andrade et al., 2007; Lira et al., 2003;
Lorenz-Lemke et al., 2005; Miller et al., 2008; Ramos et al., 2009). Poucos destes
trabalhos têm disponibilizado informações a respeito dos efeitos das expansões e
25
contrações históricas da Mata Atlântica nos padrões de variação intra-específica e
demonstram a complexidade da história deste bioma.
Estudos sobre a análise da diversidade genética de espécies vegetais nativas
da Mata Atlântica (Alcantara et al., 2006; Barbara et al., 2007; Cardoso et al., 2005; Ledru
et al., 2007; Margis et al., 2002; Medri et al., 2003; Moraes et al., 1999; Salgueiro et al.,
2004) mostram que os níveis de estruturação genética entre populações apresentam valores
de FST=0.04–0.211 (em espécies arbóreas) e de FST=0.029–0.43 (em espécies herbáceas), o
que aponta para diferentes padrões da distribuição da diversidade genética e do fluxo
gênico.
Sistemática Molecular
O desenvolvimento de técnicas moleculares, como PCR e sequenciamento
de DNA, causou um grande impacto no campo da sistemática, desde o início da década de
1990. A sistemática molecular engloba uma serie de abordagens de relações filogenéticas,
que são inferidas utilizando informações de macromoléculas dos organismos em estudo
(Soltis, Soltis, 2000). Em plantas, os primeiros estudos focavam em níveis taxonômicos, no
entanto, há uma crescente necessidade de ferramentas que possibilitem o estudo e o
relacionamento entre gêneros e espécies recentes. Para tanto, os estudos filogenéticos
utilizando variação de DNA permitem o alcance de tais informações. Com isso, o emprego
da sistemática molecular vem crescendo cada vez mais, pois também permite a
identificação de novas linhagens e produz dados que podem ser especialmente pertinentes
para o campo da biologia da conservação (Andreasen, 2005; Moritz, 1995; Soltis,
Gitzendanner, 1999). Muitos estudos recentes mostram a importância da sistemática
26
molecular na elucidação das relações taxonômicas de diversas espécies (Dick et al., 2003;
Gardner et al., 2008; Karehed, Bremer, 2008; Martin-Bravo et al., 2007; McNeill, Turland,
2009; Nagpal et al., 2008; Nunes et al., 2008; Peterson et al., 2008; Redondo et al., 2008;
Soltis, Soltis, 2000; Torres-Perez et al., 2009). Outros estudos relatam a importância da
sistemática na área da conservação (Aleixo et al., 2006; Boon et al., 2000; Gompert et al.,
2006; Veron et al., 2004).
Marcadores Moleculares
Os estudos de variabilidade adaptativa, sistemática molecular, diversidade
genética e filogeografia podem ser feitos através de marcadores moleculares, os quais
podem revelar interessantes padrões evolucionários, tais como o relacionamento entre
espécies congenéricas ou populações de espécies, além da interação entre as informações
genéticas com o clima e as diferentes condições ambientais nas quais as espécies estão
sujeitas. Estes caracteres podem fornecer ferramentas adicionais para a compreensão de
muitos fenômenos biológicos e auxiliar na conservação e manejo de muitas espécies, além
de serem importantes para a compreensão da taxonomia, fenômeno de espécies criticas,
isolamento de populações e a adaptação das espécies e indivíduos a estresses ambientais.
Atualmente existem diferentes técnicas da biologia molecular que permitem
a detecção da variabilidade existente em nível do DNA. O sequenciamento de regiões
plastidiais e nucleares são exemplos de marcadores bastante utilizados para análises
filogenéticas, filogeografia, diversidade genética e variação adaptativa. Para estudos
filogeográficos e filogenéticos em plantas, marcadores plastidiais e nucleares são
utilizados. Entre os marcadores nucleares destacam-se as regiões ribossomais ITS (internal
27
transcribed spacer) (Dick et al., 2007; Lorenz-Lemke et al., 2005; Stahlberg, Hedren,
2008; Yamaji et al., 2007) e entre os marcadores plastidiais destacam-se os espaçadores
intergênicos (Dobes et al., 2004; Fehlberg, Ranker, 2009; Fujii, 2007; Gong et al., 2008;
Lorenz-Lemke et al., 2006; Tan et al., 2008; Yuan et al., 2008). Além dos marcadores
neutros, destacam-se também a utilização de marcadores não neutros, através da análise de
SNPs (Single Polimorphism Nucleotide) que possibilitam abordagens de associação
adaptativa em muitas espécies de plantas. Nessa abordagem são utilizados regiões
codificantes do genoma, como por exemplo, genes que estão relacionadas a algum tipo de
estresse ambiental.
Os marcadores plastidiais são bastante utilizados e caracterizam-se pela
frequente herança uniparental, que é uma vantagem destes marcadores para a avaliação
diferencial do fluxo de pólen e sementes (Birky, 1995; Korpelainen, 2004). A análise do
DNA plastidial permite a detecção de híbridos, que podem não ser identificados somente
através da análise morfológica (Chen et al., 2004; Fant et al., 2005; Fant et al., 2003;
Modliszewski et al., 2006; Tovar-Sanchez et al., 2008).
Os internal transcribed spacer ribossomal (ITS) estão entre os marcadores
nucleares mais utilizados em estudos de sistemática molecular de plantas em baixos níveis
taxonômicos, devido a sua rápida taxa evolucionária e resolução do relacionamento
filogenético em vários níveis taxonômicos aliados a facilidade de amplificação por PCR
(Karehed et al., 2008).
28
Objetivo Geral
A presente tese está inserida em um projeto amplo que visa contribuir para
os estudos genéticos e moleculares de espécies arbóreas Neotropicais, produzindo e
fornecendo fontes de informações para espécies de árvores sócio-economicamente
importantes, oriundas de regiões tropicais das Américas Central e do Sul. Devido à falta de
informações sobre a diversidade genética de espécies arbóreas Neotropicais, incluindo S.
parahyba, esta tese tem como objetivo geral investigar aspectos sobre variação adaptativa,
diversidade genética, fluxo gênico, e padrões filogeográficos desta espécie. O
conhecimento destes itens será de grande importância para o desenvolvimento de
estratégias de conservação para essa espécie e espécies relacionadas, além de possibilitar o
fornecimento de informações sobre as melhores práticas em fontes de germoplasma para
reflorestamento dentro de uma escala de degradação ambiental.
29
CAPÍTULO II: The evolution of pyrroline-5-carboxylate synthase in
plants: a key enzyme in proline synthesis
Authors:
Andreia Carina Turchetto-Zolet1,2; Marcia Margis-Pinheiro1 and Rogerio Margis1,2,3
1
Programa de Pós-Graduação em Genética e Biologia Molecular, Departamento de
Genética, Universidade Federal do Rio Grande do Sul.
2
Centro de Biotecnologia, Universidade Federal do Rio Grande do Sul.
3
Departamento de Bioquimica, Universidade Federal do Rio Grande do Sul
Manuscrito publicado na Molecular Genetics and Genomics (2009)
281:87-97
30
Mol Genet Genomics (2009) 281:87–97
DOI 10.1007/s00438-008-0396-4
ORIGINAL PAPER
The evolution of pyrroline-5-carboxylate synthase in plants:
a key enzyme in proline synthesis
Andreia Carina Turchetto-Zolet ·
Marcia Margis-Pinheiro · Rogerio Margis
Received: 28 March 2008 / Accepted: 17 October 2008 / Published online: 12 November 2008
© Springer-Verlag 2008
Abstract Many plants synthesize and accumulate proline
in response to osmotic stress conditions. A central enzyme
in the proline biosynthesis is the bifunctional enzyme 1pyrroline-5-carboxylate synthase (P5CS) that includes two
functional catalytic domains: the -glutamyl kinase and the
glutamic--semialdehyde dehydrogenase. This enzyme catalyzes the Wrst two steps of the proline biosynthetic pathway and plays a central role in the regulation of this process
in plants. To determine the evolutionary events that
occurred in P5CS genes, partial sequences from four Neotropical trees were cloned and compared to those of other
plant taxa. Molecular phylogenetic analysis indicated that
P5CS duplication events have occurred several times following the emergence of Xowering plants and at diVerent
frequencies throughout the evolution of monocots and
dicots. Despite the high number of conserved residues in
plant P5CS sequences, positive selection was observed at
diVerent regions of P5CS paralogous genes and also when
dicots and monocots were contrasted.
Communicated by K. Shirasu.
A. C. Turchetto-Zolet · M. Margis-Pinheiro · R. Margis
Programa de Pós-Graduação em Genética e Biologia Molecular,
Universidade Federal do Rio Grande do Sul, Porto Alegre, Brazil
A. C. Turchetto-Zolet · R. Margis (&)
sala 213, prédio 43431, Centro de Biotecnologia,
Universidade Federal do Rio Grande do Sul,
Cx. Postal 15005, Porto Alegre 91501-970, Brazil
e-mail: [email protected]
URL: http://www.ufrgs.br/RNAi/LGPP.htm
R. Margis
Departamento de Bioquimica, Instituto de Ciências Básicas
da Saúde, Universidade Federal do Rio Grande do Sul,
Porto Alegre, Brazil
Keywords P5CS gene · Proline biosynthesis ·
Neotropical tree · Molecular phylogeny
Introduction
The response of plants to osmotic stress is complex and
involves several physiological and biochemical changes.
Under drought stress, plants can increase the osmotic
potential of their cells by synthesizing and accumulating
compatible osmolytes, such as polyols, sugars, betaine, glycine and proline among others (Delauney and Verma 1993).
Proline participates not only in osmotic adjustment but also
as a response to environmental stresses like low temperature, nutrient deWciency, exposure to heavy metals and high
acidity (Delauney and Verma 1993; Parvanova et al. 2004;
Goring and Thien 1979).
The pathway of proline biosynthesis was Wrst elucidated
in bacteria and begins with the ATP-dependent phosphorylation of glutamic acid by the -glutamyl kinase (-GK),
encoded by the proB gene. The product of -GK is reduced
to glutamic-semialdehyde (GSA) by the -glutamyl phosphate reductase (-GPR) encoded by the proA gene (Mahan
and Csonka 1983; Orser et al. 1988). GSA cyclizes spontaneously to form 1-pyrroline-5-carboxylate (P5C), which is
Wnally reduced to proline by P5C reductase (P5CR, encoded
by the proC gene) (Hu et al. 1992; Igarashi et al. 1997).
The proline biosynthetic route in plants resembles the
bacterial pathway and uses either glutamic acid or ornithine
as substrates. Under stressful conditions, proline is synthesized preferentially from glutamic acid (Delauney and
Verma 1993) via two intermediates: GSA and P5C (Verdoy
et al. 2006). The Wrst two steps of proline biosynthesis are
catalyzed by the bifunctional enzyme 1-pyrroline-5carboxylate synthetase (P5CS) that encompasses both the
31
123
88
-glutamyl kinase and the glutamic--semialdehyde dehydrogenase activities. The P5C is further reduced to proline
by the 1-pyrroline-5-carboxylate reductase enzyme
(P5CR) (Hu et al. 1992; Fujita et al. 1998; Ginzberg et al.
1998). The P5CS activity represents a rate-limiting step in
proline biosynthesis, which is controlled at the level of
P5CS transcription and through feedback inhibition of
P5CS by proline (Zhang et al. 1995; Hong et al. 2000). The
over-expression of the P5CS encoding gene in transgenic
tobacco plants resulted in increased proline production and
conferred tolerance of these plants to osmotic stress, conWrming that P5CS is of key importance for the biosynthesis
of proline in plants (Kishor et al. 1995).
The P5CS gene has been isolated from several plants and
in some species two copies of the gene have been described.
In Arabidopsis thaliana, the AthP5CS1 and AthP5CS2 genes
show diVerent temporal and spatial expression patterns.
While P5CS1 gene seems to be ubiquitously expressed in
almost all organs and rapidly induced by stress, P5CS2 is
expressed in dividing cells and in response to incompatible
interactions (Strizhov et al. 1997). Two P5CS genes were
also isolated from medicago (Medicago truncatula) and rice.
In M. truncatula P5CS1 encodes a developmental ‘housekeeping’ enzyme, while P5CS2 acts as a shoot-speciWc
osmo-regulated isoform (Verdoy et al. 2006). In rice, P5CS1
gene is inducible by salt, dehydration, cold, and abscisic
acid (ABA), and is ubiquitously expressed in both vegetative and reproductive organs, whereas P5CS2 is also inducible by NaCl and mannitol and is preferentially expressed in
mature plants, especially in stamens (Hur et al. 2004).
A signiWcant number of studies on physiological aspects
of P5CS have been conducted, for animals, plants and bacteria (Csonka 1981; Mahan and Csonka 1983; Orser et al.
1988; Kishor et al. 1995; Savoure et al. 1995; Zhang et al.
1995; Abraham et al. 2003; Fabro et al. 2004; Su and Wu
2004; Verdoy et al. 2006; Gruszka Vendruscolo et al. 2007)
and its biochemistry and function are now much better
understood. However, an evolutionary analysis of these
genes is still lacking. To investigate this issue, in the present
work, we have cloned partial sequences of P5CS genes from
four species of Neotropical trees, reconstructed a molecular
phylogeny of P5CS1 and P5CS2 genes in diVerent plant
species. Our results represent the Wrst contribution to the
understanding of the evolutionary events of this gene family, which plays a key role in stress resistance and tolerance.
Materials and methods
Plant material and DNA isolation
The four species of Neotropical trees used for cloning
P5CS genes were Schizolobium parahyba, Bombacopsis
123
Mol Genet Genomics (2009) 281:87–97
quinata, Ceiba pentandra and Cedrela odorata. Cambium
from S. parahyba and leaves from the other three species
were used to isolate genomic DNA using a CTAB method
(Doyle and Doyle 1990). BrieXy, 100–200 mg of plant
material was powdered in liquid nitrogen and incubated
with 0.7 ml of extraction buVer (2% CTAB, 1.4 M NaCl,
20 mM EDTA, 100 mM Tris-HCI pH 8.0, 0.2% -mercaptoethanol) at 60°C for 60 min, 0.6 ml chloroform/isoamyl
alcohol (24:1) was added, samples were vigorously shaken
and phases were separated by centrifugation for 10 min at
12,000g. The upper aqueous phase was removed and mixed
with two volumes of isopropanol for 10–24 h at ¡20°C and
centrifuged for 20 min at 14,000g. The DNA was washed
with 70% ethanol, air-dried, and dissolved in an appropriate
volume of TE buVer (Tris-EDTA) and kept at ¡20°C
before use.
Design of degenerate oligonucleotides and DNA ampliWcation
To isolate P5CS partial sequence, we designed a pair of
degenerate primers: the forward primer P5CSiF2
5⬘GGIATHTTYTGGGAYAAYGA and the reverse primer
P5CSiR2 5⬘GCIGCIACIGCCATYTC, located in conserved sequences identiWed by multiple sequence alignment
of P5CS sequences (Fig. 1a). Sequences from target species
were then ampliWed by PCR using 10 ng of genomic DNA,
2.5 mM MgCl2, 0.25 mM dNTP mix, 1 £ PCR buVer,
0.05 U of Platinum Taq DNA polymerase (Invitrogen) and
5 M of each primer in a Wnal volume of 20 l. The PCR
cycle had an initial hot-start step at 94°C for 5 min, followed by a touchdown program with annealing temperature
decreasing from 60 to 50°C in 20 cycles, followed by 30
cycles at an annealing temperature of 54°C for 15 s, with
2 min elongation at 72°C and 30 s of denaturation at 94°C.
All PCR products were visualized by electrophoresis in
1.5% agarose gels stained with SYBR Gold (Invitrogen).
P5CS cloning and sequencing
AmpliWed PCR products of S. parahyba and B. quinata
were cloned into pCR 2.1 TOPO TA vector (Invitrogen),
while PCR products of the C. pentandra and C. odorata
were cloned into pGEM-TEasy plasmid (Promega). The
ligation products were transformed into electrocompetent
E. coli XLI. Plasmids were puriWed with PureLink quick
plasmid miniprep kit (Invitrogen) and sequenced by the
dideoxy chain-termination method using BigDye (Applied
Biosystems), using an ABI-3100 automatic sequencer
(Applied Biosystems). Both DNA strands of each clone
were fully sequenced using T7 and M13 universal primers.
The identity of sequences was certiWed using blastn and
tblastx algorithms against DNA plant sequences deposited
32
Mol Genet Genomics (2009) 281:87–97
89
Fig. 1 a Structural organization
of arabidopsis P5CS2 gene with
emphasis in the region ampliWed
by P5CS degenerate primers.
b Nucleotide and amino acid
sequences of the P5CSiF2 and
P5CSiR2 degenerate primers.
c Alignment of partial P5CS
amino acid sequences of C. odorata (CodoP5CS), C. pentandra
(CpenP5CS1 and 2), B. quinata
(BquiP5CS), S. parahyba
(SparP5CS1 and 2), A. thaliana
(AthaP5CS1 and 2), Populus
trichocarpa (PtriP5CS1 and 2)
and O. sativa (OsatP5CS1 and
2). Conserved residues are in
white with a black background
at NCBI (http://www.ncbi.nlm.nih.gov). Computer analyses of nucleotide and amino acid sequences were carried
out using Vector-NTI software (Invitrogen).
RNA isolation, cDNA synthesis and ampliWcation
The total RNA was extracted from young leaves and cambium samples from S. parahyba using the Trizol reagent
(Invitrogen). Approximately 1 g of total RNA was denaturated at 70°C and hybridized with 100 nmol of primer
T23 V (5⬘ TTT TTT TTT TTT TTT TTT TTT TTV) or
20 nmol of speciWc P5CS1R2 (5⬘ ATT GGG CAG AGG
TGG TAT GA) or P5CS2R2 (5⬘ CCC GCA CTC AAA
GCT TAT TC) reverse primers. RNA-primer mix was
added to each cDNA synthesis buVer and incubated at 40°C
for 1 h in the presence of 200 U of MMLV-reverse trans-
criptase (Promega). The cDNAs were diluted 1:50 with
deionized water and fractions of 10 l were used in PCR
reactions. Two primer-pairs were designed to amplify speciWcally the internal regions of P5CS1 (P5CS1F2 and
P5CS1R2) or P5CS2 (P5CS2F2 and P5CS2R2). The
expected size of P5CS1 and P5CS2 PCR ampliWed products was 167 and 219 bp, respectively.
Phylogenetic analyses of P5CS gene
The phylogenetic analysis of P5CS genes, sequences of
cDNA and expressed sequence tags (ESTs) of several taxa
were obtained from the NCBI, TIGR (http://www.tigr.org/
tdb/e2kl/osal/) and DOE-JGI (http://genome.jgi-psf.org/
Poptr1/Poptr1.home.html) database using systematic
BLAST. The list of identiWed taxa with deposited P5CS
33
123
90
sequences and their accession number are displayed in
Table 1. A sequence from the human P5CS gene was used
as an outgroup for phylogenetic analysis with full sequence
and a sequence from the algae Ostreococcus lucimarinus
was used in trees constructed with ESTs and partial
sequences.
Nucleotide sequences were aligned using the Alignment
Explorer/CLUSTALW Molecular Evolutionary Genetics
Analysis (MEGA) version 4.0 (Tamura et al. 2007) and
optimized by hand, according to the respective amino acid
alignments. Phylogenetic analyses were performed using
the neighbor-joining (NJ) method by MEGA. The NJ
method was performed for P5CS full-length nucleotide
sequence and P5CS EST nucleotide sequence corresponding to 393 bp of the GK domain cloned in each of the four
Neotropical species. The molecular distances of the aligned
sequences were calculated according to the p-distance
parameter. All gap and missing data in the alignments were
accounted for by pairwise deletion. Branch points were
tested for signiWcance by bootstrapping with 1,000 replications.
Both maximum-parsimony and maximum-likelihood
analysis were carried out with P5CS EST nucleotide
sequence including the partial sequence cloned in this
study. The analyses were implemented in the PAUP* 4.0
software package (SwoVord 2002). Maximum-parsimony
trees were obtained by 100 random addition heuristic
search replicates and the tree bisection–reconnection (TBR)
branch-swapping option. Maximum-likelihood analysis
was evaluated using bootstrap analysis with 100 repeats of
bootstrap samplings. The model parameter was determined
by Modeltest 3.7 (Posada and Crandall 1998).
Synonymous and non-synonymous substitutions
Pairwise synonymous (Ks) and non-synonymous (Ka) numbers of substitutions corrected for multiple hits were calculated using the DnaSP (DNA polymorphism analysis)
software (Rozas et al. 2003). The Ka/Ks rate was calculated
using sequences from plant species where full-length P5CS
sequences were available, comparing both P5CS genes present in dicots with the duplicated genes from monocots. More
reWned analyses were made using all sequences listed in
Table 1. A sliding window of 393 sites was used to compute
the rate along three sites with a step size of the one site.
Results
Genetic structure and cloning of P5CS
The sequences of P5CS encoding genes for model species
such as Arabidopsis (Strizhov et al. 1997), rice (Hien et al.
123
Mol Genet Genomics (2009) 281:87–97
2003; Choudhary et al. 2005) and poplar (Dluzniewska
et al. 2007) were compared to partial sequences from other
plants listed in Table 1. At present, data concerning the
structural organization of Arabidopsis, poplar and rice
P5CS genes were not assembled and compared to P5CS
from other plants. The identiWcation and analyses of the
genomic structure of P5CS genes in Arabidopsis, rice and
poplar were performed using gene structure prediction programs and by comparison with available ESTs clones. The
structural organization of exons and introns of one of two
closely-related Arabidopsis P5CS genes are shown in
Fig. 1a. The P5CS gene in plants is composed of 20 exons
and 19 introns. The main diVerence observed in the duplicated copies of P5CS genes present in the genomes of Arabidopsis and rice concerns the sizes of their introns
(Fig. 2a).
The amino acid alignment of arabidopsis, rice and poplar
P5CS sequences allowed the identiWcation of a conserved
region and the design of degenerate primers for PCR ampliWcation (Fig. 1b). These primers were used to amplify by
PCR the P5CS genes from genomic DNA of four Neotropical tree species: S. parahyba, C. odorata, C. pentandra and
B. quinata. The ampliWed region overlaps majority of the
Wfth and sixth P5CS exons and the totality of the sixth
intron (Fig. 1a). Two distinct fragments were ampliWed
from DNA samples of S. parahyba (Fig. 2b) and C. pentandra (data not shown), suggesting the presence of two copies
of P5CS gene in their genomes. All PCR products were
cloned into plasmid vectors and submitted to restriction and
sequence analyses. PCR ampliWcation products of each species encode the expected partial regions of the P5CS
enzyme (Figs. 1a, c, 2a). S. parahyba insert presented
sequences with 1,116 and 971 bp, while C. pentandra
clones harbor fragments with 1,056 and 890 bp. The singlePCR ampliWed product from C. odorata and B. quinata
DNA has sequence with 899 and 894 bp, respectively
(Figs. 1c, 2a). These partial P5CS sequences were named
BquinP5CS (B. quinata), CodoP5CS (C. odorata),
CpenP5CS1 and CpenP5CS2 (C. pentandra), SparP5CS1,
SparP5CS2 (S. parahyba), and deposited in GenBank with
accession numbers from EU292676 to EU292681, respectively (Table 1).
The cloned region of P5CS covers 269 and 124 bp of
exons 5 and 6. This number of nucleotides is conserved in
all six cloned sequences (Fig. 2a) and also in other plant
sequences found in data banks. As observed in the genomic
organization of arabidopsis P5CS genes, all diVerences in
the size correspond to variations in the number of nucleotides in the introns (Fig. 2a). The alignment of amino acid
sequences of the cloned fragment of P5CS from Neotropical trees species showed a high degree of identity with
P5CS sequences from other plants (Fig. 1c). The amino
acid sequences showed high identity with P5CS from
34
Mol Genet Genomics (2009) 281:87–97
91
Table 1 List of species used in the study and their P5CS gene accession numbers
Organism name
Order
Family
Acronym
Accession number
nt (bp)
Asparagus oYcinalis
Asparagales
Centaurea maculosa
Asterales
Asparagaceae
AoV P5CS
CV289339
393
Asteraceae
Cmac P5CS1
EH714052
Chicorium intybus
Helianthus exilis
393
Cmac P5CS2
EH716682
321
Cint P5CS1
EH678565
321
Hexi P5CS1
EE647005
393
Hexi P5CS2
EE632762
393
Hann P5CS1
DY912669
321
Hann P5CS2
CX946653
Htub P5CS1
EL442123
306
Htub P5CS2
EL454563
321
Helianthus petiolares
Hpet P5CS1
DY932969
333
Lactuca sativa
Lsat P5CS2
DW134129
393
Lactuca serriola
Lser P5CS1
DW109915
293
Atha P5CS1
At2g39800
2,154
Helianthus annus
Helianthus tuberosus
Arabidopsis thaliana
Brassicales
Brassicaceae
Atha P5CS2
At3g55610
2,181
Bnap P5CS1
AF314811
2,154
Bnap P5CS2
AF314812
2,181
Brassica rapa
Brap P5CS1
DN961318
369
Chorispora bungeana
Cbun P5CS
AY804246
2,181
393
Brassica napus
Mesembryanthemum crystallinum
Caryophylales
Aizoaceae
Mcry P5CS
AF067967
Oluc ProB
XM001419476
Fabales
Fabaceae
Gmax P5CS
AY492005
Ostreococcus lucimarinus
Glycine Max
447
2,148
Medicago sativa
Msat P5CS1
X98421
2,148
Medicago truncatula
Mtru P5CS1
AJ278818
2,148
Mtru P5CS2
BG455048
393
Spar P5CS1
EU292680
393
Schizolobium parahyba
Vignia unguiculata
Populus trichocarpa
Ceiba pentandra
Malpighiales
Malvales
Salicaceae
Malvaceae
Bombacopsis quinata
Spar P5CS2
EU292681
393
Vung P5CS2
AB056452
2,154
Ptri P5CS1
LG_X0783
2,160
Ptri P5CS2
gw1.VIII.2487.1
2,142
Cpen P5CS1
EU292678
393
Cpen P5CS2
EU292679
393
393
Bqui P5CS2
EU292676
Pinus taeda
Pinales
Pinaceae
Ptae P5CS
DT632653.1
393
Hordeum vulgare
Poales
Poaceae
Hvul P5CS2
BG368096
393
Oryza sativa
Osat P5CS1
Os01g62900
2,151
Osat P5CS2
SoV P5CS2
Os05g38150
2,151
CA209500 (4)
393
Sorghum bicolor
Sbic P5CS
TA26070_4558
387
Triticum aestivum
Taes P5CS1
TA52986_4565
2,151
Taes P5CS2
TA56146_4565
393
Zmay P5CS
EC884238 (5)
393
2,220
Zea mays
Homo sapiens
Primata
Hominoidea
Hsap P5CS
NM_002860.3
Cedrela odorata
Sapindales
Meliaceae
Codo P5CS
EU292677
393
Citrus clementina
Sapindales
Rutaceae
Ccle P5CS
DY292163
387
Solanum tuberosum
Solanales
Solanaceae
Stub P5CS
CV499774
393
Slyc P5CS
SLU60267
2,154
Vvin P5CS
VVI5686
2,178
Solanum lycopersicum
Vitis vinífera
Vitales
Vitaceae
The acronyms in bold correspond to those species for which partial P5CS sequences were cloned in this study
35
123
92
Mol Genet Genomics (2009) 281:87–97
Fig. 2 a Comparison of the partial structure of P5CS1 and
P5CS2 genes of Arabidopsis
thaliana, Oryza sativa, Populus
trichocarpa, Schizolobium parahyba, Ceiba pentandra, Bombacopsis quinata and Cedrela
odorata (exons 5 and 6, intron
6). Boxes indicate exons and the
solid bold line indicate introns,
with numbers corresponding to
nucleotides. The dotted line indicates the region cloned and used
for phylogenetic analysis. b
Agarose gel showing the two
PCR ampliWcation products of S.
parahyba P5CS and their
respective clones. c Distribution
of -glutamyl kinase (GK) and
-glutamyl phosphate reductase
(GPR) domains present in
plants, animals and the two
orthologous enzymes present in
algae
arabidopsis (75–77%) and rice (82–88%). In bacteria, fungi
and algae, as compared to plant and animal P5CS genes,
GK and GPR domains are separated and correspond to
proB and proA genes respectively (Fig. 2c). A reduced but
signiWcant identity, in the range of 37 to 40%, was found
among the cloned regions of plant P5CS and the proB gene
from the green algae Ostreococcus licimarinus.
A series of two new primer-pairs were designed to
hybridize inside the sequenced P5CS genomic fragments
and bordering the deduced splicing sites. The detection of
speciWc P5CS1 and P5CS2 PCR ampliWcation products
with 167 and 219 bp, from cDNA samples obtained from
leaves and cambium, indicate that both P5CS genes from S.
parahyba are actively transcribed in these tissues (Fig. 3).
The identity of each PCR was also conWrmed by direct
sequencing of the PCR product.
Phylogeny of plant P5CS genes
Two distinct phylogenetic analyses were undertaken to
reconstruct the evolutionary history of P5CS genes in
plants. In the Wrst analysis, a phylogenetic tree was con-
123
Fig. 3 Expression of P5CS1 and P5CS2 mRNAs in Schizolobium
parahyba. AmpliWcation products obtained after PCR ampliWcation
using speciWc primer-pairs to P5CS1 and P5CS2 on cDNAs from
young leaves and cambium. DNA marker sizes (in base pairs) are indicated at the left side of both 2% agarose gels
structed using the NJ method with a set of 16 plant
sequences harboring the full-length coding sequences of
P5CS present in public data banks (Fig. 4). Phylogenetic
trees were rooted using human P5CS as an outgroup.
Vertebrate and invertebrate P5CS share the same organiza-
36
Mol Genet Genomics (2009) 281:87–97
Fig. 4 Phylogenetic tree obtained from full-length cDNA sequences
of P5CS. The tree was produced using the neighbor-joining method, pdistance and pairwise deletion analysis on a Clustal-W multialignment.
Percentages refer to signiWcant bootstrap values of 1,000 calculated
trees. The black and white circles indicate dicot and monocot clusters,
respectively
tion as plant P5CS, where a single-gene/polypeptide
harbors two independent but sequential catalytic domains
(Fig. 2c).
93
A second analysis, using sequences encompassing exons
5 and 6 of P5CS, allowed the comparison of a greater number of plant sequences: two families from monocots (six
species), 10 families from dicots (38 species) and one species from gymnosperms (Fig. 5a, b). Three diVerent analytical methods, namely, NJ, parsimony and maximumlikelihood analysis were compared (Fig. 5a, b). Phylogenetic trees were rooted by using proB (-glutamyl kinase)
sequence of the green algae O. lucimarinus (Chorophyta).
The phylogenetic trees constructed with the full-length
cDNA sequences were based on 2,418 unambiguously
aligned positions while phylogenetic trees of partial
sequences were based on 459 sites, 273 of which were
informative under the parsimony criterion. The number of
variable and conserved sites were 1,646 and 553 for fulllength sequence phylogenetic tree, and 303 and 90 for the
partial sequence tree, with an average content of T (27.6), C
(18.8), A (28.3) and G (25.3) with a transition to transversion rate equal to 0.9.
Both trees, constructed with complete cDNA or partial
sequences, showed the same phylogenetic proWle. The
P5CS sequences of monocots were clustered separately
Fig. 5 Phylogenetic tree obtained from P5CS EST sequences from diVerent plant species.
Phylogenetic analysis was performed on the alignment of 44
sequences. Percentages refer to
signiWcant bootstrap values of
1,000 calculated trees. a Tree
was produced using the neighbor-joining method, p-distance
and pairwise deletion analysis
on a Clustal-W multialignment.
b Phylogenetic trees produced
after a maximum-parsimony
(MP) or maximum-likelihood
(ML) analysis using PAUP*4.0
software. The tree constructed
with MP and ML showed the
same topology. Bootstrap values
for MP are given above and for
ML below branch lines. Organisms indicated by arrows correspond to sequences cloned in
this study. The trees were rooted
with the sequence of the green
algae Ostreococcus lucimarinus
37
123
94
Mol Genet Genomics (2009) 281:87–97
from the dicots, regardless of the phylogenetic method used
(Figs. 4, 5a, b). Two separate clusters were obtained for
Poales species in Monocots. One cluster contained all the
P5CS1 sequences while the second cluster contained all the
P5CS2 sequences of Poales. This pattern was not observed
for the P5CS duplication in taxonomic orders of dicots. In
fact, P5CS1 and P5CS2 formed independent clusters in all
orders, but in some cases they are grouped, as in Brassicales, and in others, such as Fabales, they are genetically
distant.
Evolution in P5CS genes
Measures of selective pressure on P5CS1 and P5CS2 were
made after comparisons of nonsynonymous to synonymous
substitution ratios (Ka/Ks) between monocots and dicots
using the full-length cDNA sequence or the 393 bp of the
GK domain. The pairwise comparisons of P5CS1 and
P5CS2 genes of monocots and dicots produced an average
Ka/Ks ratio of 0.07 within the full-length cDNA sequence
and of 0.106 within the last 393 bp of the GK domain
(Fig. 5a, b). We also calculated Ka/Ks ratios for P5CS1 and
P5CS2 genes between monocots (M1 and M2) and dicots
(D1 and D2) groups and within each group. The average
Ka/Ks was 0.109 for D1£M1, 0.114 for D2£M2, 0.237 for
M1£M2 and 0.098 for D1£D2 comparisons. Nevertheless,
high peaks of Ka/Ks rates were observed along the
sequences, with maximum values of 34.02, 4.93, 21.5 and
7.45 in the D1£M1, D2£M2, M1£M2 and D1£D2 comparisons, respectively (Fig. 6b, c).
Discussion
In plants, key enzymes of metabolic pathways are generally
encoded by redundant genes, which may be generated by
gene duplication events during the evolutionary history of
the organisms. In principle, gene duplication produces two
functionally identical copies that act in a totally redundant
way immediately following the duplication event. Afterward, gene duplications are often followed by sequence
alterations causing changes in transcriptional regulation
and contributing to evolution of functional divergence
(Briggs et al. 2006). The rate-limiting step in proline synthesis is controlled by a bifunctional P5CS enzyme, which
is encoded by two highly homologous genes in Arabidopsis
and many other plants (Strizhov et al. 1997; Yoshiba et al.
1997; Fujita et al. 1998; Ginzberg et al. 1998).
To trace back plant P5CS encoding gene history, we
have analyzed the P5CS nucleotide and amino acids
sequences from diVerent plant species and constructed phylogenetic trees. Our results suggest that independent duplication events have occurred throughout evolutionary
123
Fig. 6 Estimation of Ka/Ks rates on P5CS sequences. a Substitution
rates between full-length sequences of monocots (M12) and dicots
(D12). The region corresponding to the partial sequences of cloned
P5CS from Neotropical trees is indicated. b Simultaneous comparison
of both copies of P5CS from mono and dicots (M12£D12) and independent comparison of P5CS1 (M1£D1) and P5CS2 (M2£D2) sequences from the partial sequences of exons 5 and 6. c Independent
comparison among monocot duplicated genes (M1£M2) and among
dicots (D1£D2)
history. The A. thaliana P5CS1 presents 86% amino acid
identity with the protein sequence codiWed by A. thaliana
P5CS2 gene, 96% with Brassica napus and 93% with P5CS
from Corispora bungeana. The topologies observed in
interspeciWc phylogenetic trees clearly show the existence
of two groups, separating P5CS genes of monocots from
38
Mol Genet Genomics (2009) 281:87–97
dicots. In addition, P5CS sequences corresponding to members of the order Brassicales formed a single-cluster inside
the dicot group, with two internal branches independently
harboring representatives of P5CS1 or P5CS2. This result
shows that this duplication event occurred after divergence
of monocots and dicots lineages, but has also occurred later
in the Brassicales.
The two P5CS genes found in S. parahyba, grouped with
their correlated genes from other species of the Fabales.
However, in Fabales P5CS1 and P5CS2 did not form a single-cluster, as observed for Brassicales. In Asterales it is
found in the same clustering proWle as in Fabales, indicating that at least for the Asterales, Fabales and evolutionarily related orders, the duplication of P5CS gene occurred
early and was already present in the common ancestor that
originated these orders (Fig. 7).
Among monocots, it is clear that all P5CS1 clustered
together and form a separate group from P5CS2.
OsaP5CS1, for example, has higher identity with Triticum
aestivum and Zea mays (86 and 84%, respectively) than
with its rice paralog, OsatP5CS2 (77%). The phylogenetic
trees undoubtedly show the separation of the two copies of
the P5CS gene in diVerent clusters inside the Poales order.
Therefore, duplication events occurred after monocot and
dicot divergence, and seem to have occurred several times
throughout evolution. These events have occurred at diVerent frequencies in Xowering plants since the divergence of
monocots and dicots.
To understand enzyme evolution, it is crucial to take into
account two major mechanisms namely, duplication and
fusion, occurring at the gene level. In the evolutionary his-
Fig. 7 Partial representation of the angiosperm phylogenetic tree with
all taxonomic orders of plant used in this study (adapted from the
Angiosperm Phylogenetic Group, AGP)
95
tory of P5CS genes both mechanisms seem to have played
an important role in the establishment of the current protein
architecture. Comparing the domains GK and GPR in
diVerent species with E. coli, the proA and proB genes
showed higher variation in GK than in the GPR domain.
The amino-terminal domain of the P5CS protein of V.
aconitifolia for example, showed 33.3% identity and 55.3%
overall similarity to the E. coli proB protein while a domain
with 35.7% identity and 57.9% similarity to the proA protein is located at the carboxyl end. An unexpectedly high
level (42.4%) of sequence similarity was found between the
E. coli proB and proA proteins, suggesting that they may
have arisen by duplication of single common ancestral
gene. The encoded proteins may have later acquired structural features conferring the respective kinase and reductase
activities of the present-day enzymes. It has been proposed
that the corresponding plant genes may have fused and
originated the bifunctional enzyme present in plant
genomes (Hu et al. 1992). A similar event of domain fusion
must have occurred in animal systems since P5CS activity
has been detected in mammalian cells and a single-gene
encodes both functional enzymatic activities. Existence of
two catalytic domains in the plant P5CS enzyme may facilitate sequential reactions in formation of -glutamyl phosphate, which is unstable, and its rapid conversion into GSA.
In prokaryotes, as in E. coli, both GK and GPR are organized as hexameric enzymes (Hu et al. 1992).
It has been shown that transcriptional control of the
P5CS gene is important for the regulation of accumulation
of proline during osmotic stress in plants. Previous studies
demonstrated signiWcant diVerences in transcriptional control of P5CS genes in arabidopsis (Szekely et al. 2008).
Transcription of the P5CS1 gene is inducible by salt,
drought, glucose and sucrose treatments in an abscisic acid
(ABA) and light-dependent fashion (Strizhov et al. 1997;
Abraham et al. 2003). Steady-state P5CS1 transcript levels
are higher in most plant organs when compared to those of
P5CS2. The latter appears to be preferentially expressed in
dividing cells and in response to incompatible pathogenic
interactions (Strizhov et al. 1997; Fabro et al. 2004). The
analysis of arabidopsis P5CS1 and P5CS2 T-DNA insertion
mutants allowed the characterization of functional diversiWcation of duplicated P5CS genes in the developmental and
stress-dependent control of proline biosynthesis. Knockout
mutations of P5CS1 resulted in the reduction of stressinduced proline synthesis, hypersensitivity to salt stress,
and accumulation of reactive oxygen species. On the other
hand, P5CS2 knockout produced embryo abortion. The
diversiWcation of P5CS functions in arabidopsis reXects
diVerences not only at the level of transcriptional regulation
but also in cell-type-speciWc and subcellular localization of
P5CS enzymes. Cellular localization studies with P5CSGFP gene fusions indicate that P5CS1 is sequestered into
39
123
96
subcellular bodies in embryonic cells, while P5CS2
remains in the cytosol. In addition, although proline feeding
rescues the viability of mutant embryos, P5CS2 mutant
seedlings grown in the presence of proline were not able to
develop normally and fail to produce fertile plants. Promoter analysis in seedlings demonstrated that a speciWc
expression of P5CS2-GFP occurs in leaf primordia where
P5CS1-GFP levels are very low. P5CS2-GFP shows a distinct cell-type-speciWc and subcellular localization pattern
when compared to P5CS1-GFP in root tips, leaves and
Xower organs. These data demonstrate that at least in Arabidopsis P5CS enzymes perform non-redundant functions
(Szekely et al. 2008). Duplicate P5CS genes with diVerences in transcriptional regulation are also present in other
plant species such as alfalfa, tomato and cactus (Fujita et al.
1998; Ginzberg et al. 1998; Farzaneh et al. 2005; Silva-Ortega et al. 2008).
It was demonstrated that juvenile plants of S. parahyba,
subjected to two cycles of water stress in greenhouse conditions, have an increase in total soluble sugars, K+, amino
acids and proline in the leaf tissues (Carvalho 2005). S.
parahyba had a constitutive expression of both P5CS genes
in the absence of stress (Fig. 3), suggesting that this gene
may be related to the adaptation and plasticity to the diVerent environmental conditions this tree is confronted with
across its wide distribution range from Mexico to Southern
regions of the Atlantic Forest.
The nucleotide substitutions that occur during molecular
evolution may be synonymous, which do not change the
amino acid residue or non-synonymous, which result in
amino acid replacement. Most non-synonymous substitutions are typically eliminated by purifying selection, which
leads to a predominance of synonymous substitutions.
When positive Darwinian selection occurs, non-synonymous substitutions become more frequent. Thus, the relative rates of synonymous and non-synonymous
substitutions are good indicators of the amount and type of
selection aVecting a gene (Sharp 1997). Given Ks, the number of synonymous nucleotide substitutions per synonymous site, and Ka, the number of non-synonymous
nucleotide substitutions per non-synonymous site, then the
ratio Ka/Ks can be used to quantify the degree of divergence
between species and to estimate the type of selection
exerted on a given gene or DNA fragment. All comparisons
of duplicated P5CS genes among the diVerent species of
monocots and dicots showed that positive selection has
taken place at multiple locations. Duplications and positive
selection could be associated with exposure of ancestral
plants to more stressful habitat conditions, with the requirement of an extra copy of P5CS to fulWll the physiological
roles of the enzyme and better regulate the proline metabolism. A more detailed approach using site directed mutagenesis on P5CS associated with phenotype analysis of
123
Mol Genet Genomics (2009) 281:87–97
mutants will be required to evaluate the extent of positive
selection and to understand how selective pressure aVects
diVerent copies of duplicated P5CS genes within species
and among taxonomically divergent groups, and to try to
determine why these duplication events occurred.
Acknowledgments Authors would like to thank Dr. S. Cavers for
the critical reading of the manuscript and suggestions. This work was
partially supported by a CNPq Grant (474993/2006-0) and the SEEDSOURCE project, funded by the European Commission under the
Sixth Framework Programme (Contract number 003708) and coordinated by S. Cavers at the NERC Centre for Ecology and Hydrology,
UK. Samples were provided by C. Navarro, P. Rymer, R. Griebel and
S. Cavers. M. Margis-Pinheiro and R. Margis were supported by grants
from Conselho Nacional de Desenvolvimento CientíWco e Tecnológico, CNPq, Brazil (308708/2006-7 and 302684/2005-0). A. Zolet received a Ph.D. fellowship from CNPq.
References
Abraham E, Rigo G, Szekely G, Nagy R, Koncz C, Szabados L (2003)
Light-dependent induction of proline biosynthesis by abscisic
acid and salt stress is inhibited by brassinosteroid in Arabidopsis.
Plant Mol Biol 51:363–372
Briggs GC, Osmont KS, Shindo C, Sibout R, Hardtke CS (2006) Unequal genetic redundancies in Arabidopsis: a neglected phenomenon? Trends Plant Sci 11:492–498
Carvalho CJR (2005) Responses of Schizolobium amazonicum [S.
parahyba var. Amazonicum] and Schizolobium parahyba
[Schizolobium parahybum] plants to water stress. Arvore 29:907–
914
Choudhary NL, Sairam RK, Tyagi A (2005) Expression of delta(1)pyrroline-5-carboxylate synthetase gene during drought in rice
(Oryza sativa L.). Indian J Biochem Biophys 42:366–370
Csonka LN (1981) Proline over-production results in enhanced osmotolerance in Salmonella typhimurium. Mol Gen Genet 182:82–86
Delauney AJ, Verma DPS (1993) Proline biosynthesis and osmoregulation in plants. Plant J 4:215–223
Dluzniewska P, Gessler A, Dietrich H, Schnitzler JP, Teuber M, Rennenberg H (2007) Nitrogen uptake and metabolism in Populus £
canescens as aVected by salinity. New Phytol 173:279–293
Doyle JJ, Doyle JL (1990) Isolation of plant DNA from fresh tissue.
Focus 12:3
Fabro G, Kovacs I, Pavet V, Szabados L, Alvarez ME (2004) Proline
accumulation and AtP5CS2 gene activation are induced by plantpathogen incompatible interactions in Arabidopsis. Mol Plant Microbe Interact 17:343–350
Farzaneh M, Jazi FR, Motamed N (2005) Application of dotblotting
for detecting the expression of p5cs gene in transgenic olive plantlets. Febs J 272:547
Fujita T, Maggio A, Garcia-Rios M, Bressan RA, Csonka LN (1998)
Comparative analysis of the regulation of expression and structures of two evolutionarily divergent genes for Delta(1)-pyrroline-5-carboxylate synthetase from tomato. Plant Physiol
118:661–674
Ginzberg I, Stein H, Kapulnik Y, Szabados L, Strizhov N, Schell J,
Koncz C, Zilberstein A (1998) Isolation and characterization of
two diVerent cDNAs of Delta(1)-pyrroline-5-carboxylate synthase in alfalfa, transcriptionally induced upon salt stress. Plant
Mol Biol 38:755–764
Goring H, Thien BH (1979) InXuence of nutrient deWciency on proline
accumulation in the cytoplasm of Zea mays seedlings. Biochem
Physiol PXanz 174:9–16
40
Mol Genet Genomics (2009) 281:87–97
Gruszka Vendruscolo EC, Schuster I, Pileggi M, Scapim CA, Correa
Molinari HB, Marur CJ, Esteves Vieira LG (2007) Stress-induced
synthesis of proline confers tolerance to water deWcit in transgenic
wheat. J Plant Physiol 164:1367–1376
Hien DT, Jacobs M, Angenon G, Hermans C, Thu TT, Van Son L,
Roosens NH (2003) Proline accumulation and Delta(1)-pyrroline5-carboxylate synthetase gene properties in three rice cultivars
diVering in salinity and drought tolerance. Plant Sci 165:1059–
1068
Hong ZL, Lakkineni K, Zhang ZM, Verma DPS (2000) Removal of
feedback inhibition of delta(1)-pyrroline-5-carboxylate synthetase results in increased proline accumulation and protection of
plants from osmotic stress. Plant Physiol 12:1129–1136
Hu CAA, Delauney AJ, Verma DPS (1992) A bifunctional enzyme
(delta-1-pyrroline-5-carboxylate synthetase) catalyzes the Wrst
two steps in proline biosynthesis in plants. Proc Natl Acad Sci
USA 89:9354–9358
Hur J, Jung KH, Lee CH, An GH (2004) Stress-inducible OsP5CS2
gene is essential for salt and cold tolerance in rice. Plant Sci
167:417–426
Igarashi Y, Yoshiba Y, Sanada Y, Yamaguchi-Shinozaki K, Wada K,
Shinozaki K (1997) Characterization of the gene for delta-1-pyrroline-5-carboxylate synthetase and correlation between the
expression of the gene and salt tolerance in Oryza sativa L. Plant
Mol Biol 33:857–865
Kishor PBK, Hong ZL, Miao GH, Hu CAA, Verma DPS (1995) Overexpression of delta-pyrroline-5-carboxylate synthetase increases
proline production and confers osmotolerance in transgenic
plants. Plant Physiol 108:1387–1394
Mahan MJ, Csonka LN (1983) Genetic analysis of the proba genes of
Salmonella typhimurium—physical and genetic analyses of the
cloned proba genes of Escherichia coli and of a mutant allele that
confers proline overproduction and enhanced osmotolerance. J
Bacteriol 156:1249–1262
Orser CS, Goodner BW, Johnston M, Gelvin SB, Csonka LN (1988) The
Escherichia coli prob gene corrects the proline auxotrophy of Saccharomyces cerevisiae pro1 mutants. Mol Gen Genet 212:124–128
Parvanova D, Ivanov S, Konstantinova T, Karanov E, Atanassov A,
Tsvetkov T, Alexieva V, Djilianov D (2004) Transgenic tobacco
plants accumulating osmolytes show reduced oxidative damage
under freezing stress. Plant Physiol Biochem 42:57–63
Posada D, Crandall KA (1998) MODELTEST: testing the model of
DNA substitution. Bioinformatics 14:817–818
97
Rozas J, Sanchez-DelBarrio JC, Messeguer X, Rozas R (2003) DnaSP,
DNA polymorphism analyses by the coalescent and other methods. Bioinformatics 19:2496–2497
Savoure A, Jaoua S, Hua XJ, Ardiles W, Vanmontagu M, Verbruggen
N (1995) Isolation, characterization, and chromosomal location
of a gene encoding the delta-1-pyrroline-5-carboxylate synthetase
in Arabidopsis thaliana. FEBS Lett 372:13–19
Sharp PM (1997) In search of molecular darwinism. Nature 385:111–
112
Silva-Ortega CO, Ochoa-Alfaro AE, Reyes-Aguero JA, Aguado-Santacruz GA, Jimenez-Bremont JF (2008) Salt stress increases the
expression of p5cs gene and induces proline accumulation in cactus pear. Plant Physiol Biochem 46:82–92
Strizhov N, Abraham E, Okresz L, Blickling S, Zilberstein A, Schell J,
Koncz C, Szabados L (1997) DiVerential expression of two P5CS
genes controlling proline accumulation during salt–stress requires
ABA and is regulated by ABA1, ABI1 and AXR2 in Arabidopsis.
Plant J 12:557–569
Su J, Wu R (2004) Stress-inducible synthesis of proline in transgenic
rice confers faster growth under stress conditions than that with
constitutive synthesis. Plant Sci 166:941–948
SwoVord DL (2002) PAUP* phylogenetic analysis using parsimony.
In. Sinauer Associates, Sunderland
Szekely G, Abraham E, Cselo A, Rigo G, Zsigmond L, Csiszar J, Ayaydin F, Strizhov N, Jasik J, Schmelzer E, Koncz C, Szabados L
(2008) Duplicated P5CS genes of Arabidopsis play distinct roles
in stress regulation and developmental control of proline biosynthesis. Plant J 53:11–28
Tamura K, Dudley J, Nei M, Kumar S (2007) MEGA4: molecular evolutionary genetics analysis (MEGA) software version 4.0. Mol
Biol Evol 24:1596–1599
Verdoy D, De la Pena TC, Redondo FJ, Lucas MM, Pueyo JJ (2006)
Transgenic Medicago truncatula plants that accumulate proline
display nitrogen-Wxing activity with enhanced tolerance to osmotic stress. Plant Cell Environ 29:1913–1923
Yoshiba Y, Kiyosue T, Nakashima K, Yamaguchi Shinozaki K, Shinozaki K (1997) Regulation of levels of proline as an osmolyte in
plants under water stress. Plant Cell Physiol 38:1095–1102
Zhang CS, Lu Q, Verma DPS (1995) Removal of feedback inhibition
of delta(1)-pyrroline-5-carboxylate synthetase: a bifunctional enzyme catalyzing the Wrst 2 steps of proline biosynthesis in plants.
J Biol Chem 270:20491–20496
41
123
CAPÍTULO III: Molecular systematics and evolutionary history of
Neotropical tree Schizolobium (Fabaceae-Caesalpinioideae) inferred from
nuclear and chloroplast DNA sequences.
Andreia Carina Turchetto-Zoleta,b; Fernanda Cruzb, Marcelo F. Simond, Fabiano
Salgueiroe, Marcia Margis-Pinheiroa and Rogerio Margisa,b,c
a
Programa de Pós-Graduação em Genética e Biologia Molecular, Departamento de
Genética, Universidade Federal do Rio Grande do Sul.
b
Centro de Biotecnologia, Universidade Federal do Rio Grande do Sul.
c
Departamento de Bioquimica, Universidade Federal do Rio Grande do Sul
d
Department of Plant Sciences, University of Oxford, Oxford
e
Departamento de Genética, Instituto de Biologia, Universidade Federal Rural do Rio de
Janeiro.
Manuscrito submetido a Molecular Phylogenetics and Evolution
42
ABSTRACT
The Amazon and Atlantic forests are the major and more biodiverse rain
forests of South America. Schizolobium (Caesalpinioideae) is a widespread genus found
in these forests and is a fast growing tree, extensively used in reforestation that employs
native trees. Based on morphological data is comprised of a single species:
Schizolobium parahyba (Vell.) Blake, with two varieties of disjunct distribution. This
study represents the first attempt to reconstruct the phylogenetic relationships within the
Schizolobium and provides information about the evolutionary process between these
forests. Our study is based on DNA sequence data from nuclear and plastid regions that
were generated for 165 individuals representing the two varieties. The Maximum
Parsimony and Bayesian analyses revealed the monophyletic nature of Schizolobium
and the Schizolobium crown node was estimated to have arisen 15.6 million years ago.
The two varieties showed high genetic differentiation, however a high genetic
divergence was observed in the central portion of the Atlantic Forest biome, relative to
southern areas, indicating an important area of endemism influenced by the Amazonian
region. The results described here provide additional genetic information concerning the
Neotropical forest species and will aid in setting conservation priorities in these regions.
Keywords: Schizolobium, molecular dating, cpDNA and nuclear marker, Neotropical
forest, conservation genetic
43
1. Introduction
The Neotropics are one of the world’s most species-rich regions,
containing an estimated 90,000 plant species, more than any other continental area.
However, these regions are notoriously endangered and understudied (Thomas, 1999).
Because of their large biodiversity, these ecosystems are ideal targets for research into
the origin of biological diversity (Pennington et al., 2004). Some Neotropical areas are
under manifest danger of biodiversity loss, and have thus been identified as biodiversity
hotspots that are the focus of special conservation programs (Myers, 2003; Myers et al.,
2000).
The Amazon and Atlantic forests are the major rain forests of South
America, and together they encompass the most diverse tropical forests in the world.
Between these two forests lies a corridor containing seasonal and open vegetation. This
region, which is considered to be an important restraint to species migration between
the two rain forest regions, includes the Cerrado in central Brazil, the Caatinga in north
eastern Brazil, and the Chaco in Argentina and Paraguay (Prado and Gibbs, 1993).
Despite their abundance, there are little data about genetic diversity, gene flow and
evolution of tropical tree species in these regions of the world. In South America, the
area occupied by tropical rainforest is believed to have shrunk between 100,000 and
20,000 years ago, during the Pleistocene, as a consequence of climatic changes. This
has led to hypotheses of recent speciation, the most popular of which is the ‘refuge’
model that involves allopatric differentiation in populations of rainforest species that
became isolated from each another by vegetation adapted to more xeric conditions
during cool–dry periods (Prance, 1982). In general, pollen data suggest that the last
glacial period was cooler and drier than present-day conditions, resulting in an
44
extension of savannah vegetation and a reduction in rain forest size. In addition, studies
indicate past floristic connections between the Amazonian and Atlantic rain forest areas
(Behling, 1998, 2002; Behling et al., 2000; Behling and Lichte, 1997).
Speciation and the differentiation of genealogical lineages are important
considerations in biogeography, as they define the primary units for conservation and
influence the spatial resolution of an evolutionary analysis that can provide a deep
understanding of evolutionary processes. In addition, biodiversity assessments require
that investigators employ stringent and rigorous methods to delimit natural species
(Marshall et al., 2006). The definition of species has been a major impediment for
botanical studies related to speciation. Botanists have often expressed doubt that plant
species even exist, based on the frequent reports of inter-specific hybrids (Arnold,
1997). These concerns were amplified by claims that gene flow within many plant
species is so low that populations, rather than species, are the most inclusive
reproductive units for genetic analysis (Ehrlich and Raven, 1969).
The empirical issue of species delimitation is receiving increased
attention, and several novel methods have been proposed for delimiting species with a
statistically precise framework (Puorto et al., 2001; Templeton, 2001; Wiens and
Servedio, 2000). Non-tree-based methods delimit species on the basis of gene flow
assessments (Sites and Marshall, 2003), while tree-based methods delimit species as
historical lineages (Goldstein and DeSalle, 2000). However, differences in datasets and
methods for delimiting species may produce ambiguous or conflicting results, due to the
action of multiple evolutionary processes operating within and between populations
across varying spatial-temporal scales (Sites and Marshall, 2004).
45
Resolution of correct systematic relationships is essential to evolutionary,
biogeographic and ecological studies. Identification of these relationships enables the
identification of taxonomic units, the evaluation of their divergence patterns, and allows
for comparison of diversity across their ranges. However, the presence of cryptic taxa
has confused many traditional studies, since they may appear morphologically similar
yet be phylogenetically distinct. The use of systematic molecular techniques in studies
of angiosperm evolution has resulted in the production of numerous phylogenies
describing relationships across a range of evolutionary history (Soltis and Soltis, 2000).
These studies are particularly important for filling in the tips of the angiosperm tree of
life (Palmer et al., 2004). Phylogenetic hypotheses of the evolutionary relationships
among members of the same genus provide a framework for comparative research on
mechanisms of diversification and speciation (Barraclough and Nee, 2001). Molecular
systematics is also a valuable technique for improving conservation, as it provides an
objective means of quantifying evolutionary distinctiveness and resolving taxonomic
ambiguities. There is great interest the application of molecular systematics for
identification of lineages that are sufficiently distinct to warrant taxonomic status, and
thus eligible for legal protection (i.e., species, subspecies, and varieties).
Blackwell Science, Ltd
Species are often assumed to have evolved from a common ancestor by a
process of branching followed by complete genetic isolation. Inter-specific
hybridization is one of the major factors that leads to phylogenetic incongruence among
loci. This is especially true for plastid and nuclear genomes with a maternal or biparental mode of transmission (Rieseberg et al., 1991; Rieseberg and Soltis, 1991; Soltis
et al., 1991a; Soltis et al., 1991b). Species may hybridize long after speciation, resulting
in problems for phylogenetic reconstruction, especially when molecular data are used
46
for the analysis (Spence, 1990). The discovery of cytoplasmic introgression and the lack
of concordance between rDNA and cpDNA phylogenies for several plant groups reflect
past hybridization and subsequent introgression (Rieseberg et al., 1996). Therefore, to
avoid erroneous phylogenetic conclusions based on cpDNA data, comparisons with
phylogenetic hypotheses based on nuclear gene sequences, as well as comprehensive
sampling, is required (Rieseberg and Soltis, 1991).
The
traditionally
circumscribed
Caesalpinioideae
subfamily
is
paraphyletic and is comprised of approximately 2,250 species in 171 genera that are
subdivided into four tribes: Caesalpinieae, Cassieae, Cercideae and Detarieae (Bruneau
and Graham, 2008; Lewis et al., 2005). Schizolobium Vogel (Caesalpinieae) is a
member of the Peltophorum group (Haston et al., 2003) and is an ecologically and
economically important forest tree genera. It is largely distributed through the Americas
(Atlantic Forest, Amazonian rainforest and other tropical forests of Central America)
and shows good adaptation to variable climate conditions. Thus, it has great potential
for wood production and other uses. It is one of the fastest growing tree species, which
explains its extensive use in reforestation projects based on native trees. Furthermore, it
has also been widely introduced in the tropics as an ornamental tree.
Until 1996, two species of Schizolobium were recognized. Collections
from the Brazilian Atlantic rain forest were referred to as S. parahyba (Vell.) Blake,
while most collections from equatorial South America and Central America were
classified as S. amazonicum Huber ex. Ducke (Ducke, 1949). Based on morphological
characteristics, Barneby (1996) postulated that the characteristics that classified
Schizolobium into two species had become increasingly homogeneous and could not
justify the existence of two species of Schizolobium. Therefore, Barneby (1996)
47
proposed that the genus Schizolobium should consist of only one species with two
varieties: S. parahyba var. parahyba (pedicels not jointed; anthers 2.3-3.2 mm) and var.
amazonicum (Ducke) Barneby (pedicels jointed 2-6.5 mm above base; anthers (1.2)1.32.3 mm) (Barneby, 1996). Differentiation of this species into two varieties is also
supported by a disjoint distribution. The varietie parahyba is found in Brazil, from
Bahia to Santa Catarina, while the varietie amazonicum is distributed from the Amazon
Basin in Brazil and Bolivia to south-eastern Mexico (Fig. 1A). Some plant species show
a geographically disjointed distribution, with the plants present in two or more remote
geographical areas (Bessega et al., 2006; Ickert-Bond and Wen, 2006; Rossi et al.,
2009; Singliarova et al., 2008). Processes such as ancient tectonic events (continental
drift resulting in intercontinental splits in the species’ range), smaller scale disjunctions
that could be attributed to more recent climate change and long distance dispersal may
lead to the formation of these disjoint distributions (Raven and Axelrod, 1974).
Presently, a restricted number of studies related to Schizolobium have
focused on molecular markers. Microsatellite loci have been isolated (Kamau et al.,
2003), an evolutionary analysis of the enzyme pyrroline-5-carboxylate synthase (P5CS)
has been performed in S. parahyba and other Neotropical trees (Turchetto-Zolet et al.,
2008), an analysis of the genetic structure of Schizolobium parahyba from the state of
Rio de Janeiro (Brazil) using RAPD markers has been conduced (Freire et al., 2007),
and the genetic relationships among ecotypes of Schizolobium parahyba from Ecuador
and others countries were investigated using RAPD, AFLP and SSRs (CanchigniaMartínes et al., 2007).
The taxonomy of the genus Schizolobium has traditionally been based on
morphological data. A molecular phylogenetic analysis of individuals of the two
48
varieties has not yet been performed. A study of the Peltophorum group, based on the
chloroplast trnL, trnL-F, rbcL and rps16 loci, was performed with individual samples of
Schizolobium from both geographical areas (Ecuador, Mexico and Brazil) and revealed
that these populations form a single clade (Haston et al., 2003, 2005).
This study presents the first extensive molecular phylogenetic analysis
within the genus Schizolobium, and includes a widespread sampling of populations of
both varieties of this species from throughout their geographic distribution. The goal of
this study was (i) to investigate the evolution and origin of the genus Schizolobium; (ii)
to verify the existence of two varieties, currently defined by morphological
characteristics and presenting a disjoint geographical distribution; (iii) to estimate the
age of the Schizolobium crown node; and (iv) to provide insights useful for conservation
of Schizolobium. ITS (Internal transcribed spacer) nuclear markers and a set of
chloroplast DNA region (cpDNA) were analyzed to reach these objectives. The
monophyletic nature of the Schizolobium genus, its position within the Peltophorum
clade, and molecular age estimations were also investigated in relation to other genera
of the subfamily Caesalpinioideae.
2. Materials and methods
2.1. Sampling strategy
Samples from individuals of the Schizolobium genus were collected from
fourteen sites, separated by 218 to 6,642 Km (see Table.1 in Supplementary Data,
available online), covering most of the geographical range of both varieties of
Schizolobium (Fig. 1B). The samples were collected as silica gel dried cambium and
49
leaf from natural populations. Voucher specimens were deposited in the herbarium of
the Universidade Federal do Rio Grande do Sul (UFRGS), in the Department of Botany.
In most cases, more than one individual was sampled per population (Table1).
2.2. DNA extraction, amplification and sequencing
Total genomic DNA was isolated using the CTAB method (Doyle and
Doyle, 1987). The 5.8S nrDNA and the flanking ITS1 and ITS2 regions were PCR
amplified using the ITS1 forward primer 5’GGAAGTAAAAGTCGTAACAAGG-3’
and the ITS2 reverse primer 5’TCCTCCTCCGCTTATTGATATGC-3’ (Table1) (White
et al., 1990). To screen for variation in plastid DNA, ten regions were investigated using
universal primer combinations: the psbA-trnH and trnL-trnF spacers, rpoC1 and rpoB
RNA Polymerase beta subunit, accD acetyl-CoA carboxylase beta subunit, ndhj NADH
dehydrogenase j, matK gene, ycf5 cytocrome c biogenesis protein, rbcL-a ribulose
biphosphate carboxylase and trnL intron. These regions were chosen from studies
describing putative markers used for barcoding in plants (Kress and Erickson, 2007;
Newmaster et al., 2006; Shaw et al., 2007; Taberlet et al., 2007). Sequences of matK
primers are based on (Wojciechowski et al., 2004)
All primer sequences used for PCR amplification and sequencing, as well
as the expected sizes of the resulting fragments are described in Table1. All
amplifications were conducted using 10 ng of genomic DNA, 2.5 mM MgCl2, 0.25 mM
dNTP mix, 1x PCR buffer, 0.05 U of Platinum Taq DNA polymerase (Invitrogen) and 5
µM of each primer, in a final volume of 20 µl. The PCR cycle used an initial hot-start
step at 94 °C for 5 min, followed by 40 cycles with denaturation at 94 oC for 50 s, an
annealing temperature of 48ºC (ITS1F-ITS2R, psbA-trnH, trnL-F, trnL intron) or 51ºC
(rpoC1, rpoB, accD, ndhj, ycf5, rbcL-a, matK) for 50 s, and 50 s of elongation at 72 ºC.
50
All PCR products were visualized by electrophoresis on 1.5 % agarose gels stained with
SYBR Gold (Invitrogen) and precipitated using 3 M Sodium Acetate and 95% ethanol.
Nuclear and plastid amplified PCR products were sequenced with the
dideoxy chain-termination method using Big-Dye (Applied Biosystems) on an ABI3100 automatic sequencer (Applied Biosystems). Sequencing was conducted in 10µL
reactions with 2 µL of purified PCR product, 1 µL of primer, 2 µL of buffer 5x, 0.25 µL
of Big-Dye®Terminator and 4.75 µL of milliQ water. The thermocycling program was
as follows: 25 cycles of 10 s at 95 ºC, 5 s at 54 ºC and 4 min at 60 ºC. Both DNA
strands were fully sequenced. Sequencing of approximately 1500 bp of the matK gene
was performed using four additional internal primers: matK4La (forward)
CCTTCGATACTGGGTGAAAGAT
(500
TTCAGTGGTACGGAGTCAAATG
(1100
TTGCATAGAAATGGATTCGCTCAAA
(700
bp);
bp);
bp)
matK1100L
(forward)
matK832R
(reverse)
matK1932Ra
(reverse)
CCAGACCGGCTTACTAATGGG (1200 bp) (Wojciechowski et al., 2004).
2.3. Editing, alignment and phylogenetic analyses
Sequences were individually checked by eye and identities were certified
using the BLASTn algorithm against plant DNA sequences deposited at NCBI
(http://www.ncbi.nlm.nih.gov). Nucleotide sequences were aligned using the Alignment
Explorer/CLUSTALW Molecular Evolutionary Genetics Analysis (MEGA) version 4.0
(Tamura et al., 2007). Sequences of Schizolobium generated in this study were
deposited in GenBank under the accession numbers FJ668603-FJ668631 and
GQ167768-GQ167774. Individuals from the same population with identical sequences
were represented in the subsequent analyses by only one sample.
51
Maximum Parsimony (MP) and Bayesian analyses of the ITS and
cpDNA datasets were performed in order to access the relationships within
Schizolobium. Parsimony analyses were conducted using Nona (Goloboff, 1993),
spawned from Winclada (Nixon, 2001). Tree searches employed 1000 replicates,
holding 10 trees in each search, using the tree bisection and reconnection (TBR)
strategy and branch swapping. Strict consensus bootstrap percentages were computed
with 1000 replicates and 10 tree bisection reconnection, holding 10 trees per replicate.
For the Bayesian analysis, the datasets were analyzed using the BEAST version 1.4.8
(Drummond and Rambaut, 2007) software. Although BEAST was developed primarily
to provide age estimates for a phylogeny, in this case the program also was used only to
provide an estimate of the topology independent from the parsimony analysis, and no
time calibration was used. Therefore, a strict molecular clock was used, with a
substitution rate set to one, in combination with the GTR+I+Γ model of nucleotide
substitution.
Sequences of three closely related taxa belonging to the Peltophorum
group were used as outgroups. For the ITS analysis, unpublished sequences of Colvillea
racemosa LWDS2147, Conzattia multiflora DURJ600 and Heteroflorum sp. CEH1845
were provided by Elspeth Haston. For the combined cpDNA analysis, matK and trnLtrnF sequences of outgroups were downloaded from GenBank: C. racemosa
(EU361916, AY899739), C. multiflora (AY386918, AY899729), and Peltophorum
pterocarpum (EU362023, AY899713). The three other partitions (psbA-trnH, rpoC1,
rpoB) were coded as missing values for the outgroups in the cpDNA analysis, as no
sequences were available in GenBank.
2.4. Dating analysis
52
Divergence time estimation for Schizolobium was based on a higher level
analysis of a recently published large dataset of the Caesalpinoid legumes (Bruneau and
Graham, 2008). Our dataset was constructed using the alignment of 258 matK
sequences from the Bruneau et al. (2008) work and incorporating new sequences for 21
accessions of Schizolobium, comprising a concatenated plastid dataset that included the
matK gene, and also other five plastid regions (psbA-trnH, trnL-trnF, rpoB, rpoC1) that
were added to improve resolution The final aligned matrix contained 279 terminals with
3513 sites.
A molecular dating analysis was performed with the program BEAST,
using the uncorrelated lognormal relaxed clock and a general time reversible model,
with invariable sites and among-site rate heterogeneity (GTR+I+Γ) as the model for
nucleotide substitution (as selected in Bruneau et al. (2008). Calibration points were
provided by a set of legume fossils, as described in Bruneau et al. (2008), with the
alteration that we excluded a few fossils in our analysis. Specifically, fossil P, which
was considered redundant as another calibration point of a deeper node is constrained
with the same minimum and fossils B and S, for which placement was considered
problematic. Therefore, 15 fossils were used to calibrate nodes in our analysis. These
calibration points were provided as minimum constraints (log-normal statistic
distribution prior with mean = 0 and std =1, in BEAST). In addition, a prior with
uniform distribution to the legume stem node was imposed, allowing it to vary between
60 to 70 million years ago (Mya), as employed in previous studies (Bruneau and
Graham, 2008; Lewis et al., 2005). Four independent runs of 10 7 generations each were
performed, sampling every 1000 generations. After the exclusion of 10 6 generations
(burn-in), the results of all runs were combined. Results were determined to have
53
reached stationary state and convergence using Tracer version 1.4 (Drummond and
Rambaut, 2007) and data from multiple runs were combined after exclusion of burn-in
trees, as appropriate. The estimated parameters had sufficient effective sample sizes
(ESS), in most cases well above the minimum of 200 recommended in the BEAST
manual.
3. Results
3.1. Characteristics of cpDNA and ITS sequences
Nuclear and chloroplast DNA regions were successfully amplified from
individuals of the Schizolobium genus (Table 1). Among the ten loci analyzed, six were
polymorphic: ITS, psbA-trnH, trnL-trnF, rpoB, rpoC1 and matK. The chloroplast
regions corresponding to accD, ndhJ, ycf5, rbcL-a and the trnL intron did not show any
variation among the samples analyzed, and were not used in further analysis.
The psbA–trnH intergenic spacer presented considerable nucleotide
polymorphism between individuals of Schizolobium. A micro-inversion, characterized
by a reverse-repeated region of 35 bp flanked by a 14 bp palindromic sequence, was one
conserved polymorphism detected between the two varieties in the psbA–trnH region.
However, individuals from Bahia (BA1 and BA2) populations, which are
morphologically and geographically related to var. parahyba, showed the same microinversion pattern present in the samples of var. amazonicum. The psbA-trnH spacer also
contained duplication and indel events (Fig. 2). The trnL-trnF intergenic spacer, rpoB
and rpoC1 chloroplast genes presented uniform lengths of 448, 473 and 500 bp in all
samples analyzed, respectively. One polymorphic site, which also discriminated the two
54
varieties of Schizolobium (except the samples from Bahia, which grouped with
individuals of var. amazonicum, as found in the psbA-trnH dataset), was found in each
of these regions (Table 1). Similar polymorphisms to those observed for the psbA–trnH
intergenic spacer were identified along the 1500 bp analyzed of the matK gene.
However, they were much more pronounced, with 12 single nucleotide polymorphism
sites (SNPs) among the sampled individuals. In contrast, no indels were found in matK
(Table1). However, the pattern of sequence variation observed in matK did not
distinguish between the two varieties of Schizolobium, as was observed for the other
loci.
The amplification of the ITS region from all samples resulted in a clear
single band when checked on 1.5% agarose gels (data not shown). The complete ITS
region (ITS1+5.8S+ITS2) was 625 bp in length, including 227 bp for ITS1 and 181 bp
for ITS2. There were no insertions or deletions, and within the 625 bp alignment, 12
positions were variable. Ten of these variable positions were related to the
differentiation between the two varieties.
3.2. Phylogenetic and molecular dating analyses
The aligned ITS matrix contains 30 sequences, 27 from Schizolobium and
3 outgroups (species from Peltophorum group), with 561 sites analyzed and 122
excluded from the analysis because of problems in alignment. Multiple heuristic
searches of 42 parsimony informative nucleotide characters of the ITS region
discovered a single most parsimonious tree of 62 steps (CI = 0.87, RI = 0.94) (Fig. 3).
The tree topology generated from Bayesian inference (not shown) is congruent with the
tree generated by the parsimony analysis. Thus, only the posterior probabilities (PP) are
included on the most parsimonious tree, together with the bootstrap percentages (BP)
55
(Fig. 3). The concatenated plastid dataset (matK, psbA-trnH, trnL-trnF, rpoC1, rpoB)
alignment contains 28 sequences, 25 from Schizolobium and 3 outgroups (species from
Peltophorum group), with 54 parsimony informative characters. Maximum parsimony
analysis of the cpDNA from Schizolobium discovered three most parsimonious trees of
65 steps each (CI = 0.84, RI = 0.96) (Fig. 4). As shown in the ITS analysis, the tree
topology generated by Bayesian inference (not shown) was congruent with the tree
generated by parsimony analysis. Thus, only the posterior probabilities (PP) are
included on the most parsimonious tree, together with the bootstrap percentages (BP)
(Fig. 4).
The Maximum parsimony and Bayesian trees for the ITS and cpDNA
regions revealed a monophyletic clade of Schizolobium, well supported by bootstrap
and posterior probability values of 100% and 1.0, respectively (Fig. 3 and 4). The
phylogenetic analysis based on the ITS sequences supports the monophyletic nature of
both varieties within Schizolobium, with high support values in both parsimony and
Bayesian analyses (Fig. 3).
The monophyly of Schizolobium was also well supported by the
Bayesian analysis of the cpDNA sequences, although the sister group relationship
remains unclear (PP=0.58). The age of the Schizolobium crown node was estimated to
be 12.2 million years (My), with a 95% confidence interval of 5.8-19.5 My (see Fig. 1
in Supplementary Data, available online). Because of the pattern of polymorphism
found in the matK gene, it was not possible to estimate the age of the divergence of the
two varieties of Schizolobium. In an attempt to estimate this divergence time, we used
the alignment of 258 matK legume sequences produced by Bruneau et al. (2008), in
combination with a full chloroplast dataset of Schizolobium containing five plastid
56
regions (psbA-trnH, trnL-trnF, rpoB, rpoC1 and matK) that were added to improve
resolution at the intra-specific level. In this analysis, the estimated age for the parahyba
clade was 3.1 My, with a 95% confidence interval of 1.2-5.4 My (see Fig. 1 in
Supplementary Data, available online). This clade includes all populations from the
Atlantic Forest, except those populations from Bahia (BA01 and BA2). The downside
of this analysis is that most taxa (all except Schizolobium) were missing a substantial
amount of data, which could affect divergence time estimation.
4. Discussion
4.1. Genetic differentiation of Schizolobium
This study represents the first effort to establish the phylogenetic
relationships within the Schizolobium genus. The current taxonomy classifies
Schizolobium as a single species containing two varieties. Until now, however, this
classification had not been tested using molecular data. Schizolobium is a genus with a
large distribution in the Neotropics. S. parahyba is an important Neotropical tree and
the study of its evolution and biogeographical patterns is critical for aiding in genetic
conservation in these rainforests. We have analyzed ten plastid regions and the internal
transcribed spacer (ITS) of Schizolobium, covering approximately 5,300 bp.
The ITS sequences showed a high level of polymorphism, and the
topology identified by the phylogenetic analysis suggests two segregated varieties,
based on geographic distribution and morphological characters (Barneby, 1996). The
individuals of var. parahyba (from Atlantic Forest) are separated from var. amazonicum
(from Amazonian rain Forest and Central America) by 10 SNPs along the ITS sequence
(Table 1).
57
Five of the analyzed chloroplast regions (trnL-F, psbA-trnH, rpoC1,
rpoB and matK) contained polymorphisms. The 12 single nucleotide polymorphism
sites in the matK gene did not correlate with different geographical distributions or
morphological characteristics between the two varieties. In contrast, the other cpDNA
loci (trnL-F, rpoC1, rpoB) showed variations that separate the two varieties. Curiously,
the populations from Bahia (BA1 and BA2), which are morphologically classified as
var. parahyba, have similar sequence patterns to var. amazonicum. The micro-inversion
found in the psbA-trnH intergenic spacer also separated the two varieties, but the
individuals from the BA1 and BA2 populations showed similar sequence to var.
amazonicum. In addition to the micro-inversion, other variations were found in the
psbA-trnH sequences. However, these differences did not correspond with the
classification of the varieties. The populations from BA showed a higher divergence of
cpDNA sequences, compared to samples from the other populations (Fig. 2).
Some physiological aspects also contribute to discrimination of the
varieties of Schizolobium. Indeed, S. parahyba var. parahyba and var. amazonicum
plants respond equally to water deficient conditions in juvenile plants by increasing
total soluble amino acids, proline, total soluble sugars and K+ content of the leaf tissues
and by lowering osmotic potential values. However, the analysis of the pressure-volume
curve results suggests that the varieties respond differently to water stress, and that
individuals of var. amazonicum present a greater capacity for osmotic adaptation than
individuals of var. parahyba (de Carvalho, 2005).
Phylogenetic and Molecular data analysis
The results of the phylogenetic analysis of the cpDNA and ITS sequences
confirmed the monophyly of Schizolobium and the genus position within the
58
Peltophorum clade (Fig. 3, 4 and also Fig. 1 in Supplementary Data available online).
These results are in agreement with previous work that observed the formation of one
clade in Schizolobium, and classified it within the Peltophorum clade (Haston et al.,
2003, 2005).
Interestingly, we observed incongruence between cpDNA and nrITS
phylogenetic analyses with respect to classification of the two varieties (Fig. 3 and Fig.
4). The phylogeny based on nuclear marker (ITS) sequence showed the formation of
two clades: one included the populations of varietie parahyba from the Atlantic Forest
(Santa Catarina to Bahia) and the other included populations from the Amazon and
Central American rain forests (Fig. 3). The results from this marker suggest that the two
varieties are genetically distinct and are possibly in the process of speciation. However,
this pattern was not observed with the cpDNA markers. In this case, we observed
individuals of var. parahyba grouped with those of var. amazonicum (Fig. 4). In many
instances, this lack of congruence between cpDNA and nuclear phylogenies, and this
type of cyto-nuclear disequilibrium, can be explained by reticulate evolution. However,
a very complex and species-level phylogeny will be needed to detail the evolutionary
patterns within the Schizolobium taxa. This incongruence is especially evident in plastid
and nuclear genomes with maternal or bi-parental modes of transmission. Some cases of
incongruence may have resulted from differential lineage sorting of ancestral
polymorphisms in chloroplast and nuclear genes (Comes and Abbott, 2001), as well as
from evolutionary convergence (Davis et al., 1998). The most extreme case is
chloroplast capture, where the cytoplasm of one species is replaced by that of another
species through hybridization/introgression, a process that can occur at a variety of
taxonomic levels (Rieseberg and Soltis, 1991). As a result of these phenomena,
59
clustering taxa on the basis of chloroplast DNA often does not correspond to taxonomic
units or to groups supported by analysis of morphological characteristics or groups
indicated by nuclear markers (Soltis et al., 1995). In spite of the considerable amount of
genetic information available concerning the evolutionary history of Schizolobium that
are now available, we are still unable to fully understand the processes of speciation in
this taxon. Therefore, a phylogeographic analysis, including a wide sampling, could
help to understand the diversification patterns and the origin place of this important
Neotropical tree, especially with regard to cpDNA patterns found in the northeast of the
Atlantic Forest.
The cpDNA and nrITS sequences used in this phylogenetic analysis were
based on previous DNA barcode studies (Edwards et al., 2008; Erickson et al., 2008;
Kress and Erickson, 2007; Kress et al., 2005; Lahaye et al., 2008; Little and Stevenson,
2007; Little et al., 2008; Newmaster et al., 2006; Newmaster et al., 2008; Nielsen and
Matz, 2006; Taberlet et al., 2007). DNA barcoding has been proposed as a means for
species identification and has contributed to a wide range of ecological and conservation
studies in which traditional taxonomic identification is not practical. Based on our
results, it is important to stress that differentiation between var. parahyba and var.
amazonicum was possible after nuclear ITS sequence analysis of a large number of
individuals from a population. However, the cpDNA analysis showed a more complex
phylogenetic relationship that did not permit differentiation between the two varieties.
Using the matK gene, we estimated the age of the Schizolobium crown
node to be 12.2 My old (see Fig. 1 in Supplementary Data, available online), indicating
that this species originated in the late Miocene. Through the use of the concatenate
chloroplast data set, we were able to estimate the age of the parahyba clade
60
(populations from south and southeast of the Atlantic Forest) to be 3.1 My (see Fig. 1 in
Supplementary Data, available online), suggesting that this clade arose in the late
Pliocene. The effects of Miocene and Pliocene palaeogeographical changes on
speciation are relatively well-known and are related to the building and vanishing of
bridges and barriers that changed migration and isolation patterns and favoured
vicariance (Coyne and Orr, 2004). Geographic gene flow barriers, such as mountain
chains, rivers and others geographic characteristics, surround the main tracts of
Neotropical forests and can affect the dispersal patterns of widespread species from
these rain forests.
The Atlantic Forest is currently isolated from the other two largest South
American forest blocks, Amazonia and the Andean Forest. However, the Atlantic Forest
biota was not always isolated (Santos et al., 2007). Phylogenetic studies focusing on
endemic species have indicated that the evolution of the biota in the Atlantic Forest has
been marked by cycles, consisting of periods in which the forest was connected to other
South American forest regions, followed by periods of isolation (Prance, 1987; Prum,
1988; Rizzini, 1997; Willis, 1992). Some species have the capacity for dispersion, while
others probably become isolated and, consequently, originate new species (Morrone and
Crisci, 1995; Raven and Axelrod, 1972; Sanmartin et al., 2001). The mechanisms of
speciation for these biotas are largely based on vicariance caused by geographical or
genetic barriers.
This study sheds some light on the evolutionary history of the biota of
two of the largest rainforest domains in the Neotropics: the Amazon and the Atlantic
Forest. These two biomes, each harbouring a distinct flora, are currently isolated from
each other by a zone of drier climates where dry forests and savannas predominate.
61
However, it is likely that the degree of connectivity between these two areas of
rainforest may have varied throughout geological time. According to evidence from the
fossil record, there are vestiges of rainforest in areas of the Northeast of Brazil, where
semi-arid vegetation flourishes today. This implies that the Amazon and Atlantic forests
were more strongly linked sometime in the past (Behling and Negrelle, 2001). This
linkage would facilitate the interchange of species between these two biomes. In this
study, it is still unclear whether the geographic distribution identified was caused by
long distance dispersal or by contact between both forests followed by isolation due to
climatic fluctuation. The second option seems plausible, given that the estimated time of
the split between the two varieties of Schizolobium occurred roughly in the last 3 My.
Other examples of species with disjoint distributions between the Amazon and the
Atlantic forest may have been identified (Bessega et al., 2006; Colloff, 2009; Conte and
Cristofolini, 2000; Gaudeul, 2006; Gomez-Zurita, 2004; Gonzales and Hamrick, 2005;
Lihova et al., 2009; Orellana et al., 2009; Qian and Ricklefs, 2004; Rossi et al., 2009).
In addition, systematic molecular analysis provides information on the genetics
of wide-ranging species or species groups in a continuous habitat. Our results
corroborate with studies from the Atlantic forest (northeast Brazil), including the forests
located north of the São Francisco River, which has been identified as an important area
of endemism in South America and is influenced by the Amazonian region, making it
very distinctive from other sectors of the Atlantic forest (Baker et al., 1985). In
northeast Brazil, most of the Atlantic forest has been converted into agricultural land,
with only 2% of the original forest remaining. In addition, the forest remnants are
dispersed as small patches, surrounded by open fields. Protected areas in this region are
significantly smaller than the more extensive forests in São Paulo and Southern Brazil
62
(da Silva and Tabarelli, 2000; Rodrigues, 2005). The results described here provide
additional genetic information concerning the Neotropical forest species and will aid in
setting conservation priorities in these regions.
Acknowledements
This work was partially supported by a CNPq Grant (474993/2006-0).
This work was also part of the SEEDSOURCE project supported by the European
Commission under the Sixth Framework Programme and contribution to the
implementation of the thematic area Sustainable development, global changes and
ecosystems under the International Cooperation on Global Change and Ecosystems.
Call FP6-2002-INCO-DEV-1. INCO-2002-A2.1 - Managing humid and semi-humid
ecosystems. Contract number: 003708. Schizolobium samples were provided by C.
Navarro, C. Dick, R. Griebel and R. Valencia. We thank A. Bruneau for providing a
matK matrix that was used in the dating analysis, and E. Haston for sharing unpublished
ITS sequences. M. Margis-Pinheiro and R. Margis were supported by grants from
Conselho Nacional de Desenvolvimento Científico e Tecnológico, CNPq, Brazil
(308708/2006-7 and 303967/2008-0). A. Zolet received a Ph.D. fellowship from CNPq.
References
Arnold, M.L., 1997. Natural hybridization and evolution, New York, NY, USA.
Baker, R.J., Bickham, J.W., Arnold, M.L., 1985. Chromossomal evolution in Rhogeessa
(Chiroptera, Vespertilionidae) - possible speciation by centric fusions. Evolution 39,
233-243.
63
Barneby, R.C., 1996. Neotropical Fabales at NY: Asides and oversights. Brittonia 48,
174-187.
Barraclough, T.G., Nee, S., 2001. Phylogenetics and speciation. Trends in Ecology &
Evolution 16, 391-399.
Behling, H., 1998. Late Quaternary vegetational and climatic changes in Brazil. Review
of Palaeobotany and Palynology 99, 143-156.
Behling, H., 2002. South and southeast Brazilian grasslands during Late Quaternary
times: a synthesis. Palaeogeography Palaeoclimatology Palaeoecology 177, 19-27.
Behling, H., Arz, H.W., Patzold, J., Wefer, G., 2000. Late Quaternary vegetational and
climate dynamics in northeastern Brazil, inferences from marine core GeoB 3104-1.
Quaternary Science Reviews 19, 981-994.
Behling, H., Lichte, M., 1997. Evidence of dry and cold climatic conditions at glacial
times in tropical southeastern Brazil. Quaternary Research 48, 348-358.
Behling, H., Negrelle, R.R.B., 2001. Tropical rain forest and climate dynamics of the
Atlantic lowland, Southern Brazil, during the late Quaternary. Quaternary Research 56,
383-389.
Bessega, C., Vilardi, J.C., Saidman, B.O., 2006. Genetic relationships among American
species of the genus Prosopis (Mimosoideae, Leguminosae) inferred from ITS
sequences: evidence for long-distance dispersal. Journal of Biogeography 33, 19051915.
Bruneau, A., Graham, S.W., 2008. Plant systematics at the species level - Introduction.
Botany-Botanique 86, VII-VIII.
Canchignia-Martínes, H.F., Hernández-Delgado, S., Gonzáles-Paz, M., Motte, E.,
Mayek-Pérez, N., 2007. Genetic Relationships among Schizolobium parahybum (Vell.)
Blake (Leguminosae) Ecotypes from Ecuador and other Countries. Silvae Genetica 56.
Colloff, M.J., 2009. Species-group concepts and biogeography of the genus Crotonia
(Acari: Oribatida: Crotoniidae), with new species from South and Central America.
Zootaxa, 1-30.
64
Comes, H.P., Abbott, R.J., 2001. Molecular phylogeography, reticulation, and lineage
sorting in Mediterranean Senecio sect. Senecio (Asteraceae). Evolution 55, 1943-1962.
Conte, L., Cristofolini, G., 2000. Infraspecific diversity of Cytisus emeriflorus
Reichenb. (Leguminosae), an endemic plant with disjunct distribution: evidence from
isozyme data. Plant Biosystems 134, 373-384.
Coyne, J.A., Orr, H.A., 2004. Speciation. Sinauer Associates, Sunderland, MA.
da Silva, J.M.C., Tabarelli, M., 2000. Tree species impoverishment and the future flora
of the Atlantic forest of northeast Brazil. Nature 404, 72-74.
Davis, J.I., Simmons, M.P., Stevenson, D.W., Wendel, J.F., 1998. Data decisiveness,
data quality, and incongruence in phylogenetic analysis: An example from the
monocotyledons using mitochondrial atpA sequences. Systematic Biology 47, 282-310.
de Carvalho, C.J.R., 2005. Respostas de plantas de Schizolobium amazonicum [S.
parahyba var. amazonicum] e Schizolobium parahyba [Schizolobium parahybum] à
deficiência hídrica. Revista Árvore 29, 907-914.
Doyle, J.J., Doyle, J.L., 1987. Isolation of plant DNA from fresh tissue. Focus 12, 13–
15.
Drummond, A.J., Rambaut, A., 2007. BEAST: Bayesian evolutionary analysis by
sampling trees. Bmc Evolutionary Biology 7.
Ducke, A., 1949. Notas sobre a flora neotrópica. II. As leguminosas da Amazônia
brasileira, Belém.
Edwards, D., Horn, A., Taylor, D., Savolain, V., Hawkins, J.A., 2008. DNA barcoding
of a large genus, Aspalathus L. (Fabaceae). Taxon 57, 1317-1327.
Ehrlich, P.R., Raven, P.H., 1969. Differentiation of populations. Science 165, 1228-&.
Erickson, D.L., Spouge, J., Resch, A., Weigt, L.A., Kress, W.J., 2008. DNA barcoding
in land plants: developing standards to quantify and maximize success. Taxon 57, 13041316.
Freire, J.M., Piña-Rodrigues, F.C.M., De Lima, E.R., Sodré, S.R.C., Corrêa, R.X., 2007.
Estrutura genética de populações de Schizolobium parahyba (Vell.) Blake (guapuruvu)
por meio de marcadores RAPD. Scientia Forestalis 74, 9.
65
Gaudeul,
M.,
2006.
Disjunct
distribution
of
Hypericum
nummularium
L.
(Hypericaceae): molecular data suggest bidirectional colonization from a single
refugium rather than survival in distinct refugia. Biological Journal of the Linnean
Society 87, 437-447.
Goldstein, P.Z., DeSalle, R., 2000. Phylogenetic species, nested hierarchies, and
character fixation. Cladistics-the International Journal of the Willi Hennig Society 16,
364-384.
Goloboff, P., 1993. Nona v.2.0 Computer program published by the author. Available at
www.cladistics.com, Tucuman, Argentina.
Gomez-Zurita, J., 2004. Molecular systematics and time-scale for the evolution of
Timarcha, a leaf-beetle genus with a disjunct Holarctic distribution. Molecular
Phylogenetics and Evolution 32, 647-665.
Gonzales, E., Hamrick, J.L., 2005. Distribution of genetic diversity among disjunct
populations of the rare forest understory herb, Trillium reliquum. Heredity 95, 306-314.
Haston, E.M., Lewis, G.P., Hawkins, J.A., 2003. Phylogenetic investigation of the
Pelthoforum group (Caesalpinieae: Leguminosae). In: Royal Botanic Gardens, K. (Ed.),
Advances in Legume systematics, pp. 149-159.
Haston, E.M., Lewis, G.P., Hawkins, J.A., 2005. A phylogenetic reappraisal of the
Peltophorum group (Caesalpinieae : Leguminosae) based on the chloroplast trnL-F,
rbcL and rps16 sequence data. American Journal of Botany 92, 1359-1371.
Ickert-Bond, S.M., Wen, J., 2006. Phylogeny and biogeography of Altingiaceae:
Evidence from combined analysis of five non-coding chloroplast regions. Molecular
Phylogenetics and Evolution 39, 512-528.
Kamau, E.M., Mayes, S., Barrett, J.A., 2003. Isolation and characterization of
microsatellite loci in Schizolobium parahyba (Leguminosae). Molecular Ecology Notes
3, 469-470.
Kress, W.J., Erickson, D.L., 2007. A Two-Locus Global DNA Barcode for Land Plants:
The Coding rbcL Gene Complements the Non-Coding trnH-psbA Spacer Region. PLoS
ONE 2, e508.
66
Kress, W.J., Wurdack, K.J., Zimmer, E.A., Weigt, L.A., Janzen, D.H., 2005. Use of
DNA barcodes to identify flowering plants. Proceedings of the National Academy of
Sciences of the United States of America 102, 8369-8374.
Lahaye, R., Van der Bank, M., Bogarin, D., Warner, J., Pupulin, F., Gigot, G., Maurin,
O., Duthoit, S., Barraclough, T.G., Savolainen, V., 2008. DNA barcoding the floras of
biodiversity hotspots. Proceedings of the National Academy of Sciences of the United
States of America 105, 2923-2928.
Lewis, G., Schrire, B., MacKinder, B., Lock, M., 2005. Legumes of the world
Lihova,
J.,
Carlsen,
T.,
Brochmann,
C.,
Marhold,
K.,
2009.
Contrasting
phylogeographies inferred for the two alpine sister species Cardamine resedifolia and Calpina (Brassicaceae). Journal of Biogeography 36, 104-120.
Little, D.P., Stevenson, D.W., 2007. A comparison of algorithms for the identification
of specimens using DNA barcodes: examples from gymnosperms. Cladistics 23, 1-21.
Little, D.P., Stevenson, D.W., Cullman, L.B., Cullman, D., 2008. A comparison of
algorithms for identification of specimens using DNA barcodes: examples from
gymnosperms. Cladistics 24, 97-97.
Marshall, J.C., Arevalo, E., Benavides, E., Sites, J.L., Sites, J.W., 2006. Delimiting
species: Comparing methods for mendelian characters using lizards of the Sceloporus
grammicus (Squamata : Phrynosomatidae) complex. Evolution 60, 1050-1065.
Morrone, J.J., Crisci, J.V., 1995. Historical biogeography - introduction to methods.
Annual Review of Ecology and Systematics 26, 373-401.
Myers, N., 2003. Biodiversity hotspots revisited. Bioscience 53, 916-917.
Myers, N., Mittermeier, R.A., Mittermeier, C.G., da Fonseca, G.A.B., Kent, J., 2000.
Biodiversity hotspots for conservation priorities. Nature 403, 853-858.
Newmaster, S.G., Fazekas, A.J., Ragupathy, S., 2006. DNA barcoding in land plants:
evaluation of rbcL in a multigene tiered approach. Canadian Journal of Botany-Revue
Canadienne De Botanique 84, 335-341.
Newmaster, S.G., Fazekas, A.J., Steeves, R.A.D., Janovec, J., 2008. Testing candidate
plant barcode regions in the Myristicaceae. Molecular Ecology Resources 8, 480-490.
67
Nielsen, R., Matz, M., 2006. Statistical approaches for DNA barcoding. Systematic
Biology 55, 162-169.
Nixon, K.C., 2001. Winclada. Published by the author. Ithaca, USA, p. Available at
www.cladistics.com.
Orellana, M.R., Blanche, C., Simon, J., Bosch, M., 2009. Genetic Diversity Within and
among Disjunct Populations of the Mediterranean Island Endemic Delphinium pictum
and D. requienii (Ranunculaceae). Folia Geobotanica 44, 47-63.
Palmer, J.D., Soltis, D.E., Chase, M.W., 2004. The plant tree of life: An overview and
some points of view. American Journal of Botany 91, 1437-1445.
Pennington, R.T., Lavin, M., Prado, D.E., Pendry, C.A., Pell, S.K., Butterworth, C.A.,
2004. Historical climate change and speciation: neotropical seasonally dry forest plants
show patterns of both Tertiary and Quaternary diversification. Philosophical
Transactions of the Royal Society B-Biological Sciences 359, 515-537.
Prado, D.E., Gibbs, P.E., 1993. Patterns of species distributions in the dry seasonal
forest of South America. Annals of the Missouri Botanical Garden 80, 902-927.
Prance, G.T., 1982. A review of the phytogeographic evidences for pleistocene climatic
changes in the Neotropics. Annals of the Missouri Botanical Garden 69, 594-624.
Prance, G.T., 1987. Biogeography and Quaternary history in tropical America. In:
Press, C. (Ed.), Biogeography of Neotropical plants, Oxford.
Prum, R., 1988. Historical relationships among avian forest areas of endemism in the
Neotropics. Acta Congressus Internationalis Ornithologici 19, 2562–2572.
Puorto, G., Salomao, M.D., Theakston, R.D.G., Thorpe, R.S., Warrell, D.A., Wuster,
W., 2001. Combining mitochondrial DNA sequences and morphological data to infer
species boundaries: phylogeography of lanceheaded pitvipers in the Brazilian Atlantic
forest, and the status of Bothrops pradoi (Squamata : Serpentes : Viperidae). Journal of
Evolutionary Biology 14, 527-538.
Qian, H., Ricklefs, R.E., 2004. Geographical distribution and ecological conservatism
of disjunct genera of vascular plants in eastern Asia and eastern North America. Journal
of Ecology 92, 253-265.
68
Raven, P.H., Axelrod, D.I., 1972. Plate tectonics and australasian paleobiogeography.
Science 176, 1379-&.
Raven, P.H., Axelrod, D.I., 1974. Angiosperm biogeography and past continental
movements. Annals of the Missouri Botanical Garden 61, 539-673.
Rieseberg, L.H., Beckstromsternberg, S.M., Liston, A., Arias, D.M., 1991. Phylogenetic
and systematic inferences from chloroplast DNA and isozyme variation in Helianthus
sect Helianthus (Asteraceae). Systematic Botany 16, 50-76.
Rieseberg, L.H., Soltis, D.E., 1991. Phylogenetic consequences of cytoplasmic gene
flow in plants. Evolutionary Trends in Plants 5, 65-84.
Rieseberg, L.H., Whitton, J., Linder, C.R., 1996. Molecular marker incongruence in
plant hybrid zones and phylogenetic trees. Acta Botanica Neerlandica 45, 243-262.
Rizzini, C.T., 1997. Tratado de fitogeografia do Brasil, Rio de Janeiro.
Rodrigues, M.T., 2005. The conservation of Brazilian reptiles: Challenges for a
megadiverse country. Conservation Biology 19, 659-664.
Rossi, A.A.B., de Oliveira, L.O., Venturini, B., Silva, R.D., 2009. Genetic diversity and
geographic differentiation of disjunct Atlantic and Amazonian populations of Psychotria
ipecacuanha (Rubiaceae). Genetica 136, 57-67.
Sanmartin, I., Enghoff, H., Ronquist, F., 2001. Patterns of animal dispersal, vicariance
and diversification in the Holarctic. Biological Journal of the Linnean Society 73, 345390.
Santos, A.M.M., Cavalcanti, D.R., da Silva, J.M.C., Tabarelli, M., 2007.
Biogeographical relationships among tropical forests in north-eastern Brazil. Journal of
Biogeography 34, 437-446.
Shaw, J., Lickey, E.B., Schilling, E.E., Small, R.L., 2007. Comparison of whole
chloroplast genome sequences to choose noncoding regions for phylogenetic studies in
angiosperms: The tortoise and the hare III. American Journal of Botany 94, 275-288.
Singliarova, B., Chrtek, J., Mraz, P., 2008. Loss of genetic diversity in isolated
populations of an alpine endemic Pilosella alpicola subsp ullepitschii: effect of long-
69
term vicariance or long-distance dispersal? Plant Systematics and Evolution 275, 181191.
Sites, J.W., Marshall, J.C., 2003. Delimiting species: a Renaissance issue in systematic
biology. Trends in Ecology & Evolution 18, 462-470.
Sites, J.W., Marshall, J.C., 2004. Operational criteria for delimiting species. Annual
Review of Ecology Evolution and Systematics 35, 199-227.
Soltis, D.E., Mayer, M.S., Soltis, P.S., Edgerton, M., 1991a. Chloroplast DNA variation
in Tellima-Grandiflora (Saxifragaceae). American Journal of Botany 78, 1379-1390.
Soltis, D.E., Soltis, P.S., Collier, T.G., Edgerton, M.L., 1991b. Chloroplast DNA
variation within and among genera of the Heuchera group (Saxifragaceae) - evidence
for chloroplast transfer and paraphyly. American Journal of Botany 78, 1091-1112.
Soltis, D.E., Soltis, P.S., Morgan, D.R., Swensen, S.M., Mullin, B.C., Dowd, J.M.,
Martin, P.G., 1995. Chloroplast gene sequence data suggest a single origen of the
predisposition for symbiotic nitrogen-fixation in angiosperms. Proceedings of the
National Academy of Sciences of the United States of America 92, 2647-2651.
Soltis, E.D., Soltis, P.S., 2000. Contributions of plant molecular systematics to studies
of molecular evolution. Plant Molecular Biology 42, 45-75.
Spence, J.R., 1990. Introgressive hybridization in Heteroptera - the example of
Limnoporus stal (Gerridae) species in western Canada. Canadian Journal of ZoologyRevue Canadienne De Zoologie 68, 1770-1782.
Taberlet, P., Coissac, E., Pompanon, F., Gielly, L., Miquel, C., Valentini, A., Vermat,
T., Corthier, G., Brochmann, C., Willerslev, E., 2007. Power and limitations of the
chloroplast trnL (UAA) intron for plant DNA barcoding. Nucleic Acids Research 35.
Tamura, K., Dudley, J., Nei, M., Kumar, S., 2007. MEGA4: Molecular evolutionary
genetics analysis (MEGA) software version 4.0. Molecular Biology and Evolution 24,
1596-1599.
Templeton, A.R., 2001. Using phylogeographic analyses of gene trees to test species
status and processes. Molecular Ecology 10, 779-791.
70
Thomas, W.W., 1999. Conservation and monographic research on the flora of Tropical
America. Biodiversity and Conservation 8, 1007-1015.
Turchetto-Zolet, A.C., Margis-Pinheiro, M., Margis, R., 2008. The evolution of
pyrroline-5-carboxylate synthase in plants: a key enzyme in proline synthesis Molecular
Genetics and Genomics 281, 87-97.
White, T.J., Bruns, T., Lee, S., Taylor, J., 1990. Amplification and direct sequencing of
fungal ribosomal RNA genes for phylogenetics. In: Innis, M.A., Gelfand, D.H.,
Shinsky, J.J., White, T.J. (Eds.), PCR Protocols: A Guide to Methods and Applications.
Academic Press, San Diego, pp. 315–322.
Wiens, J.J., Servedio, M.R., 2000. Species delimitation in systematics: inferring
diagnostic differences between species. Proceedings of the Royal Society of London
Series B-Biological Sciences 267, 631-636.
Willis, E.O., 1992. Zoogeographical origins of Eastern Brazilian birds. Ornitologia
Neotropical 3, 1-15.
Wojciechowski, M.F., Lavin, M., Sanderson, M.J., 2004. A phylogeny of legumes
(Legumenosae) based on analyses of the plastid matK gene resolves many wellsupported subclades within the family. American Journal of Botany 91, 1846-1862.
71
LEGEND OF FIGURES
Fig. 1. Native range of distribution (A) and sampled populations of Schizolobium
parahyba (B). Circles represent var. parahyba and triangles var. amazonicum. The
dotted line on the map represents the estimated limit zone of distribution between
parahyba and amazonicum varieties. The populations sampled in this study showed in B
are as follows: Santa Catarina (SC), Paraná (PR), São Paulo (SP1 and SP2), Rio de
Janeiro (RJ1 and RJ2), Bahia (BA1 and BA2), Mato Grosso (MT), Amazonas (AM),
Ecuador (EC), Colombia (CO), Costa Rica (CR) and Honduras (HO).
Fig. 2. Alignment of psbA-trnH spacer sequences of S. parahyba and S. amazonicum
plants from different populations. The number at the left represents the number of
individuals analyzed per population. The black line below the alignment represents a
region corresponding to a micro-inversion.
Fig. 3. Maximum parsimony analysis of Schizolobium showing the single most
parsimonious tree (Length = 62, steps, CI = 0.87, RI = 0.94) obtained from the analysis
of ITS dataset. Bootstrap percentages after 1000 replicates are shown below and
posteriori probability indicated above branches.
Fig. 4. Maximum parsimony analysis of Schizolobium showing the consensus of three
most parsimonious tree found (Length = 65 steps, CI = 0.84, RI = 0.96) obtained from
the analysis of a concatenated plastid dataset (matK, psbA-trnH, trnL-trnF, rpoC1,
rpoB). Bootstrap percentages after 1000 replicates are shown below and posterior
probability values are indicated above branches.
72
Table 1. Sequences of primers used for ITS and cpDNA loci amplification and
sequencing, PCR expected size,
sample size in each population, and number of
mutations discriminating between the two varieties of Schizolobium.
Supplementary data
Supplementary data are available online with the following files:
Table 1. Geographical distances (in kilometers) among Schizolobium collected areas;
Fig. 1: Phylogenetic tree comprising a concatenated plastid dataset that included the
matK gene and other five plastid regions (psbA-trnH, trnL-trnF, rpoB, rpoC1) for
Schizolobium. The divergence times was estimated using an uncorrelated relaxed
molecular clock approach implemented in BEAST. The posterior probability values and
the age estimated for Schizolobium are indicated by arrows.
73
Table 1
Sequences of primers used for ITS and cpDNA loci amplification and sequencing, PCR expected size, sample size in each population, and number of
mutations discriminating between the two varieties of Schizolobium.
Locus
Primer sequence 5' - 3'
psbA_trnH ACTGCCTTGATCCACTTGGC
PCR (bp) Polymorphic n (sample per population)*
SNPs Mutation [Sp:Sa]
Indels
363-416 yes
165/26:12:20:5:18:15:3:5:30:14:5:5:5:5
7
1**
7
yes
50/5:2:6:3:4:3:2:4:5:5:2:3:3:3
1
G:A
No
yes
50/5:2:6:3:4:3:2:4:5:5:2::3:3:3
1
C:A
No
yes
79/13:6:8:5:10:3:3:4:4:4:4:5:5:5
1
A:C
No
yes
50/5:2:6:3:4:3:2:4:5:5:2:3:3:3
12
No
No
yes
50/5:2:6:3:4:3:2:4:5:5:2:3:3:3
12
10
No
No
22/2:2:2:2:2:2:2:2:2:2:2:0:0:0
No
No
No
No
33/14:5:0:2:1:2:2:2:1:2:2:0:0:0
No
No
No
No
22/2:2:2:2:2:2:2:2:2:2:2:0:0:0
No
No
No
No
22/2:2:2:2:2:2:2:2:2:2:2:0:0:0
No
No
No
No
22/2:2:2:2:2:2:2:2:2:2:2:0:0:0
No
No
No
CGAAGCTCCATCTACAAATGG
ATGCAACGTCAAGCAGTTCC
473
GATCCCAGCATCACAATTCC
rpoC1
GTGGATACACTTCTTGATAATGG
500
TGAGAAAACATAAGTAAACGGGC
trnL-trnF GGTTCAAGTCCCTCTATCCC
448
ATTTGAACTGGTGACACGAG
matK
CCTATCCATCTGGAAATCTTAG
1500
GTTCTAGCACAAGAAAGTCG
ITS1-2
663
GGAAGTAAAAGTCGTAACAAGG
TCCTCCTCCGCTTATTGATATGC
accD
AGTATGGGATCCGTAGTAGG
280
TCTTTTACCCGCAAATGCAAT
íntron trnL CGAAATCGGTAGACGCTACG
587
GGGGATAGAGGGACTTGAAC
ndhJ
TTGGGCTTCGATTACCAAGG
375
TCAATGAGCATCTTGTATTTC
ycf5
GGATTATTAGTCACTCGTTGG
260
CCCAATACCATCATACTTAC
rbcL-a
ATGTCACCACAAACAGAGACTAAAGC 610
CTTCTGCTACAAATAAGAATCGATCTC
*Pops:
SC:PR:SP1:SP2:RJ1:RJ2:BA1:BA2:MT:AM:EC:CO:CR:H
O
rpoB
**The event of microinversion is represented in the figure 2.
74
Table 1. Sup. data
75
Fig. 1.
76
Fig. 2.
77
Fig. 3.
78
Fig. 4.
79
Fig. 1 Sup. data
80
CAPÍTULO IV: Phylogeography of the disjunct Neotropical trees
Schizolobium (Caesalpinioideae) suggests past interconnections between
Amazonian and Atlantic forests
Andreia Carina Turchetto-Zolet1,2; Fernanda Cruz2, Giovanni G. Vendramin3, Marcia
Margis-Pinheiro1 and Rogerio Margis1,2
1
Programa de Pós-Graduação em Genética e Biologia Molecular, Universidade Federal do
Rio Grande do Sul.
2
Centro de Biotecnologia, Universidade Federal do Rio Grande do Sul.
3
Plant Genetics Institute, National Research Council, Florence, Italy
Manuscrito a ser submetido a Molecular Ecology
81
Abstract
The Amazon and the Atlantic forests encompass the most diverse tropical forests in the
world, with many species showing disjunct distribution between them. However yet
there are few records about genetic structure in these areas. The phylogeographic
studies of the widespread and disjunct species are particulary interesting because they
can provide information on the historical relationship between different geographical
regions. This study investigates the phylogeographic structure of genetic variation in a
neotropical tree genus, Schizolobium Vogel (Fabaceae-Caesalpinieae), based on nuclear
(ITS) and chloroplast (psbA-trnH and trnL-trnF spacer and matK gene) markers. This
genus is largely distributed through of the Neotropics (Atlantic Forest, Amazonian rain
Forest and tropical forest of Central America) and morphologically consists in only one
species, with two varieties. High levels of genetic divergence found in Schizolobium
and no sharing of haplotypes between the two varieties could be the result of genetic
isolation between them, supporting the divergence between the two lineages. The
cpDNA sequence similarity of some populations from Atlantic forest with the var.
amazonicum was observed and this may be due historical gene flow with retention of
ancestral polymorphisms. The high level of genetic diversity was found in São Paulo
(SP2) and Espirito Santo (ES) populations from Atlantic forest may be associated with
refuge areas and support the conservation strategies in this biome. The disjunct
distribution of Schizolobium varieties my be result of the past climatic changes that
resulted in an extension of savannah vegetation and reduction in rain forest size.
82
Introduction
Phylogeographic analyses can provide valuable insights into the
demographic history and the past distribution of individual species, as well information
about the ecological stability of the communities. Phylogeography has immediate
practical importance for taxonomy and conservation management as it clarifies the
genetic relationships of operational taxonomic units and identifies major demographic
trends relevant to their long-term viability (Avise, 2000). In recent years, the
phylogeography of Neotropical species has received more attention because of its
complex biogeographical pattern, and because of the species richness and the notorious
devastation of the Neotropical forests. Important phylogeographic studies have been
carried out along the last decade (Castoe et al., 2009; Cavers et al., 2003; Couvreur et
al., 2007; Dutech et al., 2000; Gonzalez et al., 2008; Latouche-Halle et al., 2003;
Ramos et al., 2009). However, most of these forests remain understudied with relatively
few data about genetic diversity, gene flow, evolution and phylogeographic patterns.
The Neotropical flora comprises about 37% of the world’s plant species
and most of these species are found in rain forests, which have higher plant species
diversity than any other habitat on the planet. However, much cryptic diversity awaits
discovery there or will disappear before documentation (Thomas, 1999). The tempo and
mode of origin and diversification of the lineage in the Neotropics is an interesting topic
in evolutionary biology but is also one of the least understood and is still controversial
(Daza et al., 2009; Rull, 2008). The abiotic and biotic complexity of the region
precludes generalizations that can be drawn regarding the historical evolutionary
processes responsible for the diversity observed (Daza et al., 2009). Some Neotropical
areas are under manifest danger of biodiversity loss and have been identified as
83
biodiversity hotspots submitted to special conservation programs (Myers et al., 2000)
and because of the its large biodiversity, these ecosystems are preferred target for
research about the origin of biological diversity (Pennington et al., 2004). Knowing
speciation timing, genetic mechanisms and forcing agents involved would provide
fundamental clues for biodiversity conservation (Moritz 2002).
It is generally recognized that factors as changes in temperature,
precipitation and sea level, the interaction of these with each other, and the topography
complex have also contributed to both speciation and genetic structuring within species,
but there is an ongoing debate regarding the timing of their influence in the tropics
(Rull, 2006). While Quaternary climatic changes are considered as a major factor
leading to speciation (Noonan, Gaucher, 2005; Rull, 2006), tropical species are typically
regarded as lineages originating before the Pleistocene (Hewitt, 2000). Several
evidences also have suggested that speciation has occurred at different rates and times
in the Neotropics (Zarza et al., 2008). Within Central America, molecular phylogenetic
data suggests that forest plant species encompass both pre-Pleistocene and Pleistocene
speciation events, while South American species appear to be mostly pre-Pleistocene in
origin (Pennington et al., 2004). In regard to genetic structuring within species and its
causes, one might hypothesize that if Pleistocene events are leaving genetic signatures
above the species level within the Neotropics. Widespread Neotropical species may
encompass substantial genetic differentiation and structure, with the possibility of
cryptic species. Hence the phylogeographic studies of the widespread species are
particularly interesting because they can provide information on the historical
relationship between different geographical regions and to provide information about
speciation and genetic structuring within species.
84
The Amazon and the Atlantic Forests morpho-climatic domains of South
America (Ab’Saber, 1977) which encompass the most diverse tropical forests in the
world. Between these two forests lies a belt of more open vegetation, including the
Argentinean and Paraguayan Chaco, the Caatinga in Northeastern Brazil, and the central
Brazilian Cerrado, the latter being the second largest domain in Brazil extending over 2
million km2 (Prado, Gibbs, 1993). This dry corridor of open vegetation has been
considered as an important restraint to species migration between the two rain forest
regions. The biomes composed by Amazonic and the Atlantic forests were probably a
continuous in the past; becoming separated as increasing aridity in the Tertiary formed
the belt of xeromorphic formations between them. The palynological record of the
Quaternary showed that between 33,000 and 25,000 BP, the central Brazilian region
was moister than today and was covered by Rain Forests (Ledru, 1993), and during the
last glacial maximum (18,000–12,000 yr BP), the present-day corridor of xeric
vegetation was covered by extensive woodland (Prado, Gibbs, 1993). These findings
indicate the predominance of seasonal arboreal vegetation during most of the
Pleistocene. Molecular analyses that reveal patterns of genetic diversity in these forests
components are scarce. Some examples reported in literature in general come from tree
species (Dick et al., 2003; Kremer et al., 2005; Ramos et al., 2009; Ramos et al., 2007),
but few studies have reported the differentiation of disjoint Atlantic and Amazonian
plant populations (Rossi et al., 2009).
About species with disjunct distribution, it is origin has been a major
concern in biogeography and many studies tried to disentangle the mechanisms
involved in the origin of such distribution (Azuma et al., 2001; Collevatti et al., 2009;
Gaudeul, 2006; Karanth, 2003; Rossi et al., 2009). Disjunct distributions may be caused
85
by range contraction in an ancient more widely distributed species due to changes in
climatic conditions that affected suitable habitat distribution (Cox, Moore, 2005). On
the other hand long-distance dispersal to new suitable habitats may also be responsible
for disjunct distributions.
The
genus
Schizolobium
Vogel
(Fabaceae-Caesalpinieae)
morphologically consists in only one species, Schizolobium parahyba, comprising two
varieties with disjunct distribution: S. parahyba variety parahyba (Atlantic Forest) and
S. parahyba variety amazonicum (Amazonian rain Forest and tropical forest of Central
America) (Barneby, 1996). Schizolobium is an ecological and economically important
forest tree genera with a great potential for wood production and other uses. It is one of
the fastest growing tree species, which can explain its extensive use in reforestation
projects based on native trees (Carvalho, 1994). The study of these genera is very
interesting because multiple distinct phylogeographic hypotheses can be proposed,
especially for understanding the past floristic connections between the two largest
Neotropical Forests (Amazonian and Atlantic Rain forest) and the speciation patterns in
these biomes. Within this wide distribution, populations tend to be disjoint with
presumably low rates of pollen and seed exchange. It therefore seems likely a priori that
migration history in a complex landscape would be an important determinant of genetic
structure relative to a simple isolation-by-distance model.
In this study, both nuclear and chloroplast markers were used to describe
the phylogeographic structure of S. parahyba. Phylogeographic studies have focused
primarily on organellar rather than nuclear loci because recombination and a fourfold
greater effective population size greatly reduce the informativeness of individual
nuclear loci. As noted by several authors (e.g. Hare 2001; Zhang & Hewitt 2003),
86
however the collective utility of nuclear loci is great because they represent numerous,
approximately independent estimates of genealogy across the genome. Their
interpretation is therefore less affected by the vagaries of lineage sorting at individual
loci. Furthermore, differences in the frequencies of pre-existing nuclear polymorphisms
among subdivided populations should accrue more quickly than differences among
slowly evolving chloroplast haplotypes, and they can be readily translated into a genetic
distance matrix regardless of recombination. Nuclear genetic structure should also have
greater evolutionary consequences than that of organellar genomes and the two may be
largely uncorrelated (Petit et al. 2005). Thus, regardless of the hypotheses to be tested,
it is desirable to use both types of markers to gain an accurate view of species-level
genetic structure. In this case, we have interest in understand the evolution patterns of
Schizolobium, clarify if speciation occurred in this genus and provide genetic
information to support the presence of refuge centers in the Atlantic Forests suggested
by climatic modeling using other animal species as indicators (Carnaval et al., 2009;
Carnaval, Moritz, 2008) and understand the historical relationship between Amazonian
and Atlantic forest.
Materials and Methods
Sampling strategy
A total of 286 individuals of Schizolobium were collected from various
regions and localities, in distinct geographical areas of occurrence of both Schizolobium
varieties and grouped into 20 populations (Table 1 and Fig. 1A). The samples were
collected as silica gel dried cambium and leaf materials from natural populations located
in Brazil (15 populations), Ecuador, Colombia, Costa Rica and Honduras (1 population
87
each). A list of collecting sites, geographical coordinates and sample size of each
population is reported in Table 1.
DNA isolation, amplification and sequencing
Total genomic DNA was isolated using the CTAB method (Doyle,
Doyle, 1990). The 5.8S nrDNA and flanking ITS1 and ITS2 regions were PCR
amplified using ITS1 forward primer 5’GGAAGTAAAAGTCGTAACAAGG-3’ and
ITS2 reverse primer 5’TCCTCCTCCGCTTATTGATATGC-3 (White et al., 1990). The
plastid DNA was amplified using two pairs of universal chloroplast primers
corresponding to fragments of psbA-trnH intergenic spacer (forward primer
5’ACTGCCTTGATCCACTTGGC-3’
and
reverse
primer
5’CGAAGCTCCATCTACAAATGG-3’) and trnL-trnF intergenic spacer (forward
primer
5’GGTTCAAGTCCCTCTATCCC-3’
and
reverse
primer
5’ATTTGAACTGGTGACACGAG-3’) (Kress, Erickson, 2007; Taberlet et al., 2007)
and matK gene (forward primer 5’CCTATCCATCTGGAAATCTTAG-3’ and reverse
primer 5’GTTCTAGCACAAGAAAGTCG-3’) (Wojciechowski et al., 2004).
All amplifications were performed using 10 ng of genomic DNA, 2.5
mM MgCl2, 0.25 mM dNTP mix, 1x PCR buffer, 0.05 U of Platinum Taq DNA
polymerase (Invitrogen) and 5 µM of each primer in a final volume of 20 µl. The PCR
cycle had an initial hot-start step at 94 °C for 5 min, followed by 40 cycles at a
denaturation at 94 oC for 50 s, annealing temperature of 48ºC (ITS1F-ITS2R, psbAtrnH,and trnL-F) or 51ºC for matK gene for 50 s, and 50 s of elongation at 72 ºC. All
PCR products were visualized by electrophoresis in 1.5 % agarose gels stained with
SYBR Gold (Invitrogen) and precipitated using 3 M Sodium Acetate and 95% ethanol.
88
Nuclear and plastid amplified PCR products were sequenced by the
dideoxy chain-termination method using Big-Dye (Applied Biosystems), using an ABI3100 automatic sequencer (Applied Biosystems). Sequencing was conducted in 10µL
reactions with 2 µL of purified PCR product, 1 µL of primer, 2 µL of buffer 5x, 0.25
Big-Dye®Terminator and 4,75 of milliQ water. The thermocycling profile was as
follow: 25 cycles of 10 s at 95 ºC, 5 s at 54 ºC and 4 min at 60 ºC. Both DNA strands
were fully sequenced. Sequencing of approximately 1500 bp of matK gene was done
using
four
additional
internal
primers:
CCTTCGATACTGGGTGAAAGAT
(500
TTCAGTGGTACGGAGTCAAATG
(1100
TTGCATAGAAATGGATTCGCTCAAA
(700
matK4La
(forward)
matK1100L
(forward)
bp);
matK832R
(reverse)
bp)
matK1932Ra
(reverse)
bp);
CCAGACCGGCTTACTAATGGG (1200 bp) (Wojciechowski et al., 2004).
Editing, alignment and phylogenetic analyses
Sequences were checked by eye and the identity was certified using blastn algorithms
against DNA plant sequences deposited at NCBI (http://www.ncbi.nlm.nih.gov).
Nucleotide sequences were aligned using the Alignment Explorer/CLUSTALW
Molecular Evolutionary Genetics Analysis (MEGA) version 4.0 (Tamura et al., 2007).
Haplotype Network and genetic diversity analyses
For this and all subsequent analyses, indels were coded as single binary
character. Genetic relationships among nuclear and cpDNA haplotypes were inferred
with Network 4.2.0.1 (Fluxus Technology Ltd. At www.Fluxus-engineering.com) using
the median-joining method (Bandelt et al., 1999). Molecular diversity indices (π,
nucleotide diversity; h, haplotype diversity; k, mean number of nucleotide substitutions)
were calculated using MEGA 3.0 and DNAsp 5.0 (Librado, Rozas, 2009).
89
To determine hierarchical population structure, analyses of molecular
variance (AMOVA) based on pairwise differences were performed between the two
varieties to determine the amount of variation attributable to differences among varieties
using ARLEQUIN version 3.1 (Excoffier et al., 2005).
Spatial analysis of molecular variance or SAMOVA (Dupanloup et al.,
2002); (ver. 1.0, http://web.unife.it/progetti/genetica/ Isabelle/samova/html) also was
employed to identify spatial boundaries among the twenty sample localities. A total of
100 simulated annealing processes, for both concatenate cpDNA and ITS regions, were
used to determine optimal allocation of the twenty geographic samples into two, three,
four, five, six, seven, or eight groups.
Neutrality tests (Fu, Li, 1993; Tajima, 1989) for both concatenate
cpDNA and ITS sequence data sets were performed in order to detect any possible
deviation from neutrality which could be either an effect of natural selection or the
result of a past demographic expansion. In addition, mismatch distributions were
simulated under the sudden-demographic expansion and the spatial-demographic
expansion models. All tests were performed using Arlequin version 3.0 (Excoffier et al.,
2005).
Results
DNA was extracted from 286 individuals of Schizolobium, sampled from
20 populations. 187 individuals are classified as var. parahyba, collected from Atlantic
Forest and 99 to var. amazonicum, collected in Ecuador, Colombia, Central America
and Amazonian Rain Forest, in Brazil. Sampling localities are indicated in Table 1 and
90
Fig.1. A total of 263 individuals were amplified and sequenced with psbA-trnH and
trnL-trnF cpDNA intergenic spacer, 198 with matK cpDNA gene and 129 with ITS.
The differences according to the different markers it is due to difficulties encountered
with the amplification and sequencing in some samples.
Genetic diversity at ITS region
The ITS aligned matrix, including ITS1+5.8S+ITS2 was 625 bp in
length, of which 227 bp for ITS1 and 181 bp for ITS2. Twelve polymorphic sites were
detected, of which 10 originated by comparing the two varieties, with no insertions or
deletions. Nucleotide diversity was 0,094. Four ITS haplotypes were found and a
significant differentiation between the two varieties was observed. All individuals
collected in Atlantic Forest displayed H1 and H2 haplotypes, while all other individuals
showed H3 and H4 haplotypes. The median-joining network and the relationships
among the 4 ITS haplotypes are showed in Fig. 1B. Tajima’s D and Fu and Li’s F
neutrality tests performed for each population showed no significant values (Table 2),
but the global analysis of neutrality tests showed significant values (Tajima's D=3,42
and Fu and Li's F*=2,59). The FST values among the populations are showed in Table
1S (Supplementary data).
Genetic diversity from cpDNA
The psbA-trnH and trnL-trnF intergenic spacer ranged from 363 to 416
bp and 448 to 449 bp, respectively. For psbA–trnH intergenic spacer, which shows
considerable nucleotide polymorphisms, including a micro-inversion event, is
characterized by a reverse-repeated region of 35 bp flanked by a 14 bp palindromic
sequence and insertions and deletions events. The micro-inversion was coded as a single
event. A 16-bp duplication region (TGAAATGTAAAAAAAA) was found in the
91
populations from Bahia states (Atlantic Forest). The trnL-trnF spacer was characterized
by 5 events (2 indels and 3 substitutions). The amplification of matK gene produced a
fragment of 1500 bp, whit 14 polymorphic sites detected. All analyses were performed
for combined data. The diversity and neutrality parameters are showed in Table 2 and
the FST values among the populations are showed in Table 2S (Supplementary data).
The total combined matrix presented 2322 sites, of which 28 positions were variable
and 9 show with gap.
Twenty one haplotypes were found with the combined cpDNA (Fig.2).
The most diverse populations in terms of detected haplotypes were SP2 and ES from
Atlantic forest (four haplotype), MT and AM2 from Amazonian forest (three and four
haplotypes, respectively). Populations SP1, MG, RJ1 and RJ2 had two haplotypes and
all the others were monomorphic (Table 2 and Fig. 2).
Phylogeographic structure
The relationships among the detected nuclear haplotypes are shown in
network reported in fig. 2 and the chloroplastic haplotypes are shown in the network
reported in Fig. 3. For both matrix, the most frequent haplotype was H1, occurring in 7
out of 20 populations in concatenate cpDNA and 9 in nuclear ITS. Most haplotypes in
combined cpDNA were found in only one population and no haplotype was shared
between the two varieties (Fig. 2, Table 2).
The populations SP2, and ES from Atlantic Forest and AM2 and MT
from Amazonian Rain Forest were the most diverse, as indicated by haplotype and
nucleotide diversity indices (Table 2). The populations from Atlantic Forest (SC, PR1,
PR2, RJ3, BA1, BA2 and BA3) and from Colombia (CO), Amazonian rain forest
(AM1) and Central America (CR and HO) are very homogeneous. High population
92
pairwise FST values were estimated, especially among populations between the two
varieties, based on ITS and cpDNA data (Table 1S and Table 2S, respectively).
Analysis of molecular variance (AMOVA) between the two varieties based on the
nuclear ITS and cpDNA showed in Table 3. AMOVA revealed that most of the
variation in ITS was explained by differences among groups and low variation
explained by differences between groups, while for cpDNA the highest variation is
explained by differences among the populations within groups.
The SAMOVA analyses of ITS clearly indicated that there were two
distinct groups of genetically defined sampling areas. In analyses where K=2, partitions
of the sampling areas were identified that suggested two groups and according of the
distribution of two varieties (groups: SC, PR1, PR2, SP1, SP2, RJ1, RJ2, RJ3, ES, BA1,
BA2, BA3 vs. AM1, AM2, MT, EC, CO, CR, HO; FCT=0.954). In analyses where K=3,
an additional partition was identified that subdivided the first group into two areas, with
an FCT value of 0.644. With K=4 the FCT increased to 0.978 and remained stable after
k=5 to K=8 with FCT values ranging from 0.977 to 0.981. Therefore, we suggested the
division of two varieties and the presence of four geographical groups: two groups in
Atlantic forest comprising SC, PR1, PR2, SP1, SP2, RJ1, BA1, BA2 vs. RJ2, RJ3, ES
and BA3, one in Amazonian rain forest comprising AM1, AM2 and MT and other
group comprising EC, CO, CR and HO populations. The SAMOVA analyses using
cpDNA showed the presence of two main geographical groups: a comprising BA2
population and other comprising all the other populations: SC, PR1, PR2, SP1, SP2,
MG, RJ1, RJ2, RJ3, ES, BA1, BA3, AM1, AM2, MT, EC; CO, CR and HO, with
FCT=0,557 and no observed the separation of the two varieties in different groups.
93
The observed mismatch distributions for cpDNA and nuclear haplotypes
(Fig. 4A and B), were not unimodal, and differed strongly from those predicted under a
model of sudden range expansion. Similarly, all species-wide tests of neutrality
(Tajima’s D, Fu and Li’s F*) showed non-significant values (Table 2). Taken together,
these data do not provide evidences for recent demographic expansions in
Schizolobium.
Discussion
Genetic diversity and genetic structure of Schizolobium
The amount of genetic variation observed in the nuclear ITS region and
chloroplast DNA psbA–trnH, trnL-trnF intergenic spacer and matK gene in
Schizolobium permitted inferences of genealogy, genetic structure, and historical
biogeography. In the present study, using sequences of psbA-trnH+trnL-trnF and matK
region, it was possible to identify that Schizolobium populations exhibit a high levels of
genetic divergence (Table 3) as well as the values observed for other species of
angiosperms where plastid DNA loci were also used (Petit et al., 2005; Ramos et al.,
2009; Ramos et al., 2007). Polimorphism patterns for the three chloroplast region were
very similar but nuclear ITS presented different patterns of haplotype and nucleotide
diversity. Neutrality tests and mismatch distribution showed that the populations are
note in expansion. Populations of S. parahyba usually present a high variation in size
and in proportion of adults and juveniles. Most populations had no juveniles and some
were very small, such as BA1, BA3, PR1, AM1, and the lack of variation in these
populations is probably related to the small size (only three individuals could be
collected).
94
The level of divergence found with nuclear ITS was high (Table 2), but
the most genetic variation in the ITS region in S. parahyba is distributed according to
the varietal designations var. parahyba and var. amazonicum. Only four haplotypes
were found with this marker and no share haplotypes between the varieties, witch shows
high and significant genetic differentiation (Fig 1 and Table 3). In the plastid regions,
despite the sequence similarity some Atlantic Forest populations (RJ3, ES, BA1 and
BA2) with the Amazonian populations, no common haplotypes were detected between
the two varieties. We observed that the haplotype H8, found in ES population (Fig. 2
and Fig. 3), connect the Atlantic forest populations with the Amazonian forest
populations. This similarity may be explained by ancient gene flow and retention of
ancestral polymorphisms since studies indicate past floristic connections between the
Amazonian and Atlantic rain forest areas in Brazil Northeast (Behling, 1998; Behling,
2002; Behling et al., 2000; Behling, Lichte, 1997). In previous studies (non published
data) we showed that the estimate of split between the two varieties of Schizolobium
occurred roughly in the last 3 million years and, according to evidences from the fossil
records; there are vestiges of rainforest in areas of the Northeast of Brazil where today
flourish a semi-arid vegetation. This would imply that the Amazon and Atlantic Forest
were more strongly linked sometime in the past as we see today (Behling, Negrelle,
2001). Others studies also revealed connections between these two important biomes
(Behling, 2002; Costa, 2003). The significant differentiation between the two varieties
could be the result of genetic isolation between the varieties and these results are in
accordance with the hypothesis of the occurrence of a long-standing barrier preventing
gene flow between the Atlantic and Amazonian Forest populations. We postulate that
open vegetations such as the Cerrado serve as a strong natural barrier for Schizolobium,
since this species does not occur in Cerrado areas.
95
The haplotype pattern found and Spatial analysis of molecular variance
(SAMOVA) for ITS DNA sequences markers allows to subdivide the Schizolobium
populations into main genetically differentiated groups according to four geographic
areas: two included in the Atlantic Forest biome; one in Amazonian basin and another
including the populations from Ecuador, Colombia and Central America, besides
indicated a clear separation of the two varieties. However, the lack of spatial correlation
found with cpDNA and the incongruence between the cpDNA and nuclear are very
complex and may be due the different evolutionary patterns these two genomes. The
AMOVA analyses of ITS between the two varieties showed a high level of variation
between them, but the AMOVA analyses of cpDNA showed that the most variation was
among populations within groups. The BA1, BA2 populations from Atlantic forest and
CO (Colombia), CR and HO from Central America were the most divergent populations
(Table 2 and Fig. 3), also presenting low genetic diversity. These low genetic diversity
may be explained by smaller size these populations.
Maternally inherited markers are frequently shared among holoarctic tree
species (Heuertz et al., 2006; Lexer et al., 2005; Palme et al., 2004; Petit et al., 2002b;
Rajora, Dancik, 1992), but this was not observed between the two varieties of
Schizolobium, showing the absence of gene flow between them, strengthening its
differentiation. Different results were observed for species of Hymenaeae, between
Atlantic Forest and Cerrado (Ramos et al., 2009). The 2 species (H. coubaril and H.
stignocarpa) are very similar according to the genetic variation considering the pairwise
distance between haplotypes and only 10.5% of the detected genetic variation is due to
differences between the species, while 51.7% of it was due to differences among
96
populations belonging to the same. These species also shared haplotypes (Ramos et al.,
2009).
In Atlantic Forest, a high level of genetic diversity was found in São
Paulo (SP1) and Espírito Santo (ES) that may be associated with refugia areas
previously identified by climatic modeling studies (Carnaval et al., 2009; Carnaval,
Moritz, 2008). The Bahia Geographic areas exhibiting increased levels of genetic
diversity are first candidates in the search of past refugia. These regions should be
characterized by comparably stable ecological conditions during environmental
fluctuations fostering the accumulation of genetic diversity as has been demonstrated in
many cases (Petit et al., 2003; Petit et al., 2002a). Moreover, as a consequence of
prolonged isolation, extant tree populations situated close to refuges should be highly
divergent, especially if they were not the source of the expansion.
While sites of putative glacial refuge are expected to have higher levels
of genetic variation, regions colonized after glacial periods are expected to have reduced
levels of genetic variation and large geographic areas fixed for a single haplotype
(Hewitt, 2000). In this case, Low levels of genetic variation and haplotype diversity in
Schizolobium was found in South Atlantic forest (SC, PR1, and PR2) (Table 2 and Fig.
2). The populations from Santa Catarina and Parana States are genetically homogeneous
and share nuclear and plastid haplotype (Fig. 1 and 3). A similar pattern was also found
for other species from the Atlantic Forest (Cabanne et al., 2008; Carnaval, Moritz,
2008).
In conclusion, our results support that the disjunct distribution of
Schizolobium varieties my be result of the past climatic changes that resulted in an
extension of savannah vegetation and reduction in rain forest size. However, the split
97
between the two varieties has been occurred before this event. In addition, the
biogeographic patterns found for the different populations of Schizolobium, the high
genetic diversity in the central portion of the Atlantic Forest biome (São Paulo e
Espírito Santo States) and Amazonian forest (Mato Grosso and Amazonas State) and
the high divergence of the some populations, provide important information for
conservation efforts. Prior to any decision concerning conservation strategy, it is
necessary to clarify whether the classification of Schizolobium defines Evolutionarily
Significant Units (ESUs) or merely represents a geographical subdivision with no
further biological or taxonomic implications. According to our results, the different
groups of Schizolobium can be considered as independent ESUs, as they are
reproductively isolated from each other and represent an important component of the
evolutionary legacy of the species. Since ESUs are widely equated to conservation
units, this result suggests that any conservation strategy should consider the islands of
distribution separately (Moritz, 1994). In addition, these biogeographical patterns
supported the connection between the Atlantic and Amazonian rainforests.
ACKNOWLEDEMENTS
This work was partially supported by a CNPq Grant (474993/2006-0).
This work was also part of the SEEDSOURCE project supported by the European
Commission under the Sixth Framework Programme and contribution to the
implementation of the thematic area Sustainable development, global changes and
ecosystems under the International Cooperation on Global Change and Ecosystems.
Call FP6-2002-INCO-DEV-1. INCO-2002-A2.1 - Managing humid and semi-humid
ecosystems. Contract number: 003708. Schizolobium samples were provided by C.
98
Navarro, C. Dick, R. Griebel and R. Valencia. M. Margis-Pinheiro and R. Margis are
recipients of CNPq research fellowships number 308708/2006-7 and 303967/2008-0,
respectively. A. Zolet received a Ph.D. fellowship from CNPq.
REFERENCES
Ab’Saber AN (1977) Os domínios morfoclimá ticos da América do Sul. Primeira
aproximação. Geomorfologia (São Paulo) 53, 1–23.
Avise JC (2000) Phylogeography. The History and Formation of Species Harvard
University Press, Massachusetts.
Azuma H, Garcia-Franco JG, Rico-Gray V, Thien LB (2001) Molecular phylogeny of
the Magnoliaceae: The biogeography of tropical and temperate disjunctions.
American Journal of Botany 88, 2275-2285.
Bandelt HJ, Forster P, Rohl A (1999) Median-joining networks for inferring
intraspecific phylogenies. Molecular Biology and Evolution 16, 37-48.
Barneby RC (1996) Neotropical Fabales at NY: Asides and oversights. Brittonia 48,
174-187.
Behling H (1998) Late Quaternary vegetational and climatic changes in Brazil. Review
of Palaeobotany and Palynology 99, 143-156.
Behling H (2002) South and southeast Brazilian grasslands during Late Quaternary
times: a synthesis. Palaeogeography Palaeoclimatology Palaeoecology 177, 1927.
Behling H, Arz HW, Patzold J, Wefer G (2000) Late Quaternary vegetational and
climate dynamics in northeastern Brazil, inferences from marine core GeoB
3104-1. Quaternary Science Reviews 19, 981-994.
Behling H, Lichte M (1997) Evidence of dry and cold climatic conditions at glacial
times in tropical southeastern Brazil. Quaternary Research 48, 348-358.
Behling H, Negrelle RRB (2001) Tropical rain forest and climate dynamics of the
Atlantic lowland, Southern Brazil, during the late Quaternary. Quaternary
Research 56, 383-389.
Cabanne GS, d'Horta FM, Sari EHR, Santos FR, Miyaki CY (2008) Nuclear and
mitochondrial phylogeography of the Atlantic forest endemic Xiphorhynchus
fuscus (Aves: Dendrocolaptidae): Biogeography and systematics implications.
Molecular Phylogenetics and Evolution 49, 760-773.
Carnaval AC, Hickerson MJ, Haddad CFB, Rodrigues MT, Moritz C (2009) Stability
Predicts Genetic Diversity in the Brazilian Atlantic Forest Hotspot. Science 323,
785-789.
99
Carnaval AC, Moritz C (2008) Historical climate modelling predicts patterns of current
biodiversity in the Brazilian Atlantic forest. Journal of Biogeography 35, 11871201.
Carvalho PER (1994) Espécies florestais brasileiras: recomendações silviculturais,
potencialidades e uso da madeira., Colombo: Embrapa-CNPF edn., Colombo.
Castoe TA, Daza JM, Smith EN, et al. (2009) Comparative phylogeography of pitvipers
suggests a consensus of ancient Middle American highland biogeography.
Journal of Biogeography 36, 88-103.
Cavers S, Navarro C, Lowe AJ (2003) Chloroplast DNA phylogeography reveals
colonization history of a Neotropical tree, Cedrela odorata L., in Mesoamerica.
Molecular Ecology 12, 1451-1460.
Collevatti RG, Rabelo SG, Vieira RF (2009) Phylogeography and disjunct distribution
in Lychnophora ericoides (Asteraceae), an endangered cerrado shrub species.
Annals of Botany 104, 655-664.
Costa LP (2003) The historical bridge between the Amazon and the Atlantic Forest of
Brazil: a study of molecular phylogeography with small mammals. Journal of
Biogeography 30, 71-86.
Couvreur TLP, Hahn WJ, de Granville JJ, et al. (2007) Phylogenetic relationships of the
cultivated neotropical palm Bactris gasipaes (Arecaceae) with its wild relatives
inferred from chloroplast and nuclear DNA polymorphisms. Systematic Botany
32, 519-530.
Cox CB, Moore PD (2005) Biogeography: an ecological and evolutionary approach.
Blackwell Publishing, Oxford.
Daza JM, Amith EN, Páes VP, Parkinson CL (2009) Complex evolution in the
Neotropics: The origin and diversification of the widespread genus Leptodeira
(Serpentes:
Colubridae).
Molecular
Phylogenetics
and
Evolution
doi:10.1016/j.ympev.2009.07.022.
Dick CW, Abdul-Salim K, Bermingham E (2003) Molecular systematic analysis reveals
cryptic tertiary diversification of a widespread tropical rain forest tree. American
Naturalist 162, 691-703.
Doyle JJ, Doyle JL (1990) Isolation of plant DNA from fresh tissue. Focus 12, 3.
Dupanloup I, Schneider S, Excoffier L (2002) A simulated annealing approach to define
the genetic structure of populations. Molecular Ecology 11, 2571-2581.
Dutech C, Maggia L, Joly HI (2000) Chloroplast diversity in Vouacapoua americana
(Caesalpiniaceae), a neotropical forest tree. Molecular Ecology 9, 1427-1432.
Excoffier L, Laval G, Schneider S (2005) Arlequin ver. 3.0: An integrated software
package for population genetics data analysis. Evolutionary Bioinformatics
Online 1, 47-50.
Fu YX, Li WH (1993) Statistical tests of neutrality of mutations. Genetics 133, 693709.
Gaudeul M (2006) Disjunct distribution of Hypericum nummularium L.
(Hypericaceae): molecular data suggest bidirectional colonization from a single
100
refugium rather than survival in distinct refugia. Biological Journal of the
Linnean Society 87, 437-447.
Gonzalez D, Vovides AP, Barcenas C (2008) Phylogenetic relationships of the
neotropical genus Dioon (Cycadales, Zamiaceae) based on nuclear and
chloroplast DNA sequence data. Systematic Botany 33, 229-236.
Heuertz M, Carnevale S, Fineschi S, et al. (2006) Chloroplast DNA phylogeography of
European ashes, Fraxinus sp (Oleaceae): roles of hybridization and life history
traits. Molecular Ecology 15, 2131-2140.
Hewitt G (2000) The genetic legacy of the Quaternary ice ages. Nature 405, 907-913.
Karanth KP (2003) Evolution of disjunct distributions among wet-zone species of the
Indian subcontinent: Testing various hypotheses using a phylogenetic approach.
Current Science 85, 1276-1283.
Kremer A, Caron H, Cavers S, et al. (2005) Monitoring genetic diversity in tropical
trees with multilocus dominant markers. Heredity 95, 274-280.
Kress WJ, Erickson DL (2007) A Two-Locus Global DNA Barcode for Land Plants:
The Coding rbcL Gene Complements the Non-Coding trnH-psbA Spacer
Region. PLoS ONE 2, e 508.
Latouche-Halle C, Ramboer A, Bandou E, Caron H, Kremer A (2003) Nuclear and
chloroplast genetic structure indicate fine-scale spatial dynamics in a neotropical
tree population. Heredity 91, 181-190.
Ledru MP (1993) Late quaternary environmental and climatic changes in Central Brazil.
Quaternary Research 39, 90-98.
Lexer C, Fay MF, Joseph JA, Nica MS, Heinze B (2005) Barrier to gene flow between
two ecologically divergent Populus species, P alba (white poplar) and P tremula
(European aspen): the role of ecology and life history in gene introgression.
Molecular Ecology 14, 1045-1057.
Librado P, Rozas J (2009) DnaSP v5: a software for comprehensive analysis of DNA
polymorphism data. Bioinformatics 25, 1451-1452.
Moritz C (1994) Defining evolutionary significant units for conservation. Trends in
Ecology & Evolution 9, 373-375.
Myers N, Mittermeier RA, Mittermeier CG, da Fonseca GAB, Kent J (2000)
Biodiversity hotspots for conservation priorities. Nature 403, 853-858.
Noonan BP, Gaucher P (2005) Phylogeography and demography of Guianan harlequin
toads (Atelopus): diversification within a refuge. Molecular Ecology 14, 30173031.
Palme AE, Su Q, Palsson S, Lascoux M (2004) Extensive sharing of chloroplast
haplotypes among European birches indicates hybridization among Betula
pendula, B-pubescens and B-nana. Molecular Ecology 13, 167-178.
Pennington RT, Lavin M, Prado DE, et al. (2004) Historical climate change and
speciation: neotropical seasonally dry forest plants show patterns of both
Tertiary and Quaternary diversification. Philosophical Transactions of the Royal
Society B-Biological Sciences 359, 515-537.
101
Petit RJ, Aguinagalde I, de Beaulieu JL, et al. (2003) Glacial refugia: Hotspots but not
melting pots of genetic diversity. Science 300, 1563-1565.
Petit RJ, Brewer S, Bordacs S, et al. (2002a) Identification of refugia and post-glacial
colonisation routes of European white oaks based on chloroplast DNA and fossil
pollen evidence. Forest Ecology and Management 156, 49-74.
Petit RJ, Csaikl UM, Bordacs S, et al. (2002b) Chloroplast DNA variation in European
white oaks - Phylogeography and patterns of diversity based on data from over
2600 populations. Forest Ecology and Management 156, 5-26.
Petit RJ, Duminil J, Fineschi S, et al. (2005) Comparative organization of chloroplast,
mitochondrial and nuclear diversity in plant populations. Molecular Ecology 14,
689-701.
Prado DE, Gibbs PE (1993) Patterns of species distributions in the dry seasonal forests
of South America. Annals of the Missouri Botanical Garden 80, 902-927.
Rajora OP, Dancik BP (1992) Chloroplast DNA inheritance in populus. Theoretical and
Applied Genetics 84, 280-285.
Ramos ACS, De Lemos JP, Lovato MB (2009) Phylogeographical Structure of the
Neotropical Forest Tree Hymenaea courbaril (Leguminosae: Caesalpinioideae)
and Its Relationship with the Vicariant Hymenaea stigonocarpa from Cerrado.
Journal of Heredity 100, 206-216.
Ramos ACS, Lemos-Filho JP, Ribeiro RA, Santos FR, Lovato MB (2007)
Phylogeography of the tree Hymenaea stigonocarpa (Fabaceae :
Caesalpinioideae) and the influence of quaternary climate changes in the
Brazilian cerrado. Annals of Botany 100, 1219-1228.
Rossi AAB, de Oliveira LO, Venturini B, Silva RD (2009) Genetic diversity and
geographic differentiation of disjunct Atlantic and Amazonian populations of
Psychotria ipecacuanha (Rubiaceae). Genetica 136, 57-67.
Rull V (2006) Quaternary speciation in the Neotropics. Molecular Ecology 15, 42574259.
Rull V (2008) Speciation timing and neotropical biodiversity: the Tertiary-Quaternary
debate in the light of molecular phylogenetic evidence. Molecular Ecology 17,
2722-2729.
Taberlet P, Coissac E, Pompanon F, et al. (2007) Power and limitations of the
chloroplast trnL (UAA) intron for plant DNA barcoding. Nucleic Acids
Research 35.
Tajima F (1989) Statistical method for testing the neutral mutation hypothesis by DNA
polimorphism. Genetics 123, 585-595.
Tamura K, Dudley J, Nei M, Kumar S (2007) MEGA4: Molecular Evolutionary
Genetics Analysis (MEGA) software version 4.0. Mol Biol Evol 24, 1596-1599.
Thomas WW (1999) Conservation and monographic research on the flora of Tropical
America. Biodiversity and Conservation 8, 1007-1015.
White TJ, Bruns T, Lee S, Taylor J (1990) Amplification and direct sequencing of
fungal ribosomal RNA genes for phylogenetics. In: PCR Protocols: A Guide to
102
Methods and Applications (eds. Innis MA, Gelfand DH, Shinsky JJ, White TJ),
pp. 315–322. Academic Press, San Diego.
Wojciechowski MF, Lavin M, Sanderson MJ (2004) A phylogeny of legumes
(Legumenosae) based on analyses of the plastid matK gene resolves many wellsupported subclades within the family. American Journal of Botany 91, 18461862.
Zarza E, Reynoso VH, Emerson BC (2008) Diversification in the northern neotropics:
mitochondrial and nuclear DNA phylogeography of the iguana Ctenosaura
pectinata and related species. Molecular Ecology 17, 3259-3275.
103
Supporting information
Additional supporting information may be found in the online version of this article:
Table. S1 Pairwise comparisons of FST between populations of Schizolobium based on
the ITS region.
Table. S2 Pairwise comparisons of FST between populations of Schizolobium based on
the concatenate psbA-trnH/trnL-trnF intergenic spacer and matK gene plastid DNA.
FIGURES OF LEGENDS
Figure 1. (A) Distribution areas populations collected of Schizolobium parahyba in
neotropics. The black circles represents the var. parahyba and the black triangle
represents the var. amazonicum distribution areas. The populations were collected from
Santa Catarina (SC), Paraná (PR1 and PR2), São Paulo (SP1 and SP2), Minas Gerais
(MG), Rio de Janeiro (RJ1, RJ2 and RJ3), Espírito Santo (ES), Bahia (BA1, BA2 and
BA3), Mato Grosso (MT), Amazonas (AM and MA2), Ecuador (EC), Colombia (CO),
Costa Rica (CR) and Honduras (HO). (B) The MJ network analysis of the relationships
between haplotypes of the ncITS region ploted on the map showing the molecular
divergence between the two varieties. The dotted line on the map represents the
estimated limit zone of distribution between parahyba and amazonicum varieties.
Figure 2: Approximate geographic location and plastid DNA haplotype frequencies of
the populations of Schizolobium studied. Circle size is proportional to sample size and
colours represent the different haplotypes as shown in the key.
Figure 3: Median-Joinig network analysis of the relationships between haplotypes of the
concatenate psbA-trnH and trnL-trnF plastid DNA region from 265 Schizolobium
104
individuals. Circle area is proportional to haplotype frequency and colours are as in map
from figure 2. Lines drawn between haplotypes represent mutation events identified by
the numbers corresponding to the positions at which the mutations were observed.
Black points represent hypothetical haplotypes (median vector).
Figure 4. Mismatch distributions of nuclear sequences (ITS) (A) and concatenate
cpDNA sequences (B).
105
Table 1 Geographical characteristics of the 20 Schizolobium populations analysed
Population
Label
Latitude
Longitude
Collected variety
Santa Catarina, Barzil
SC
27º2' N
48º35' W
parahyba
Estrada da Graciosa, Paraná, Barzil
PR1
25º34' N
54º29' W
parahyba
Fóz do Iguaçu, Paraná, Barzil
PR2
25º22' N
48º51' W
parahyba
São Paulo, Barzil
SP1
24º44' N
48º9' W
parahyba
São Paulo, Barzil
SP2
23º29' N
45º4' W
parahyba
Minas Gerais, Barzil
MG
20º8' N
44º6' W
parahyba
Rio de Janeiro, Barzil
RJ1
23º4' N
44º42' W
parahyba
Rio de Janeiro, Barzil
RJ2
22º29' N
43º27' W
parahyba
Rio de Janeiro, Barzil
RJ3
22º52' N
42º29' W
parahyba
Espírito Santo, Barzil
ES
19º53' N
40º5' W
parahyba
Bahia, Barzil
BA1
14º45' N
39º14' W
parahyba
Bahia, Barzil
BA2
15º5' N
39º17' W
parahyba
Bahia, Barzil
BA3
18º4' N
39º32' W
parahyba
Mato grosso, Barzil
MT
10º41' N
55º29' W
amazonicum
Manaus, Amazonas, Barzil
AM1
3º8' N
59º57' W
amazonicum
Boca do Acre, Barzil
AM2
8º43' N
69º0' W
amazonicum
Ecuador
EC
1º2' N
44º6' W
amazonicum
Colombia
CO
3º20' N
72º42' W
amazonicum
Costa Rica
CR
9º51' N
83º33' W
amazonicum
Honduras
HO
14º36' N
86º16' W
amazonicum
106
Table 2 Genetic diversity measures and neutrality tests in cpDNA regions. Sample size (n), number of variable sites (s) number of haplotypes
(H), nucleotide diversity (π), Fu’s FS and Tajimas D .
concatenate cpDNA
Populations n
ITS
s
H
π
Tajima’s D
Fu's Fs
n
s
H
π
Tajima’s D
Fu's Fs
SC
13
0,00
1 (H1)
0,00
0,000
0,000
13
0,00
1 (H1)
0,00
0,00
0,00
PR1
2
0,00
1 (H1)
0,00
0,000
0,000
4
0,00
1 (H1)
0,00
0,00
0,00
PR2
5
0,00
1 (H1)
0,00
0,000
0,000
7
0,00
1 (H1)
0,00
0,00
0,00
SP1
7
1,00
2 (H1, H5)
0,57
1,341
0,856
7
1,00
1 (H1)
0,00
0,00
0,00
SP2
20
3,00
4 (H1, H2, H3,H4)
1,47
0,753
0,944
11
1,00
2 (H1, H2)
0,32
-0,10
0,35
MG
12
1,00
2 (H1, H5)
0,16
-1,140
-0,475
*
*
RJ1
10
0,00
2 (H4, H7)
0,46
0,000
0,818
5
1,00
2 (H1 e H2)
0,60
1,22
0,62
RJ2
18
1,00
2 (H1, H6)
0,36
0,488
0,790
13
1,00
2 (H1 e H2)
0,54
1,47
1,23
RJ3
5
0,00
1 (H9)
0,00
0,000
0,000
4
0,00
1 (H2)
0,00
0,00
0,00
ES
11
5,00
4 (H5, H8, H10, H11)
1,52
-0,811
0,163
6
0,00
1 (H2)
0,00
0,00
0,00
BA1
3
0,00
1 (H19)
0,00
0,000
0,000
3
0,00
1 (H1)
0,00
0,00
0,00
BA2
3
0,00
1 (H20)
0,00
0,000
0,000
7
0,00
1 (H1)
0,00
0,00
0,00
BA3
9
0,00
1 (H10)
0,00
0,000
0,000
3
0,00
1 (H2)
0,00
0,00
0,00
MT
26
1,00
3 (H12, H13, H14)
0,77
0,668
0,885
17
0,00
1 (H3)
0,00
0,00
0,00
AM1
4
1,00
1 (H14)
0,00
0,000
0,000
4
0,00
1 (H3)
0,00
0,00
0,00
AM2
26
5,00
3 (H14, H15, H16, H17)
2,85
1,578
3,595
10
0,00
1 (H3)
0,00
0,00
0,00
EC
5
0,00
1 (H18)
0,00
0,000
0,000
6
1,00
2 (H3 e H4)
0,33
-0,93
0,00
CO
5
0,00
1 (H21)
0,00
0,000
0,000
3
0,00
1 (H4)
0,00
0,00
0,00
CR
9
0,00
1 (H21)
0,00
0,000
0,000
6
0,00
1 (H4)
0,00
0,00
0,00
HO
5
0,00
1 (H21)
0,00
0,000
0,000
4
0,00
1 (H4)
0,00
0,00
0,00
*
*
*
*
Statistical significance of Tajima's D and Fu's Fs: Not significant, P > 0,05; *Population do not analysed
107
Table 2 Results of the analyses molecular variance (AMOVA) based on the nuclear ITS
(a) and concatenate cpDNA (psbA-trnH+trnL-trnF+matK) (b) of Schizolobium
locations
d.f
Sum. of
squares
Variance
Variation
components Percentage
Fixation
indices
Among Groups
Among populations within Groups
Within Populations
Total
(b)
1
17
110
128
302,486
20,877
6,900
330,264
5,082
95,48
3,34
1,18
FCT: 0,954
FSC: 0,739
FST: 0,988
Among Groups
Among populations within Groups
1
18
148,457
472,816
1,073
2,792
25,04
65,14
FCT: 0,250
FSC: 0,868
Within Populations
Total
178
197
74,990
696,263
0,421
4,287
9,83
FST: 0,901
Source of variation
(a)
0,177
0,062
5,323
108
Fig 1.
109
Fig. 2.
110
Fig. 3.
111
Fig 4
112
Table S1
SC
SC
PR1
PR2
SP1
0,000
0,000
0,000
PR1
PR2
SP1
SP2
RJ1
0,000
0,000
0,000
SP2
RJ1
RJ2
RJ3
ES
BA1
0,120 -0,040
0,480 0,190
0,500 0,340
1,000 1,000
1,000 1,000
0,040
0,330
0,410
1,000
1,000
0,040
0,330 -0,030
0,410 0,170 -0,120
1,000 0,710 0,450
1,000 0,750 0,540
0,000
0,000
0,000
0,000 -0,100
0,120
BA2
BA3
MT
AM1
AM2
0,000
1,000
1,000
1,000
1,000
0,000
1,000
1,000
1,000
1,000
0,000
1,000
1,000
1,000
1,000
0,000
1,000
1,000
1,000
1,000
0,040
0,690
0,990
0,980
0,980
0,330
0,390
0,990
0,970
0,980
EC
CO
CR
HO
0,990
1,000
1,000
1,000
0,980
1,000
1,000
1,000
0,990
1,000
1,000
1,000
0,990
1,000
1,000
1,000
0,970
0,980
0,980
0,980
0,960
0,970
0,970
0,970
RJ2
RJ3
ES
0,250
0,300
0,300
0,410
0,000
1,000
1,000
1,000
1,000
0,200
0,980
0,960
0,970
0,000
1,000
1,000
1,000
0,000
1,000
1,000
1,000
0,960
0,960
0,970
0,960
0,980
1,000
1,000
1,000
0,990
1,000
1,000
1,000
BA1
0,000
1,000
1,000
1,000
1,000
0,980
1,000
1,000
1,000
BA2
1,000
1,000
1,000
1,000
0,990
1,000
1,000
1,000
BA3
1,000
1,000
1,000
0,980
1,000
1,000
1,000
MT
0,000
0,000
0,890
1,000
1,000
1,000
AM1
AM2
EC
CO
CR
HO
0,000
0,760
1,000
1,000
1,000
0,840
1,000 -0,150
1,000 -0,030
1,000 -0,080
0,000
0,000
0,000
Values given in bold are not significant at P>0,05
113
Table S2
SC
PR1
SC
PR1
PR2
SP1
0,000
0,000
0,616
0,000
0,257
SP2
MG
RJ1
RJ2
RJ3
0,587
0,913
0,912
0,734
1,000
0,406
0,839
0,824
ES
BA1
BA2
BA3
MT
AM1
0,801
1,000
1,000
1,000
0,914
1,000
0,637
1,000
1,000
AM2
EC
CO
CR
HO
0,745
1,000
1,000
1,000
1,000
0,596
1,000
1,000
0,878
1,000
0,645
1,000
1,000
1,000
1,000
PR2
SP2
MG
RJ1
RJ2
0,214
0,822
0,680
0,926
0,680
0,565
0,666
0,810
0,906
0,832
0,975
0,869
0,949
0,939
0,712
1,000
1,000
1,000
0,891
1,000
0,715
0,966
0,983
0,908
0,888
0,932
0,732
0,907
0,936
0,792
0,838
0,792
0,809
0,989
0,994
0,972
0,915
0,978
0,825
0,973
0,985
0,940
0,890
0,935
0,810
0,975
0,983
0,933
0,910
0,947
0,595
1,000
1,000
1,000
0,839
1,000
0,689
1,000
1,000
1,000
1,000
0,708
0,939
0,975
0,982
0,975
0,747
0,835
0,921
0,932
0,921
0,760
0,979
0,991
0,993
0,991
0,764
0,956
0,979
0,984
0,979
0,772
0,949
0,979
0,982
0,979
0,583
1,000
1,000
1,000
1,000
0,439
0,494
0,871
0,863
0,657
1,000
SP1
RJ3
ES
BA1
BA2
BA3
0,882
0,940
1,000
-0,130
0,768
0,685
1,000
0,941
1,000
1,000
0,963
1,000
0,827
1,000
0,574
0,705
0,907
0,926
0,907
0,759
1,000
1,000
1,000
1,000
0,867
1,000
1,000
1,000
1,000
0,551
1,000
1,000
1,000
1,000
MT
AM1
AM2
EC
CO
CR
HO
0,412
0,701
0,870
0,949
0,955
0,949
0,569
1,000
1,000
1,000
1,000
0,643
0,794
0,817
0,794
1,000
1,000
1,000
0,000
0,000
0,000
0,552
Values given in bold are not significant at P>0,05
114
Capítulo V: Considerações Finais
115
CONSIDERAÇÕES FINAIS
No ano de 2006 foi iniciado o projeto SEEDSOURCE, que visa produzir e
fornecer fontes de informações para aproximadamente 50 espécies de árvores sócioeconomicamente importantes, oriundas de regiões tropicais das Américas Central e do Sul.
Essas informações baseiam-se em estudos sobre variação adaptativa, diversidade genética,
fluxo gênico e capacidade regenerativa de 12 espécies, combinado com as informações já
disponíveis, sendo interpretadas usando análise de meta-dados e procedimentos de
modelagem. Com essa abordagem integrada, o projeto fornece as melhores práticas sobre
as fontes de germoplasma para reflorestamento dentro de uma escala de degradação
ambiental, e para árvores de diferentes nichos, que são componentes chaves da composição
de diversos ecossistemas. Estas informações são individualmente adaptadas e focadas para
as diferentes partes interessadas.
O projeto conta com a participação de diversos grupos de pesquisadores de
Instituições de vários países: Alemanha, Brasil, Itália, Estados Unidos, Equador, Costa
Rica, Guiana Francesa, França, Inglaterra, Austrália e Escócia e abrange três aspectos
principais: i) estudo da biodiversidade usando marcadores não neutros, através da análise
da variabilidade em genes candidatos relacionada ao estresse hídrico; ii) estudo de
filogeografia, através de marcadores neutros e iii) genética de populações (diversidade
intra e inter populações). Schizolobium parahyba (Fabaceae-Caesalpinioideae) é uma das
12 espécies estudadas no projeto SEEDSOURCCE.
116
Este trabalho representa o primeiro estudo genético molecular dentro do
gênero Schizolobium. Um amplo número de marcadores cloroplásticos e nucleares foi
utilizado, permitindo o entendimento da evolução, biogeografia, sistemática e filogeografia
de Schizolobium, além de contribuírem para a compreensão de questões relacionadas à
evolução e diversidade genética de outras espécies arbóreas Neotropicais. Por outro lado, o
conhecimento da diversidade genética de Schizolobium, bem como de outras espécies
arbóreas também contribui para fornecer informações necessárias sobre a origem e
utilização de germoplasma, para assegurar que os sistemas de produção utilizem materiais
mais adaptados, maximizando a produção, sem afetar a diversidade genética, num contexto
de reflorestamento e produção de madeira. Alguns trabalhos desenvolvidos por membros
do projeto SEEDSOURCE relacionados a este trabalho podem ser citados (Andre et al.,
2008; Cavers et al., 2005a; Cavers et al., 2005b; Colpaert et al., 2005; Dick et al., 2003;
Dick et al., 2007; Dick, Heuertz, 2008; Dick, Wright, 2005; Kremer et al., 2005; Kremer,
Reviron, 2004; Lemes et al., 2007; Lemes et al., 2003; Petit et al., 2008).
Estudo de genes relacionados ao estresse hídrico para espécies arbóreas
Uma das abordagens do projeto SEEDSOURCE é o estudo de genes
relacionados ao estresse hídrico em espécies arbóreas. O objetivo é a identificação de
polimorfismos (single nucleotide polimorphisms, SNPs) em uma série de genes candidatos
envolvida em estresse hídrico em plantas, tais como genes da família das aquaporinas,
genes envolvidos na síntese de osmorreguladores, tais como prolina e trealose, entre
outros. Um conjunto destes genes foi selecionado e as sequências gênicas presentes em
diferentes tipos de plantas alinhadas para o desenho de iniciadores degenerados e posterior
117
amplificação em todas as espécies arbóreas de interesse. Os produtos de amplificação
foram clonados e seqüenciados para o desenho de iniciadores específicos para cada
espécie, para, posteriormente realizar amplificação em um grande número de indivíduos de
diferentes áreas de ocorrência. Cada grupo de pesquisa do projeto SEEDSOURCE ficou
responsável pelo estudo e clonagem de um gene, sendo o gene P5CS (∆1-pirrolina 5–
carboxilato sintase) envolvido na síntese de prolina um dentre os genes escolhidos.
A sequência parcial (exons 5 e 6 e o íntron 6) do gene p5cs foi clonada e
sequenciada para quatro espécies arbóreas Neotropicais: Schizolobium parahyba, Cedrela
odorata, Bombacopsis quinata e Ceiba pentandra. A partir disso, duas abordagens foram
feitas: na primeira, realizou-se um estudo sobre a evolução desses genes em plantas,
através da reconstrução filogenética dos mesmos, para tentar entender o evento de
duplicação em plantas, bem como a bi-funcionalidade da enzima P5CS (Turchetto-Zolet et
al., 2009); na segunda, iniciadores específicos para S. parahyba foram desenhados com o
objetivo de realizar uma análise de polimorfismo em indivíduos em toda a sua distribuição
geográfica.
Para o estudo sobre a evolução dos genes P5CS, buscaram-se todas as
possíveis sequências depositadas nos bancos de dados e foram construídas duas diferentes
filogenias: uma utilizando somente a sequência completa de diversas plantas e a outra
utilizando somente as sequências parciais, incluindo assim as sequências clonadas das 4
espécies arbóreas, bem como um maior número de plantas. Os resultados dessas análises
sugerem que eventos independentes de duplicação ocorreram ao longo da história
evolutiva desses genes e que a duplicação ocorreu após a divergência entre mono e
dicotiledôneas. Eventos de duplicação durante a história evolutiva dos organismos,
principalmente plantas, podem ocorrer nas principais enzimas de vias metabólicas. Tais
118
eventos de duplicação produzem cópias idênticas que atuam de maneira redundante logo
após a duplicação, mas que podem sofrer alterações causando mudanças na regulação
transicional e assim contribuindo para a evolução da divergência funcional. Em muitos
casos, uma das cópias pode ter perda de função e não mais ser expressa. Neste trabalho, foi
mostrado através de análise de expressão por RT-PCR que na espécie S. parahyba, as duas
cópias do gene p5cs são expressas em condições normais. Além disso, foi estimado as
taxas de Ka/Ks e todas as comparações dos genes P5CS duplicados entre as diferentes
espécies mostrou a existência de seleção positiva, o que pode estar associado com a
exposição de plantas ancestrais aos diferentes condições ambientais ao longo da evolução.
A existência de duas cópias em plantas pode ser requerida para um aumento das funções
fisiológicas da enzima e para melhor regular o metabolismo da prolina nas condições
adversas.
Com o desenho dos iniciadores específicos, foi possível amplificar e
seqüenciar essa região do gene P5CS em uma ampla amostragem de indivíduos de
Schizolobium. Entretanto, apenas um pequeno nível de polimorfismo foi identificado e não
foi possível identificar uma correlação com estresse hídrico (Veja alinhamento Anexo I). A
maioria dos SNPs encontrados está localizada na região do íntron e somente dois grupos de
indivíduos foram encontrados: um contendo indivíduos da variedade parahyba (Mata
Atlântica) e o outro contendo indivíduos da variedade amazonicum (Floresta Amazônica).
Tendo em vista a falta de polimorfismo encontrado no gene P5CS, partiu-se para o estudo
da sistemática, biogeografia e filogeografia através de marcadores neutros.
119
Estudo de Sistemática Molecular, Biogeografia e filogeografia
Através de uma ampla amostragem de indivíduos de Schizolobium,
representado as duas zonas de ocorrência de ambas as variedades, foi possível verificar a
posição sistemática do gênero e dentro do grupo Peltophorum, e estimar a idade do
surgimento de gênero, verificar a monofilia e produzir dados moleculares para sugerir um
possível evento de especiação dentro do gênero, além de contribuir com informações
pertinentes no campo da conservação.
Um total de 10 regiões do cloroplasto e uma nuclear foram analizadas.
Destas, cinco regiões cpDNA e uma região nuclear foram polimórficas. Através delas foi
possível construir filogenias que permitiram verificar que o gênero Schizolobium é
monofilético e confirmar a sua posição dentro do grupo Peltophorum, como já havia sido
verificado em análises filogenéticas anteriores do grupo (Haston et al., 2003; Haston et al.,
2005).
A filogenia construída com sequências de ITS possibilitou verificar uma
separação entre populações da variedade parahyba (Mata Atlântica) e populações da
variedade amazonicum (Floresta Amazônica e América Central), com valores altos de
bootstrap e probabilidade posterior. Doze sítios polimórficos foram encontrados e destes
10 estão relacionados com a separação entre as duas variedades. Os espaçadores ITS1 e
ITS2 constituem uma valiosa fonte de caracteres moleculares usados para reconstruir
filogenias em plantas (Bessega et al., 2006; Hsiao et al., 1995; Nanni et al., 2004;
Schnabel et al., 2003; Whitcher, Wen, 2001).
Dentre as cinco regiões polimórficas do cloroplasto, quatro apresentaram
um sítio que mostra a separação entre as duas variedades, mas o curioso é que populações
120
da região da Bahia (Nordeste do Brasil) apresentaram o mesmo padrão neste sítio do que
aquelas populações da variedade amazonicum. Com isso, foi observado que as filogenias
construídas com os diferentes genomas (nuclear e do cloroplasto) apresentaram
incongruência e um caso de evolução reticulada pode ser observado. Esses resultados
levam a hipótese da existência de resíduos de polimorfismo ancestral (Comes, Abbott,
2001) e evolução convergente (Davis et al., 1998). Alguns exemplos de incongruências
entre os genomas nucleares e cpDNA foram identificados em plantas (Kim, Donoghue,
2008; Lihova et al., 2006; Morgan et al., 2009; Nishimoto et al., 2003; VanRaamsdonk et
al., 1997). No caso de Schizolobium, acredita-se na hipótese de retenção de polimorfismo
ancestral no genoma do cloroplasto, pois existem muitas evidências da existência de
conexões passadas entre as duas maiores florestas tropicais dos Neotrópicos: floresta
Atlântica e floresta Amazônica, ocorridas antes da última glaciação no período do
quaternário, no nordeste Brasileiro (Behling, 2002; Behling et al., 2000; Behling, Lichte,
1997; Cabanne et al., 2008). Acredita-se que nesta região as duas florestas mantinham
contato, além de serem identificadas zonas de refúgios interglaciais nesta região (Carnaval
et al., 2009; Carnaval, Moritz, 2008).
A análise do gene matK possibilitou estimar a idade do gênero Schizolobium
em aproximadamente 13 MY, indicando o surgimento no último Mioceno. Através do uso
das cinco regiões do cloroplasto combinadas (matK+ rpoB+rpoC1+trnL-F+psbA-trnH)
foi possível estimar a idade do clado que agrupa os indivíduos do sul e sudeste da Mata
Atlântica em aproximadamente 3 MY, sugerindo que este clado surgiu no final do
Plioceno. Os resultados indicam a presença de barreiras para o fluxo gênico (pólen e
semente) entre as duas florestas, o que pode ser explicado pela presença do Cerrado entre
elas. Na Mata Atlântica, pelos resultados revelados através dos dados nucleares, observa-se
121
que o fluxo de pólen é contínuo. Entretanto, pelos resultados dos dados de cpDNA,
observa-se uma barreira de fluxo de sementes entre o Sul/Sudeste e Nordeste da Mata
Atlântica. Os efeitos das mudanças paleogeográficas do Mioceno e do Plioceno na
especiação são relativamente bem conhecidas e estão relacionados com o surgimento de
barreiras e isolamento de muitas espécies (Coyne, Orr, 2004). Algumas espécies possuem a
capacidade de dispersão a longas distâncias, enquanto outras podem torna-se isoladas
originando novas espécies (Morrone, Crisci, 1995; Sanmartin et al., 2001).
Esse estudo possibilitou verificar diferentes padrões genéticos entre as duas
variedades, corroborando com os padrões morfológicos entre elas, assim como a sua
ocorrência disjunta. Além disso, os resultados poderão contribuir para o estudo evolutivo
das duas maiores biotas dos Neotrópicos: A Floresta Atlântica e Amazônica e auxiliar nos
esforços para a conservação genética nessas áreas.
Esse trabalho permitiu a identificação e interpretação dos padrões de
diversidade dos genomas nuclear e cloroplasto de Schizolobium, uma importante espécie
arbórea nativa de floretas Neotropicais, ao longo de uma ampla distribuição geográfica.
Indivíduos foram coletados dos mais diversos locais de ocorrência da mesma e a estrutura
geográfica da diversidade genética foi realizada. Um gene e dois espaçadores intergênicos
do cloroplasto e as regiões ribossomais ITS foram analisados em um grande número de
indivíduos de Schizolobium representando as duas variedades AM uma ampla área de
ocorrência. Os resultados apresentados na presente tese indicaram que a diversidade
intraspecífica do genoma do cloroplasto foi bem maior do que a encontrada para o genoma
nuclear e possivelmente haja um restrito fluxo gênico mediado pela semente em relação ao
fluxo de pólen, o que pode ser observado na baixa diversidade genética do cpDNA das
populações do Sul da Mata Atlântica (SC, PR1, PR2 e SP1), Colômbia (CO) e América
122
Central (CR e HO) em relação as demais populações. Esses dados corroboram com a
dispersão restrita observada para sementes anemocóricas.
Foram encontrados 21 haplótipos com a combinação dos espaçadores do
cloroplasto psbA-trnH+trnL-trnF e o gene matK, enquanto que com o ITS, apenas 4
haplótipos foram identificados. Desses 4 haplótipos, dois estão presentes em populações da
variedade parahyba (Mata Atlântica) e dois em populações da variedade amazonicum
(base da floresta Amazônica e América Central) e nenhum haplótipo foi compartilhado
entre as duas variedades. Uma separação bem consistente foi observada entre as duas
variedades com esse marcador, corroborando com a distribuição geográfica disjunta e as
diferenças na morfologia da flor. Além disso, os valores de FST foram altos (0,859). Os
haplótipos encontrados para o genoma do cloroplasto também não são compartilhados
entre as duas variedades, apesar de ser observada uma maior proximidade das populações
RJ3, ES (sudeste do Brasil) e BA1, BA2 e BA3 (nordeste do Brasil) com aquelas da
variedade amazonicum (base da Amazônia e América Central). Esse resultado não foi
observado com o genoma nuclear, o que indica que no passado possivelmente houve
contato entre as florestas Atlântica e Amazônica e que esse contato provavelmente ocorreu
próximo a Região Nordeste. Esses resultados estão de acordo com alguns trabalhos que
relatam as interconexões entre essas florestas antes dos eventos de mudanças climáticas
ocorridas no quaternário (Behling, 1995; Behling, 1998; Behling, 2002; Behling et al.,
2000; Behling, Lichte, 1997; Cabanne et al., 2008).
Ao contrário da baixa diversidade encontrada nas populações do Sul da
Mata Atlântica, da Colômbia e da América Central, um alto grau de diversidade foi
observado nas populações localizadas na região sudeste da Mata Atlântica (SP, ES, BA) e
na floresta Amazônica (AM2, MT), indicando que essas regiões possivelmente estão
123
relacionadas com zonas de refúgios. Na Mata Atlântica, trabalhos com espécies animais
têm demonstrado que a região de São Paulo e da Bahia correspondem a refúgios e
associadas com hotspots de conservação dentro do bioma (Carnaval et al., 2009; Carnaval,
Moritz, 2008).
124
Capítulo VI: Referências Bibliográficas dos Capítulos I e V
125
Referências Bibliográficas
Adami C, Hebling SA (2005) Efeitos de diferentes fontes de fósforo no crescimento inicial
de Schizolobium parahyba (Vell.) S. F. Blake. Natureza on line.
http://www.naturezaonline.com.br 3:13-18.
Alcantara S, Semir J, Solferini VN (2006) Low genetic structure in an epiphytic
Orchidaceae (Oncidium hookeri) in the Atlantic rainforest of south-eastern Brazil.
Annals of Botany 98:1207-1213.
Aleixo A, Burlamaqui T, Goncalves E, Schneider P (2006) Molecular systematics of the
Ocellated Woodcreeper complex (Dendrocolaptidae) in tropical South America:
Implications for taxonomy, conservation, and historical biogeography. Journal of
Ornithology 147:125-126.
Andrade IM, Mayo SJ, Van den Berg C, Fay MF, Chester M, Lexer C, Kirkup D (2007) A
preliminary study of genetic variation in populations of Monstera adansonii var.
klotzschiana (Araceae) from north-east brazil, estimated with AFLP molecular
markers. Annals of Botany 100:1143-1154.
Andre T, Lemes MR, Grogan J, Gribel R (2008) Post-logging loss of genetic diversity in a
mahogany (Swietenia macrophylla King, Meliaceae) population in Brazilian
Amazonia. Forest Ecology and Management 255:340-345.
Andreasen K (2005) Implications of molecular systematic analyses on the conservation of
rare and threatened taxa: Contrasting examples from Malvaceae. Conservation
Genetics 6:399-412.
Aoki K, Matsumura T, Hattori T, Murakami N (2006) Chloroplast DNA phylogeography
of Photinia glabra (Rosaceae) in Japan. American Journal of Botany 93:1852-1858.
Avise JC (2000) Phylogeography: the history and formation of species, Cambridge.
Barbara T, Martinelli G, Fay MF, Mayo SJ, Lexer C (2007) Population differentiation and
species cohesion in two closely related plants adapted to neotropical high-altitude
'inselbergs', Alcantarea imperialis and Alcantarea geniculata (Bromeliaceae).
Molecular Ecology 16:1981-1992.
Barneby RC (1996) Neotropical Fabales at NY: Asides and oversights. Brittonia 48:174187.
Bauert MR, Kaelin M, Edwards PJ, Baltisberger M (2007) Genetic structure and
phylogeography of alpine relict populations of Ranunculus pygmaeus and
Saxifraga cernua. Botanica Helvetica 117:181-196.
Behling H (1995) A high-resolution Holocene pollen record from Lago do Pires, SE Brazil
- Vegetation, climate and fire hystory. Journal of Paleolimnology 14:253-268.
Behling H (1998) Late Quaternary vegetational and climatic changes in Brazil. Review of
Palaeobotany and Palynology 99:143-156.
Behling H (2002) South and southeast Brazilian grasslands during Late Quaternary times:
a synthesis. Palaeogeography Palaeoclimatology Palaeoecology 177:19-27.
126
Behling H, Arz HW, Patzold J, Wefer G (2000) Late Quaternary vegetational and climate
dynamics in northeastern Brazil, inferences from marine core GeoB 3104-1.
Quaternary Science Reviews 19:981-994.
Behling H, Lichte M (1997) Evidence of dry and cold climatic conditions at glacial times
in tropical southeastern Brazil. Quaternary Research 48:348-358.
Bennett KD (2004) Continuing the debate on the role of Quaternary environmental change
for macroevolution. Philosophical Transactions of the Royal Society of London
Series B-Biological Sciences 359:295-303.
Bermingham E, Moritz C (1998) Comparative phylogeography: concepts and applications.
Molecular Ecology 7:367-369.
Bessega C, Vilardi JC, Saidman BO (2006) Genetic relationships among American species
of the genus Prosopis (Mimosoideae, Leguminosae) inferred from ITS sequences:
evidence for long-distance dispersal. Journal of Biogeography 33:1905-1915.
Bettin O, Cornejo C, Edwards PJ, Holderegger R (2007) Phylogeography of the high
alpine plant Senecio halleri (Asteraceae) in the European Alps: in situ glacial
survival with postglacial stepwise dispersal into peripheral areas. Molecular
Ecology 16:2517-2524.
Birky CW (1995) Uniparental inheritance of mitochondrial and chloroplast genes mechanisms and evolution. Proceedings of the National Academy of Sciences of the
United States of America 92:11331-11338.
Boon WM, Kearvell JC, Daugherty CH, Chambers GK (2000) Molecular systematics of
New Zealand Cyanoramphus parakeets: conservation of orange-fronted and Forbes'
Parakeets. Bird Conservation International 10:211-239.
Brown JH (1994) Species diversity in ecological communities – historical and
geographical perspectives. - Rickefs,RE, Schluter,D. Science 263:995-996.
Bruneau A, Forest F, Herendeen PS, Klitgaard BB, Lewis GP (2001) Phylogenetic
relationships in the Caesalpinioideae (Leguminosae) as inferred from chloroplast
trnL intron sequences. Systematic Botany 26:487-514.
Cabanne GS, d'Horta FM, Sari EHR, Santos FR, Miyaki CY (2008) Nuclear and
mitochondrial phylogeography of the Atlantic forest endemic Xiphorhynchus
fuscus (Aves: Dendrocolaptidae): Biogeography and systematics implications.
Molecular Phylogenetics and Evolution 49:760-773.
Canchignia-Martínes HF, Hernández-Delgado S, Gonzáles-Paz M, Motte E, Mayek-Pérez
N (2007) Genetic Relationships among Schizolobium parahybum (Vell.) Blake
(Leguminosae) Ecotypes from Ecuador and other Countries. Silvae Genetica 56.
Canchignia-Martinez HF, Hernandez-Delgado S, Gonzalez-Paz M, Motte E, Mayek-Perez
N (2007) Genetic relationships among Schizolobium parahybum (Vell.) blake
(Leguminosae) ecotypes from Ecuador and other countries. Silvae Genetica
56:214-221.
Cardoso SRS, Provan J, Lira CF, Pereira LDR, Ferreira PCG, Cardoso MA (2005) High
levels of genetic structuring as a result of population fragmentation in the tropical
127
tree species Caesalpinia echinata Lam. Biodiversity and Conservation 14:10471057.
Carnaval AC, Hickerson MJ, Haddad CFB, Rodrigues MT, Moritz C (2009) Stability
Predicts Genetic Diversity in the Brazilian Atlantic Forest Hotspot. Science
323:785-789.
Carnaval AC, Moritz C (2008) Historical climate modelling predicts patterns of current
biodiversity in the Brazilian Atlantic forest. Journal of Biogeography 35:11871201.
Carvalho PER (1994) Espécies florestais brasileiras: recomendações silviculturais,
potencialidades e uso da madeira., Colombo: Embrapa-CNPF edn., Colombo.
Cavers S, Degen B, Caron H, Lemes MR, Margis R, Salgueiro F, Lowe AJ (2005a)
Optimal sampling strategy for estimation of spatial genetic structure in tree
populations. Heredity 95:281-289.
Cavers S, Navarro C, Hopkins R, Ennos RA, Lowe AJ (2005b) Regional and populationscale influences on genetic diversity partitioning within costa rican populations of
the pioneer tree Vochysia ferruginea mart. Silvae Genetica 54:258-264.
Chen JM, Liu F, Wang QF, Motley TJ (2008a) Phylogeography of a marsh herb Sagittaria
trifolia (Alismataceae) in China inferred from cpDNA atpB-rbcL intergenic
spacers. Molecular Phylogenetics and Evolution 48:168-175.
Chen KM, Abbott RJ, Milne RI, Tian XM, Liu JQ (2008b) Phylogeography of Pinus
tabulaeformis Carr. (Pinaceae), a dominant species of coniferous forest in northern
China. Molecular Ecology 17:4276-4288.
Chen SY, Liu SW, Xu CH, Chen YZ, Xia GM (2004) Heredity of chloroplast and nuclear
genomes of asymmetric somatic hybrid lines between wheat and couch grass. Acta
Botanica Sinica 46:110-115.
Chen SY, Wu GL, Zhang DJ, Gao QB, Duan YZ, Zhang FQ, Chen SL (2008c) Molecular
phylogeography of alpine plant Metagentiana striata (Gentianaceae). Journal of
Systematics and Evolution 46:573-585.
Coelho RRP, Silva MTC, Bruno RLA, da Silva Santana JA (2006) Influência de substratos
na formação de mudas de guapuruvu (Schizolobium parahyba (Vell.) Blake).
Revista Ciência Agronômica 37:159-152.
Colpaert N, Cavers S, Bandou E, Caron H, Gheysen G, Lowe AJ (2005) Sampling tissue
for DNA analysis of trees: Trunk cambium as an alternative to canopy leaves.
Silvae Genetica 54:265-269.
Comes HP, Abbott RJ (2001) Molecular phylogeography, reticulation, and lineage sorting
in Mediterranean Senecio sect. Senecio (Asteraceae). Evolution 55:1943-1962.
Costa AM, Gobbi EL, Demuner VG, Hebling SA (2006) O efeito da inundação do solo
sobre o crescimento inicial de Schizolobium parahyba (Vell.) S.F. Blake,
guapuruvu. Natureza on line. http://www.naturezaonline.com.br 4:7-13.
Coyne JA, Orr HA (2004) Speciation. Sinauer Associates, Sunderland, MA.
128
Crepet WL, Taylor DW (1985) The diversification of the Leguminosae - 1ST fossil
evidence of the Mimosoideae and Papilonoideae. Science 228:1087-1089.
Crepet WL, Taylor DW (1986) Primitive Mimosoid flowers from the Paleocene-Eocene
and their systematic and evolutionary implications. American Journal of Botany
73:548-563.
Cruz ED, de Carvalho JEU, Barbosa Queiroz RJ (2007) Scarification with sulphuric acid
of Schizolobium amazonicum Huber ex Ducke seeds fabaceae. Scientia Agricola
64:308-313.
Davis JI, Simmons MP, Stevenson DW, Wendel JF (1998) Data decisiveness, data quality,
and incongruence in phylogenetic analysis: An example from the monocotyledons
using mitochondrial atpA sequences. Systematic Biology 47:282-310.
de Carvalho CJR (2005) Respostas de plantas de Schizolobium amazonicum [S. parahyba
var. amazonicum] e Schizolobium parahyba [Schizolobium parahybum] à
deficiência hídrica. Revista árvore 29:907-914.
de Carvalho MG, do Nascimento IA, de Carvalho AG (2008) 5-deoxyflavonoids and
lignan isolated from the wood of Schizolobium (Vell.) S.F. Blake (guapuruvu).
Quimica Nova 31:1349-1352.
Delauney AJ, Verma DPS (1993) Proline biosynthesis and osmoregulation in plants. Plant
Journal 4:215-223.
Dick CW, Abdul-Salim K, Bermingham E (2003) Molecular systematic analysis reveals
cryptic tertiary diversification of a widespread tropical rain forest tree. American
Naturalist 162:691-703.
Dick CW, Bermingham E, Lemes MR, Gribel R (2007) Extreme long-distance dispersal of
the lowland tropical rainforest tree Ceiba pentandra L. (Malvaceae) in Africa and
the Neotropics. Molecular Ecology 16:3039-3049.
Dick CW, Heuertz M (2008) The complex biogeographic history of a widespread tropical
tree species. Evolution 62:2760-2774.
Dick CW, Wright SJ (2005) Tropical mountain cradles of dry forest diversity. Proceedings
of the National Academy of Sciences of the United States of America 102:1075710758.
Dobes CH, Mitchell-Olds T, Koch MA (2004) Extensive chloroplast haplotype variation
indicates Pleistocene hybridization and radiation of North American Arabis
drummondii, A. x divaricarpa, and A-holboellii (Brassicaceae). Molecular Ecology
13:349-370.
Fant JB, Kamau E, Preston CD (2005) Chloroplast evidence for the multiple origins of the
hybrid Potamogeton x fluitans. Aquatic Botany 83:154-160.
Fant JB, Kamau EA, Preston CD (2003) Chloroplast evidence for the multiple origins of
the hybrid Potamogeton x sudermanicus Hagstr. Aquatic Botany 75:351-356.
Fehlberg SD, Ranker TA (2009) Evolutionary history and phylogeography of Encelia
farinosa (Asteraceae) from the Sonoran, Mojave, and Peninsular Deserts.
Molecular Phylogenetics and Evolution 50:326-335.
129
Filho ABG, Cordeiro IMCC, Alvarado JR, dos Santos Filho BG (2007) Produção de
Biomassa em Quatro Procedências de Paricá (Schizolobium parahyba var.
amazonicum (Huber ex Ducke) Barneby no Estádio de Muda. Revista Brasileira de
Biociências 5:1047-1049.
Freire JM, Piña-Rodrigues FCM, de Lima ER, Sodré SRC, Corrêa RX (2007) Estrutura
genética de populações de Schizolobium parahyba (Vell.) Blake (guapuruvu) por
meio de marcadores RAPD. Scientia Forestalis 74: 27-35.
Fujii N (2007) Chloroplast DNA phylogeography of Pedicularis ser. Gloriosae
(Orobanchaceae) in Japan. Journal of Plant Research 120:491-500.
Gardner MG, Hugall AF, Donnellan SC, Hutchinson MN, Foster R (2008) Molecular
systematics of social skinks: phylogeny and taxonomy of the Egernia group
(Reptilia: Scincidae). Zoological Journal of the Linnean Society 154:781-794.
Gompert Z, Nice CC, Fordyce JA, Forister ML, Shapiro AM (2006) Identifying units for
conservation using molecular systematics: the cautionary tale of the Karner blue
butterfly. Molecular Ecology 15:1759-1768.
Gong W, Chen C, Dobes C, Fu CX, Koch MA (2008) Phylogeography of a living fossil:
Pleistocene glaciations forced Ginkgo biloba L. (Ginkgoaceae) into two refuge
areas in China with limited subsequent postglacial expansion. Molecular
Phylogenetics and Evolution 48:1094-1105.
Haffer J, Prance GT (2001) Climatic forcing of evolution in Amazonia during the
Cenozoic: On the refuge theory of biotic differentiation. Amazoniana-Limnologia
Et Oecologia Regionalis Systemae Fluminis Amazonas 16:579-605.
Haston EM, Lewis GP, Hawkins JA (2003) Phylogenetic investigation of the Pelthoforum
group (Caesalpinieae: Leguminosae). In: Advances in Legume systematics (ed.
Royal Botanic Gardens K), pp. 149-159.
Haston EM, Lewis GP, Hawkins JA (2005) A phylogenetic reappraisal of the Peltophorum
group (Caesalpinieae : Leguminosae) based on the chloroplast trnL-F, rbcL and
rps16 sequence data. American Journal of Botany 92:1359-1371.
Heredeen PS, Crepet WL, Dilcher DL (1992) The fossil history of the Leguminosae:
phylogenetic and biogeographic implications. In: Advances in legume systematics
(ed. Royal Botanic Gardens K), pp. 303-316, London.
Hsiao C, Chatterton NJ, Asay KH, Jensen KB (1995) Molecular phylogeny of the Pooideae
(Poaceae) based on nuclear rDNA (ITS) sequences. Theoretical and Applied
Genetics 90:389-398.
Ikeda H, Setoguchi H (2007) Phylogeography and refugia of the Japanese endemic alpine
plant, Phyllodoce nipponica Makino (Ericaceae). Journal of Biogeography 34:169176.
Jimenez-Bremont JF, Becerra-Flora A, Hernandez-Lucero E, Rodriguez-Kessler M,
Acosta-Gallegos JA, Ramirez-Pimentel JG (2006) Proline accumulation in two
bean cultivars under salt stress and the effect of polyamines and ornithine. Biologia
Plantarum 50:763-766.
130
Kajita T, Ohashi H, Tateishi Y, Bailey CD, Doyle JJ (2001) rbcL and legume phylogeny,
with particular reference to Phaseoleae, Millettieae, and allies. Systematic Botany
26:515-536.
Kamau EM, Mayes S, Barrett JA (2003) Isolation and characterization of microsatellite
loci in Schizolobium parahyba (Leguminosae). Molecular Ecology Notes 3:469470.
Karehed J, Bremer B (2008) The systematics of Knoxieae (Rubiaceae) - molecular data
and their taxonomic consequences (vol 56, pg 1051, 2007). Taxon 57:668-668.
Karehed J, Groeninckx I, Dessein S, Motley TJ, Bremer B (2008) The phylogenetic utility
of chloroplast and nuclear DNA markers and the phylogeny of the Rubiaceae tribe
Spermacoceae. Molecular Phylogenetics and Evolution 49:843-866.
Kim ST, Donoghue MJ (2008) Incongruence between cpDNA and nrITS trees indicates
extensive hybridization within Eupersicaria (Polygonaceae). American Journal of
Botany 95:1122-1135.
Korpelainen H (2004) The evolutionary processes of mitochondrial and chloroplast
genomes differ from those of nuclear genomes. Naturwissenschaften 91:505-518.
Kremer A, Caron H, Cavers S, Colpaert N, Gheysen G, Gribel R, Lemes M, Lowe AJ,
Margis R, Navarro C, et al. (2005) Monitoring genetic diversity in tropical trees
with multilocus dominant markers. Heredity 95:274-280.
Kremer A, Reviron MP (2004) Dynamics and conservation of genetic diversity in forest
ecosystems. Forest Ecology and Management 197:1-2.
Ledru MP (1993) Late quaternary environmental and climatic changes in Central Brazil.
Quaternary Research 39:90-98.
Ledru MP, Salatino MLF, Ceccantini G, Salatino A, Pinheiro F, Pintaud JC (2007)
Regional assessment of the impact of climatic change on the distribution of a
tropical conifer in the lowlands of South America. Diversity and Distributions
13:761-771.
Leitão-Filho HF (1987) Considerações sobre a florística de florestas tropicais e subtropicais do Brasil. Instituto de Pesquisa de Estudos Florestais 35:41-46.
Lemes MR, Grattapaglia D, Grogan J, Proctor J, Gribel R (2007) Flexible mating system in
a logged population of Swietenia macrophylla King (Meliaceae): implications for
the management of a threatened neotropical tree species. Plant Ecology 192:169179.
Lemes MR, Gribel R, Proctor J, Grattapaglia D (2003) Population genetic structure of
mahogany (Swietenia macrophylla King, Meliaceae) across the Brazilian Amazon,
based on variation at microsatellite loci: implications for conservation. Molecular
Ecology 12:2875-2883.
Lewis G, Schrire B, MacKinder B, Lock M (2005) Legumes of the world Royal Botanic
Gardens, Kew edn.
131
Li EX, Yi S, Qiu YX, Guo JT, Comes HP, Fu CX (2008) Phylogeography of two East
Asian species in Croomia (Stemonaceae) inferred from chloroplast DNA and ISSR
fingerprinting variation. Molecular Phylogenetics and Evolution 49:702-714.
Lihova J, Shimizu KK, Marhold K (2006) Allopolyploid origin of Cardamine asarifolia
(Brassicaceae): Incongruence between plastid and nuclear ribosomal DNA
sequences solved by a single-copy nuclear gene. Molecular Phylogenetics and
Evolution 39:759-786.
Lira CF, Cardoso SRS, Ferreira PCG, Cardoso MA, Provan J (2003) Long-term population
isolation in the endangered tropical tree species Caesalpinia echinata Lam. revealed
by chloroplast microsatellites. Molecular Ecology 12:3219-3225.
Lister AM, Bennett KD, Dunbar RIM, Sheldon PR (2004) Continuing the debate on the
role of Quaternary environmental change for macroevolution - Discussion.
Philosophical Transactions of the Royal Society B-Biological Sciences 359:303303.
Liu JP, Ding L, Stevenson B, Zhu JK (1996) Regulation of proline accumulation and P5CS
gene expression in a salt-hypersensitive Arabidopsis mutant. Plant Physiology
111:725-725.
Locatelli M, Melo AS, de Lima LML, Vieira AH (2007) Deficiências Nutricionais em
Mudas de Schizolobium parahyba var. amazonicum. Revista Brasileira de
Biociências 5:648-650.
Lorenz-Lemke AP, Mader G, Muschner VC, Stehmann JR, Bonatto SL, Salzano FM,
Freitas LB (2006) Diversity and natural hybridization in a highly endemic species
of Petunia (Solanaceae): a molecular and ecological analysis. Molecular Ecology
15:4487-4497.
Lorenz-Lemke AP, Muschner VC, Bonatto SL, Cervi AC, Salzano FM, Freitas LB (2005)
Phylogeographic inferences concerning evolution of Brazilian Passiflora actinia
and P-elegans (Passifloraceae) based on ITS (nrDNA) variation. Annals of Botany
95:799-806.
Lovette IJ (2005) Glacial cycles and the tempo of avian speciation. Trends in Ecology &
Evolution 20:57-59.
Marcati CR, Milanez CRD, Machado SR (2008) Seasonal development of secondary
xylem and phloem in Schizolobium parahyba (Vell.) Blake (Leguminosae :
Caesalpinioideae). Trees-Structure and Function 22:3-12.
Margis R, Felix D, Caldas JF, Salgueiro F, De Araujo DSD, Breyne P, Van Montagu M,
De Oliveira D, Margis-Pinheiro M (2002) Genetic differentiation among three
neighboring Brazil-cherry (Eugenia uniflora L.) populations within the Brazilian
Atlantic rain forest. Biodiversity and Conservation 11:149-163.
Martin-Bravo S, Meimberg H, Luceno M, Markl W, Valcarcel V, Brauchler C, Vargas P,
Heubl G (2007) Molecular systematics and biogeography of Resedaceae based on
ITS and trnL-F sequences. Molecular Phylogenetics and Evolution 44:1105-1120.
McNeill J, Turland NJ (2009) The systematics of Knoxieae (Rubiaceae)-molecular data
and their taxonomic consequences (vol 56, pg 1051, 2007). Taxon 58:317-317.
132
Medri C, Ruas PM, Higa AR, Murakami M, Ruas CD (2003) Effects of forest management
on the genetic diversity in a population of Araucaria angustifolia (bert.) O. Kuntze.
Silvae Genetica 52:202-205.
Melo Marques TCLL, de Carvalho JG, Lacerda MPC, da Mota PEF (2004) Exigências
nutricionais do paricá (Schizolobium amazonicum, Herb.) na fase de muda. Cerne
10:167-183.
Mendes MM, Oliveira CF, Lopes DS, Vale LHF, Alcantara TM, Izidoro LFM, Hamaguchi
A, Homsi-Brandeburgo M, Soares AM, Rodrigues VM (2008) Anti-snake venom
properties of Schizolobium parahyba (Caesalpinoideae) aqueous leaves extract.
Phytotherapy Research 22:859-866.
Miller MJ, Bermingham E, Klicka J, Escalante P, Do Amaral FSR, Weir JT, Winker K
(2008) Out of Amazonia again and again: episodic crossing of the Andes promotes
diversification in a lowland forest flycatcher. Proceedings of the Royal Society BBiological Sciences 275:1133-1142.
Modliszewski JL, Thomas DT, Fan CZ, Crawford DJ, De Pamphilis CW, Xiang QY
(2006) Ancestral chloroplast polymorphism and historical secondary contact in a
broad hybrid zone of Aesculus (Sapindaceae). American Journal of Botany 93:377388.
Moraes PLR, Monteiro R, Vencovsky R (1999) Conservação genética de populações de
Cryptocarya moschata Nees (Laureaceae) na Mata Atlântica no estado de São
Paulo. Revista Brasileira de Botãnica 22:237-248.
Morelatto LPC (1991) Estudo da fenologia de árvores, arbustos e lianas de uma floresta
semi-decídua no sudeste do Brasil, Universidade Estadual de Campinas.
Morgan DR, Korn RL, Mugleston SL (2009) Insights into reticulate evolution in
machaerantherinae (Asteraceae: Astereae): 5S ribossomal RNA spacer variation,
estimating support for incongruence, and constructing reticulate phylogenies.
American Journal of Botany 96:920-932.
Moritz C (1995) Uses of molecular phylogenies for conservation. Philosophical
Transactions of the Royal Society of London Series B-Biological Sciences 349:113118.
Moritz C (2002) Strategies to protect biological diversity and the evolutionary processes
that sustain it. Systematic Biology 51:238-254.
Morrone JJ, Crisci JV (1995) Historical biogeography - introduction to methods. Annual
Review of Ecology and Systematics 26:373-401.
Myers N (2003) Biodiversity hotspots revisited. Bioscience 53:916-917.
Naciri Y, Gaudeul M (2007) Phylogeography of the endangered Eryngium alpinum L.
(Apiaceae) in the European Alps. Molecular Ecology 16:2721-2733.
Nagpal R, Dar TH, Raina SN (2008) Molecular systematics of Brassica and allied genera
in subtribes Brassicinae, Raphaninae, Moricandiinae, and Cakilinae (Brassicaceae,
tribe Brassiceae); the organization and evolution of ribosomal gene families.
Botanical Journal of the Linnean Society 157:545-557.
133
Nanni L, Ferradini N, Taffetani F, Papa R (2004) Molecular Phylogeny of Anthyllis spp.
Plant Biology 6:454-464.
Naumann RB, Vital BR, Carneiro ADO, Lucia RMD, Silva JD, Carvalho A, Colli A
(2008) Properties of foils manufactured with particles of wood of Eucalyptus
urophylla S. T. Blake and of Schizolobium amazonicum Herb. Revista Arvore
32:1143-1150.
Nishimoto Y, Ohnishi O, Hasegawa M (2003) Topological incongruence between nuclear
and chloroplast DNA trees suggesting hybridization in the urophyllum group of the
genus Fagopyrum (Polygonaceae). Genes & Genetic Systems 78:139-153.
Nunes F, Fukami H, Vollmer SV, Norris RD, Knowlton N (2008) Re-evaluation of the
systematics of the endemic corals of Brazil by molecular data. Coral Reefs 27:423432.
Ortiz MA, Tremetsberger K, Terrab A, Stuessy TF, Garcia-Castano JL, Urtubey E, Baeza
CM, Ruas CF, Gibbs PE, Talavera S (2008) Phylogeography of the invasive weed
Hypochaeris radicata (Asteraceae): from Moroccan origin to worldwide introduced
populations. Molecular Ecology 17:3654-3667.
Peterson A, Levichev IG, Peterson J (2008) Systematics of Gagea and Lloydia (Liliaceae)
and infrageneric classification of Gagea based on molecular and morphological
data. Molecular Phylogenetics and Evolution 46:446-465.
Petit RJ, Hu FS, Dick CW (2008) Forests of the past: A window to future changes. Science
320:1450-1452.
Pietrobom RCV, Oliveira DMT (2004) Morfoanatomia e ontogênese do pericarpo de
Schizolobium parahyba (Vell.) Blake (Fabaceae, Caesalpinioideae). Revista
Brasileira de botânica 27.
Prado DE, Gibbs PE (1993) Patterns of species distributions in the dry seasonal forests of
South-America. Annals of the Missouri Botanical Garden 80:902-927.
Prance GT (1973) Phytogeographic support for the theory of Pleistocene forest refuges in
the Amazon Basin, based upon evidence from distribution pattern in
Caryocaraceae, Chrysobalanaceae, Dichapetalaceae and Lecythidaceae. Acta
Amazon 3:5-28.
Ramos ACS, De Lemos JP, Lovato MB (2009) Phylogeographical Structure of the
Neotropical Forest Tree Hymenaea courbaril (Leguminosae: Caesalpinioideae) and
Its Relationship with the Vicariant Hymenaea stigonocarpa from Cerrado. Journal
of Heredity 100:206-216.
Redondo RAF, Brina LPS, Silva RF, Ditchfield AD, Santos FR (2008) Molecular
systematics of the genus Artibeus (Chiroptera: Phyllostomidae). Molecular
Phylogenetics and Evolution 49:44-58.
Richardson JE, Pennington RT, Pennington TD, Hollingsworth PM (2001) Rapid
diversification of a species-rich genus of neotropical rain forest trees. Science
293:2242-2245.
Ronikier M, Costa A, Aguilar JF, Feliner GN, Kupfer P, Mirek Z (2008) Phylogeography
of Pulsatilla vernalis (L.) Mill. (Ranunculaceae): chloroplast DNA reveals two
134
evolutionary lineages across central Europe and Scandinavia. Journal of
Biogeography 35:1650-1664.
Rull V (2008) Speciation timing and neotropical biodiversity: the Tertiary-Quaternary
debate in the light of molecular phylogenetic evidence. Molecular Ecology
17:2722-2729.
Salgueiro F, Felix D, Caldas JF, Margis-Pinheiro M, Margis R (2004) Even population
differentiation for maternal and biparental gene markers in Eugenia uniflora, a
widely distributed species from the Brazilian coastal Atlantic rain forest. Diversity
and Distributions 10:201-210.
Sanmartin I, Enghoff H, Ronquist F (2001) Patterns of animal dispersal, vicariance and
diversification in the Holarctic. Biological Journal of the Linnean Society 73:345390.
Schnabel A, McDonel PE, Wendel JF (2003) Phylogenetic relationships in Gleditsia
(Leguminosae) based on ITS sequences. American Journal of Botany 90:310-320.
Silva-Ortega CO, Ochoa-Alfaro AE, Reyes-Aguero JA, Aguado-Santacruz GA, JimenezBremont JF (2008) Salt stress increases the expression of p5cs gene and induces
proline accumulation in cactus pear. Plant Physiology and Biochemistry 46:82-92.
Soares VP, Zaneti LZ, Santos NT, Leite HG (2008) Analysis of the spatial distribution of
buzzers (Quesada gigas Oliver) in parica stands (Schizolobium amazonicum Huber
ex Ducke) in Dom Eliseu - PA. Revista Arvore 32:251-258.
Soltis ED, Soltis PS (2000) Contributions of plant molecular systematics to studies of
molecular evolution. Plant Molecular Biology 42:45-75.
Soltis PS, Gitzendanner MA (1999) Molecular systematics and the conservation of rare
species. Conservation Biology 13:471-483.
Stahlberg D, Hedren M (2008) Systematics and phylogeography of the Dactylorhiza
maculata complex (Orchidaceae) in Scandinavia: insights from cytological,
morphological and molecular data. Plant Systematics and Evolution 273:107-132.
Strizhov N, Abraham E, Okresz L, Blickling S, Zilberstein A, Schell J, Koncz C, Szabados
L (1997) Differential expression of two P5CS genes controlling proline
accumulation during salt-stress requires ABA and is regulated by ABA1, ABI1 and
AXR2 in Arabidopsis. Plant Journal 12:557-569.
Tan B, Liu K, Yue XL, Liu F, Chen JM, Wang QF (2008) Chloroplast DNA variation and
phylogeographic patterns in the Chinese endemic marsh herb Sagittaria
potamogetifolia. Aquatic Botany 89:372-378.
Thomas WW (1999) Conservation and monographic research on the flora of Tropical
America. Biodiversity and Conservation 8:1007-1015.
Torres-Perez F, Mendez MA, Benavides E, Moreno RA, Lamborot M, Palma RE, Ortiz JC
(2009) Systematics and evolutionary relationships of the mountain lizard
Liolaemus monticola (Liolaemini): how morphological and molecular evidence
contributes to reveal hidden species diversity. Biological Journal of the Linnean
Society 96:635-650.
135
Tovar-Sanchez E, Mussali-Galante P, Esteban-Jimenez R, Pinero D, Arias DM, Dorado O,
Oyama K (2008) Chloroplast DNA polymorphism reveals geographic structure and
introgression in the Quercus crassifolia x Quercus crassipes hybrid complex in
Mexico. Botany-Botanique 86:228-239.
Turchetto-Zolet AC, Margis-Pinheiro M, Margis R (2009) The evolution of pyrroline-5carboxylate synthase in plants: a key enzyme in proline synthesis. Molecular
Genetics and Genomics 281:87-97.
Vale LHF, Mendes MM, Hamaguchi A, Soares AM, Rodrigues VM, Homsi-Brandeburgo
MI (2008) Neutralization of pharmacological and toxic activities of Bothrops snake
venoms by Schizolobium parahyba (Fabaceae) aqueous extract and its fractions.
Basic & Clinical Pharmacology & Toxicology 103:104-107.
VanRaamsdonk LWD, Smiech MP, Sandbrink JM (1997) Introgression explains
incongruence between nuclear and chloroplast DNA-based phylogenies in Allium
section Cepa. Botanical Journal of the Linnean Society 123:91-108.
Veron G, Rosenthal SH, Long B, Roberton S (2004) The molecular systematics and
conservation of an endangered carnivore, the Owston's palm civet Chrotogale
owstoni (Thomas, 1912) (Carnivora, Viverridae, Hemigalinae). Animal
Conservation 7:107-112.
Weising K, Freitag H (2007) Phylogeography of halophytes from European coastal and
inland habitats. Zoologischer Anzeiger 246:279-292.
Whitcher IN, Wen J (2001) Phylogeny and biogeography of Corylus (Betulaceae):
Inferences from ITS sequences. Systematic Botany 26:283-298.
Yamaji H, Fukuda T, Yokoyama J, Pak JH, Zhou CZ, Yang CS, Kondo K, Morota T,
Takeda S, Sasaki H, et al. (2007) Reticulate evolution and phylogeography in
Asarum sect. Asiasarum (Aristolochiaceae) documented in internal transcribed
spacer sequences (ITS) of nuclear ribosomal DNA. Molecular Phylogenetics and
Evolution 44:863-884.
Yamchi A, Jazii FR, Mousavi A, Karkhane AA (2007) Proline accumulation in transgenic
tobacco as a result of expression of Arabidopsis Delta(1)-pyrroline-5-carboxylate
synthetase (P5CS) during osmotic stress. Journal of Plant Biochemistry and
Biotechnology 16:9-15.
Young KR (1996) Species diversity in ecological communities: Historical and
geographical perspectives - Ricklefs,RE, Schluter,D. Annals of the Association of
American Geographers 86:150-153.
Yuan QJ, Zhang ZY, Peng H, Ge S (2008) Chloroplast phylogeography of Dipentodon
(Dipentodontaceae) in southwest China and northern Vietnam. Molecular Ecology
17:1054-1065.
Zanuncio JC, Pereira FF, Zanuncio TV, Martinelli NM, Pinon TBM, Guimaraes EM
(2004) Occurrence of Quesada gigas on Schizolobium amazonicum trees in
Maranhao and Para States, Brazil. Pesquisa Agropecuaria Brasileira 39:943-945.
136
ANEXO I
1
20
40
60
80
100
P5CS2_SC03GGGATATTTT
P5CS2_SC10..........
P5CS2_PR04..........
P5CS2_SP15..........
P5CS2_MG03..........
P5CS2_RJ09..........
P5CS2_RJ20..........
P5CS2_RJ39..........
P5CS2_BA02..........
P5CS2_BA08..........
P5CS2_BA13..........
P5CS2_MT10..........
P5CS2_MT17..........
P5CS2_AM01..........
P5CS2_AM03..........
P5CS2_AM04..........
GGGACAATGA
..........
..........
..........
..........
..........
..........
..........
..........
..........
..........
..........
..........
..........
..........
..........
CAGTTTATCA
..........
..........
..........
..........
..........
..........
..........
..........
..........
..........
..........
..........
..........
..........
..........
GCTTTATTGG
..........
..........
..........
..........
..........
..........
..........
..........
..........
..........
..........
..........
..........
..........
..........
CCTTGGAGTT
..........
..........
..........
..........
..........
..........
..........
..........
..........
..........
..........
..........
..........
..........
..........
AAAAGCTGAT
..........
..........
..........
..........
..........
..........
..........
..........
..........
..........
..........
..........
..........
..........
..........
CTTCTTGTTC
..........
..........
..........
..........
..........
..........
..........
..........
..........
..........
..........
..........
..........
..........
..........
TGTTGAGTGA
..........
..........
..........
..........
..........
..........
..........
..........
..........
..........
..........
..........
..........
..........
..........
TGTGGACGGT
..........
..........
..........
..........
..........
..........
..........
..........
..........
..........
C.........
C.........
C.........
C.........
C.........
CTTTATAGT
.........
.........
.........
.........
.........
.........
.........
.........
.........
.........
.........
.........
.........
.........
.........
GGCCCTCCAA
..........
..........
..........
..........
..........
..........
..........
..........
..........
..........
..........
..........
..........
..........
..........
GTGACCCGCA
..........
..........
..........
..........
..........
..........
..........
..........
..........
..........
..........
..........
..........
..........
..........
CTCAAAGCTT
..........
..........
..........
..........
..........
..........
..........
..........
..........
..........
..........
..........
..........
..........
..........
ATTCATACAT
..........
..........
..........
..........
..........
..........
..........
..........
..........
..........
..........
..........
..........
..........
..........
ATATCAAGGA
..........
..........
..........
..........
..........
..........
..........
..........
..........
..........
..........
..........
..........
..........
..........
GAGGCATCAG
..........
..........
..........
..........
..........
..........
..........
..........
..........
..........
..........
..........
..........
..........
..........
AATAAAATTA
..........
..........
..........
..........
..........
..........
..........
..........
..........
..........
..........
..........
..........
..........
..........
CTTTTGGAGA
..........
..........
..........
..........
..........
..........
..........
..........
..........
..........
..........
..........
..........
..........
..........
CAAGTCTAGG
..........
..........
..........
..........
..........
..........
..........
..........
..........
..........
..........
..........
..........
..........
..........
GTGGGAAGA
.........
.........
.........
.........
.........
.........
.........
.........
.........
.........
.........
.........
.........
.........
.........
GGTGGAATGA
..........
..........
..........
..........
..........
..........
..........
..........
..........
..........
..........
..........
..........
..........
..........
CTGCCAAAGT
..........
..........
..........
..........
..........
..........
..........
..........
..........
..........
..........
..........
..........
..........
..........
AAAAGCTTCT
..........
..........
..........
..........
..........
..........
..........
..........
..........
..........
..........
..........
..........
..........
..........
GTAAATGCAG
..........
..........
..........
..........
..........
..........
..........
..........
..........
..........
..........
..........
..........
..........
..........
CTGAAGCTGG
..........
..........
..........
..........
..........
..........
..........
..........
..........
..........
..........
..........
..........
..........
..........
CATTCCTGTT
..........
..........
..........
..........
..........
..........
..........
..........
..........
..........
..........
..........
..........
..........
..........
ATTGTTACCA
..........
..........
..........
..........
..........
..........
..........
..........
..........
..........
..........
..........
..........
..........
..........
GGTTCACTAT
..........
..........
..........
..........
..........
..........
..........
..........
..........
..........
..........
..........
..........
..........
..........
TATACTATTT
..........
..........
..........
..........
..........
..........
..........
..........
..........
..........
..........
..........
..........
..........
..........
TGTGTGGTT
.........
.........
.........
.........
.........
.........
.........
.........
.........
.........
.........
.........
.........
.........
.........
CACTGAGGAA
..........
..........
..........
..........
..........
..........
..........
..........
..........
..........
..........
..........
..........
..........
..........
CATTGAAACT
..........
..........
..........
..........
..........
..........
..........
..........
..........
..........
...C......
...C......
...C......
...C......
...C......
TAACATAGCT
..........
..........
..........
..........
..........
..........
..........
..........
..........
..........
G.........
G.........
G.........
G.........
G.........
TTTGTTATAG
..........
..........
..........
..........
..........
..........
..........
..........
..........
..........
..........
..........
..........
..........
..........
CATTCTTCAA
..........
..........
..........
..........
..........
..........
..........
..........
..........
..........
..........
..........
..........
..........
..........
AATTATAATT
..........
..........
..........
..........
..........
..........
..........
..........
..........
..........
..........
..........
..........
..........
..........
GAAGTAATAA
..........
..........
..........
..........
..........
..........
..........
..........
..........
..........
..........
..........
..........
..........
..........
TTGTTTTCCC
..........
..........
..........
..........
..........
..........
..........
..........
..........
..........
..........
..........
..........
..........
..........
TCTTTATGTT
..........
..........
..........
..........
..........
..........
..........
..........
..........
..........
..........
..........
..........
..........
..........
TTTGACTAA
.........
.........
.........
.........
.........
.........
.........
.........
.........
.........
.........
.........
.........
.........
.........
AGCAGTTTTC
..........
..........
..........
..........
..........
..........
..........
..........
TTTGTATCCC
..........
..........
..........
..........
..........
..........
..........
..........
ATCTTCGCTA
..........
..........
..........
..........
..........
..........
..........
..........
AGAAATAAGT
..........
..........
..........
..........
..........
..........
..........
..........
TATTTAGAAA
..........
..........
..........
..........
..........
..........
..........
..........
TGAGAGGCCA
..........
..........
..........
..........
..........
..........
..........
..........
TGACTTGTAG
..........
..........
..........
..........
..........
..........
..........
..........
ACACCCTAAA
..........
..........
..........
..........
..........
..........
..........
..........
GTCCAATTTC
..........
..........
..........
..........
..........
..........
..........
..........
AGAAAACCA
.........
.........
.........
.........
.........
.........
.........
.........
137
..........
..........
..........
..........
..........
..........
..........
..........
..........
....C.....
....C.....
....C.....
....C.....
....C.....
..........
..........
..........
..........
..........
..........
..........
..........
..........
..........
..........
..........
..........
..........
..........
..........
.G........
.G........
.G........
.G........
.G........
..........
..........
..........
..........
..........
..........
..........
..........
..........
..........
..........
..........
..........
..........
..........
..........
..........
..........
..........
..........
..........
..........
..........
..........
..........
..........
..........
..........
.........
.........
.........
.........
.........
.........
.........
CAAGCAAGTT
..........
..........
..........
..........
..........
..........
..........
..........
..........
..........
..........
..........
..........
..........
..........
CAAAAAAGGA
..........
..........
..........
..........
..........
..........
..........
..........
..........
..........
..........
..........
..........
..........
..........
GAGTAAGAAA
..........
..........
..........
..........
..........
..........
..........
..........
..........
..........
..........
..........
..........
..........
..........
TAAAAAGGAA
..........
..........
..........
..........
..........
..........
..........
..........
..........
..........
.......A..
.......A..
.......A..
.......A..
.......A..
AAGCTATCAA
..........
..........
..........
..........
..........
..........
..........
..........
..........
..........
..........
..........
..........
..........
..........
ATTAATCTGC
..........
..........
..........
..........
..........
..........
..........
..........
..........
..........
..........
..........
..........
..........
..........
ATGCAGTTAT
..........
..........
..........
..........
..........
..........
..........
..........
..........
..........
..........
..........
..........
..........
..........
CTGATTTGTT
..........
..........
..........
..........
..........
..........
..........
..........
..........
..........
..........
..........
..........
..........
..........
ATCCTATGAC
..........
..........
..........
..........
..........
..........
..........
..........
..........
..........
..........
..........
..........
..........
..........
GTATCTATC
.........
.........
.........
.........
.........
.........
.........
.........
.........
.........
.........
.........
.........
.........
.........
TTCCTCTTTT
..........
..........
..........
..........
..........
..........
..........
..........
..........
..........
..........
..........
..........
..........
..........
TATGTCTTCT
..........
..........
..........
..........
..........
..........
..........
..........
..........
..........
..........
..........
..........
..........
..........
TGCCTACGAT
..........
..........
..........
..........
..........
..........
..........
..........
..........
..........
..........
..........
..........
..........
..........
AAATTGATTT
..........
..........
..........
..........
..........
..........
..........
..........
..........
..........
.......G.A
.......G.A
.......G.A
.......G.A
.......G.A
AGTAAATTTT
..........
..........
..........
..........
..........
..........
..........
..........
..........
..........
..........
..........
..........
..........
..........
CACTTTTTAT
..........
..........
..........
..........
..........
..........
..........
..........
..........
..........
..T....C..
..T....C..
..T....C..
..T....C..
..T....C..
TTCAGTATGT
..........
..........
..........
..........
..........
..........
..........
..........
..........
..........
..........
..........
..........
..........
..........
ATGTGTATGT
..........
..........
..........
..........
..........
..........
..........
..........
..........
..........
..........
..........
..........
..........
..........
G
.
.
.
.
.
.
.
.
.
.
.
.
.
.
.
Fig. 1. Alinhamento do exon 5 e intron 6 do gene P5CS2, mostrando os polimorfismos
encontrados entre indivíduos de Schizolobium de diferentes localidades. A caixa vermelha
indica o início do íntron 6.
138
Baixar