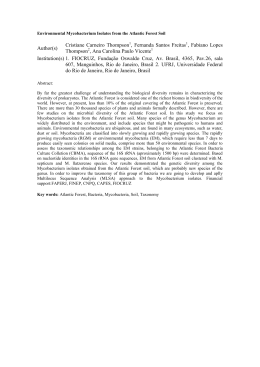
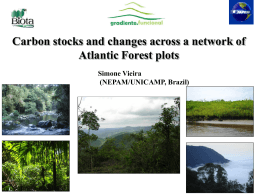
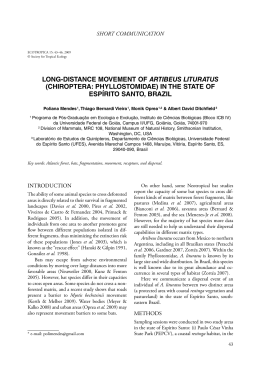
Research Letters
Brazilian Journal of Nature Conservation
Natureza & Conservação 11(2):158-169, December 2013
Copyright© 2013 ABECO
Handling Editor: Pedro Brancalion
http://dx.doi.org/10.4322/natcon.2013.025
Site Selection for Restoration Planning: A Protocol With
Landscape and Legislation Based Alternatives
Verônica F. Gama1, Alexandre C. Martensen2,3, Flávio J. Ponzoni4,
Márcia M. Hirota5 & Milton C. Ribeiro6
1
The Ecology Centre, The University of Queensland – UQ, St Lucia, Queensland, Australia
2
Taki Ambiental, Ribeirão Grande, SP, Brasil
3
Department of Ecology & Evolutionary Biology, University of Toronto – U of T, Toronto, ON, Canada
4
Remote Sensing Division, National Institute for Space Research – INPE, São José dos Campos, SP, Brazil
5
Fundação SOS Mata Atlântica, São Paulo, SP, Brazil
6
Spatial Ecology and Conservation Lab – LEEC, Department of Ecology, São Paulo State University – UNESP,
Rio Claro, SP, Brazil
Abstract
Selecting sites for ecological restoration is an imperative, although challenging task. We developed a spatially explicit model to
support site design and prioritization towards ecological restoration. We considered seven distinct and flexible templates, two
based on legislation requirements and five on landscape spatial parameters, such as corridor design, enhancements in patch
size and shape, and proximity to larger sources areas, thus, with different resilience capacities. We tested the approach on two
different scales of analysis: applying the legislation based templates in the Atlantic Plateau of São Paulo, which is part of the
Atlantic Forest biome, and the landscape based templates in one of its sub-watersheds (~150,000 ha), and then calculated
landscape indexes to compare the current forest configuration to the resulted simulated restored ones. We showed that our
protocol is flexible, transparent and repeatable, thus, could help in decision making towards conservation management.
Key words: Restoration Planning, Connectivity, Fragment Size, Site Selection, Spatially Explicit Simulations.
Introduction
Habitat loss, fragmentation and degradation are driving
species to extinction (Butchart et al. 2010) and compromising
the maintenance of ecosystems functions and services
worldwide (Garcia & Martinez 2012; Lovett et al. 2005).
Various management strategies have been suggested to
overcome these major threats, and ecological restoration
is one of the most relevant, although expensive, and with
variable results (Lamb et al. 2005; Benayas et al. 2009).
Most of the degraded landscapes are mosaics of different
land uses and patches of native habitats. The effectiveness
of restoring key ecological functions in these heterogeneous
environments depends on the capacity of restored habitats
to complement existing ones (Lamb et al. 2005). Thus, the
question practitioners frequently face is: which part and
proportion of the landscape should be reforested, especially
when the budget is limited?
*Send correspondence to: Verônica Fernandes Gama
The Ecology Centre, The University of Queensland – UQ, St
Lucia, Queensland 4072, Australia
E-mail: [email protected]
In modified landscapes, the spatial arrangement of restoration
initiatives influences species conservation status (Bell et al.
1997; Gilbert-Norton et al. 2009). Spatial features such as
fragment size, connectivity, edge effects and their relative
locations to one another are all important drivers of species
richness, abundance and composition (Saunders et al. 1991;
Andrén 1994; Martensen et al. 2012). Fragment size is directly
related to population size, and consequently to population
viability. Connectivity is a key factor in the maintenance of
individuals in fragmented habitats (Martensen et al. 2008),
as well as in (re)colonization dynamics (Gilbert-Norton et al.
2009), and is consequently relevant for metapopulation
persistence. Edge effects are known to reduce the amounts
of available habitat within a given patch for sensitive species
(Bergès et al. 2013), although fragment edges promote
important exchanges of individuals, seeds, propagules and
nutrients, which ultimately influence resilience/regeneration
around patches (Holl & Aide 2011).
Researchers have recently started to incorporate the landscape
spatial arrangement when trying to allocate and design sites
159
Site Selection for Restoration Planning
for ecological restoration (Twedt et al. 2006; Thomson et al.
2009; Tambosi & Metzger 2013; Echeverria et al. 2013,
Tambosi et al. in press). Usually the main proposed strategies
are: i. increasing patch size, taking advantage of higher
resilience adjacent to remaining habitats (Holl & Aide
2011); ii. incrementing patch connectivity (Metzger et al.
2008; Tambosi et al. in press); or iii. prioritizing restoration
in compliance with environmental legislation (Metzger
2003, 2010; Rodrigues et al. 2009, 2011).
However, there are few spatially explicit tools to pinpoint
the precise locations for restoration projects, so scientific
knowledge is often not applied in “on the ground” restoration
projects. To our knowledge none of these available tools
can assist restoration planning at multiple scales (but see
Tambosi & Metzger 2013) with a variety of restoration
options such as corridors and/or enlarging existing patches
and/or using riparian areas. For example: The Corridor
Designer (Majka et al. 2007) selects sites for designing
corridors only. Moreover, some tools are available for site
selection towards conservation, such as GUIDOS, which
highlights existing corridors or corridor zones (Joint
Research Center – European Commission 2011). However
none of them allow the users to explore different restoration
strategies, which is a common task in restoration projects.
To fill this gap, we proposed a multi-option protocol that
integrates a set of simple rules, as well as geoprocessing
techniques, in order to assist restoration planning to (1)
design restoration sites, and to (2) prioritize them in terms
of importance according to spatial structure relevance.
To explore the possibilities of the proposed protocol we
conducted a case study in the Atlantic Plateau of São
Paulo. It is an interesting region to test this protocol, since
it holds the largest remaining tract of Atlantic Forest, as
well as a myriad of smaller patches. Many of these smaller
fragments surround that large one, acting as both buffer
zones to mitigate the surrounding impacts on the larger
protected area as well as receiving the benefits of being
closely located to this large forest tract (Martensen 2008).
This means that restoring native habitats in the region could
increase the potential of the local Nature Reserves to act as
source-areas and consequently maintain biodiversity in the
more degraded surrounding landscapes. We investigated
the state of conservation of the region regarding the former
Brazilian Forest Act with maps of the year 2005 and then
selected one of its sub-watersheds to simulate and compare
different restoration strategies.
The Proposed Protocol
The first step in any prioritization exercise is to define clear
objectives regarding the expected outcomes, based on an
available budget. Our proposed protocol is fully spatially
explicit, entirely based in Geographical Information System
(GIS), thus the visualization of the different strategies helps
to identify the adequacy to the objectives. We suggest
seven basic criteria for site designing to be used separately
or sequentially in order to: i) comply with the former
Brazilian environmental legislation (Forest Act - 4.771
15/1965), and ii) enhance landscape structure features,
such as improving connectivity by restoring corridors and/
or increasing fragment areas.
Scenario description and calculations
The main input data is a vector map composed of two
classes, habitat and non-habitat. Thus, we assume that
everything that is not habitat is restorable, which is clearly
a simplification of real landscapes, since urban areas or
roads, are usually not possible to be restored. Secondly,
we add as attributes for each fragment a unique patch ID
and its respective area.
Legislation-based criteria
While our protocol is flexible enough to represent different
legislation alternatives, we opted to apply the former
Brazilian Forest Act (4.771 15/1965) for two main reasons:
i) to analyze the compliance with the former legislation;
and ii) because the current legislation defines the amount
of native habitat that should be preserved based on different
characteristics of the private properties, for example their
sizes, and this information is still largely unavailable, at
least before the universality of the Rural Environmental
Cadaster (Cadastro Ambiental Rural - CAR).
The Brazilian Forest Act defines two groups of areas
that should be preserved: the (a) Permanent Protected
Areas - PPAs and (b) Legal Reserves - LRs. The PPAs include
riparian areas along rivers, water springs, steep terrains
(> 45°), and high elevations (> 1800 m, details Table S1).
The LRs denote areas designated for conservation or forest
management that should cover a percentage each private
property, excluding the PPAs. This percentage varies among
the Brazilian biomes, and in the Atlantic Forest is 20%,
except for family owned properties whose amount could
be calculated considering the PPAs, or other types of low
intensive land-uses, such as orchard (CONAMA 2010).
Although our protocol is based in the former environmental
legislation, it is flexible enough to be adequate to the current
one, as far as the CAR information becomes available.
In order to generate the PPAs template we used five input
maps: drainage, hydrography and dams for the PPAs of
rivers, lakes and reservoirs, and elevation and slope for
the PPAs above 1800 m of altitude and of steep terrains
(slope > 45°). Then, the PPAs map is superimposed with
the original forest cover map, and the non-overlapping
polygons are set as “degraded PPAs”, which alone can be
used to guide actions. Moreover, to define the Legal Reserves
(LRs), two other maps are required, the Strictly Protected
Nature Reserves (NRs) and the map of the extent for which
we want to select areas to dispose the LRs. Maps of private
properties boundaries are usually unavailable (see above)
so as supported by the law. So we suggest calculating the
Gama et al.
Natureza & Conservação 11(2):158-169, December 2013
proportion of land to be preserved as LRs out of a larger
region (e.g. the watershed), and latter pinpointing restoration
spots based on the landscape-based criteria described below.
Additionally, the current legislation defines that the LRs
could be set in any place within the biome. Although this
procedure could be conducted in a much broader scale, we
recommend a different type of analyzes for such a broad
scale (e.g. Tambosi et al. in press). Since all areas except
PPAs and NRs are possible candidates for LRs, the PPAs
map is also needed.
each pair of fragments separated by no more than the
maximum selected Euclidian distance. Each point should
receive a unique ID and a buffer slightly larger than the
previous one should be done around those points. This will
ensure that all generated circles intersect at least two forest
patches. Again isolate the intersections of these buffers
with the fragments and generate points from each of their
centroids intersections. Each pair (or group) of points
generated from the same buffer will be assign the same
ID. Then, create lines linking the points with the same ID.
These lines are the corridors, which will be widened with a
buffer half the size of the defined corridor width. Last, the
overlaps of the corridors with the patches must be erased,
and the desired attributes can be added to each corridor.
We suggest: Corridor ID, area, IDs of the two patches it
connects, sum of the areas of these two patches, ID of the
group of connected fragments and the corridor itself, and
area of this newly structurally linked cluster of fragments.
When more than one corridor is generated between same
patches, the larger one should be erased.
160
Landscape-based criteria
Landscape-based criteria encompass five potential templates,
which can be used alone or combined in a chosen sequence
until the defined target is achieved (e.g. species is wellpreserved, or fragments are structurally connected) and/
or the restoration constraint (budget or time) is reached.
They can be divided in three categories: i) predominantly
improving connectivity; ii) predominantly improving
fragment size; and iii) enhancing connectivity and fragment
size/core area. These options are: (a) to create corridors
with fixed width, (b) enhanced connections, (c) corridors
using Permanent Preservation Areas, (d) resilience zones
and (e) enlarge forest patches.
The different biological attributes used to characterize
the landscape based templates, for example, corridor
use according to its width, or species dispersal capacities
should be based on available biological data. For example,
the functional connectivity, which encompasses species’
biological response to landscape structures (Wiens 1997),
could be different of the exclusively structural one. For
instance, for a given species that is able to cross certain
distance between patches, fragments that are located
within this distance, although not structurally connected,
are functionally connected for this particular species
(Martensen et al. 2008). In cases where biological data is
not available, a range of values could be used and sensitivity
analyses should be performed to investigate variability in
the results.
One of the values to be defined by the users is the search
distance to structurally link fragments. To create the template
of corridors with fixed width, the user should first define
the maximum Euclidian distance to be searched from the
fragments. Each fragment will then be linked by corridors
to its neighbor fragments which are within this chosen
distance. This maximum search distance will be the maximum
length of the corridors. The width of the corridors should
also be user defined, and both values for length and width
should preferentially be chosen with biological information
as support. To process those corridors, buffers of half the
size of the selected Euclidian distance should be generated,
without dissolving the polygons. Then, a new map should
be generated, only with the intersections between these
buffers. Latter, the centroid of these intersections should
be converted to points, which will be halfway between
From another side, structurally linked fragments, could
not be functionally linked in cases where the target species
does not use corridors or any area with short width. This
can also be conceived for fragments that are short distance
apart from each other, and thus, are functionally connected
for some species, while isolated for others. In these cases,
the user might want to Enhance the connections between
these fragments by only selecting the ones for which wide
connections are possible. These corridors result from two
main steps: (1) Considering a cluster of fragments at a
certain maximum search distance, make a buffer around
these fragments, and dissolve the buffer by the ID of this
cluster; (2) followed by a negative buffer. A few tests may
be carried out by the user, since different buffer sizes will
result in different areas for restoration. After a number of
tests, we observed that buffering the vegetation map with
any size larger than 2/3 of the desired enhancement of
connectivity desired, generate the best results. Narrower
buffers will vanish during the negative buffer step and wider
ones will generate many redundancies of connections.
Another observation we made is that the negative buffer
must be at least one meter wider than the original buffer to
minimize the appearance of artifacts around the fragments,
such as polygons that are not corridors, i.e. do not link
two different fragments. The final step is to erase the new
layer with the vegetation map, which will result in a layer
exclusively with corridors and some remaining artifacts
(polygons that do not link different fragments). The latter
ones are easily erased by excluding all polygons that are
exclusively linked to only one fragment, i.e., not linking
two or more fragments, thus, not acting as corridors. The
attributes that we created for these corridors were: unique
ID, area, number of patches it connects, IDs of the patches
it connects, ID of the cluster of fragments it is part, and
the area of the cluster of fragments.
161
Site Selection for Restoration Planning
Although a commonly proposed technique, corridors are not
simple to apply in the field, since they require a particular
area to be restored, i.e. between two or more fragments
which landowner might not be willing to change its land
use. When this happens, restoring the PPAs would be an
option, since these areas could be used as corridors or at
least shorten the distance between existing fragments. To
identify the PPAs that actually link at least two fragments,
first the user needs to merge the original vegetation map
with the PPAs map, and latter convert the resulted map in a
raster grid. We recommend the use of GUIDOS 1.3 software
(Joint Research Center – European Commission 2011) to
identify the corridors which connect two or more habitat
patches. Finally, landscape structure parameters could be
used to evaluate the importance of restoring each PPA, and
thus, a prioritization could be conducted.
Since restoration procedures are expensive, and with variable
results, some authors have argued that the focus should
be on sites that could be recovered mainly by autogenic
processes. In these areas, less intervention is necessary to
promote natural vegetation recover, which constitutes an
interesting alternative. Cost is lower when compared to
fully active restoration, as well as the chances of achieving
the restoration objectives is higher (Lamb et al. 2005; Holl
& Aide 2011). Here we defined Resilience zones as areas
which are benefited by resources, such as seeds, propagules,
nutrients, or any other biotic or abiotic factor provided by
adjacent source-areas. Again, source-areas should be defined
based on the best available data, and are usually defined as
the largest remnants of the analyzed region, or patches that
present a given target species. The procedure after selecting
the source-areas is to make a buffer of a small size (usually
< 100 m) around these areas, and latter to prioritize them
according to the landscape structure attributes of each of
them, such as its capacity to link two or more fragments.
Given the higher resilience around fragments, users can
select the template Enlarge forest patches, which is a criterion
that increases fragment size by “filling” invaginations in
its shape, thus turning patches into a more circular shape,
reducing edge effects and enhancing core area, as well as
making use of these highly resilient regions. The procedure
to generate this template starts with buffering the vegetation
map, then, applying a negative buffer at least a meter larger
than the previous one (to avoid creating artifacts around
the fragments). Latter, erase the original vegetation and
use the transformation Multipart to Singlepart Features.
This processing might need some testing by the user since
a larger buffer will created larger increments and a smaller
buffer smaller increments, not “filling the invaginations”.
Finally append to each feature its ID and area.
Prioritizing and selecting sites
After designing the scenario(s), the next step is to spatially
evaluate each of them and append any other desired attributes
to the features, such as: area and unique ID of the sites,
forest patches they are adjacent to and functional clusters
(i.e. clusters of functionally connected patches based on the
pre-defined search distance), proximity to sites of interest
(for example, Nature Reserves, or a site of occurrence of a
target species), cost of restoration, among many other - see
supplementary material**, and FRAGSTATS documentation
(McGarigal et al. 2012) for some metrics details.
After having the map with the candidate sites for restoration
and with all attributes for each polygon, the user is ready to
prioritize the areas. This step is done by table manipulation,
where attribute values are reordered according to the user’s
priorities for restoration, such as from the largest to smallest
size or from farthest to closest. Finally, on this reordered
table, the user will be able to select the desired sites among
all possibilities, and to visually evaluate by comparing
different maps. Multiple attributes may be prioritized and
selected at the same time with statistical functions available
in several GIS. The output map shows polygons, which
represent the candidate sites to be restored, each one with
the necessary attributes for the sites prioritization (such as
ranking by area or location) and selection (choosing only
the desired ones in the rank).
A step-by-step flowchart for the proposed protocol is shown
in Figure 1, and a schematic representation of potential
outputs for each restoration option in Figure 2.
The Case Study
For the entire Atlantic Plateau of São Paulo and for each
of its SWSs (Figure 3), we obtained the preserved and
non-preserved PPAs, the amount of LRs required, and the
amount of forest remnants that could be set as LRs. Later,
for one of these SWSs (São José de Guapiara SWS), we
applied each one of the five Landscape-based criteria and
evaluated its spatial characteristics (Table 1) for the current
forest cover map and for each different simulated scenario,
in order to compare the changes promoted. We used the
software Patch Analyst 5.1 (Rempel et al. 2012) to calculate
the landscape metrics accessed in the comparison – see
supplementary material for metrics details.
Nearly 2.5 million ha of The Atlantic Plateau is still preserved
(40.35%). Around 716,720 ha of forests (~29.1% of the
remaining forest) are located in Nature Reserves, where
8.56% of the area lacks forest vegetation. About 133,391 ha
of the total forest are located in PPAs, representing 5.45%
of the remaining forest, and PPAs cover around 8.3% of
the region. However, almost ¾ are degraded (73.6%).
Forest patches that could be considered as LRs account
for 1,611,642 ha, or 65.43% of the total forest vegetation,
which represents 26.4% of the entire region (Table S2).
The native vegetation cover varies greatly between SWSs,
from more than 70% in 27 of them, to less than 30% in 26
SWSs (Table S3).
**see supplementary material available at abeco.org.br.
162
Gama et al.
Natureza & Conservação 11(2):158-169, December 2013
Figure 1. Flowchart of the methods used to process input data, generate restoration candidates, select and prioritize sites for restoration.
Abbreviations: PPA = Permanent Protected Areas; LR=Legal Reserves; SWS=Subwatersheds; NR=Nature Reserves.
Site Selection for Restoration Planning
163
Figure 2. Schematic representation of restoration options proposed in this research: original landscape, a=fixed width corridors,
b=enhanced connections, c=enlargement of patches, d=resilience zones and e= corridors of Permanent Protected Areas. Grey areas
denote the original forest remnants, black are restoration candidates, and blue lines in “e” are drainages.
164
Gama et al.
Natureza & Conservação 11(2):158-169, December 2013
Figure 3. Location of the ninety subwatersheds in the Atlantic Plateau of São Paulo Region. Guapiara Basin is the 56th subwatershed
in the western region of the study area.
São José de Guapiara SWS has 46,428 ha of remaining
forests (30.96% of its area), with 3,763 ha (8.1%) in PPAs,
1,984 ha (4.3%) in Nature Reserves and 40,637 ha (87.56%)
apt to be LRs (Table S4). The total forest area that could be
accounted as LRs represents 27.1% of this SWS. The total
vegetation is distributed among 1007 patches (Table 1
and Figure S1).
Without considering edge width (to enable direct comparison
between the two corridors criteria), fixed width corridors
and enhanced connections (Figure 4a and b) both reduced
the number of patches to 719 (Table 1 and Figure S1) by
structurally linking fragments, thus increasing connectivity.
These similar results were expected, since we chose the
same search distance to run both cases (100 m), and did
not consider edge avoidance, what would be the main
difference between these two templates. In the fixed width
corridors scenario we connected every patch that was less
than 100 m apart from another by restoring corridors with
30 m of width, summing only 66 ha restored. Enhanced
connections demanded 1,523 ha of restored area; however,
this option increases interior areas in the corridors, thus
creating a landscape with more core area, which increased by
approximately 6.5 and 7.5% when considering 50 and 100m
of edge width respectively (Table 1, Figure S2). Restoring
all PPAs corridors (Figure 4e) in the São José de Guapiara
SWS would add 3,427 ha of vegetation area, with a major
impact in connectivity, reducing the number of fragments
of the landscape from 1007 to only 170.
In the Enlarge forest patches scenario we added 7,766 ha of
restored areas, increasing core areas by approximately 37%
and 54% for 50 and 100 m of edge width, respectively. For
the Resilience Zones scenario we added 2,864 ha of restored
area in the landscape, increasing core areas by approximately
10% and 33% for 50 and 100 m edge, respectively (Table 1).
Discussion
Among the main characteristics of our protocol, three are
particularly relevant: (i) it is fully spatially explicit, (ii)
enables multi-scale approach and (iii) offers a variety of
restoration options to be accessed alone or combined. The
user can test different scenarios to achieve the restoration
goals or manage whole landscapes and obtain a better spatial
arrangement of the remaining habitat (Hobbs & Norton 1996;
Bell et al. 1997; Holl & Aide 2011). Although particularly
relevant for decision-making, few tools are available to
create different scenarios and compare strategies, which
usually leave stakeholders without alternatives, especially
when the amount of degraded land far outstrips available
resources for restoration. MARXAN (Ball et al. 2009) and
C-Plan (Pressey et al. 2009) are among the most important
tools used in conservation planning; however there are
few examples of their application to restoration planning
Edge width
Class of patch size (ha)
1
0
3884.38
1179.48
0
0
21307.10
195.76
500-1000
1000-2500
2500-5000
5000-100000
100000-250000
MPS/ total NP
100m
50m
31973.12 (68.9%)
14427.81 (31.1%)
23462.60 (50.5%)
22965.00 (49.5%)
Core
Core
Edge
1007
1
0
Edge
7.00
6
4052.17
250-500
AWMSI
13
4254.68
29
53
3072.87
50-100
100-250
NP
904
area
8676.93
<50
Vegetation
719
1
0
0
3
11
11
21
47
625
NP
23030.95 (49.5%)
23462.61 (50.5%)
14492.53 (31.2%)
31973.70 (68.8%)
8.64
279.54
22373.52
0
0
3867.75
6262.34
2885.12
2226.30
2661.64
6216.90
area
719
1
0
1
2
11
12
23
47
622
NP
22746.21 (47.4%)
25204.10 (52.6%)
13922.28 (29%)
33999.11 (70.9%)
8.05
282.99
22565.23
0.00
2566.62
1546.54
6632.95
3208.02
2383.87
2816.50
6230.58
area
Fixed Width Corridors Enhanced Connections
1004
1
0
0
2
8
18
27
60
888
NP
18012.08 (33.2%)
36181.52 (66.8%)
10454.29 (19.3%)
43710.49 (80.7%)
3.33
210.47
23866.59
0
0
2648.61
5108.07
5992.24
3400.40
3795.89
9381.80
area
Patch
Enlargements
999
1
0
0
1
6
11
28
53
899
NP
20039.58 (39.2%)
31111.80 (60.8%)
14047.74 (28.5%)
35240.29 (71.5%)
6.23
206.78
23992.02
0
0
2482.39
3884.38
3213.69
4054.53
3075.34
8590.14
area
Resilience
Zones
area
170
1
0
0
1
0
0
2
4
162
NP
26918.98 (54%)
22936.24 (46%)
18109.24 (36.3%)
31745.93 (63.7%)
66.68
1408.32
47601.92
0
0
1179.99
0.00
0.00
192.52
113.70
767.26
Corridor
PPAs
Table 1. Area (in ha) and number of fragment patches (NP) per size class, mean patch size (MPS), area weighted mean shape index (AWMSI) and core and edge areas (in ha) for actual vegetation cover and
the five simulated restoration options.
Site Selection for Restoration Planning
165
166
Gama et al.
Natureza & Conservação 11(2):158-169, December 2013
Figure 4. Guapiara subwatershed and a zoomed in view of the detail (red square) showing the results for: a) fixed width corridors, b)
enhanced connections, c) enlargements, d) resilience zones and e) corridor of Permanent Protected Areas. Atlantic Forest remnants
in green and corridor candidates in black.
167
Site Selection for Restoration Planning
(Mansourian et al. 2005). The proposed protocol offers a
set of methods and tools to assist restoration planning,
as well as making it possible for all parties involved (e.g.
landowners, stakeholders, conservationists, etc.) to better
understand and be part of the selection procedure.
Some of the most important management strategies for
ecological restoration are: improving connectivity, reducing
the proportion of native habitat vulnerable to edge effects,
and increasing patch size. Site selection for restoring
connectivity via corridors has been shown to be particularly
helpful towards biodiversity management (Holvorcem et al.
2011). Our protocol helps the user to design three options
for corridors, which can be used independently or combined
in sequence to select sites for corridor establishment.
With the fixed width corridors template it is possible to
connect patches via the shortest distance between them,
which is the least costly way (smaller amount of area to be
restored) to structurally connect patches. Furthermore,
when processing the enhanced connections, it is also possible
to locate a cost effective way to increase connectivity, but
the sites designated are larger than regular corridors and
thus also enhancing the total and core areas of the patches
they connect, benefiting edge sensitive species as well. The
menu of corridor options also includes the generation of
corridors through non-preserved PPAs, which may constitute
ecological corridors while benefiting conservation in other
ways, such as sediment retention and river protection.
Moreover, landowners are more aware of the protection
of these tracks of forest, thus, restoration initiatives could
be more feasible.
Increased patch size is one of the main focuses of management
strategies, since patch size is a key property to species
maintenance in fragmented landscapes (Saunders et al.
1991; Martensen et al. 2012). This approach might also
include focusing on interior or sensitive species that may
avoid forest edges. In this regard, enhanced connections and
resilience zones are strategies to be considered. Furthermore,
the enlargement fragments template, which prioritizes
filling invaginations of irregularly shaped fragments,
can be particularly useful for reducing edge effects and
consequently benefits sensitive species (Bergès et al. 2013).
Performing the steps of these methods requires prior
information. The quality of the input maps and biological
information, such as dispersal capacities or size and
characteristics of source-areas, can significantly affect
where restoration sites are designed. Moreover, biological
data is usually not available, thus, the parametrization of
biological attributes, which directly affects the scenario
definitions, often relies on expert opinions, that are usually
not congruent (Cipollini et al. 2005). Nevertheless, it is one
of the most important phases of restoration projects, since
it makes possible to re-think, re-discuss and re-negotiate
previously defined goals. This allows for increased numbers
of stakeholders involved in the project, and explores different
possibilities for future scenarios considering the opinions
of every person involved in the process. The proposed
protocol assists in this task, since it makes possible for users
to investigate different possibilities through the design,
visualization, prioritization and selection of different
strategies for restoration.
The recent changes in the Brazilian Environmental Legislation
include (1) variation in the percentage of LRs required
according to the size of the property considered, (2)
reduction in PPA width and (3) consideration of PPAs as
LRs (see table in Garcia et al. 2013). If these changes remain
in effect, the whole country might experience a decrease in
restoration actions in years to come. Firstly, because remote
sensing and geoprocessing, which have been key in research
and law enforcement, will be less applicable in a context
with lack of information on property size. Secondly, the
reduction in PPAs width diminishes their capacity to act as
corridors (Metzger 2010), as well as to protect water bodies,
and to be restored in an economically viable way. Finally,
including PPAs in the amount to be preserved as LRs will
reduce the amount of land required to be restored. PPAs
account for approximately 15% of the Atlantic Forest biome
(Calmon et al. 2011; Ribeiro et al. 2011), whereas LRs used
to be considered an additional 20% of each private property
to be preserved. Compliance with the former legislation
whether than the current would have placed the Atlantic
Forest in a much better conservation status.
Additional protocol developments consider the
implementation of the proposed approaches in a software
package in ARCGIS, which we will call “Restoration Hotspots
Toolbox”. The proposed protocol is a tool for decision
making that constitutes a major step towards systematic
planning for ecological restoration. After clear objectives
are stated the protocol can fully support the designing
and prioritization of sites for restoration, and even small
budgets could be optimized.
Acknowledgments
We are grateful to both editors of this special issue, Jean
Paul Metzger and Pedro Brancalion, for encouraging us
to submit this paper for publication. We would also like
to thank Pedro Brancalion for selecting excellent referees
and also for carefully reviewing this paper himself, which
helped us improve it considerably. This study was funded
by The National Council for Scientific and Technological
Development (CNPq), an agency linked to the Brazilian
Ministry of Science and Technology (MCT).
References
Andrén H, 1994. Effects of habitat fragmentation on birds
and mammals in landscapes with different proportion of
suitable habitat: A review. Oikos, 71:355-366. http://dx.doi.
org/10.2307/3545823
Ball IR, Possingham HP & Watts M, 2009. Marxan and relatives:
Software for spatial conservation prioritisation. In: Moilanen
A, Wilson KA & Possingham HP (eds.). Spatial conservation
Gama et al.
Natureza & Conservação 11(2):158-169, December 2013
prioritisation: Quantitative methods and computational
tools. Oxford: Oxford University Press. v. 14, p. 185-195.
Lamb D, Erskine PD & Parrotta JA, 2005. Restoration of
Degraded Tropical Forest Landscapes. Science, 310:16281632. http://dx.doi.org/10.1126/science.1111773
168
Bell SS, Fonseca MS & Motten LB, 1997. Linking restoration
and landscape ecology. Restoration Ecology, 5:318-323. http://
dx.doi.org/10.1046/j.1526-100X.1997.00545.x
Benayas JMR et al., 2009. Enhancement of biodiversity and
ecosystem services by ecological restoration: a metaanalysis. Science, 325:1121-1124. http://dx.doi.org/10.1126/
science.1172460
Bergès L et al., 2013. Unexpected long-range edge-to-forest
interior environmental gradients. Landscape Ecology,
28:439-453. http://dx.doi.org/10.1007/s10980-012-9841-1
Butchart SHM et al., 2010. Global Biodiversity: Indicators of
Recent Declines. Science, 328:1164. http://dx.doi.org/10.1126/
science.1187512
Calmon M et al., 2011. Emerging Threats and Opportunities
for Large-Scale Ecological Restoration in the Atlantic Forest
of Brazil. Restoration Ecology, 19:154-158. http://dx.doi.
org/10.1111/j.1526-100X.2011.00772.x
Cipollini KA, Maruyama AL & Zimmerman CL, 2005.
Planning for Restoration: A Decision Analysis Approach
to Prioritization. Restoration Ecology, 13:460-470. http://
dx.doi.org/10.1111/j.1526-100X.2005.00057.x
Conselho Nacional do Meio Ambiente - CONAMA, 2010.
Resolução Conama no 425. Available from: <http://www.
mma.gov.br/port/conama/legiabre.cfm?codlegi=630>.
Access in: 01 Mar 2013.
Echeverria C, Gatica P & Fuentes R. 2013. Habitat edge contrast
as an indicator to prioritize sites for ecological restoration
at the landscape scale. Natureza & Consevação, 11:170-175.
Garcia L et al. 2013. Restoration challenges and opportunities for
increasing landscape connectivity under the new Brazilian
Forest Act. Natureza & Consevação, 11:181-185.
Garcia D & Martinez D, 2012. Species richness matters for the
quality of ecosystem services: a test using seed dispersal
by frugivorous birds. Proceedings of the Royal Society B:
Biological Sciences, 279:3106-3113. http://dx.doi.org/10.1098/
rspb.2012.0175
Gilbert-Norton L et al., 2009. A Meta-Analytic Review of
Corridor Effectiveness. Conservation Biology, 24:660-668.
http://dx.doi.org/10.1111/j.1523-1739.2010.01450.x
Hobbs RJ & Norton DA, 1996. Towards a conceptual framework
for restoration ecology. Restoration Ecology, 4:93-110. http://
dx.doi.org/10.1111/j.1526-100X.1996.tb00112.x
Holl KD & Aide TM, 2011. When and where to actively restore
ecosystems? Forest Ecology and Management, 261:1558-1563.
http://dx.doi.org/10.1016/j.foreco.2010.07.004
Holvorcem CGDA et al., 2011. Anchor Areas to Improve
Conservation and Increase Connectivity within the Brazilian
Mesopotamia of Biodiversity. Natureza & Conservação,
9:225-231. http://dx.doi.org/10.4322/natcon.2011.030
Joint Research Center - European Commission, 2011. Graphical
User Interface for the Description of image Objects and their
Shapes - GUIDOS software. Available from: <http://forest.
jrc.ec.europa.eu/download/software/guidos>. Access in:
01 Mar 2013.
Lovett GM et al., 2005. Ecosystem function in heterogeneous
landscapes. New York: Springer-Verlag, Inc. p. 489. http://
dx.doi.org/10.1007/b104357
Majka D, Jenness J & Beier P, 2007. CorridorDesigner: ArcGIS
tools for designing and evaluating corridors. Available from:
<http://corridordesign.org>.
Martensen AC. 2008. Importância relativa da perda e
da fragmentação do habitat (tamanho do fragmento e
conectividade) na conservação de espécies em paisagens
alteradas. [Dissertação]. São Paulo: Instituto de Biociências,
Universidade de São Paulo.
Martensen A, Pimentel R & Metzger JP, 2008. Relative effects
of fragment size and connectivity on bird community in
the Atlantic Rain Forest: Implications for conservation.
Biological Conservation, 141:2184-2192. http://dx.doi.
org/10.1016/j.biocon.2008.06.008
Martensen AC et al., 2012. Associations of forest cover,
fragment area, and connectivity with neotropical
understory bird species richness and abundance.
Conservation Biology, 26:1100-1111. http://dx.doi.
org/10.1111/j.1523-1739.2012.01940.x
Mansourian S, Vallauri D & Dudley N (eds. in cooperation with
WWF International), 2005. Forest restoration in landscapes:
beyond planting trees. New York: Springer. 437 p.
McGarigal K, Cushman SA & Ene E, 2012. FRAGSTATS v4:
Spatial Pattern Analysis Program for Categorical and
Continuous Maps. Computer software program produced
by the authors at the University of Massachusetts, Amherst.
Available from: <http://www.umass.edu/landeco/research/
fragstats/fragstats.html>.
Metzger JP, 2003. Como restaurar a conectividade de paisagens
fragmentadas? In: Kageyama PY et al. Restauração ecológica
de ecossistemas naturais. Botucatu: FEPAF. v. 3, p. 51-76.
Metzger JP, 2010. O Código Florestal tem base científica?
Natureza & Conservação, 8:92-99. http://dx.doi.org/10.4322/
natcon.00801017
Metzger JP et al., 2008. Uso de índices de paisagem para
a definição de ações de conservação e restauração da
biodiversidade do Estado de São Paulo. In: Rodrigues
RR et al. (eds.). Diretrizes para Conservação e Restauração da
Biodiversidade no Estado de São Paulo. São Paulo: Secretaria
do Meio Ambiente e Fapesp. p. 120-127.
Rempel RS, Kaukinen D & Carr AP, 2012. Patch Analyst and
Patch Grid. Ontario Ministry of Natural Resources. Thunder
Bay: Centre for Northern Forest Ecosystem Research.
Pressey RL et al., 2009. The C-plan conservation planning
system: origins, applications, and possible futures. In:
Spatial conservation prioritization: quantitative methods
and computational tools. Oxford: Oxford University Press.
p. 211-234.
Ribeiro MC et al., 2011. The Brazilian Atlantic Forest: a
shrinking biodiversity hotspot. In: Zachos FE & Habel JC
(org.). Biodiversity Hotspots: Distribution and Protection of
Site Selection for Restoration Planning
Conservation Priority Areas. London New York: SpringerVerlag Berlin Heidelberg. v. 1, p. 405-434.
Rodrigues RR et al., 2009. On the restoration of high diversity
forests: 30 years of experience in the Brazilian Atlantic
Forest. Biological Conservation, 142:1242-1251. http://
dx.doi.org/10.1016/j.biocon.2008.12.008
Rodrigues RR et al., 2011. Large-scale ecological restoration of
high-diversity tropical forests in SE Brazil. Forest Ecology and
Management, 261:1605-1613. http://dx.doi.org/10.1016/j.
foreco.2010.07.005
Saunders DA, Hobbs RJ & Margules CR, 1991. Biological
consequences of ecosystem fragmentation: a
review. Conservation Biology, 5:18-32. http://dx.doi.
org/10.1111/j.1523-1739.1991.tb00384.x
Tambosi LR & Metzger JP, 2013. A framework for setting local
restoration priorities based on landscape context. Natureza
& Consevação, 11:152-157.
169
Tambosi LR et al., In press. A Framework to Optimize
Biodiversity Restoration Efforts Based on Habitat Amount
and Landscape Connectivity. Restoration Ecology. http://
dx.doi.org/10.1111/rec.12049
Thomson JR et al., 2009. Where and when to revegetate: a
quantitative method for scheduling landscape reconstruction.
Ecological Applications, 19:817-828. http://dx.doi.
org/10.1890/08-0915.1
Twedt DJ, Uihlein III WB & Elliott AB, 2006. A spatially
explicit decision support model for restoration of forest
bird habitat. Conservation Biology, 20:100-110. http://
dx.doi.org/10.1111/j.1523-1739.2005.00303.x
Wiens JA, 1997. Metapopulation dynamics and landscape
ecology. In: Hanski I & Gilpin ME (eds.). Metapopulation
biology: ecology, genetics, and evolution. San Diego:
Academic Press. p. 43-62. http://dx.doi.org/10.1016/
B978-012323445-2/50005-5
Received: April 2013
First Decision: July 2013
Accepted: November 2013
Baixar