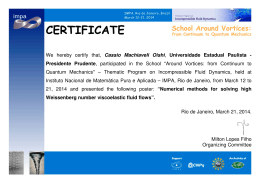
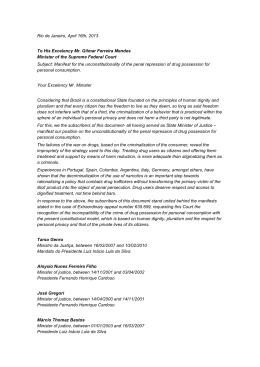
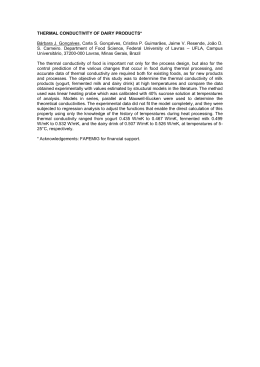
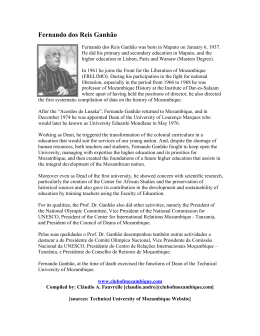
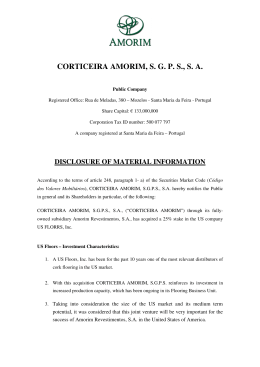
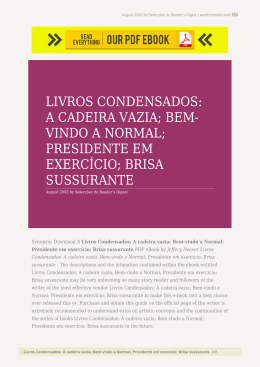
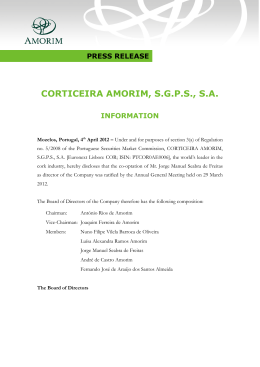
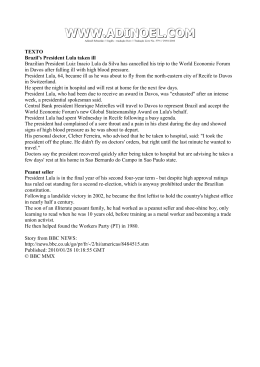
Revista da Faculdade de Letras – Geografia – Universidade do Porto
II Série, Volume II, 2008 – pp. 11-32
Climatic changes in urban environments:
trends and generations of heat islands
in Presidente Prudente, Brazil
Margarete Cristiane de Costa Trindade Amorim
João Lima Sant’Anna Neto
Department of Geography – Faculty of Science and Technology.
Universidade Estadual Paulista (São Paulo State University) - UNESP. Presidente Prudente, São Paulo, Brasil.
Emails: [email protected].; [email protected]
Abstract – Presidente Prudente is located at São Paulo State (Brazil), has
a population of approximately 200,000 inhabitants and in the structure of the
city, there are intra-urban environments completely different from the point of
view of soil occupancy, especially with regard to the density of constructions,
arborization standards of roads and backyards, green areas, circulation of vehicles
and people. This survey had the purpose of verifying the trend of thermal
characteristics of the last 34 years and analyzing the intensity and shape of the
urban heat island. The materials and techniques used to develop this study were:
temperature data (minimum, average, maximum, and recorded at 9 pm) in the
period from 1971 to 2005, collected in the Meteorological Station of Presidente
Prudente (INMET). They were statistically treated, and the methodology to verify
the intensity and shape of the urban heat island consisted of the definition of two
transects, with mobile measurements, using digital thermometers, coupled to the
side of two vehicles, totaling 120 points of air temperature collection. The results
showed that the temperatures have suffered significant increase, especially with
regard to the absolute minimum values and the records at nighttime. Heat islands
of high magnitude were also identified, with maximum intensity of 9.6ºC. The
spatial variations occurred according to the types of soil occupancy and relief.
This way, one concludes that in view of all the changes implemented in the
natural environment, the energy balance has changed, coinciding with the global
warming trend described by the IPCC published in 1994 and 2001.
Keywords – climatic changes; urban environments; urban climate; heat island;
Presidente Prudente/Brasil.
Resumo – Presidente Prudente localiza-se no Estado de São Paulo (Brasil),
11
Margarete C. C. T. Amorim
João L. Sant’Anna Neto
possui população aproximada de 200.000 habitantes e na estrutura da cidade,
existem ambientes intra-urbanos completamente diferentes do ponto de vista da
ocupação do solo, principalmente no que se refere à densidade de construções,
verticalização, padrões de arborização de ruas e fundos de quintais, áreas
verdes, circulação de veículos e pessoas e áreas com degradação ambiental. A
presente pesquisa teve como objetivo verificar a tendência das características
térmicas dos últimos 34 anos e analisar a intensidade e a forma da ilha de calor
urbana em Presidente Prudente/SP. Os materiais e as técnicas empregados para
o desenvolvimento deste estudo foram: os dados térmicos (mínimos, mínimos
absolutos, médios, máximos e os registrados às 21 horas) do período de 1971
a 2005, coletados na Estação Meteorológica de Presidente Prudente (UNESP/
INMET). Os mesmos foram tratados estatisticamente através do cálculo dos
valores médios e da regressão linear simples. A metodologia para se verificar
a intensidade e a forma da ilha de calor urbana consistiu na definição de dois
transectos, com medidas móveis, utilizando-se de termômetros digitais, com os
sensores presos a uma haste de madeira com 1,5m de comprimento, acoplados
na lateral de dois veículos, totalizando 120 pontos de coletas de temperatura
do ar. As medições foram efetuadas em julho de 2002 entre 20h e 20:45h. Os
resultados mostraram que as temperaturas da cidade de Presidente Prudente têm
sofrido aumento significativo, sobretudo no que se refere aos valores mínimos
absolutos e os registrados no período noturno. Também foram identificadas ilhas
de calor de alta magnitude, com intensidade máxima de 9,6oC. As variações
espaciais ocorreram de acordo com os tipos de ocupação do solo e características
de relevo. Desta forma, conclui-se que diante de todas as transformações
implementadas no meio natural, nestes últimos cinqüenta anos, tenha alterado o
balanço de energia, coincidindo com a tendência de aquecimento global descrita
pelo Intergovernmental Panel on Climate Change publicado em 1994 e 2001.
Palavras-chave: mudanças climáticas; ambiente urbano; clima urbano; ilhas
de calor; Presidente Prudente/Brasil.
INTRODUCTION
The fast and unorganized urbanization process that Brazil suffered after the 50s
caused a substantial change in the original landscape of the natural environments.
This change caused serious problems regarding urban environmental issues,
like pollution of water bodies, thermal discomfort, atmospheric pollution among
others.
Together with the relief and hydrography, the climate was one of the
main abiotic elements and suffered with the anthropogenic derivations. The
construction of the cities allowed modification of the energy balance, especially
due to the substitution of the materials making up the natural landscape by
those of human origin. These substitutions caused considerable changes in the
characteristics of the main dynamic elements of the atmosphere, in addition to
causing the emergence of a microclimate with very particular specificity.
12
Climatic changes in urban environments: trends and generation of heat islands in Presidente Prudente, Brazil
The city’s climate is therefore the result of the integration between the
atmosphere and the urban environment built by man and the roughness of its
location.
This way, studies on urban climates in Brazil have, decade after decade,
obtained more and more highlight and need for understanding by experts,
because it was believed that the transformation of spaces, releasing of tons of
solid particles produced by man in urban environments, are contributing toward
the global warming trend, as informed by the IPCC (2001).
Presidente Prudente gave the urban climate study a complex situation with
regard to the soil occupancy and relief.
In this city, there is a diversity of significant uses with regard to soil occupancy,
since the oldest towns (30s/40s) are densely built and have adequate quantity of
tree vegetation in the roads and backyards.
The less ancient towns (50s/60s) and the more recent ones (as of the 70s),
which are the great majority, have sparse constructions with lawns and disperse
tree vegetation. The popular housing assemblies (low-income dwellers) are
densely constructed. The city does not have a very diversified soil use, there being
a predominance of domiciles to the detriment of other uses, such as industrial,
commercial and services. The non-residential units (commerce, services and
industry) represent 13% of the total, while residential units represent 87%.
The commercial and service use is predominantly located in the central area,
with some subcenters spread through the urban network, but with relatively little
circulation of vehicles and people, in comparison with the center.
The rural area near Presidente Prudente is characterized by the pastures and
sparse tree vegetation, the soil being covered at all times of the year (Amorim,
2000).
With approximately 200,000 inhabitants, covering an area of 562 Km2, there
is a relief inserted in the Planalto Ocidental Paulista [São Paulo Western Plateau],
and is basically formed by average, broad hills and long hillocks and spikes. The
city is located on a spike dividing the waters, and the water system that drains
the urban location is made up of small watercourses.
In the western part of the city, where it has grown the most, due political,
economic issues and issues of relief, the dividing water surfaces have longer
convex profiles, forming smoother topographic divides separated from each
other by less narrow valleys, representing today about 80% of the urban network
total. The eastern part has a well undulated relief and the roads outlined have
strong slops, exceptionally rendering the city’s expansion difficult.
The roughness of the Presidente Prudente’s relief favors the central area,
since it is on a spike where most of the buildings with more than four stories
are located and is very unfavorable in its outskirts, where the slope ruptures are
sharper.
The climate of Presidente Prudente and region is the result of an alternating
field of tropical and polar systems, but dominated by more or less continentalized,
13
Margarete C. C. T. Amorim
João L. Sant’Anna Neto
tropical sea air masses (Sant’Anna Neto and Barrios, 1996).
The participation of the frontal systems, above all the cold fronts and RFPA,
together with the individualized systems, is the main factors responsible for rains
in the region (about 70% of the annual average precipitation).
The rains associated to the cold fronts are observed during all seasons, with
more expressive values during the entire summer, end of spring and beginning
of fall.
While the rains associated with the individualized systems, especially the
ZCAS (South Atlantic Convergence Zone) occurred during the summertime and
end of spring. As ZCAS have their genesis connected along the subtropical jets at
high levels, as well as the east of the semi-stationary hollows.
The rains associated with the CCMs (Mesoscale Convective Complexes) over
the region occur mainly during nighttime, when all the ascending air from the
water evaporating from the rivers Paraná and Paraguay cools and precipitates.
The participation of the inter-tropical systems does not have significant
precipitation values for the municipality of Presidente Prudente and the region,
but the systems play an important role in controlling the temperatures.
The action of the Tropical Atlantic system throughout the year brings to
the region, during the winter, time stability due to the upper subsidence and
some instability during the summer due to the basal warming that causes some
convective cells.
The Continentalized Tropical Atlantic system has as characteristics the
changes in thermal, hydric and barometric values of the Tropical Atlantic (TA)
originating in the stationary Anticyclone of the South Atlantic. These changes are
caused by the modifications suffered by the TA on advancing and remaining in
the continent. One of its strong characteristics is the increase of thermal values.
The Tropical Continental system is one of the only ones with their geneses
associated with the continent’s interior. Originating in the Platina do Chaco
lowland, this system mainly influences the high temperatures of the region.
Several studies have shown that the urban atmosphere has presented
differences in relation to the rural atmosphere, especially with regard to
temperature, with formation of heat islands. The various types of soil use and
occupation, associated with the relief characteristics, cause changes in the
environmental quality, which materialize in various ways and one of these has
to do with the urban atmosphere.
The detection of heat islands in the urban environment can aid urban
planning, to the extent in which the temperature rise causes the establishment
of areas of less pressure, which in turn facilitates air circulation toward the hotter
points and consequently transport of pollutants to these areas.
Studies of this nature in small and medium-size cities allow for effective
actions in the territory’s reordering, to the extent in which they do not reach
unsustainable levels of growth, as in the big metropolitan cities.
This survey had the purpose of verifying the tendency of thermal characteristics
of the last 34 years and analyzing the intensity and shape of the urban heat island
14
Climatic changes in urban environments: trends and generation of heat islands in Presidente Prudente, Brazil
in Presidente Prudente/SP.
Inserted in the transformation context of the landscape, the production of
space, substitution of natural materials by humans and global, regional and local
warming, the city of Presidente Prudente becomes a good example of analysis
and understanding with regard to climatic changes.
METHODOLOGICAL PROCEDURES
The urban climate study considered the internal structure of the Urban
Climate System, integrating the ecological and urban, without disregarding the
higher scales of the climate (Monteiro, 1976). The materials used to conduct
this research were: the temperature data, especially with regard to the average
of the maximum, medium and minimum values, the absolute minimum values,
minimum and maximum temperature values of July and January and the records
in the period of 9 pm.
These thermal data was gathered from the Meteorological Station of the
Faculty of Science and Technology of Presidente Prudente (UNESP/INMET) in
the period from 1971 to 2005.
From the data available, some statistical techniques were used, like calculation
of the mean and simple linear regression, used to help in the general analysis
and facilitate actual knowledge of the thermal changes for the city of Presidente
Prudente.
In the data statistical treatment, the software Origin 7.5 1 and Excel2 were
used to formulate the following graphs shown in the body of the work.
– Trend of the mean temperature values;
– Trend of the mean minimum values;
– Trend of the mean maximum values;
– Mean representation of the minimum temperatures recorded in July
and the mean of the maximum temperatures recorded in January
– Trend of the absolute minimum values;
– Trend for increase of the thermal mean for the period of 9 pm.
The methodological procedure for gathering air temperature data in
Presidente Prudente consisted in the definition of two transects, with mobile
measurements, using digital thermometers, with sensors fastened to a wooden
rod with 1.5-m length, coupled to the side of two vehicles that left the outskirts
(rural), passing through the center, arriving at the opposite side of the city.
The measurements were taken in 5 days in July 2002, between 8:00 pm and
8:45 pm, time in which the temperatures do not undergo rapid changes, due to
the time difference between the first and last measurement (45 min). In transect
1, 42 temperature records were taken and 78 in transect 2 (Figure 1)
1
2
Origin 7.5 is a registered trademark of NAG Software Partner.
Excel is a registered trademark of Microsoft.
15
Margarete C. C. T. Amorim
João L. Sant’Anna Neto
The gathering of data with vehicles requires that the time spent between
measuring the initial point and final point of the itinerary does not exceed one
hour, with a speed that should vary between 30 and 40Km/hr. This methodology
was adapted based on the works of Oke and Maxwell (1975); Gomes and Garcia
(1984); Johnson (1985); Pitton (1997).
The field survey was conducted in winter episodes, under synoptic conditions
of low wind speed, favorable to the formation of heat islands.
The regional atmospheric systems acting on the days of field survey were
analyzed through the synoptic maps of the surface available in the Brazilian navy
site3 and of the Goes satellite images.4
To analyze the result, isothermal maps were elaborated, using the Software
Surfer for Windows,5 thus allowing viewing of the temperature variation in
different points of the city.
Thus, the research was developed from the methodological propositions
presented by Monteiro (1976 and 1990), considering the spatial analysis that
resulted from an intra-urban analysis to explain how the different geological and
urban conditioning factors answer for the action of the atmospheric systems.
THE CLIMATE OF URBAN ENVIRONMENTS: AN EXAMPLE OF
PRESIDENTE PRUDENTE/SP
All the anthropic derivations play a very important role in the changes of
the main climatic elements. Perhaps, one of the main materializations of these
derivations, regarding the climate, can be viewed directly from within the cities.
The cities, in addition to being the stage of constant social struggles, since
the 17th century, is being regarded more and more as one of the main objects of
study for atmospheric sciences.
Since the publication of the first works on urban climate, conducted in
London by Evelyn (1661) and Howard (1833) up to the publication of the
classical works of Landsberg and Chandler (1965), cited by Lombardo (1985),
understanding the changes in urban environments becomes essential for studies
aimed at greater verticalization of the constant local and regional atmospheric
changes.
The cities, although they occupy great spatial extensions, are responsible
for abrupt changes in the natural landscape. According to Amorim (2000), this
modification can be materialized through different forms of pollution (water, soil,
subsoil and air), as well as the changes in the morphology and structure of the
urban environment, devastation of green areas, destruction and channeling of
water bodies, among others.
In view of all these changes in the spatial assembly, caused by human
3
4
5
16
www.mar.mil.br.
http://satelite.cptec.inpe.br/imagens/.
Surfer is a registered trademark of Golden Software, Inc.
Climatic changes in urban environments: trends and generation of heat islands in Presidente Prudente, Brazil
Figure 1. Presidente Prudente – Location of transects - 2002
Source: Topographical map of the municipal government of Presidente Prudente,1995.
N
7557000
Center
7554000
7551000
Transect 1
Transect 2
Center
7548000
1000
1000
452000
0
0
1000
2000
1000
3000 m
2000
455000
3000 (m)
458000
461000
actions, a “new” local atmospheric formation begins, established by the change
in the dynamical behavior of the atmospheric elements.
This way, Monteiro (1976), influenced by the General Theory of Systems by
Ludwig von Bertalanffy of 1950, calls the interrelation between the elements of
nature and man the Urban Climate System (UCS).
The proposal of this Urban Climate System model is subdivided into three
channels of perception or into three subsystems, among them: Thermodynamic,
(which will mention the quality of heat comfort in urban environments), the
Physical-Chemical, (fundamental for the studies in large and medium-size cities,
since it is in these types of environments that there is a greater quantity of
particulate material dispersed in the atmosphere, expelled by the chimneys of
factories and exhausts of automobiles, creating problem for air quality), and the
Hydrometeoric (subsystem responsible for “verifying” the meteoric impacts, that
is, concentrated pluvial impacts or extreme pluvial events).
17
Margarete C. C. T. Amorim
João L. Sant’Anna Neto
The channels of perception fundament an important understanding within
the systemic perception that the urban climate is exclusively an open system.
This, since it is open, is subject to changes of different orders and impacts,
caused by the most varied triggering factors.
The importance of analyzing the urban climate within the perspective of
the channels of perception can be justified by the fact that, although not a
perfect model of analysis, it can encompass a good part of the interferences and
characteristics of the local micro-climate.
This way, the urban climate can be understood as a large open system that
covers the climate of a certain space and of its preexisting urbanization that,
despite being the micro-climatic materialization of a spatial portion, is inserted in
a macro-climate, being influenced by the different types of soil use and by the
different social productions of space.
According to Amorim (2000), “the urbanization process changes the surface
radiation balance due to substitution of natural materials by urban materials”,
which has the capacity of capturing, absorbing and reflecting part of the
electromagnetic radiation emitted by the sun.
The electromagnetic radiation’s integration with the finished material ends
up modifying its original wavelength, directly contributing toward increase in the
local thermal values. In addition, it is in the urban environment that there is heat
production by indirect actions, from human derivations.
Automobile engines, associated with heavy use of refrigeration machinery
and acclimatization, is one of the main elements responsible for direct increase
in the thermal values of large and medium-size urban centers.
The other forms that contribute toward warming in these environments are
the various colors and types of materials used in the construction of buildings,
houses and pavements of sidewalks of road, circulation of vehicles and people,
high concentration rates of water and dust particles, and tons of pollutants
generated by the burning of fossil fuels, etc.
Inserted in all this context of derivation and space production by human
actions, the city of Presidente Prudente becomes a good example to study the
characteristics of urban climate.
The city of Presidente Prudente, as well as any other of similar structural
size, has countless urban environmental problems. Oftentimes, the genesis of
these problems is related to the disorderly growth of the city itself, provided by
a fragile environmental planning policy.
Urban space construction, in addition to changing the forms of relief and
changing the directions, potentiality and quality of the water bodies, is able
to cause impacts of different magnitudes in the main micro-climatic elements,
reflecting, above all, in the air quality and thermal comfort. The change of thermal
values in urban environments is the greatest proof that the use of countless
material types and colors can cause changes in the energy balance.
Substitutions of natural material by urban materials, guaranteed by the
18
Climatic changes in urban environments: trends and generation of heat islands in Presidente Prudente, Brazil
urbanization process, caused a change in the energy balance and consequently
modification in the thermal characteristics of Presidente Prudente.
Analyzing the thermal behavior of the city, it is possible to note that the
considerable modifications in the minimum thermal, absolute minimum,
maximum mean values and in the records in the period of 9 pm in the time scale
extends from 1971 to 2005.
TREND FOR INCREASES IN TEMPERATURES FOR THE CITY OF
PRESIDENTE PRUDENTE
The increase of mean temperatures of the globe, without a shadow of doubt,
is a cause of much concern to countless experts on the subject. The increase
forecasted by IPCC (‘994) for the global mean temperature between 1990 and
2100 will be varying between 1.4 to 5.8ºC, reflecting directly in an increase in the
level of the oceans from 0.09 to 0.88 meters.
According to Bessat (2003), the increase in temperatures would cause an
increase in the values observed in the global hydrological cycle, that is, it would
rain more at some points of the planet (creating risks for the society) and less at
other points (causing problems like water scarcity).
Modification of the thermal values in the whole of Latin America is being
regarded as one of the factors greatly responsible for the 20% reduction in glacier
areas found in the Andes, according to IPCC (2001).
Thermal variations in the mean values are also observed in large, small and
medium-size urban centers.
Analyzing the mean temperatures of the city of Presidente Prudente, recorded
for the period from 1971 to 2005 in Figure 2, one sees that they have a tendency
to increase.
This tendency serves as example in the understanding of new and strong
evidences that majority of the warming (global, regional and local) observed in
the last 50 – 60 years can be attributed to anthropic derivations, as explained by
the IPCC (2001).
However, one does not know for sure if man is the sole and only agent
responsible for all the thermal change in the planet, or if all the warming in
the global, regional and local scales is linked to the natural cycles: of sunspots,
effects of volcanic eruptions, etc. Nevertheless, what is perhaps one of the great
problems of humanity is exposed.
Using some statistical techniques, like calculation of linear regression, it was
possible to see that the increase in mean temperatures of the city of Presidente
Prudente in the last 34 years was 1.5ºC, which would give an increase of 0.44ºC
per decade (Table 1).
In addition to this visible increase in the mean values of the temperatures,
one notes that the means of the minimum and maximum temperatures are being
more and more modified (Figures 3 and 4).
The changes in the mean values of the minimum temperatures have
19
Margarete C. C. T. Amorim
João L. Sant’Anna Neto
Table 1. Linear regression for the mean temperatures of Presidente Prudente
TEMP.
Table 1. Linear regression for the mean temperatures of Presidente Prudente
VALUES OF Y LINE
1971
2005
TEMPERATURE
INCREASE
DECADE
INCREASE
T=-66,50183+0,04521.ANO
22,6
24,1
1,5
0,44
been much more significant compared to the mean values of the maximum
temperatures. The mean of the minimum values, observed in the period from
1971 to 2005, have suffered an increase of 2ºC, which represents an increase of
0.56ºC each decade. While the thermal mean of the maximum values increased
by only 1.1ºC in the same period of analysis.
One can thus conclude that, although the mean of the maximum thermal
values is increasing by approximately 0.3% for the last four decades, it is the
mean of the minimum temperatures that is having the more significant values.
This fact ends up encouraging and evidencing the possible trends for positive
changes in thermal values, generated within the large, small and medium-size
urban centers in the last decades.
In view of all this trend, on analyzing the mean values of the maximum and
minimum temperatures for the months of January and July, this trend became
even more evident.
The importance of analyzing the thermal variations for these two months are
Figure 2. Trend of the mean values of temperature
26,5
26,0
T =-66,50183+0,04521* ANO
25,5
Temperatura ºC
25,0
24,5
24,0
23,5
23,0
22,5
22,0
21,5
20
1970
1975
1980
1985
1990
ANO
1995
2000
2005
Climatic changes in urban environments: trends and generation of heat islands in Presidente Prudente, Brazil
linked to the fact that it is during these periods (January and July) that the highest
and lowest thermal values in the year are observed.
The changes in mean values of the minimum temperatures for the month
of July show that year after year the winter for the city of Presidente Prudente is
becoming hotter, as can be seen in Figure 5 (A and B).
Figure 3. Trend of the mean minimum values
21,0
T = - 97,03262+0,05808 AN O
20,5
20,0
Temperatura ºC
19,5
19,0
18,5
18,0
17,5
17,0
16,5
16,0
1970
1975
1980
1985
Ano
1990
1995
2000
2005
Figure 4. Trend of the mean maximum values
32,0
T = - 29,86138 + 0,02966*A N O
31,5
31,0
Temperatura
30,5
30,0
29,5
29,0
28,5
28,0
27,5
1970
1975
1980
1985
A no
1990
1995
2000
2005
21
Margarete C. C. T. Amorim
João L. Sant’Anna Neto
The changes in the minimum values during these times of the year do not
mean exactly reduction of the polar flows, responsible for reducing the thermal
values. It is very likely that increase of the minimum means can be directly
associated with the “heat” generation produced by human activities within the
city itself.
Calculation of the linear regression reveals that between 1971 and 2005, the
minimum temperatures recorded in July (considered to be the coldest month)
was 3.3°C, which would give approximately 0.95ºC of increase each decade
(Table 2).
In the same way that changes are observed in the minimum values during
winter, it is possible to observe modifications in the maximum behavior of the
temperatures recorded during the central season of summer, as can be seen in
Figure 5.B.
During the entire time series (1971-2005), this temperature increased by
approximately 1.7ºC, which represented approximately 0.5ºC each decade (Table
2).
On analyzing the absolute minimum temperatures of the city of Presidente
Prudente, it was possible to note high changes in its thermal behavior. This
temperature suffered an increase of approximately 3.5ºC in the last 34 years,
which would give approximately 1ºC of increase each decade.
The graph of trend for increase in the absolute minimum values, shown
by Figure 6, shows that during the start of the 70s and 80s, the lowest thermal
values of the entire time series analysis were recorded. With highlight for the
Figure 5. Mean representation of the minimum temperatures recorded in July
(A) and the mean of the maximum temperatures recorded in January (B)
20
18
T =-183,24728+0,09821*ANO
Temperatura ºC
16
14
Fig.A
JULHO
12
10
8
6
4
Temperatura ºC
Fig. B
JANEIRO
22
34
33
32
31
30
29
28
27
26
25
1970
1975
1980
1970
1975
1980
1985
Ano
T = - 69,72649+0,0496*ANO
1985
Ano
1990
1990
1995
1995
2000
2000
2005
2005
Climatic changes in urban environments: trends and generation of heat islands in Presidente Prudente, Brazil
Table 2. Linear regression for the mean of minimum and maximum
temperatures of Presidente Prudente
VALUES OF Y LINE
TEMP.
JULY
1971 2005
TEMPERATURE
INCREASE
DECADE
INCREASE
T=183,24728+0,09821*ANO
10,3
13,7
3,3
0,95
TEMP.
T= - 69,72649+0,0496*ANO
JANUARY
28,0
29,7
1,7
0,48
years of 1975 and 1981, being that in the first, the lowest absolute thermal value
of the entire historical time series was recorded, with –1.8ºC and the second with
temperature of –0.1ºC.
In the following decades, one notes that the absolute minimum values of the
temperatures increased more and more.
The increase in absolute minimum temperatures, as shown in Figure 6,
reflects the very high rates of soil impermeabilization, due to densely concentrated
buildings, reducing the number of trees, expansion of urban network, in addition
to tons of pollutants thrown in the atmosphere. These elements are able to retain
heat during the day and slowly disperse it at night, interfering in the energy
balance.
The increase in minimum temperatures implies in serious problems, since the
low temperatures serve as natural control to eradicate small pests in agriculture.
With reduction in the absolute minimum values, there will possibly be an increase
Figure 6. Trend of the absolute minimum values
12
T = - 195,56185+0,10055*AN O
10
Temperatura ºC
8
6
4
2
0
-2
1970
1975
1980
1985
1990
ANO
1995
2000
2005
23
Margarete C. C. T. Amorim
João L. Sant’Anna Neto
of pests, creating economic and even environmental and social problems, since
the need to control proliferation of these agents with the use of pesticides is
increasing, which is harmful to the environment and human health.
Finally, one sees that the changes in the thermal values of the city of
Presidente Prudente are not occurring in the minimum, mean, absolute maximum
and minimum values alone. The warming process is also being significant in the
temperatures recorded at nighttime, that is, at 9 pm.
The temperature at this time is extremely fundamental for the possible
inferences that a global warming is possibly occurring.
The temperatures at 9 pm in the city of Presidente Prudente has undergone
positive changes of 3.1ºC, which restates the idea by IPCC (2001) that nights are
becoming hotter and hotter in the entire globe. (Figure 7).
The temperatures recorded at 9 pm in the city of Presidente Prudente in
the last four decades underwent significant changes of approximately 0.9ºC.
Analyzing the graph of Figure 7, it becomes evident that the lowest mean
temperatures of the entire time series were those of the first quarter of the 70s.
This fact is not noted in the following years. This occurrence can be attributed
to countless spatial changes suffered by the city itself, mainly with regard to
substitution of natural materials by those of anthropic origin, in the last four or
five decades.
HEAT ISLANDS UNDER ‘IDEAL’ CONDITIONS
The temperature data analysis involved the construction of isotherms for
Figure 7. Trend for increase of the thermal mean for the period of 9 pm
26
T = - 1 5 8 ,7 4 1 5 7 + 0 ,0 9 1 2 9 * A N O
25
24
Temperatura ºC
23
22
21
20
19
18
17
24
1970
1 9 75
1980
1985
Ano
1990
1 99 5
2000
2005
Climatic changes in urban environments: trends and generation of heat islands in Presidente Prudente, Brazil
each survey. It was chosen to conduct take the temperature readings on clear
nights with low wind speed, since they favor the formation of well developed
heat islands.
In July 2002, in the southeastern region of Brazil, the cold fronts are weak
to moderate and cause only increase in cloudiness and light rain. Considering
the dry period in most of the Region, according to Climanálise (July/2002), the
few rains were around the record mean and seven frontal systems were acting
in the country, this number also within the record mean. These systems were
rapidly displaced to the Southern and Southeastern Regions and three affected
the extreme south of Bahia. On the field survey days, the region of Presidente
Prudente was affected by the following atmospheric systems:
– on July 14, there was a Polar, due to the cold front located in the
Atlantic Ocean and that was being tropicalized, allowing a new frontal
system to penetrate the south of the country. The temperature at 9 pm
at the Meteorological Station of Presidente Prudente was 16°C;
– on July 16, the polar was weakened and the temperature
increased by 4.2ºC in relation to the same time on July 14 (20.2ºC) and
a new frontal system hit the south of the country;
– on July 17, the cold front advanced over the Brazilian coast and
the polar that was acting on the region of Presidente Prudente received
a reinforcement, causing slight drop in temperature and southeast wind
(18.9ºC at 9 pm);
– on July 23, the region was under the action of a polar, since on
the 22nd, a frontal system moved toward the coast, causing rains in
the region, and stability was brought by the polar on the 23rd, with
northeast winds (4m/s) and the temperature at 9 pm rose to 21.2°C;
– on July 25, a cold front interacted with the cyclogenesis that
formed over the ocean, and the region of Presidente Prudente was
under the action of the Tropical, with weak northeast winds and
temperature of 22.6ºC at 9 pm.
Figures 8, 9, 10, 11 and 12 show the temperature distribution in Presidente
Prudente on July 14, 16, 17, 23 and 25, 2002. All the nights had a clear sky and low
wind speed, with predominance of the east quadrant or under tranquil conditions
(Table 3). This information was obtained from 8 to 9 pm at the Meteorological
Station located at FCT/UNESP of Presidente Prudente, since the course of the first
transect lasted about 33 minutes and the second about 45 minutes.
The temperature standard revealed by Figures 8, 9, 10, 11 and 12 made
it possible to distinguish some recurrent characteristics which will be shown
below.
The city usually generates heat islands with temperature increase from the
rural area and towns less densely constructed toward the densely constructed
towns and the center.
25
Margarete C. C. T. Amorim
João L. Sant’Anna Neto
Table 3. Temperature, relative humidity, wind direction and speed data at the
Meteorological Station of FCT/UNESP.
FCT/UNESP
Relative
Wind
Wind Veloc. NEB
Humidity (%) Direction
(m/s)
14/07 20:00
16
77
SE
0,5
0
21:00
16
77
CL
0,0
0
16/07 20:00
20,0
59
CL
0,0
0
21:00
20,2
54
CL
0,0
0
17/07 20:00
19,7
43
SE
1,0
0
21:00
18,9
45
SE
3,0
0
23/07 20:00
21,4
77
NE
0,5
0
21:00
21,2
78
E
4,0
0
25/07 20:00
23,8
51
NE
0,5
0
21:00
22,6
53
CL
0,0
0
Source: Meteorological Station of FCT/UNESP – July/2002
DAY
Hour
Temp (oC)
Strong heat islands were observed on all the days, with amplitudes between
the hottest and coldest point oscillating between 4.9ºC and 9.6ºC, as can be seen
in Table 4. The amplitudes were less on days with slightly stronger winds (5.4ºC
on the 17th, with wind of 3.0m/s and 4.9ºC on the 23rd, with wind of 4.0m/s).
In the majority of the heat island studies conducted at nighttime, the center
of the island is well defined and often located in the center of the city with
greater density of constructions or in the industrial districts.
In Presidente Prudente, however, at least two separate cells of the heat
island were detected, which can be directly attributed to urban causes.
Firstly, a bigger cells was noted with hotter air located in the central area
towards the north and south part of the city, where the older and densely
constructed districts are located.
To the extent in which the constructions reduced, there was a temperature
drop toward the rural area.
The second cell was located in the western part of the city, where there
were two densely constructed housing assemblies. The temperatures in this cell,
although high when compared to other points of the city, were 1ºC to 2ºC lower
in relation to the center. Thus, besides the temperature being slightly lower than
in the center of the city, its size was quite smaller in relation to the center and
its surrounding.
The localization of higher temperatures proved to be directly related to the
Table 4. Maximum, minimum temperatures and thermal amplitude between the points
Temp.(oC) 14/07
16/07
Maximum
17,9
22,3
Minimum
11,9
14,8
Amplitude
6,0
7,5
Source: Field Work - 2002
26
17/07
20,1
14,7
5,4
23/07
22,3
17,4
4,9
25/07
26,7
17,1
9,6
Climatic changes in urban environments: trends and generation of heat islands in Presidente Prudente, Brazil
density of constructions and excess night heat, attributed to release of heat stored
during the day by the buildings.
Reduction in the construction density has a pronounced effect in breaking
the continuity of higher temperature distribution.
Under tranquil conditions and wind speed of 0.5m/s, lower temperatures
were observed between the cells of the western part and central area, even
though inserted in the urban network.
The interval of the lower temperatures between the two main cells with
higher temperatures was broken on July 17, due to the presence of weak
southeast winds, between 1m/s at 8 pm and 3m/s at 9 pm. The air circulation
was enough to homogenize the higher temperatures throughout the western part
of the city, regardless of the density of the constructions. The heat produced in
the more densely constructed area was distributed by the predominant southeast
wind and only the rural area and districts located to the east of the center of the
city had lower temperatures on this day.
Figure 8. Presidente Prudente: air temperature – 14.07.2002 – 8:00 pm
N
T oC
7557000
17.5
17.0
16.5
16.0
15.5
7554000
15.0
14.5
14.0
13.5
7551000
13.0
12.5
12.0
7548000
1000
0
1000
452000
0
1000
3000 m
1000
2000
2000
3000 (m)
455000
458000
461000
Org. Margarete C. de C. Trindade Amorim
27
Margarete C. C. T. Amorim
João L. Sant’Anna Neto
Figure 9. Presidente Prudente: air temperature – 16.07.02 – 8:00 pm
N
T oC
7557000
22.0
21.5
21.0
20.5
20.0
19.5
7554000
19.0
18.5
18.0
17.5
17.0
7551000
16.5
16.0
15.5
15.0
7548000
1000 0
1000
452000
0
1000
3000 m
1000
2000
2000
3000 (m)
455000
458000
461000
Org. Margarete C. de C. Trindade Amorim
In all the days surveyed, the limits of the constructed areas toward the rural
area clearly defined the heat island. However, the intra-urban areas with lower
construction density were subject to higher temperatures due to breezes coming
from the east quadrant, where the higher temperatures are located, usually at
nighttime.
On nights without cloudiness, as in those observed in this study, in the rural
environment, the bottom of the valleys favored the lower temperatures, as was
seen in the southern, western and eastern part of the urban stain.
The isotherms shown in Figures 8, 9, 10, 11 and 12 explain the lower
temperatures at the bottom of the valleys in the rural area.
Most of the brooks located in the urban environment were channeled. At
nighttime, the points with lower altitudes did not “break” the main heat island
found in the city. Even the Parque do Povo [People’s Park], where Córrego do
Veado was channeled and the area was covered by low and tree vegetation, the
heavy flow of vehicles and soil use in the avenues at the margin of the bottom of
28
Climatic changes in urban environments: trends and generation of heat islands in Presidente Prudente, Brazil
Figure 10. Presidente Prudente: air temperature – 17.07.02 – 8:00 pm
N
T oC
7557000
19.5
19.0
18.5
18.0
7554000
17.5
17.0
16.5
16.0
7551000
15.5
15.0
14.5
7548000
1000
0
1000
452000
0
1000
3000 m
1000
2000
2000
3000 (m)
455000
458000
461000
Org. Margarete C. de C. Trindade Amorim
the valley (commercial and residential) caused the temperatures to remain high.
FINAL CONSIDERATIONS
The city of Presidente Prudente has been undergoing an increase in its
temperature year after year, as was observed in the analyses made in the setoff
this work.
The modifications of the minimum, absolute minimum, mean, maximum
values and especially in the nighttime temperatures (recorded at 9 pm) restate a
series of occurrences that unfolded throughout the history of the city of Presidente
Prudente and shows a trend that, although observed for the city of Presidente
Prudente, has been becoming increasingly common around the globe, the
increase of nighttime temperatures. This fact, associated with countless others,
ends up taking leading many experts to confirm the occurrence of changes in
the global climate.
29
Margarete C. C. T. Amorim
João L. Sant’Anna Neto
Figure 11. Presidente Prudente: air temperature – 23.07.02 – 8:00 pm
N
T oC
7557000
22.0
21.5
21.0
20.5
7554000
20.0
19.5
19.0
7551000
18.5
18.0
17.5
7548000
1000 0
1000
452000
0
1000
3000 m
1000
2000
2000
3000 (m)
455000
458000
461000
Org. Margarete C. de C. Trindade Amorim
The changes in landscape and implementation of materials capable of
retaining heat during the day and releasing it at night causes changes in the city’s
energy balance, as previously describe and well observed by Amorim (2000 and
2002) for the city of Presidente Prudente.
Modification of this energy balance is not something observed only in mediumsize cities like Presidente Prudente. The same occurs in greater proportions in
the world large metropolitan cities like São Paulo, described by Lombardo (1985)
and possibly influencing the global warming observed in the last decades.
Therefore, to consider the changes undergone by the spaces, substitution of
natural materials for those of human origin and changes in the energy balance is
without doubt of utmost importance, but one must also take into consideration
the natural processed unfolded in our galaxy before saying which are the factors
responsible for the global climatic changes or global changes.
The intra-urban and rural variations shown in this study allows one to state
30
Climatic changes in urban environments: trends and generation of heat islands in Presidente Prudente, Brazil
Figure 12. Presidente Prudente: air temperature – 25.07.02 – 8:00 pm
N
T oC
26.5
7557000
26.0
25.5
25.0
24.5
24.0
23.5
7554000
23.0
22.5
22.0
21.5
21.0
20.5
20.0
7551000
19.5
19.0
18.5
18.0
17.5
7548000
1000
0
1000
452000
0
1000
3000 m
1000
2000
2000
3000 (m)
455000
458000
461000
Org. Margarete C. de C. Trindade Amorim
that the city has a set of microclimates.
These differences are especially pronounced under clear and tranquil
conditions, when the various surfaces allow the development of their own
microclimatic characteristics.
The differences in altitude in the rural environment were very representative,
the lower temperatures being at the bottom of the valley. In the urban
environment, the differences were linked to the construction density, since the
“heat island” did not disappear at lower altitudes where there were brooks with
closed channeling.
One thus recommends that the indiscriminate impermeabilization of the
soil be stopped in new settlements, respecting the areas intended for greenery
and protection of water sources, for the generation of higher temperatures to be
reduced with the city’s growth.
Naturally, the tropical environment is capable of generating discomfort due
31
Margarete C. C. T. Amorim
João L. Sant’Anna Neto
to the great amount of heat, increased by the growth of the cities. Therefore,
on setting up new settlements, one must consider the climatic characteristics,
avoiding generalized impermeabilization of the soil, use of improper materials
in construction, felling of original vegetation without being concerned about
leaving areas that can contribute toward reducing the high temperatures.
BIBLIOGRAPHICAL REFERENCES
AMORIM, M. C. C. T. (2000). O clima urbano de Presidente Prudente/SP. Thesis
(PhD in Geography), FFLCH, Universidade de São Paulo, 374 p.
AMORIM, M. C. C. T. (2002). Características do Clima Urbano de Presidente
Prudente/SP. In J. L. Sant’Anna Neto (ed.), Os Climas das Cidades Brasileiras.
Presidente Prudente: FCT/UNESP.
BESSAT, F. A. (2003). Mudança climática entre ciência, desafios e decisões: olhar
geográfico. Revista Terra Livre 19 (1) nº 20.
CLIMANÁLISE. (2002). Cachoeira Paulista: INPE/CPTEC, Julho/2002, v. 17, n.
07.
GÓMEZ, A. L., Garcia, F. F. (1984). La isla de calor en Madrid: avance de un
estudio de clima urbano. Estudios Geográficos 45 (174), enero-marzo: p. 5-34.
IPCC. (2001). Climate Change: Impacts, Adaptation and Vulnerability. Contribution
of Working Group II to be the Trird Assessment Report of the Intergovernmental
Panel on Climate Change. Cambridge: Cambridge University Press.
JOHNSON, D. B. (1985). Urban modification of diurnal temperature cycles in
Birmingham, U. K. Journal of climatology 5: p. 221-225.
LOMBARDO, M. A. (1985). Ilha de Calor nas Metrópoles: O exemplo de São Paulo.
Editora HUCITEC, São Paulo.
MONTEIRO, C. A. de F. (1976). Teoria e Clima Urbano. São Paulo: IGEOG/USP,
181 p. (Série Teses e Monografias, 25).
MONTEIRO, C. A. de F. (1990). A cidade como processo derivador ambiental e
estrutura geradora de um “clima urbano”, Florianópolis, Geosul 5 (9): p. 80114.
OKE, T. R., Maxwell, G. B. (1975). Urban heat island dynamics en Montreal and
Vancouver. Atmospheric Environment 9: p. 191-200.
PITTON, S. E. C. (1997). As cidades como indicadores de alterações térmicas.
Thesis (PhD in Geography), FFLCH, Universidade de São Paulo, 272 p.
SANT’ANNA NETO, J. L.; Barrios, N. A. Z. (1996). A circulação atmosférica no
extremo oeste paulista. In J. L. Sant’Anna Neto (ed.), Boletim Climatológico,
Presidente Prudente: UNESP.
32
Baixar