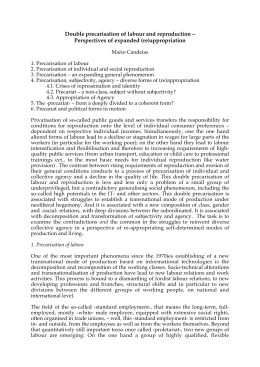
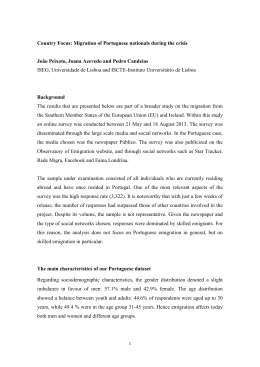
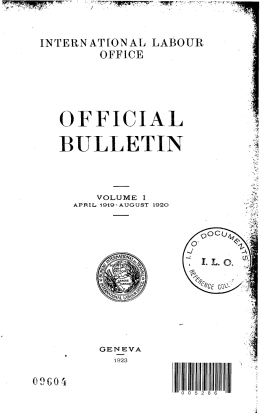
Global Wage Report 2012/13
Wages and equitable growth
International Labour Organization
The International Labour Organization (ILO) was founded in 1919 to promote
social justice and thereby contribute to universal and lasting peace. The ILO is
responsible for drawing up and overseeing international labour standards. It is
the only tripartite United Nations agency that brings together representatives of
governments, employers and workers to jointly shape policies and programmes
promoting Decent Work for all. This unique arrangement gives the ILO an edge
in incorporating ‘real world’ knowledge about employment and work.
Global Wage Report
2012/13
Wages and equitable growth
International Labour Office · Geneva
Copyright © International Labour Organization 2013
First published 2013
Publications of the International Labour Office enjoy copyright under Protocol 2 of the Universal Copyright Convention. Nevertheless, short excerpts from them may be reproduced without authorization, on condition that the source is indicated. For rights of
reproduction or translation, application should be made to ILO Publications (Rights and Permissions), International Labour Office,
CH-1211 Geneva 22, Switzerland, or by email: [email protected]. The International Labour Office welcomes such applications.
Libraries, institutions and other users registered with reproduction rights organizations may make copies in accordance with the
licences issued to them for this purpose. Visit www.ifrro.org to find the reproduction rights organization in your country.
Global Wage Report 2012/13: Wages and equitable growth
Geneva, International Labour Office, 2013
wages / minimum wage / employment / unemployment / household income / labour productivity / economic recession /
developed countries / developing countries
13.07
ISBN 978-92-2-126236-7 (print)
ISBN 978-92-2-126237-4 (PDF)
Also available in PDF in Arabic: ISBN 978-92-2-626237-9; Chinese: ISBN 978-92-2-526237-0; French: ISBN 978-92-2226237-3; Portuguese: ISBN 978-92-2-826237-7; Russian: ISBN 978-92-2-426237-1; Spanish: ISBN 978-92-2-326237-2.
Also available as EPUB in English: ISBN 978-92-2-126923-6; French: ISBN 978-92-2-226923-5; and Spanish: ISBN 978-92-2326923-4. Also available in Kindle and iBook edition.
ILO Cataloguing in Publication Data
The designations employed in ILO publications, which are in conformity with United Nations practice, and the presentation
of material therein do not imply the expression of any opinion whatsoever on the part of the International Labour Office concerning the legal status of any country, area or territory or of its authorities, or concerning the delimitation of its frontiers.
The responsibility for opinions expressed in signed articles, studies and other contributions rests solely with their authors,
and publication does not constitute an endorsement by the International Labour Office of the opinions expressed in them.
Reference to names of firms and commercial products and processes does not imply their endorsement by the International Labour Office, and any failure to mention a particular firm, commercial product or process is not a sign of disapproval.
ILO publications and electronic products can be obtained through major booksellers or ILO local offices in many
countries, or direct from ILO Publications, International Labour Office, CH-1211 Geneva 22, Switzerland. Catalogues or lists of new publications are available free of charge from the above address, or by email: [email protected].
Visit our website: www.ilo.org/publns.
Preface
The global crisis has had significant negative repercussions for labour markets in many
parts of the world, and recovery is proving uncertain and elusive. At the global level,
average wages have grown but at lower rates than before the crisis. However this
Global Wage Report 2012/13 shows that the impact of the crisis on wages was far from
uniform.
In developed economies, the crisis led to a “double dip” in wages: real average
wages fell in 2008 and again in 2011, and the current outlook suggests that in many of
these countries wages are growing marginally, if at all, in 2012.
In emerging regions, wage growth has generally been more resilient, with strong
growth in Asia and more modest but still positive trends in Africa, Latin America and
the Caribbean.
In Eastern Europe and Central Asia the crisis led to falling wages in 2009, with a
return to positive but relatively lower wage growth since then.
Taking a longer view, the report estimates that real monthly average wages almost
doubled in Asia between 2000 and 2011, and increased by 18 per cent in Africa, 15 per
cent in Latin America and the Caribbean, and 5 per cent in developed economies. In
Eastern Europe and Central Asia wages nearly tripled, but from a very low base following the economic collapse of the 1990s. In the Middle East, the availability of wage
data is limited. What evidence is available indicates that low productivity and weak
institutions have kept wages stagnant over the last decade.
This Global Wage Report presents data on trends in wages around the world and
compares them with trends in labour productivity, analysing their complex effects on
the global economy with a view to shedding some light on the current debates over
distribution, competitiveness and labour costs. When wages rise in line with productivity increases they are both sustainable and create a stimulus for further economic growth
by increasing households’ purchasing power. However for a decade or more before the
crisis, the link between wages and labour productivity was broken in many countries
and this contributed to the creation of global economic imbalances. The report shows
that since the 1980s a majority of countries have experienced a downward trend in the
“labour income share”, which means that a lower share of national income has gone
into labour compensation and a higher share into capital incomes. This has happened
most frequently where wages have stagnated but also in some countries where real
wages have grown strongly. On a social and political level this trend risks creating
perceptions that workers and their families are not receiving their fair share of the
wealth they create. On an economic level, it could endanger the pace and sustainability
of future economic growth by constraining wage-based household consumption. This
is particularly true where the era of debt-based consumption has now led to an extended
period in which households must pay off earlier debts.
At the global level, while some countries can run a trade surplus or export their
way out of recession, this must come at the expense of deficits in importing countries
vi
Global Wage Report 2012/13
and relocation of jobs. To avoid beggar-thy-neighbour competition, the path to sustained
and balanced economic growth must come through increased domestic consumption in
surplus countries, based on wages that grow in line with productivity. International
coordination can contribute to achieving equitable outcomes that benefit all countries.
Many countries in the world are trying to address these challenges, often by
implementing innovative policies. I hope this Global Wage Report will help them and
will stimulate fresh thinking on issues which today stand at the centre of international
decision-making.
Guy Ryder
ILO Director-General
Contents
Preface . . . . . . . . . . . . . . . . . . . . . . . . . . . . . . . . . . . . . . . . . . . . . . . . . . . . . . . . . . . . . . . v
Contents . . . . . . . . . . . . . . . . . . . . . . . . . . . . . . . . . . . . . . . . . . . . . . . . . . . . . . . . . . . . . . vii
Acknowledgements . . . . . . . . . . . . . . . . . . . . . . . . . . . . . . . . . . . . . . . . . . . . . . . . . . . . . xi
Executive summary . . . . . . . . . . . . . . . . . . . . . . . . . . . . . . . . . . . . . . . . . . . . . . . . . . . . . xiii
Part I Major trends in wages
1 The global economic context: Crisis, recession and employment . . . . . . . . . . . 1
1.1 Economic growth rates vary widely by region . . . . . . . . . . . . . . . . . . . . . . . . . 1
1.2 Global unemployment rates remain high . . . . . . . . . . . . . . . . . . . . . . . . . . . . . 3
2 Real average wages . . . . . . . . . . . . . . . . . . . . . . . . . . . . . . . . . . . . . . . . . . . . . . . . . 3
2.1 Slowing growth across a varied landscape . . . . . . . . . . . . . . . . . . . . . . . . . . . . . 3
2.2 The gender pay gap . . . . . . . . . . . . . . . . . . . . . . . . . . . . . . . . . . . . . . . . . . . . . . . 4
3 Regional estimates . . . . . . . . . . . . . . . . . . . . . . . . . . . . . . . . . . . . . . . . . . . . . . . . . 7
3.1 Overall growth masks a complex picture . . . . . . . . . . . . . . . . . . . . . . . . . . . . . 7
3.2 Developed economies . . . . . . . . . . . . . . . . . . . . . . . . . . . . . . . . . . . . . . . . . . . . 10
3.3 Eastern Europe and Central Asia . . . . . . . . . . . . . . . . . . . . . . . . . . . . . . . . . . . 16
3.4 Asia and the Pacific . . . . . . . . . . . . . . . . . . . . . . . . . . . . . . . . . . . . . . . . . . . . . 20
3.6 The Middle East . . . . . . . . . . . . . . . . . . . . . . . . . . . . . . . . . . . . . . . . . . . . . . . . 29
3.7Africa . . . . . . . . . . . . . . . . . . . . . . . . . . . . . . . . . . . . . . . . . . . . . . . . . . . . . . . . 32
4 Minimum wages and the working poor . . . . . . . . . . . . . . . . . . . . . . . . . . . . . . . . 35
4.1 Developed economies . . . . . . . . . . . . . . . . . . . . . . . . . . . . . . . . . . . . . . . . . . . . 36
4.2 Developing and emerging economies . . . . . . . . . . . . . . . . . . . . . . . . . . . . . . . 36
Part II Falling labour shares and equitable growth
5 The fall in the labour income share . . . . . . . . . . . . . . . . . . . . . . . . . . . . . . . . . . . . 41
5.1 Trends in labour shares . . . . . . . . . . . . . . . . . . . . . . . . . . . . . . . . . . . . . . . . . . . 41
5.2 The gap between wages and productivity . . . . . . . . . . . . . . . . . . . . . . . . . . . . 45
5.3 The role of financial markets and other factors . . . . . . . . . . . . . . . . . . . . . . . . 48
6 The effects of labour income shares on economic growth . . . . . . . . . . . . . . . . . . 53
6.1 Falling labour shares and aggregate demand: Ambiguous effects . . . . . . . . . . 53
6.2 In pursuit of the optimal labour share . . . . . . . . . . . . . . . . . . . . . . . . . . . . . . . 56
6.3 The “Great Recession” and the opportunity for more balanced growth . . . . . 59
viii
Global Wage Report 2012/13
7
Internal and external imbalances . . . . . . . . . . . . . . . . . . . . . . . . . . . . . . . . . . . . . 61
7.1 Functional and personal income distribution . . . . . . . . . . . . . . . . . . . . . . . . . . 61
7.2 Wage-based consumption is down, affecting the recovery . . . . . . . . . . . . . . . 61
Part II Implications for equitable growth
8
Reconnecting wages and productivity . . . . . . . . . . . . . . . . . . . . . . . . . . . . . . . . . 62
8.1 Coordinated policy action . . . . . . . . . . . . . . . . . . . . . . . . . . . . . . . . . . . . . . . . 62
8.2 Strengthening existing institutions . . . . . . . . . . . . . . . . . . . . . . . . . . . . . . . . . . 63
8.3 Beyond labour markets . . . . . . . . . . . . . . . . . . . . . . . . . . . . . . . . . . . . . . . . . . . 63
8.4 Specificities of developing countries . . . . . . . . . . . . . . . . . . . . . . . . . . . . . . . . 64
Appendices
Appendix I: Global wage trends: Methodological issues . . . . . . . . . . . . . . . . . . . . . 67
Appendix II: How a divergence between labour productivity and wages
influences unit labour costs and the labour income share . . . . . . . . . . . . . . . . 75
Appendix III: Determinants of labour shares . . . . . . . . . . . . . . . . . . . . . . . . . . . . . . 79
Appendix IV: The effect of labour share on aggregate demand . . . . . . . . . . . . . . . . 87
Notes . . . . . . . . . . . . . . . . . . . . . . . . . . . . . . . . . . . . . . . . . . . . . . . . . . . . . . . . . . . . . . . . . 93
Bibliography . . . . . . . . . . . . . . . . . . . . . . . . . . . . . . . . . . . . . . . . . . . . . . . . . . . . . . . . . . 101
Tables
1. Cumulative real wage growth by region since 2000 (index: 2000 = 100) . . . . . . . . 10
2. Direction of effects of a 1% decrease in labour income share on private consumption
of domestic goods and services, investment and net exports in 16 economies . . . . 54
Figures
1.
2.
3.
4.
5.
6.
Annual average economic growth, 1995–2012 (GDP in constant prices) . . . . . . . . 1
Total unemployment rates in the world and in developed economies, 2005–11 . . . . 2
Annual average global real wage growth, 2006–11 . . . . . . . . . . . . . . . . . . . . . . . . . 2
The gender pay gap (GPG), 1999–2007 and 2008–11 . . . . . . . . . . . . . . . . . . . . . . . 5
The gender pay gap in Estonia, 1993–2009 . . . . . . . . . . . . . . . . . . . . . . . . . . . . . . . 6
The gender pay gap in Norway by employment status, 2008–11 . . . . . . . . . . . . . . . 7
Contents
ix
7. Annual average real wage growth by region, 2006–11 . . . . . . . . . . . . . . . . . . . . . . 8
8. International comparison of hourly direct pay for time worked
in manufacturing, 2010 (US$) . . . . . . . . . . . . . . . . . . . . . . . . . . . . . . . . . . . . . . . . . 11
9. Trends in nominal wage growth and inflation in advanced economies, 2006–11 (%) 12
10. Growth in output and employment in developed economies,
1999–2007 and 2008–11 (%) . . . . . . . . . . . . . . . . . . . . . . . . . . . . . . . . . . . . . . . . . . . 13
11. Growth in real wages and labour productivity in developed economies,
1999–2007 and 2008–11 (%) . . . . . . . . . . . . . . . . . . . . . . . . . . . . . . . . . . . . . . . . . . 14
12. Growth in output and employment in Eastern Europe and Central Asia,
1999–2007 and 2008–11 (%) . . . . . . . . . . . . . . . . . . . . . . . . . . . . . . . . . . . . . . . . . . 17
13. Growth in wages and labour productivity in Eastern Europe and Central Asia,
1999–2007 and 2008–11 (%) . . . . . . . . . . . . . . . . . . . . . . . . . . . . . . . . . . . . . . . . . . 18
14. Index of real wages in the Russian Federation since 1990 (1990 = 100) . . . . . . . . . 19
15. Annual average real wage growth in Asia, 2006–11 . . . . . . . . . . . . . . . . . . . . . . . . 20
16. Growth in output and employment in Asia, 1997–2007 and 2008–11 (%) . . . . . . . 21
17. Growth in output and in numbers of paid employees in Asia,
1997–2007 and 2008–11 (%) . . . . . . . . . . . . . . . . . . . . . . . . . . . . . . . . . . . . . . . . . . 22
18. Growth in wages and labour productivity in Asia, 1997–2007 and 2008–11 (%) . . 24
19. Growth in output and employment in Latin America and the Caribbean,
1997–2007 and 2008–11 (%) . . . . . . . . . . . . . . . . . . . . . . . . . . . . . . . . . . . . . . . . . . 26
20. Economic growth and unemployment in Latin America and the Caribbean, 2004–11 (%) 27
21. Annual average real wage growth in Brazil, 2006–11 . . . . . . . . . . . . . . . . . . . . . . . . 27
22. Growth in wages and labour productivity in selected Latin American and Caribbean
countries, 2004–11 (%) . . . . . . . . . . . . . . . . . . . . . . . . . . . . . . . . . . . . . . . . . . . . . . . 28
23. Growth in output and employment in the Middle East, 1999–2007 and 2008–11 (%) 30
24. Growth in wages and labour productivity in the Middle East, 1999–2011 (%) . . . . 31
25. Growth in output and employment in Africa, 1999–2007 and 2008–11 (%) . . . . . . 33
26. Growth in output and numbers of paid employees in Africa,
1999–2007 and 2008–11 (%) . . . . . . . . . . . . . . . . . . . . . . . . . . . . . . . . . . . . . . . . . . 34
27. Growth in wages and labour productivity in selected
African countries, 1999–2011 (%) . . . . . . . . . . . . . . . . . . . . . . . . . . . . . . . . . . . . . . 35
28. Minimum wage levels in selected developed economies, in PPP$
and as a share of median full-time wage, 2010 . . . . . . . . . . . . . . . . . . . . . . . . . . . . 37
29. Minimum wage growth in developed economies, 2006–11 . . . . . . . . . . . . . . . . . . . 37
30. Employed working poor (earning below US$1.25 and US$2 a day),
as % of total employees . . . . . . . . . . . . . . . . . . . . . . . . . . . . . . . . . . . . . . . . . . . . . . 40
31. Adjusted labour income shares in developed economies, Germany,
the USA and Japan, 1970–2010 . . . . . . . . . . . . . . . . . . . . . . . . . . . . . . . . . . . . . . . . 43
32. Adjusted labour income shares in developing and emerging economies, 1970–2007 44
33. Unadjusted labour income share in China, 1992–2008 . . . . . . . . . . . . . . . . . . . . . . . 45
34. Hourly productivity and compensation in the United States, Q1 1947–Q1 2012 . . . 46
35. Trends in labour productivity and wages in Germany, 1991–2011 . . . . . . . . . . . . . . . 47
x
Global Wage Report 2012/13
36. Trends in growth in average wages and labour productivity in
developed economies (index: 1999 = 100) . . . . . . . . . . . . . . . . . . . . . . . . . . . . . . . 48
37. Factors influencing the labour income share . . . . . . . . . . . . . . . . . . . . . . . . . . . . . . . . . 49
38. Decomposing changes in the average adjusted labour income share
between 1990/94 and 2000/04 . . . . . . . . . . . . . . . . . . . . . . . . . . . . . . . . . . . . . . . . . 52
39. The macroeconomic effects of functional income shares . . . . . . . . . . . . . . . . . . . . . 54
40. Unit labour costs in selected eurozone countries, 2000–10 (index: 2000 = 100) . . . 57
41. Changes in current account balance and household debt in selected countries,
2003–10 . . . . . . . . . . . . . . . . . . . . . . . . . . . . . . . . . . . . . . . . . . . . . . . . . . . . . . . . . . . 59
Box
1. Poverty among waged and salaried workers . . . . . . . . . . . . . . . . . . . . . . . . . . . . . . 39
Appendix figure
A1. Effect of a 1% decrease in labour income share on private consumption of domestic
goods and services, investment and net exports: (a) private consumption of goods
and services; (b) investment; (c) net exports . . . . . . . . . . . . . . . . . . . . . . . . . . . . . . 91
Appendix boxes
A1. Data selection and estimation procedure: An econometric methodology . . . . . . . . . 79
A2. Data, estimation and simulations . . . . . . . . . . . . . . . . . . . . . . . . . . . . . . . . . . . . . . . 87
Appendix tables
A1. Regional groups . . . . . . . . . . . . . . . . . . . . . . . . . . . . . . . . . . . . . . . . . . . . . . . . . . . . 68
A2. Coverage of the Global Wage Database, 2010 (%) . . . . . . . . . . . . . . . . . . . . . . . . . . 69
A3. Coverage of the Global Wage Database, 2006–11 (%) . . . . . . . . . . . . . . . . . . . . . . . 70
A4. The factors influencing the adjusted labour income shares . . . . . . . . . . . . . . . . . . . 83
A5. The impact of external factors on adjusted labour income shares . . . . . . . . . . . . . . . 84
A6. Description of countries included in the estimation of tables A4 and A5 and box A1 84
The ILO Global Wage Database is available at: www.ilo.org/wage12.
Scan the QR code with your smartphone to access
the ILO Global Wage Database website.
Acknowledgements
Main contributors
The report was prepared by staff of the Conditions of Work and Employment Branch
(TRAVAIL) of the ILO with contributions from colleagues in other ILO departments
in Geneva and field offices, under the responsibility of Philippe Marcadent, Director of TRAVAIL. The principal editor of the report was Patrick Belser. The report is
the result of teamwork between Patrick Belser, Malte Luebker, Sangheon Lee, Andrés
Marinakis, Kristen Sobeck, Daniel Vaughan-Whitehead, Jacobo Velasco and Rosalia
Vazquez-Alvarez. Excellent research assistance was provided by Rengin Gunaydin
and Mila Daskalova. Kristen Sobeck managed the Global Wage Database and created
figures for Part I. Malte Luebker reviewed the global and regional estimates. Rosalia
Vazquez-Alvarez provided inputs on wage policies in the Middle East and reviewed
Part II of the report. Charlotte Beauchamp coordinated editing and publication. Christian Olsen designed the cover page.
Specific contributions
Part II of the report is based on a research project on ‘The macroeconomic analysis of
wages’ coordinated by Sangheon Lee (ILO, TRAVAIL). The project included contributions from Özlem Onaran (University of Westminster), Giorgos Galanis (University of
Westminster and University of Warwick), Marc Lavoie (University of Ottawa), Engelbert Stockhammer (Kingston University), Eckhard Hein (Berlin School of Economics
and Law), Matthias Mund (Berlin School of Economics and Law), Servaas Storm (Delft
University of Technology), C.W.M. Naastepad (Delft University of Technology), Till
Van Treeck (Macroeconomic Policy Institute Düsseldorf) and Simon Sturn (University
of Massachusetts Amherst). The project also benefited from inputs from Massimiliano
La Marca (ILO, Policy Integration).
Special thanks
Our special thanks go to the whole team of the ILO/SIALC (Information System and
Labour Analysis) in Panama, in particular Bolívar Pino, for providing wage data on
Latin America and the Caribbean, as well as to Steven Kapsos, for providing the analysis on poverty among wage and salaried workers.
We also would like to thank the following people for their precious input and
comments: Janine Berg, Fabio Bertranou, Evangelia Bourmpoula, Monica Castillo,
xii
Global Wage Report 2012/13
Juan Chacaltana, Matthieu Charpe, Miguel del Cid, Maria Crisetti, Mauricio Dierckxsens, Chris Edgar, Philippe Egger, Lawrence Egulu, Ekkehard Ernst, Verónica Escudero, Regina Galhardi, Werner Garate, Najati Ghosheh, David Glejberman, Stefan
Kühn, Sameer Khatiwada, David Kucera, Bob Kyloh, Chang-Hee Lee, Elva Lopez
Mourelo, Moazam Mahmood, Anne Posthuma, Stephen Pursey, Uma Rani, John
Ritchotte, Catherine Saget, Reynold Simons, Vincenzo Spiezia, Steven Tobin, Manuela Tomei, Raymond Torres, Geir Tonstol, Zafiris Tzannatos, María Elena Valenzuela,
Sher Verick, and four anonymous peer reviewers.
Executive summary
Major trends in wages
The crisis continues to dampen wages
Real average wage growth has remained far below pre-crisis levels globally, going
into the red in developed economies, although it has remained significant in emerging economies. Monthly average wages adjusted for inflation – known as real average wages – grew globally by 1.2 per cent in 2011, down from 2.1 per cent in 2010
and 3 per cent in 2007. Because of its size and strong economic performance, China
weighs heavily in this global calculation. Omitting China, global real average wages
grew at only 0.2 per cent in 2011, down from 1.3 per cent in 2010 and 2.3 per cent in
2007 (see figure 3).
Regional differences in wage growth
There are major geographic variations in the trends in real average wage growth (see
figure 7). Wages suffered a double dip in developed economies but remained positive
throughout the crisis in Latin America and the Caribbean, and even more so in Asia.
Fluctuations were widest in Eastern Europe and Central Asia, partly as a result of
the strong post-transition recovery in wages before the global economic crisis, and
the severe contraction in real wages in 2009. In the Middle East, real average wages
appear to have declined since 2008, but some of the estimates still remain tentative,
as they are for Africa.
Cumulative wage growth by region
Differences between the regions are particularly stark if we look at the cumulative
wage growth from 2000 to 2011. Globally, real monthly average wages grew by
just under a quarter, in Asia they almost doubled, while in the developed world they
increased by about 5 per cent. In Eastern Europe and Central Asia real wages nearly
tripled, but this was mostly as part of the recovery from the transition to market
economies. In Russia, for example, the real value of wages collapsed to less than
40 per cent of their value in the 1990s and it took another decade before wages recovered to their initial level.
Regional differences in wage levels
While wages grew significantly in emerging economies, differences in wage levels
remain considerable. In the Philippines, a worker in the manufacturing sector took
home around US$1.40 for each hour worked. In Brazil, the hourly direct pay in the
xiv
Global Wage Report 2012/13
sector was US$5.40, in Greece it was US$13.00, in the United States US$23.30 and
in Denmark US$34.80 (2010 exchange rates, rounded).
Falling labour shares and equitable growth
A smaller piece of the pie for workers across the world
Between 1999 and 2011 average labour productivity in developed economies increased
more than twice as much as average wages (see figure 11). In the United States,
real hourly labour productivity in the non-farm business sector increased by about
85 per cent since 1980, while real hourly compensation increased by only around
35 per cent. In Germany, labour productivity surged by almost a quarter over the past
two decades while real monthly wages remained flat.
The global trend has resulted in a change in the distribution of national income,
with the workers’ share decreasing while capital income shares increase in a majority of countries. Even in China, a country where wages roughly tripled over the last
decade, GDP increased at a faster rate than the total wage bill – and hence the labour
share went down.
The drop in the labour share is due to technological progress, trade globalization,
the expansion of financial markets, and decreasing union density, which have eroded
the bargaining power of labour. Financial globalization, in particular, may have played
a bigger role than previously thought.
The effects of a declining labour share
A decrease in the labour share not only affects perceptions of what is fair – particularly given the growing concerns about excessive pay among CEOs and in the financial sector – it also hurts household consumption and can thus create shortfalls in the
aggregate demand. These shortfalls in some countries have been compensated by
increasing their net exports, but not all countries can run a current account surplus
at the same time. Hence, a strategy of cutting unit labour costs, a frequent policy
recommendation for crisis countries with current account deficits, may run the risk
of depressing domestic consumption more than it increases exports. If competitive
wage cuts are pursued simultaneously in a large number of countries, this may lead
to a “race to the bottom” in labour shares, shrinking aggregate demand.
Implications for equitable growth
Income distribution and wage levels
The Global Wage Report contributes to a wider literature on the changes in the
distribution and levels of wages within and across countries, as well as on the
economic and social implications of these trends. One of the key findings of this
literature is the growing inequality in income, in terms of functional and personal
income distribution.
Executive summary
xv
In terms of functional income distribution, which concerns how national income
has been distributed between labour and capital, there is a long run trend towards a falling share of wages and a rising share of profits in many countries. The personal distribution of wages has also become more unequal, with a growing gap between the top
10 per cent and the bottom 10 per cent of wage earners. These internal “imbalances”
have tended to create or exacerbate external imbalances, even before the Great Recession, with countries trying to compensate the adverse effects of lower wage shares on
consumption demands through easy credit or export surpluses.
Better linking productivity and wages
What should be done? Our analysis suggests that policy actions towards “rebalancing”
should be taken at both national and global levels. In attempting to redress external
imbalances, policy-makers should refrain from a simplistic view that countries can
“cut” their way out of the recession. Policy-makers should pursue policies that promote
a close connection between the growth of labour productivity and the growth of workers compensation. The existence of large current-account surplus in some countries
suggest that there is room to better link productivity increases and wages as a means to
stimulate domestic demand. Policy-makers should be careful not to promote a race to
the bottom in labour shares in deficit countries or throughout the Eurozone. Austerity
measures that are imposed from the outside and bypass social partners harm effective
labour relations.
Strengthening institutions
“Internal rebalancing” can begin by strengthening institutions for wage determination.
Given the difficulty with organizing workers, particularly in the context of increasing labour market segmentation and rapid technological changes, more supporting and
enabling environments need to be created for collective bargaining. Low-paid workers also need stronger protection in wage determination. Minimum wages, if properly
designed, have proved an effective policy tool which can provide a decent wage floor
and thus secure a minimum living standard for these workers and their families.
Reforms outside the scope of the labour market
It is unrealistic to try to achieve income distribution solely through labour market policies. Redistribution will also require a number of changes that lie outside of the scope
of labour markets, including reform and repair of financial markets to restore their role
in channelling resources into productive and sustainable investments. There are other
critical dimensions of “rebalancing” which deserve a more detailed analysis, including
the balance between taxation of capital and labour incomes.
Looking beyond wage earners
In developing economies, employment guarantee schemes that pay minimum wages
are ways to create incentives for private firms to comply with the minimum wage.
But because in developing and emerging countries only about half of all workers are
xvi
Global Wage Report 2012/13
wage earners, additional measures are needed to create more wage jobs and to raise the
productivity and earnings of those in self-employment.
Raising average labour productivity remains a key challenge which must involve
efforts to raise the level of education and the capabilities that are required for productive transformation and economic development. The development of well-designed
social protection systems would allow workers and their families to reduce the amounts
of precautionary savings, to invest in the education of their children, and to contribute
towards stronger domestic consumption demand and raise living standards.
Part i
Major trends in wages
1 The global economic context: Crisis, recession and employment
1.1 Economic growth rates vary widely by region
After a period of robust economic growth in the early years of the twenty-first century,
the world economy contracted in 2009 as a result of the global financial and economic
crisis (see figure 1). The impact of the crisis has been felt very diversely across the
globe. In the group of more developed economies, 2009 came to be seen as the year of
the “Great Recession”, the most severe economic downturn since the “Great Depression” of the 1930s. While the recovery in 2010 was initially stronger than expected,
the sovereign debt crisis and the various austerity measures that accompanied it led
to a significant deceleration of growth thereafter, particularly in Europe. The group of
emerging markets and developing countries, by contrast, avoided a generalized recession and has succeeded in maintaining higher growth rates than developed economies
since the year 2000.
Figure 1 Annual average economic growth, 1995–2012 (GDP in constant prices)
10
8
4
20
12
20
11
20
10
20
09
20
08
20
07
20
06
20
05
20
04
20
03
20
02
20
01
20
00
19
99
19
98
-2
19
97
0
19
96
2
19
95
Rate of GDP growth %
6
-4
-6
World
Major advanced economies (G7)
Emerging markets and developing economies
Note: Country groups are those used by the IMF and described in the appendix of IMF, 2012b. Major advanced economies include Canada, France, Germany,
Italy, Japan, the United Kingdom and the United States. Emerging markets and developing economies comprise a group of 151 economies that are not classified
as advanced economies. Figures for 2012 are projections.
Source: IMF World Economic Outlook database.
2
Global Wage Report 2012/13
Figure 2 Total unemployment rates in the world and in developed economies, 2005–11
(as % of labour force)
20
15
10
8.8
8.3
6.9
5
6.3
8.5
6.1
5.8
6.2
5.8
5.5
5.6
2005
2006
2007
2008
6.2
6.1
6.0
2009
2010
2011
0
World
Developed economies
Note: Figures for 2011 are preliminary estimates. For the definition of “developed economies”, see Appendix I.
Source: ILO, 2012a.
Figure 3 Annual average global real wage growth, 2006–11
4
3.0
3
2.6
2.3
2
2.1
2.0
1.3
1.3
1.0
1.2*
1
0.3
0
2006
2007
2008
With China
0.3
2009
0.2
2010
2011
Without China
* Growth rates published as “provisional estimates” (based on coverage of c. 75%).
Note: Global wage growth is calculated as a weighted average of year-on-year growth in real average monthly wages in 124 countries, covering 94.3 per cent of
all employees in the world (for a description of the methodology, see Appendix I).
Source: ILO Global Wage Database.
PART I
Real average wages
3
1.2 Global unemployment rates remain high
The impact of the global financial and economic crisis on labour markets has often
been analysed through the prism of the unemployment rate, particularly in developed
economies, where unemployment rose from less than 6 per cent to more than 8 per cent
of the labour force, with double-digit figures in Greece, Ireland, Portugal and Spain for
example.1 In developing countries unemployment rates fluctuated less. Even so, worldwide unemployment has increased by 27 million since the start of the crisis, bringing
the overall number of unemployed to about 200 million or 6 per cent of the global
labour force (figure 2). Perhaps the most serious concern relates to youth unemployment, which has reached alarming proportions. The ILO estimates that in 2011 unemployment affected 75 million young people aged 15–24 worldwide, representing more
than 12 per cent of all young people. Many more do not appear in the unemployment
statistics because they have become so discouraged as to have stopped looking for
work.
2 Real average wages
2.1 Slowing growth across a varied landscape
Global estimates of real average wage growth
Employment and unemployment figures do not tell the full story of the impact of the
crisis on labour markets. The present report looks at the wages of paid employees.2
The main unit of measure used for wages is the monthly average wage, rather than
hourly or daily wages, expressed in real terms (i.e. adjusted for inflation), which has
been identified as an ILO “decent work indicator”.3 Trends in real average monthly
wage reflect changes in average labour income (before taxes and transfers) and hence
provide a clearer picture of variations in the purchasing power of wages. As will be
discussed in the next sections of the report, trends in real average wages vary across
regions and countries. Yet the impact of the crisis is clearly noticeable at the aggregate
level. Figure 3 reveals that for the last four successive years (from 2008 to 2011), the
growth in real monthly average wages remained positive but has fallen to well below
pre-crisis rates. This is true whether or not we include official wage statistics from
China, although omitting China from the analysis significantly reduces global wage
growth, given the country’s large size (in terms of number of wage-earners) and its
exceptionally high rate of economic growth.4
Comparability of national statistics and working time
These global estimates (and the subsequent regional estimates) need to be interpreted
with care. First, there are differences across countries in the way wages are estimated
by national statistical offices. While the most developed economies carry out regular
establishment surveys and specific surveys on the structure of earnings, other countries
collect wage data through labour force surveys, and definitions of what is counted
as a wage sometimes differ. Coverage can also vary across countries. While the ILO
generally seeks to obtain data for all paid employees, in practice coverage is sometimes
4
Global Wage Report 2012/13
restricted to certain geographical areas (for example, metropolitan areas) or specific
subgroups of employees (for example, non-agricultural employees). As with many
other economic variables, these differences make it difficult to compare levels across
countries. Yet it is still possible to draw meaningful conclusions about changes over
time.
Secondly, changes in monthly average wages summarize innumerable changes at
enterprise level and at sectoral level, including not only changes in the hourly wage rate
but also changes in the number of hours worked. In many countries the global economic
crisis has led to shorter hours of work owing to reductions in the amount of overtime,
an increase in time-related underemployment, and/or an increase in the proportion of
part-time relative to full-time employees, all of which negatively affect total monthly
wages. Various countries have also implemented “work-sharing” programmes: reductions in working time in order to avoid lay-offs.5 Most typically, a three- or four-day
working week has replaced the more usual five-day working week. In other instances,
daily hours have been reduced or plants have been temporarily shut down for periods
of several weeks or even months. A reduction in working hours usually leads to proportional reductions in monthly wages, but in the context of “work-sharing” programmes
governments have often provided wage supplements through partial unemployment
compensation.6
The “composition effect”
The use of aggregate wage data, as opposed to tracking a panel of individuals, may also
give rise to what is known as a “composition effect”: a change in average wage levels
that results from a change in the composition of the wage-earner segment of the labour
force rather than from changes in earnings of those who remain employed throughout. This may introduce a bias. As pointed out in the previous edition of the Global
Wage Report (ILO, 2010a), this bias may be “countercyclical”, meaning that aggregate
data may underestimate the decline in the real wages of individuals who keep their
jobs during recessions and, later, underestimate the upward trend in their wages during
recoveries. For example, low-skilled workers with temporary employment contracts
might be the first to be dismissed by enterprises during a recession. Since the remaining workforce then consists of relatively better-paid workers, this can bias trends in
average wages upwards. The reverse effect might be observed during the recovery, if
low-paid workers are the first to be rehired (see also ILO, 2012b).
2.2 The gender pay gap
A smaller gap but women may not be better off
Figure 4 presents changes in the average gender pay gap between 1999–2007 and
2008–11, illustrating the evolution of the gap in all countries over the crisis where
such data are available. As the data show, the gender pay gap has declined in the crisis
years in most countries. However, interpretation of this decline is complicated by the
“composition effect”, as a narrowing of the gender pay gap does not necessarily imply
that the situation of women has improved. The case of Estonia shows how a decline
in the gender pay gap can be achieved not through improvements in the situation of
PART I
Real average wages
5
Figure 4 The gender pay gap (GPG), 1999–2007 and 2008–11
Azerbaijan
Armenia
Iceland
Honduras
Romania
Panama
Ecuador
Ukraine
Thailand
Georgia
Spain
Malta
United Kingdom
El Salvador
Lithuania
Costa Rica
Canada
Cyprus
Belgium
Israel
Luxembourg
Taiwan (China)
New Zealand
Kazakhstan
Slovakia
Portugal
Slovenia
Hong Kong (China)
Japan
Nepal
Pakistan
Germany
Mexico
Estonia
Turkey
Sweden
West Bank & Gaza
Finland
Austria
Singapore
Poland
Qatar
Bulgaria
Brazil
France
Netherlands
Uruguay
Norway
Czech Republic
Switzerland
Croatia
Latvia
Venezuela, Bolivarian Republic of
Jordan
Australia
Sri Lanka
Peru
Viet Nam
Paraguay
Mongolia
Colombia
Oman
Botswana
Belarus
Cambodia
-12.0
-10.0
-8.0
-6.0
-4.0
-2.0
0.0
2.0
4.0
6.0
8.0
Change in the GPG
Note: The gender pay gap (GPG) is defined as GPG = ((Em – Ew)/ Em)*100, where Em stands for the average wage of men and Ew is the average wage of women
(see ILO, 2012b). The change in the GPG is defined as the average of the GPG between 2008 and 11 minus the average of the GPG between 1997 and 2007.
Data are not available for all countries for all years; averages for the two periods are calculated using the data available for each country during both periods.
Source: ILO Global Wage Database.
6
Global Wage Report 2012/13
women but through a deterioration of the labour market circumstances of men relative
to women. Figure 5 illustrates the tendency for the gender pay gap in Estonia to change
in a pro-cyclical fashion, widening in times of growth and narrowing during recession.
The marked decline in 2009, during the most recent crisis, happened because men were
more concentrated in sectors most adversely affected by the crisis and worked fewer
hours. Consequently, in 2009 the gender pay gap narrowed because of a decrease in
male wages as a result of a decline in the number of hours worked by men (see Anspal,
Kraut and Rõõm, 2010.)
Figure 4 focuses on the direction of change between the two periods, rather than
on differences among countries. This is because differences in the data sources and/
or employee coverage used by different countries affect estimates of the gender pay
gap. The case of Norway, shown in figure 6, illustrates how the gender pay gap varies
depending on whether all, full-time, or part-time employees are chosen. The gender pay
gap for part-time work is low, indicating that men and women who work part-time have
similar pay. In contrast, the gender pay gap for full-time employees is higher, as male
full-time employees earn considerably more than female full-time employees. Finally,
the gender pay gap for all employees is even higher than that for full-time employees,
owing to the fact that women are overrepresented among part-time workers, whose
hourly wage rates were only about 80 per cent of those of full-time workers in 2011.
Figure 5 The gender pay gap in Estonia, 1993–2009
33
31
Gender pay gap (%)
29
27
25
23
21
19
17
09
20
08
20
07
20
06
20
05
03
02
01
04
20
20
20
20
20
00
20
99
19
98
19
97
19
96
19
95
19
94
19
19
93
15
Note: The gender pay gap (GPG) is defined as GPG = ((Em – Ew)/ Em)*100, where Em stands for the average wage of men and Ew is the average wage of women
(see ILO, 2012b).
Source: Graph reproduced from Anspal, Kraut and Rõõm, 2010.
PART I
Regional estimates
7
Figure 6 The gender pay gap in Norway by employment status, 2008–11
20
Gender pay gap
15
10
5
0
All employees
2011
2010
2009
2008
Full-time
Part-time
Note: The gender pay gap (GPG) is defined as GPG = ((Em – Ew)/ Em)*100, where Em stands for the average wage of men and Ew is the average wage of women
(see ILO, 2012b).
Source: ILO calculations based on data from Statistics Norway.
Changes over time are less sensitive to employee coverage. Even so, interpretation of
changes in the gender pay gap over time should be considered alongside other labour
market indicators which reflect changes in the conditions of work and employment for
women.
3 Regional estimates
3.1 Overall growth masks a complex picture
As noted above, there are large differences in the growth rate of real average wages
across regions and countries, with wages generally growing faster in areas of stronger
economic growth. Figure 7 shows our estimates of the growth of real monthly average
wages by region from 2006, including the years of the crisis. As with our global estimate, the regional estimates are weighted estimates (as explained in Appendix I) and so
are heavily influenced by wage trends in larger economies, such as China in Asia, the
United States in the developed economies, Russia and Ukraine in Eastern Europe and
Central Asia, Brazil or Mexico in Latin America and the Caribbean, or South Africa in the
8
Global Wage Report 2012/13
Figure 7 Annual average real wage growth by region, 2006–11
(a) Africa
(b) Asia
15
15
10
10
6.7
6.2**
6.6
5
5
2.7
2.6**
6.3
5.7
(5.0)
3.9
2.1**
1.3
0.5**
0
0
-5
-5
2006
2007
2008
2009
2010 2011
2006
2007
2008
2009
2010
(c) Developed economies
(d) Eastern Europe and Central Asia
15
15
2011
14.4
11.7
10
10
8.3
5.5
5.2
2010
2011
5
5
0.9
1.1
0.8
0.6
0
0
-0.3
-0.5
-3.5
-5
-5
2006
2007
2008
2009
2010
2011
2006
2007
2008
2009
PART I
Regional estimates
(f) Middle East
(e) Latin America and the Caribbean
15
15
10
10
5
5
3.5
2.9
0.8
2.2
1.6
9
1.2
1.4
1.9
0
0
(-0.2)
-1.5** (-1.2)
-2.9
-5
-5
2006
2007 2008
2009
2010
2011
2006
2007
2008
2009
2010
2011
* Growth rates published as “provisional estimates” (based on coverage of c.75 %).
** Growth rates published as “tentative estimates” (based on coverage of c.40–c.74%).
() Growth rates published but likely to change (based on coverage of less than 40%).
Note: For coverage and methodology, see Appendix I.
Source: ILO Global Wage Database.
African continent. We see that in developed economies the growth of real wages fluctuated within a narrow range of approximately plus and minus 1 per cent. In other
regions, the fluctuations were typically larger.
Table 1 takes a longer view and shows the cumulative increase in real average
wages since 2000. We see that between 2000 and 2011 global real monthly average
wages increased by close to one quarter, but differences across regions are stark. In
Asia real average wages approximately doubled, in Latin America and the Caribbean as
well as in Africa they increased by slightly less than the world average, while in developed economies they increased by about 5 per cent. In Eastern Europe and Central Asia
average wages almost tripled: as will be shown later, this was in part a recovery of the
ground that was lost in the early phase of the transition towards market economies in
the 1990s. In the Middle East, our tentative estimates suggest that wages may have
declined.
10
Global Wage Report 2012/13
Table 1 Cumulative real wage growth by region since 2000 (index: 2000 = 100)
Regional group
2000
2006
2007
2008
2009
2010
2011
Africa
100.0
103.9
105.3
108.1**
108.6**
115.4**
117.8**
Asia
100.0
149.0
158.8
165.1
174.6
185.6
(194.9)
Eastern Europe and Central Asia
100.0
204.4
233.9
253.4
244.4
257.9
271.3
Developed economies
100.0
103.3
104.5
104.1
104.9
105.5
105.0
Latin America and the Caribbean
100.0
105.4
108.5
109.3
111.0
112.6
115.1
Middle East
100.0
98.3
100.1
97.2
(94.6)
(94.4)
World
100.0
112.8
116.1
117.3
121.3
122.7*
95.8**
118.8
* Growth rates published as “Provisional estimates” (based on coverage of c. 75%).
** Growth rates published as “Tentative estimates” (based on coverage of c. 40%– c. 74%).
() Growth rates published but likely to change (based on coverage of less than 40%).
Note: For coverage and methodology, see Appendix I.
Source: ILO Global Wage Database.
In spite of the faster growth in real average wages in emerging regions over the
last decade, absolute differences in wage levels across countries and regions remain
considerable. Figure 8 shows estimates by the US Bureau of Labor Statistics comparing hourly direct pay for time worked in manufacturing in 2010. The hourly rate of pay
varied from almost US$35 in Denmark, through a little more than US$23 in the United
States, to US$13 in Greece, between US$5 and US$6 in Brazil, and less than US$1.50
in the Philippines. Using a different and non-comparable methodology, total hourly
compensation costs in manufacturing were estimated at US$1.36 in China for 2008
and at US$1.17 in India for 2007 (United States Department of Labor, Bureau of Labor
Statistics, 2011). Although these differences are measured in current US dollars and
therefore are dependent on exchange rate fluctuations, they nonetheless point towards
the persistence of wide gaps in wages and labour productivity across the world.
3.2 Developed economies
Wages and inflation
In developed economies, average wages underwent a double dip, falling in 2008 and
again in 2011 (see figure 7).7 Figure 9, which highlights trends in nominal average
wages and price inflation in advanced economies, shows that in 2008 unusually high
inflation exceeded nominal wage increases, and hence led to falling real wages.8 In
2009, the year of the global economic recession, both nominal wages and consumer
prices more or less froze. Since then, the recovery of nominal wage growth stalled in
2011 but the increase in consumer prices returned to pre-crisis rates, which explains the
fall in real wages in that year.
PART I
Regional estimates
11
Figure 8 International comparison of hourly direct pay for time worked in manufacturing,
2010 (US$)
Philippines
1.41
Hungary
4.74
Poland
4.86
Brazil
5.41
Slovakia
6.03
Estonia
6.10
Czech Republic
6.81
Portugal
7.16
Argentina
8.68
Singapore
12.68
Greece
13.01
Spain
14.53
15.28
Israel
New Zealand
17.29
Japan
18.32
Italy
18.96
France
21.06
United Kingdom
21.16
Austria
21.67
United States
23.32
Netherlands
23.49
Belgium
24.01
Canada
24.23
Sweden
24.78
Finland
25.05
Germany
25.80
Ireland
26.29
28.55
Australia
34.29
Switzerland
Denmark
34.78
0
10
20
US dollars, 2010
Note: Direct pay for time worked is wages and salaries for time actually worked.
Source: United States Department of Labor, Bureau of Labor Statistics (BLS), 2011.
30
40
12
Global Wage Report 2012/13
Figure 9 Trends in nominal wage growth and inflation in advanced economies, 2006–11 (%)
4
3
2
1
0
2006
2007
2008
Nominal wage growth
2009
2010
2011
Inflation
Note: The figure exclusively refers to countries classified by the IMF World Economic Outlook report as “advanced economies” and hence excludes certain
countries classified in this report as “developed economies” (for a list of these countries, see Appendix I). Nominal wage growth and inflation figures are not
strictly comparable across countries owing to differences in the way each country is weighted in the regional estimate. The figure nonetheless illustrates the
argument in the text.
Sources: ILO Global WageDatabase; IMF World Economic Outlook database.
Wages and productivity
Figure 10 shows the average annual growth rates in output and in the number of people
employed in developed countries for the years before the crisis (1999–2007) and after
the beginning of the crisis (2008–11). Figure 11 shows the average annual growth rates
of real average wages and of labour productivity as measured by real output per person
employed.9 Taken together, these two figures provide a picture of how economic growth
affected the labour force and how the “Great Recession” affected labour markets. Looking at the period before the crisis, we see that employment grew by an amount equal to
or less than GDP in almost all countries (as can be seen by the fact that only Italy and
Spain lie to the right of the 45-degree line bisecting figure 10(a)). Because GDP grew
faster than employment, labour productivity (GDP per employed person) by definition
increased. This can be seen by the fact that all countries except Italy and Spain lie on
the right of the vertical axis in figure 11(a).
Did the growth of labour productivity translate into higher real wages? Figure 11
shows that most countries did indeed experience a period of growth in both real
wages and productivity (indicated by the cluster of countries in the top right corner
of figure 11(a)). In a number of countries, such as in Denmark, France, Finland, the
United Kingdom, Romania and the Czech Republic, there was a close connection
between wage and productivity growth (as shown in figure 11). But there are also many
countries where the two variables were less closely synchronized. Figure 11(a) shows
PART I
Regional estimates
13
Figure 10 Growth in output and employment in developed economies, 1999–2007 and 2008–11 (%)
(a) 1999–2007
9
LAT
8
EST
LIT
7
Output growth (%)
6
ROM
BUL
SVK
IRE
5
45°
CZR
ICE
SVE
4
HUN
LUX
GRE
POL
AUS
FIN
SWE
UK
3
2
JAP
1
DNK
NZ
ISR
CYP
ESP
CAN
USA
NOR
AUT
BEL FRA
CH NET
ITA
DEU
POR
0
-3
-2
-1
0
1
2
3
4
5
Employment growth (%)
(b) 2008–11
4
45°
ISR
POL
3
2
CH
SVK
1
USA FRA
CZR
NET
0
Output growth (%)
AUS
SWE
-1
ESP
BUL
FIN
POR
DNK
CAN
AUT
DEU
BEL
NOR
CYP
JAP NZ
LUX
UK
ITA
HUN
EST
-2
SVE
IRE
ROM
LIT
ICE
-3
-4
LAT
GRE
5
-6
-6
-5
-4
-3
-2
-1
0
Employment growth (%)
Note: For country abbreviations, see Appendix I.
Sources: ILO Trends Econometric Model, March 2012; IMF World Economic Outlook database.
1
2
3
4
14
Global Wage Report 2012/13
Figure 11 Growth in real wages and labour productivity in developed economies,
1999–2007 and 2008–11 (%)
(a) 1999–2007
5
ICE
4
45°
GRE
Real wage growth (%)
3
IRE
NOR
FIN
CYP
2
UK
SWE
NZ
AUS
POR
1
LUX
AUT
ESP
JAP
CAN
ISR
0
DNK
CH
BEL
FRA
USA
MTA
NET
ITA
DEU
-1
-1
0
1
2
3
4
Labour productivity growth (%)
(b) 2008–11
4
3
45°
2
NOR
AUS
Real wage growth (%)
MTA
1
CH
CYP
BEL
LUX
CAN
FIN
DEU
FRA
JAP
0
DNK
NET
USA
SWE
NZ
AUT
ESP
IRE
ITA
-1
ISR
UK
-2
ICE
GRE
-3
-3
-2
-1
0
Labour productivity growth (%)
1
2
3
PART I
Regional estimates
15
(c) 1999–2007
10
45°
ROM
8
Real wage growth (capitalisation)
LAT
EST
6
LIT
HUN
CZR
4
SVK
BUL
SVE
POL
2
0
0
2
4
8
6
10
Labour productivity growth (%)
(d) 2008–11
6
BUL
5
4
45°
3
SVE
Real wage growth (%)
2
SVK
POL
1
0
-1
ROM
-2
HUN
-3
CZR
EST
LAT
-4
LIT
-5
-5
-4
-3
-2
-1
0
Labour productivity growth (%)
1
2
3
4
Note: Both the top (a–b) and bottom (c–d) pairs of graphs refer to countries in the developed economies region. They have been separated only for reasons of
legibility. If 1999, 2007, 2008 or 2011 data were unavailable, the next closest period’s data point was used to estimate the trend. For country abbreviations,
see Appendix I.
Sources: ILO Global Wage Database; ILO Trends Econometric Model, March 2012.
16
Global Wage Report 2012/13
that in Greece and Iceland average wages grew ahead of labour productivity, while in
Spain and Italy labour productivity declined but wages did so only marginally (in the
case of Italy) or not at all (in the case of Spain). In some of the largest economies of the
region, by contrast, wage growth trailed behind productivity growth: this occurred in
the United States, in Japan and especially in Germany, where average wages declined
in spite of positive average labour productivity growth in the years 1999–2007 (see
figure 35 for more details on Germany).
Economic growth and employment growth
What has happened in the years since the “Great Recession”? It is apparent from
figure 10(b) that all those countries where GDP contracted on average over 2008–11
also saw employment falling or at best static (with the exception of Luxembourg, where
employment grew). Conversely, most economies with positive GDP growth during the
crisis also succeeded in expanding employment. Interestingly, though, during the years
of the crisis employment suffered more than output in a number of countries, including
Spain, Ireland, Portugal and Bulgaria. In the United States, employment fell in spite of
slow but positive economic growth.
Consequently, it is clear from figures 11 (b) and (d), though, that most countries recorded positive labour productivity growth during 2008–11 in spite of the crisis
(as shown by the fact that most countries are on the right side of the vertical axis in
these sections of the figure). Many of these countries also saw moderate increases in
real wages, including Germany, which seems to have changed course of action, allowing for wage growth in excess of labour productivity after years of wage moderation.
One of the exceptions is the United Kingdom, where in spite of productivity gains
real average wages declined sharply under the influence of relatively high inflation.
In some countries wages declined considerably more than labour productivity: these
included Greece and some newer EU countries. In Greece, where wages were growing
ahead of productivity before the crisis, average wages were forced down by austerity
programmes and cumulatively fell by close to 15 per cent over 2010 and 2011 alone.
Overall, a comparison of figures 10 and 11 produces little evidence of a simple tradeoff between wage moderation and employment growth during the crisis.
3.3 Eastern Europe and Central Asia
From recovery to crisis
In the group of (non-EU) Eastern European and Central Asian countries, the regional
growth rate in real average wages fluctuated widely, from double-digit rates before the
crisis to the hard landing of 2009. Although positive wage growth returned in 2010 and
2011, the rates reached then were not nearly as high as before the crisis. Taken together,
figures 12 and 13 show that before the crisis, output expanded faster than employment
(figure 12), as a result of which labour productivity grew in all countries (figure 13).
Strikingly, the gains in productivity before the crisis were accompanied by even larger
real wage increases of more than 10 per cent a year, on average, in a majority of countries. In many cases, this was a result of the process of recovery from the transition to
market economies. Figure 14 shows that real wages in Russia initially fell to less than
PART I
Regional estimates
17
Figure 12 Growth in output and employment in Eastern Europe and Central Asia,
1999–2007 and 2008–11 (%)
(a) 1999–2007
16
15
TUR
14
AZB
13
Output growth (%)
12
ARM
11
10
KAZ
9
TAJ
8
GEO
7
UKR
BLS
RUS
6
45º
MOL
5
ALB
TKY
SBA
BOS
4
3
CRO
UZB
KYR
FYR
2
1
0
-4
-3
-2
-1
0
1
2
5
4
3
6
Employment growth (%)
(b) 2008–11
10
TUR
9
8
UZB
7
6
TAJ
KAZ
Output growth (%)
5
45°
AZB
BLS
TKY
4
3
GEO
ALB
MOL
KYR
2
FYR
1
RUS
0
SBA
BOS
-1
UKR
-2
CRO
ARM
-3
-4
-3
-2
-1
0
1
Employment growth (%)
Note: For country abbreviations, see Appendix I.
Sources: ILO Trends Econometric Model, March 2012; IMF World Economic Outlook database.
2
3
4
5
18
Global Wage Report 2012/13
Figure 13 Growth in wages and labour productivity in Eastern Europe and Central Asia,
1999–2007 and 2008–11 (%)
(a) 1999–2007
25
45°
UZB
20
TAJ
SBA
AZB
UKR
GEO
Real wage growth (%)
15
ARM
BLS
RUS
MOL
KYR
KAZ
10
ALB
5
BOS
TKY
CRO
FYR
0
0
5
10
15
20
25
Labour productivity growth (%)
(b) 2008–11
16
45°
TAJ
14
12
10
KYR
TUR
Real wage growth (%)
8
6
KAZ
BLS
AZB
4
FYR
ARM
BOS
TKY RUS
2
MOL
GEO
UKR
0
CRO
-2
ALB
SBA
-4
-4
-2
0
2
4
6
8
Labour productivity growth (%)
10
12
14
16
18
Note: If data for 1999, 2007, 2008 or 2011 were unavailable, the next closest year’s data point was used to estimate the trend. For country abbreviations,
see Appendix I.
Sources: ILO Global Wage Database; ILO Trends Econometric Model, March 2012.
PART I
Regional estimates
19
Figure 14 Index of real wages in the Russian Federation since 1990 (1990 = 100)
120
Real wage index (%)
100
80
60
40
20
0
1990
1995
2000
2005
2010
Source: ILO calculations based on data from the Russian Federation Federal State Statistics Service, 2011.
half of their 1990 value, before progressively recovering and tripling in the years after
2000. Ukraine followed a similar pattern, with real wages falling sharply between 1992
and 1999 before increasing more than threefold in real terms up to 2009.10
Wages reined in
More recently, between 2008 and 2011, productivity grew more slowly but remained
largely positive, and real wage growth became more closely aligned with productivity growth. There were exceptions: in Serbia and Albania, real wages fell in spite of
positive labour productivity growth, a reflection of the freezing of nominal wages in
the public sector. In Serbia, an agreement with the IMF signed in April 2009 included
a commitment by the Serbian Government to keep public sector wages and pensions
frozen in nominal terms in 2009 and 2010 – as a result of which real wages in the
public administration declined (Arandarenko and Avlijas, 2011). This measure came
with a ban on new employment in the public sector. Similarly, on the advice of the
IMF, budgetary restrictions on wage growth in the public sector have been introduced
in Albania.
But the regional picture shown in figure 7 is most strongly influenced by the
trends in the two largest economies, namely the Russian Federation and Ukraine.
In both countries wage growth slowed in 2008 and turned negative in 2009, before
bouncing back to about half of pre-crisis rates in subsequent years. An analysis of the
impact of the crisis on the Ukrainian labour market reveals that much of the decline in
monthly wages was due to an increase in involuntary underemployment in 2009, when
every fifth employee in Ukraine worked fewer hours than he or she would have liked.
Many employees had to go on unpaid leave, especially in the industrial sector (ILO,
2011d),11 while others saw their basic wages frozen and their bonuses cut (Kulikov and
Blyzniuk, 2010).
20
Global Wage Report 2012/13
3.4 Asia and the Pacific
High growth, dominated by China
The trends in Asia, and particularly in East Asia, contrast sharply with those in other
regions. Reflecting the region’s resilient economic performance during the crisis, wages in
Asia have continued to grow at high rates (as shown in figure 7). This particularly reflects
the influence of China, where wages in “urban units” increased on average at double-digit
annual rates over the full decade, according to the China Yearbook of Statistics. Using
these official figures of an annual rate of growth of 12 per cent per annum, real average
wages in China have more than tripled over the decade from 2000 to 2010, prompting
questions about the possible end of “cheap labour” in China. In figure 15, we see that without China, where the growth of GDP and wages was exceptionally high during the past
years, the picture looks considerably different, reflecting the less positive story of wages in
countries such as the Republic of Korea or India during the last four years.
Looking at figures 16 and 17, we see that most countries in the region had
economic growth rates that averaged 5 per cent or more in the years 1999–2007,
accompanied in the sub-period from 2002 to 2007 by average annual employment
growth of 1.2 per cent in East Asia, 1.8 per cent per annum in South-East Asia and
the Pacific, and 2.2 per cent in South Asia (ILO, 2012a). It must be emphasized at
this point, however, that the growth in overall employment in developing countries
– where most people cannot afford to be unemployed – is closely related to trends in
Figure 15 Annual average real wage growth in Asia, 2006–11
6.7
6.6
6.3
5.7
6
(5.0)
3.9
4
2.7
2.1
2
1.2
0
-0.9
-0.9
-2
-2.0
-4
2006
2007
2008
With China
() Growth rates published but likely to change (based on coverage of less than 40%).
Note: For coverage and methodology, see Appendix I.
Source: ILO Global Wage Database.
2009
Without China
2010
2011
PART I
Regional estimates
21
Figure 16 Growth in output and employment in Asia, 1997–2007 and 2008–11 (%)
(a) 1999–2007
13
MYN
12
11
10
CHI
CDA
9
Output growth (%)
8
BHU
VN
7
IND
LAO
6
HK ISA
5
TAI
4
SRI
KOR
THA
BAN
MYA
MDS
45°
MON
IRA
SNG
PAK
PHL
NEP
3
SOL
FIJ
2
PAP
BRU
1
0
0
1
2
3
4
Employment growth (%)
5
6
7
(b) 2008–11
12
11
AFG
TL
10
CHI
9
IND
Output growth (%)
8
BHU
LAO
PAP
7
MON
SNG
SRI
6
BAN
ISA
VN
45°
MYN
5
TAI
PHL
CDA
4
MYA
KOR
HK
NEP
IRA
3
PAK
SOL
MDS
THA
2
BRU
1
FIJ
0
0
1
2
3
Employment growth (%)
Note: For country abbreviations, see Appendix I.
Sources: ILO Trends Econometric Model, March 2012; IMF World Economic Outlook database.
4
5
22
Global Wage Report 2012/13
Figure 17 Growth in output and in numbers of paid employees in Asia,
1997–2007 and 2008–11 (%)
(a) 1999–2007
13
MYN
12
11
10
CHI
CDA
Output growth (%)
9
8
45°
BHU
VN
MDS
7
IND
MON
6
SNG
5
MYA
SRI
ISA
HK
KOR
TAI
4
LAO
IRA
BAN
PAK
THA
PHL
NEP
3
SOL
PAP
2
BRU
FIJ
1
0
-1
0
1
2
(b) 2008–11
4
3
Employee growth (%)
5
7
6
8
11
10
CHI
9
Output growth (%)
8
45°
IND
BHU
LAO
PAP
7
MON
SNG
SRI
6
BAN
ISA
VN
MYN
5
TAI
PHL
CDA
IRA
SOL
MYA
4
KOR
HK
3
NEP
MDS
PAK
THA
2
BRU
1
FIJ
0
-4
-3
-2
-1
0
1
2
Employee growth (%)
Note: For country abbreviations, see Appendix I.
Sources: ILO Trends Econometric Model, March 2012; IMF World Economic Outlook database.
3
4
5
6
7
PART I
Regional estimates
23
the size of the labour force. Hence we also present GDP growth alongside the growth
in the number of paid employees in figure 17, which leaves out the self-employed
or family helpers. Even so, we see that output growth exceeded the growth of paid
employment in most countries.
A caveat on labour productivity: the role of paid employment
What has been the impact on wages of these growth rates? The juxtaposition of data
on average wage growth and labour productivity, as in figure 18, must be interpreted
with care in developing countries. This is because average wages refer to the earnings
of paid employees (who represent less than 50 per cent of workers in some Asian
countries), while labour productivity measures the GDP of all employed people (both
employees and self-employed). A better comparison would be between average wages
and the productivity of paid employees, but data on the latter are generally not available. In principle, one suspects that the growth in output across all workers underestimates the growth in labour productivity of paid employees, a substantial proportion
of whom work in the more productive and dynamic industrial sectors. Also, when
comparing wage growth and productivity growth in China, one must keep in mind that
the former only cover State-owned enterprises, collective-owned units and other type
of companies linked to the State (see note 4). The decline in the labour share in China
documented in Part II of this report suggests that wage growth was in fact lower than
productivity growth in China.
Purchasing power under threat
In spite of these caveats, figure 18 clearly shows that in general gains in both
productivity and real wages have been positive, and quite substantial, both before
and during the years of the crisis. Yet in some countries, wage growth as measured
by official statistics was clearly disappointing over the period 1999–2007. Among
the East Asian countries, relatively low wage growth was recorded, for example,
in Thailand. In South Asia, too, measures of real average wages stagnated in the
decade before the crisis. In India, wage trends are somewhat unclear. The authoritative sources of data on wage growth in India are the Annual Survey of Industries
by the Central Statistics Office and the real wage index published by the Labour
Bureau. Both data sources indicate that real wages declined in a majority of recent
years, shrinking the purchasing power of wage earners. This would explain the many
concerns expressed by workers in India about rapidly increasing prices, particularly food prices. The trend, however, is surprising in the light of the country’s
rapid economic growth over the last decade. It also contrasts with our analysis of
the Employment–Unemployment Survey from the National Sample Survey Office
(NSSO), conducted every five years along with the Consumer Expenditure Survey,
in which salaried and casual workers report a 150 per cent increase in their earnings
– much higher than the 52 per cent increase in the consumer price index – in the five
years between 2004/05 and 2009/10.
24
Global Wage Report 2012/13
Figure 18 Growth in wages and labour productivity in Asia, 1997–2007 and 2008–11 (%)
(a) 1999–2007
15
45°
14
13
CHI
12
11
CDA
10
Real wage growth (%)
9
MON
8
IRA
7
MYN
ISA
6
5
KOR
4
MYA
3
2
1
SNG
BAN
NEP
FIJ
MAC
PAK
THA
0
IND
HK
-1
SRI
PHL
-2
-5
-4
-3
-2
0
-1
1
2
3
5
4
6
7
8
10
9
11
12
13
14
15
Labour productivity growth (%)
(b) 2008–11
14
13
45°
12
11
CHI
10
VN
9
Real wage growth (%)
8
NEP
7
6
BAN
MON
MAC
5
4
ISA
3
MYA
2
THA
HK
1
SNG
PHL
0
KOR
-1
IND
-2
-3
-4
IRA
-5
-4
-3
-2
-1
0
1
2
3
4
5
6
7
8
9
10
11
12
Labour productivity growth (%)
Note: If data for 1999, 2007, 2008 or 2011 were unavailable, the next closest year’s data point was used to estimate the trend. For country abbreviations,
see Appendix I.
Sources: ILO Trends Econometric Model, March 2012; IMF World Economic Outlook database.
PART I
3.5
Regional estimates
25
Latin America and the Caribbean
Crisis withstood by robust performance
In Latin America and the Caribbean, the financial crisis interrupted a strong economic
cycle. Figure 19(a) shows that during the pre-crisis years 1999–2007, average annual
growth in both GDP and employment was positive and robust in a majority of countries, while figure 19(b) reflects the relatively short duration of the global crisis in this
region. We see that over the period 2008–11, both GDP and employment grew at fairly
solid rates in a majority of countries, in spite of the economic contraction in some
major economies in 2009. Note, though, that in Central America and the Caribbean,
where economies are strongly connected to the North American market, the recovery
was slower than in South America.
Figure 20 covers the period between 2004, which marked the start of the continent’s strong economic cycle, and 2011 – a period over which GDP grew on average by 4.4 per cent. We see that Latin America was severely affected by the global
economic crisis in 2009, but rebounded rapidly in 2010, supported by the recovery
in commodity prices as well as the implementation of countercyclical monetary and
fiscal policies. The latter was possible as the region enjoyed a healthy fiscal situation
and had reduced external debt to manageable levels during the years of expansion.
What is striking is not only that the recession was short, but also that the recovery
involved the creation of new jobs and led to a significant reduction in the unemployment rate, which fell from 10.3 per cent in 2004 to 6.8 per cent in 2011 (as illustrated
in figure 20).
Positive figures explained by data from Brazil
These economic trends are also reflected in the wage data. Regional estimates (in
figure 7) show that in Latin America and the Caribbean average real wages grew in all
years between 2006 and 2011, in spite of the crisis in 2009. As in Asia, the lowest real
wage growth occurred in 2008 as a result of a peak in inflation, reflecting increases
in international prices of foodstuffs and oil. On the contrary, in 2009 international
prices fell significantly as a result of the international slowdown, on average halving
inflation in the region. This significant reduction in inflation slightly improved the
purchasing power of wages, despite the economic contraction.
Overall, these regional wage trends in Latin America and the Caribbean are heavily influenced by large countries such as Brazil, where wage growth remained positive
throughout the period (see figure 21).12 Looking at the performance of a group of 14
countries for which we have full information for the period 2005–10, we observe that
many other countries experienced some deterioration in their real wages in 2008 and
again in 2010. Real wages contracted in ten out of 14 countries in 2008, while in 2010
there were six countries where this occurred. In both years, the majority of countries
where real wages fell were in Central America and the Caribbean, as their economies
are more dependent on the economic situation in the United States.
26
Global Wage Report 2012/13
Figure 19 Growth in output and employment in Latin America and the Caribbean,
1997–2007 and 2008–11 (%)
(a) 1999–2007
9
TT
8
7
Output growth (%)
6
SUR
5
BZE
PAN
HON
PER
DOM
ECU
COS
CHE
45°
COL
4
VZA
NIC
BOL
BRA
3
ELS
2
PAR
MEX
BBO
BAH
JAM
GUY
1
GUA
URU
HAI
0
-1
0
1
2
5
4
3
Employment growth (%)
(b) 2008–11
8
PAN
7
ARG
6
SUR
URU
PER
PAR
DOM
45°
Output growth (%)
5
4
GUY
BRA
BOL
CHE
COL
ECU
3
COS
NIC
GUA
2
BZE
HON
MEX
1
0
HAI
ELS
VZA
BAH
-1
JAM
BBO
TT
-2
-2
-1
0
1
2
Employment growth (%)
Note: For country abbreviations, see Appendix I.
Sources: ILO Trends Econometric Model, March 2012; IMF World Economic Outlook database.
3
4
5
PART I
Regional estimates
Figure 20 Economic growth and unemployment in Latin America and the Caribbean,
2004–11 (%)
12
10.3
9.0
10
8.6
7.9
8
6
6.0
5.7
8.1
7.3
6.8
6.2
5.8
4.7
4
7.3
4.5
4.2
2
2009
0
2005
2004
2006
2007
2008
-1.6
2010
2011
-2
-4
GDP growth
Unemployment
Sources: IMF World Economic Outlook database; ILO, 2011e.
Figure 21 Annual average real wage growth in Brazil, 2006–11
4.5
4.0
4.0
3.8
3.4
3.5
3.2
3.2
3.0
2.7
2.5
2.0
1.5
1.0
0.5
Source: ILO Global Wage Database.
11
20
10
20
09
20
08
20
07
20
20
06
0
27
28
Global Wage Report 2012/13
Productivity up, employment up, wages up – but not everywhere
Figure 22 provides data on the annual growth of average real monthly wages during
the period 2004–11, which covers the years of strong economic growth and for which
consistent wage data are available for a relatively large number of countries. We see
that, overall, the countries with high labour productivity growth also showed a substantial increase in real wages. So for example, average real wages grew at over 3 per cent
per annum in Brazil, Peru and Uruguay, and at over 2 per cent per annum in Chile and
Costa Rica. In the overwhelming majority of these countries, the unemployment rate
declined, meaning that labour market indicators generally improved. Conversely, countries where GDP per capita grew only slowly during this period also saw only modest
improvements (as in Honduras and Mexico) or even reductions (as in Nicaragua and
El Salvador) in real wages. Three countries where good economic performance was
not reflected in average real wage growth are Colombia, the Dominican Republic and
Panama.
Figure 22 Growth in wages and labour productivity in selected Latin American and
Caribbean countries, 2004–11 (%)
11
10
9
8
Real wage growth (%)
7
45°
6
5
URU
4
PER
BRA
3
COS
DOM
CHE
2
ECU
PAR
HON
1
PAN
COL
MEX
0
-1
ELS
NIC
-2
-2
-1
0
1
2
3
4
5
6
Labour productivity growth (%)
Note: If data for 2004 or 2011 were unavailable, the next closest year’s data point was used to estimate the trend. For country abbreviations, see Appendix I.
Sources: ILO Global Wage Database; ILO Trends Econometric Model, March 2012.
PART I
Regional estimates
29
3.6 The Middle East
Declining trade saps demand for migrant workers
The global economic crisis had the effect of initially slowing down economic growth
in most countries in the Middle East (figure 23). The main impact of the crisis in this
region took the form of declining international trade. There was a sharp drop in the
demand for exports from less developed Middle East economies, and a temporary fall
in 2009 of the value of exports for oil producers in the countries of the Gulf Cooperation
Council (GCC),13 after which oil prices and government spending both increased. In the
GCC countries, where expatriate workers far outnumber native workers, the slowdown
in employment growth was perhaps only temporary (though statistical information is
lacking), with the exception of the Emirate of Dubai where the economic downturn
appears to have translated into a reduced demand for migrant workers, particularly in
construction. Migration issues are also prominent for other Middle Eastern countries,
with many Syrians working in the construction sector in Lebanon, or a majority of
workers in the Jordanian apparel industry coming from South Asia.
Statistical challenges
The effects of the global crisis on wages in this region are difficult to assess, for
at least two reasons. First, few countries publish regular wage statistics. The only
country in the Middle East to produce quarterly surveys on wages is the Kingdom
of Bahrain, whose Labour Market Regulatory Authority publishes estimated average
basic wages of all employees, compiled from a combination of household surveys
and administrative data. By contrast, Saudi Arabia publishes annual data from its
Annual Economic Survey of Establishments with a two-year lag, meaning that the
most recent statistics available at the time of writing of this report were for the year
2009. Also, the wage statistics in the region are sometimes of questionable quality,
though some improvements are being made in this respect: Tunisia, for example,
conducted its first wage survey with the assistance of the ILO in 2011. Nevertheless,
such data as are available suggest that in a majority of Middle Eastern countries
wages have not increased very much, or perhaps even declined, during the past few
years (figure 24).
Another complication arises with interpretation of the wage data, because average wages can hide tremendous differences between those of native workers and those
of migrant workers, whose respective wages are the outcomes of very different systems
of wage determination. In the GCC economies, large differences in wages between
expatriate and native workers are the combined result of “Arabization” processes,
which seek to increase the proportion of local workers in the private sector; the sponsorship system, which restricts the free movement of migrant workers between jobs;
and public employment policies, which generate jobs that are exclusively directed
at local people and offer wages that in many cases are higher than those available in
the private sector. In fact, the low participation rate of women in the labour market
together with the high proportion of women working in public sector jobs sometimes
results in a negative gender pay gap (a situation where women earn more than men).
This was the case, for example, in Syria, where in 2010 only about 13 per cent of
30
Global Wage Report 2012/13
Figure 23 Growth in output and employment in the Middle East, 1999–2007 and 2008–11 (%)
(a) 1999–2007
12
45°
11
QAT
10
9
Output growth (%)
8
UAE
KUW
7
JOR
6
BAR
5
YEM
4
LEB
3
SAU
OMA
2
1
0
0
1
2
3
5
4
6
7
8
9
10
11
12
Employment growth (%)
(b) 2008–11
15
QAT
14
13
12
45°
11
Output growth (%)
10
9
8
7
6
LEB
5
4
SAU
OMA
JOR
3
KUW
2
1
0
BAR
UAE
YEM
0
1
2
3
4
5
6
7
Employment growth (%)
Note: For country abbreviations, see Appendix I.
Sources: ILO Trends Econometric Model, March 2012; and IMF World Economic Outlook database.
8
9
10
11
12
PART I
Regional estimates
31
women were economically active, but where about 74 per cent of women in paid
employment worked in the public sector, where wages were about 1.5 times those
prevailing in the private sector (see Syrian Arab Republic, Central Bureau of Statistics, 2011a, b).
The Arab Spring: Local workers and migrant remittances
Findings from surveys show that “fair pay” and high costs of living are top priorities
among young people in the Arab region (ASDA’A, 2012), and the Arab Spring seems
to have prompted several countries to make further increases in wages for local people
working in the public sector. Yet when it comes to the private sector, minimum wages
and collective bargaining are underdeveloped in the Arab region. This has several unintended consequences including asymmetric bargaining power between workers and
employers and the possibility of social and political unrest. Although remittances from
GCC countries seem to have remained more resilient than expected, other destination
countries may have passed the cost of the crisis onto migrant workers. In countries that
are net senders of migrants, drops in remittances severely affect household incomes,
with repercussions in the form of reduced aggregate consumption and savings, increasing rates of unemployment and a drop in the country’s own wages (World Bank, 2011).
Figure 24 Growth in wages and labour productivity in the Middle East, 1999–2011 (%)
4
3
QAT
Real wage growth (%)
2
KUW
JOR
1
SYR
WBG
OMA
BAR
0
UAE
-1
SAU
-2
-5
-4
-3
-2
-1
0
1
2
3
4
5
Labour productivity growth (%)
Note: If data for 1999 or 2011 were unavailable, the next closest year’s data point was used to estimate the trend. For country abbreviations, see Appendix I.
Sources: ILO Global Wage Database; ILO Trends Econometric Model, March 2012.
32
Global Wage Report 2012/13
3.7 Africa
Transition and turbulence
In the years before the crisis, Africa went through a period of relatively rapid economic
growth, with annual growth rates of around 6.5 per cent over the period 2004–08.
During the years 2008–11 the economic environment deteriorated, and North African
countries in particular faced both external and internal challenges. External challenges
arose from the close economic connection with the depressed European economies,
while internal challenges reflected the radical changes and political transitions towards
more democratic regimes in Egypt, Tunisia and Libya. In the short run, this period of
transition has been associated with reduced flows of foreign investment and trade, and
also falling tourism. Figure 25, which plots output and employment growth, shows how
severely Libya’s economy was affected during the period 2008–11.
Unemployment: An unaffordable luxury for most
Figure 25 (a) highlights the extent to which, in the period 1999–2007, output growth
exceeded employment growth in a large number of countries, leading to sometimes
substantial gains in labour productivity. An earlier study estimated the annual growth
rate of labour productivity in sub-Saharan Africa at 1.9 per cent per annum over the
period 2000–09 (ILO, 2010b). But here again, as emphasized in the section above
on Asia, in poor developing countries employment growth often follows growth in
the working-age population, as unemployment benefits are underdeveloped and most
people just cannot afford to remain unemployed. For this reason we also show (in
figure 26) how GDP growth related to the growth of paid employment in Africa. Here
we see that economic growth was accompanied by relatively strong increases in the
number of paid employees.
Limited data show moderate wage increases
How have these developments affected wages? Data on the evolution of average wages
in Africa are relatively scarce. Only a few countries in Africa, including Botswana,
Egypt, Lesotho, Mauritius, South Africa and Uganda, carry out quarterly or annual
establishment surveys of the kind conducted by developed countries in order to measure
the evolution of earnings. Morocco publishes an index of nominal average wages,
compiled on the basis of earnings reported to the Caisse Nationale de Sécurité Sociale,
its social security institution. In the majority of remaining countries, wage data are at
best collected through labour force surveys that are implemented at irregular intervals,
and are not always comparable across years. Our tentative regional estimate in figure 7
shows that wage growth since 2006 has generally been moderate, with the exception of
2010 when regional average wages increased considerably, mostly owing to the large
weight of South Africa in the regional estimate. Figure 27 shows the real wage growth
and labour productivity growth between 1999 and 2011 for selected countries. In 2010,
according to official figures, real average wages increased by nearly 10 per cent in
South Africa, where wage growth remains unequally distributed.
PART I
Regional estimates
33
Figure 25 Growth in output and employment in Africa, 1999–2007 and 2008–11 (%)
(a) 1999–2007
20
EQG
19
18
17
16
15
14
Output growth (%)
13
12
ANG
11
SL
CHA
10
NIR
9
8
MOZ
7
SUD
UGA
6
5
ZAM
4
LES
3
MOR
TUN
MUS
GUI
SWA
2
1
RWA
ETH
TAN
BOT
CAV
EGY
BKF
NAM
GHA
NIG
SA
MAL
MAI
SEN LBY
BEN
KEN
CAM
DRC
BUR
CON
MAW
MAD
COM
GUB
GAM
GAB
TOG
ALG
ERI
CAR
0
1
0
3
2
10
5
GHA CON
RWA
TAN NIR
ETH
ZAM
MAW
MOZ
UGA BKF
TOG CHA
DRC
GAM
CAV
SL CAM
LES
EGY
KEN MAL BUR
ERI GAB
MUS GUB
MOR
NIG
EQG
BOT
ALG
ANG
CAR
COM
TUN
SEN BEN MAI
SWA GUI SUD
8
6
4
2
4
6
Employment growth (%)
(b) 2008–11
SA
0
45°
NAM
MAD
-2
Output growth (%)
45°
-4
-6
-8
-10
-12
-14
-16
-18
-20
-22
-24
-26
LBY
-28
-2
-1
0
1
2
3
Employment growth (%)
Note: For country abbreviations, see Appendix I.
Sources: ILO Trends Econometric Model, March 2012; IMF World Economic Outlook database.
4
5
6
34
Global Wage Report 2012/13
Figure 26 Growth in output and numbers of paid employees in Africa,
1999–2007 and 2008–11 (%)
(a) 1999–2007
20
EQG
19
18
17
16
15
45°
14
Output growth (%)
13
12
ANG
11
SL
CHA
10
NIR
9
8
MOZ
RWA
7
ETH
5
4
3
2
GUB
TOG
1
UGA
TAN
SUD
BOT
LBY
CAV
BKF
MOR
NAM
GHA
MAL
ZAM ALG SEN
TUN
MAI
EGY
SA
BEN
NIG
MUS
KEN
LES
BUR
MAD
CAM
CON
GUI
SWA
DRC
COM
GAM
MAW
GAB
6
ERI
0
CAR
-6
-5
-4
-3
-2
-1
0
1
2
3
4
5
7
6
8
9
10
11
13
12
14
15
Employee growth (%)
(b) 2008–11
12
45°
10
ETH
GHA
CON NIR TAN
ZAM
RWA
MAW
MOZ UGA
MOR
DRC KENGAB
LES EGY
GAM
CHA
GUBEQG CAV
MUS
MAL
TOG
BUR
ALG
SEN
ANG NIG NAM
SA
BOTMAI BEN
COM
SUD
CAM
TUN
SWA
8
6
4
2
0
Output growth (%)
-2
CAR
BKF
ERI
SL
GUI
MAD
-4
-6
-8
-10
-12
-14
-16
-18
-20
-22
-24
-26
-28
-12 -11 -10 -9
LBY
-8
-7
-6
-5
-4
-3
-2
-1
0
1
2
Employee growth (%)
Note: For country abbreviations, see Appendix I.
Sources: ILO Trends Econometric Model, March 2012; IMF World Economic Outlook database.
3
4
5
6
7
8
9
10 11 12
PART I
Minimum wages and the working poor
35
Figure 27 Growth in wages and labour productivity in selected African countries,
1999–2011 (%)
12
45°
10
MAD
8
TAN
6
4
SA
EGY
SEN
Real wage growth (%)
2
GAB
BOT
REU
0
ALG
MOZ
MUS
TUN
BUR
MOR
CON
KEN
-2
-4
UGA
SWA
LES
-6
-8
-10
-12
-14
-16
-18
-5
-3
-1
1
3
Labour productivity growth (%)
5
7
9
11
Note: If data for 1999 or 2011 were unavailable, the next closest year’s data point was used to estimate the trend. For country abbreviations, see Appendix I.
Sources: ILO Global Wage Database; ILO Trends Econometric Model, March 2012.
4 Minimum wages and the working poor
In current economic conditions, minimum wages remain a topic of debate on the policy
agenda and in the public domain in both developed and developing countries. As part of
its Decent Work Agenda, the ILO encourages member States to adopt a minimum wage
to reduce working poverty and provide social protection for vulnerable employees.14
ILO standards further recommend that minimum wages should be set by authorities
after consultation with social partners, and that a balanced approach should be adopted
which takes into account the needs of workers and their families as well as economic
factors, including levels of productivity, the requirements of economic development
and the need to maintain a high level of employment. 15 Along the same lines, the European Commission recently expressed the view that Member States should establish
“decent and sustainable wages” and that “setting minimum wages at appropriate levels
can help prevent growing in-work poverty and is an important factor in ensuring decent
job quality” (see European Commission 2012a, p. 9). Debates continue regarding the
level at which minimum wages should be set.
36
Global Wage Report 2012/13
4.1 Developed economies
Different mechanisms, different perceptions
Among developed economies, minimum wages vary substantially as a proportion of
full-time median earnings, ranging from about 60 per cent in New Zealand and France
to less than 40 per cent in Japan, Spain and the United States (figure 28). The differences in the levels of minimum wages among countries reflect the different institutional
mechanisms through which levels are determined (Lee, 2012). They also reflect different perceptions about the risks that minimum wages may pose in respect of the displacement of low-paid workers or the number of jobs available in the labour market. These
factors, alongside variations in average wages, also partly explain why the absolute
level of the minimum wage varies so widely across developed economies (figure 28).
Just as perceptions about the optimal level of the minimum wage diverge, so do
views about the role of this policy instrument during periods of economic crisis. Focusing on developed economies only, it appears that policy-makers actively used the minimum wage as a social protection tool for the most vulnerable workers at the beginning
of the crisis through 2009 (see figure 29). However, in later years the minimum wage
was in most cases only adjusted with a view to compensating for inflation; this can be
seen in figure 29, where in the years after 2009 real minimum wages grew in developed
economies by considerably less (or even declined).
Crisis response brings compulsory cuts
In Greece, the minimum wage has been severely cut, losing 22 per cent of its previous
value16 (the value in figure 28 refers to the minimum wage before this adjustment). This
change was made on the request of the European Central Bank, the European Commission and the IMF as a condition for giving the Greek Government access to bailout
funds from the European Financial Stability Facility (EFSF). According to the IMF
(IMF, 2012c), wage cuts were necessary if the country was to regain competitiveness
and growth, ends that could not be achieved through national currency devaluations or
interest rate adjustments. The IMF also considered that the minimum wage in Greece
was substantially higher than in other developed economies, even though the statistics
presented in figure 28 suggest it was not out of range. In Portugal, access to the EFSF
came at the condition of a minimum wage freeze.
4.2 Developing and emerging economies
Minimum wages are also widely used in developing and emerging economies, although
here information about the levels at which they are set relative to median or average
wages is more difficult to obtain (given that information on average wages is often
based on a narrow subset of paid employees in the formal economy or in urban areas).
A recent study, however, showed that, just as in developed economies, the extent of
minimum wage adjustments during the crisis varied among both low-income and
middle-income countries. The joint ILO–World Bank inventory of policy responses
to the financial and economic crisis found that 22 out of the 55 low- and middle-income countries surveyed reported changes in the minimum wage over the period from
mid-2008 to the end of 2010.17
PART I
Minimum wages and the working poor
37
Figure 28 Minimum wage levels in selected developed economies, in PPP$
and as a share of median full-time wage, 2010
1800
Netherlands
1600
Australia
Minimum wage in 2010 PPP$
Belgium
Ireland
France
United Kingdom
1400
New Zealand
Canada
United State s
1200
Greece
Japan
1000
Spain
800
Portugal
600
30
35
45
40
50
55
60
65
Minimum wage as % of median wage
Notes: If the 8 per cent supplement for holiday pay is included, the minimum/median wage ratio amounts to 47.1 per cent in the Netherlands. If 13th and 14th
months’ salary is included, the minimum/median wage ratio amounts to 56 per cent in Portugal and 43.8 per cent in Spain.
Sources: ILO Global Wage Database; Low Pay Commission, 2012.
Figure 29 Minimum wage growth in developed economies, 2006–11
10
8
6
4
2
0
2006
2007
2008
2009
2010
2011
-2
Real growth
Nominal growth
Note: Based on a non-weighted simple average of estimated growth rates of real and nominal minimum wages including 26 developed economies.
Source: ILO Global Wage Database.
38
Global Wage Report 2012/13
Waged work and privilege in developing countries
A reservation frequently advanced about minimum wages in developing countries is
that all wage-earners belong to an elite group, which enjoys higher standards of living
and privileges not accessible to others such as the self-employed or those involved in
family work. While it is true that waged employment is typically associated with higher-productivity activities, superior employment conditions and greater rights at work
as compared with own-account or contributing family work, many waged and salaried
workers in developing countries are in fact living with their families in poverty, as
discussed in box 1. Figure 30 provides estimates of the share of waged and salaried
workers living below the US$1.25 and US$2 international poverty lines for 32 developing countries. These estimates imply that out of a total number of approximately 209
million wage earners who worked in these 32 developing countries at different points
in time from 1997 to 2006, about 23 million were earning below US$1.25 a day and 64
million were earning less than US$2 per day. This indicates that minimum wages, in
spite of their limitations, remain a relevant tool for povery reduction.
One country in Latin America where the minimum wage has had a significant
impact is Brazil. Although the minimum wage revaluation strategy has been pursued
for about 20 years, it has accelerated since 2005, when, as part of a strategy to foster
domestic consumption, regular adjustments were systematically linked to inflation plus
GDP growth. This same strategy was followed even during the financial crisis years
when wage policy was part of a countercyclical strategy. By contrast, in Mexico the
minimum wage has increased only very modestly in real terms between 2005 and 2011,
as the minimum wage policy has been strongly determined by efforts to achieve a fiscal
balance (as minimum wages determine many social security benefits) and increase
export competitiveness. As a result, minimum wages are below market levels, even for
unskilled workers. These two cases illustrate the different approaches towards minimum wages.
Asia has experienced several developments in the realm of minimum wage
growth and minimum wage setting. Across the region, minimum wage growth has been
positive in almost all countries since 2005. This growth has been coupled with positive economic growth and solid real average wage growth over the same period (see
figure 15). At the same time, all of these factors have occurred alongside growth in the
share of employees in total employment and hence the proportion of workers that can
be directly affected by a minimum wage. For instance, in China progress has been made
towards improving enforcement and coordination among provinces in terms of minimum wage-fixing. Other examples include Mongolia, which improved its minimum
wage setting mechanism by including social partners; Malaysia, which announced a
first-time minimum wage in 2012; and the Philippines, which simplified its complex
minimum wage system. In India, minimum wages paid through the National Rural
Employment Generation Scheme (NREGS) appear to have reduced non-compliance
with minimum wages in the private sector (Rani and Belser, 2012).
Minimum wages in the Middle East largely declined between 2005 and 2011
and, generally, are a limited policy tool within the region. While employees represented about 66 per cent of total employment in 2011, the legal coverage of minimum
wages is often more restricted, if a minimum wage exists at all. For instance, in some
PART I
Minimum wages and the working poor
39
countries the minimum wage is restricted to the national population or discriminates
against migrant workers who receive lower rates. In other cases, the minimum wage
may only apply to the public sector, as is the case in Bahrain.
Box 1 Poverty among waged and salaried workers
The working poor are defined as employed members of households living below a defined poverty
line (see Kapsos and Horne, 2011). For international comparisons, the PPP-adjusted poverty lines
of US$1.25 or US$2 a day are typically used to determine extreme and moderate poverty, respectively; households with daily per capita consumption below these lines are classified as poor.18
Extreme poverty among workers in developing countries is often associated with subsistence activities – for example, own-account workers or contributing family workers operating in small-scale
agricultural work. There is indeed evidence to back up the association between the working poor
and subsistence agriculture: a recent ILO study found that in 53 countries with available data from
national household surveys, four out of five workers in extreme poverty (below the US$1.25 poverty
line) were living in rural areas, and that 68 per cent of the working poor were employed in the agricultural sector (see Kapsos and Horne, 2011).
Yet data from many of the same surveys indicate that a narrow focus on poverty among own-account
and contributing family workers would substantially undercount the extent of working poverty in
developing countries. Figure 30 shows that in Madagascar, for example, more than 80 per cent of
waged and salaried workers were poor in 2005, with more than half living in extreme poverty. In
Mozambique, Burundi and Tajikistan, over 60 per cent of employees were living in poverty, and
in Cambodia, the Republic of the Congo and Pakistan over 50 per cent of employees were poor,
according to the most recent survey data.
How do these figures compare with the incidence of poverty among own-account workers and contributing family workers? Across the 32 countries, the share of poor own-account and contributing
family workers exceeds that of poor wage earners in all but two countries (Pakistan and Tajikistan).
In many countries, therefore, having a waged or salaried job is associated with a lower probability of
being poor than for own-account or contributing family workers. However, in some countries, being
in waged employment does not convey large advantages in terms of the likelihood of being poor
versus the other employment categories. For instance, in Cambodia 56.5 per cent of employees
were living below the US$2 poverty line in 2004, versus 65.8 per cent of own-account workers and
unpaid family workers.
In addition, poor waged and salaried workers often make up a large share of the overall working poor
in developing countries. In Indonesia in 2002, the number of wage earners living below the US$2
poverty line was estimated at 15.5 million, versus 29.4 million poor own-account and contributing
family workers – amounting to more than five poor waged and salaried workers for every ten poor
own-account and unpaid family workers. In Pakistan in 2005, there were eight wage earners living
in extreme poverty for every ten poor own-account and unpaid family workers. Thus, while the
working poor in developing countries are indeed disproportionately engaged in agricultural activities
in rural areas, policies aimed at improving productivity and raising the earnings and welfare of the
poor must also take into consideration the large numbers of waged and salaried workers living with
their families in poverty.
40
Global Wage Report 2012/13
Box 1 Poverty among waged and salaried workers (continued)
Figure 30 Employed working poor (earning below US$1.25 and US$2 a day), as % of total
employees
Mexico, 2004
Turkey, 2002
Gabon, 2005
Thailand, 2002
Jordan, 2002
Peru, 2006
Panama, 1997
Cameroon, 2001
Bhutan, 2003
Guatemala, 2000
Morocco, 1998
Cote d'Ivoire, 2002
Colombia, 2003
Nicaragua, 2005
Niger, 2005
Burkina Faso, 2003
Armenia, 2003
Philippines, 2003
Togo, 2006
Mali, 2006
India, 2005
Benin, 2003
Senegal, 2001
Indonesia, 2002
Uganda, 2005
Congo, 2005
Cambodia, 2004
Pakistan, 2005
Mozambique, 2003
Burundi, 1998
Tajikistan, 2003
Madagascar, 2005
0
10
20
30
40
50
60
70
80
90
100
Wage and salaried workers living below US$2 poverty line (% of total employees)
Wage and salaried workers living below US$1.25 poverty line (% of total employees)
Source: ILO calculations based on national household survey data.
Source: Steven Kapsos, Labour Economist, ILO.
Part iI
Falling labour shares
and equitable growth
Recent trends in wages and productivity growth determine what is known as the functional distribution of national income – that is, the distribution of national income
between labour and capital. When overall GDP grows faster than total labour compensation, the labour income share (also called the “wage share”) falls relative to the capital income share. By contrast, when the growth in total labour compensation exceeds
the growth in total GDP, the labour income share increases and the capital income
share falls. In this part of the report we analyse trends in the labour income share and
the causes behind the trends, contributing to the recently growing literature on the
subject.19
We then ask how changes in the labour income share have affected macroeconomic aggregates such as consumption, investment and net exports. In the current
global economic context, understanding the causal relationship between labour
compensation and aggregate demand is of paramount importance. The macroeconomic
effects of changes in labour shares have so far received relatively less attention in the
empirical literature, even though wages are widely perceived as having a major impact
on the economy. Our empirical analysis contributes towards the existing literature by
providing a statistical causal framework and by covering both developed and developing countries.
5 The fall in the labour income share
5.1 Trends in labour shares
A myth of stability exploded
During much of the past century, a stable labour income share was accepted as a natural
corollary or “stylized fact” of economic growth. As industrial countries became more
prosperous, the total incomes both of workers and of capital owners grew at almost
exactly the same rate, and the division of national income between labour and capital
therefore remained constant over long periods of time, with only minor fluctuations.20
It seemed as if some unwritten law of economics would ensure that labour and capital
would benefit equally from material progress, and the subject of the functional distribution of income almost vanished from the agenda of academic research. In recent
years, however, this long-held conventional wisdom has been challenged. An outpouring of literature has provided consistent new empirical evidence indicating that recent
decades have seen a downward trend for the labour share in a majority of countries for
which data are available.
42
Global Wage Report 2012/13
The OECD has observed, for example, that over the period from 1990 to 2009
the share of labour compensation in national income declined in 26 out of 30 developed economies for which data were available, and calculated that the median labour
share of national income across these countries fell considerably from 66.1 per cent
to 61.7 per cent (OECD, 2012b). These findings echo the evidence presented in the
ILO Global Wage Report 2010/11, which described declining wage shares in a large
majority of OECD countries since 1980 (ILO, 2010a; see also ILO, 2008a). Earlier,
similar trends had been observed in other reports published by international organisations (IMF, 2007; European Commission, 2007; BIS, 2006; ILO, 2008a, 2010a; OECD,
2011, 2012a). Looking beyond the advanced economies, the ILO World of Work Report
2011 found that the decline in the labour income share was even more pronounced
in many emerging and developing countries, with considerable declines in Asia and
North Africa and more stable but still declining wage shares in Latin America (IILS,
2011). Other studies also point to the apparently global nature of this trend, suggesting
a decline in the proportion of worldwide income going into labour compensation (see
ILO, 2008a; Stockhammer, forthcoming; Husson, 2010; Artus, 2009).
Evidence for labour share decline
Figures 31 and 32 illustrate the trends in so-called “adjusted” labour income shares for
the period 1970 to 2007 or 2010 for certain individual and grouped developed countries
and for three groups of developing and emerging economies.21 In figure 31, we observe
that the simple average of labour shares in 16 developed countries for which data are
available for this long period declined from about 75 per cent of national income in the
mid-1970s to about 65 per cent in the years just before the global economic and financial
crisis. Figure 32 shows how the average of labour shares also declined in a group of 16
developing and emerging economies, from around 62 per cent of GDP in the early 1990s
to 58 per cent just before the crisis. Even in China, a country where wages roughly
tripled over the last decade (see Part I), GDP increased at a faster rate than the total wage
bill – and hence the labour income share went down (figure 33). The data available for
China, Kenya, the Republic of Korea, Mexico and Turkey (figure 32) suggest that the
decline in this group of countries may already have started in the 1980s.
The global economic crisis seems to have reversed the decreasing trend only
briefly. In developed economies, the wage share bounced back initially after the beginning of the crisis but began to decline again from 2009. This reflects the typical “countercyclical” nature of the wage share, which arises because wages tend to be less volatile than profits during economic downturns. The OECD, for example, observed: “In
times of economic recession, this decline [in the wage share] has typically paused, but
then subsequently resumed with a recovery. The recent economic and financial crisis
and subsequent sluggish recovery have not deviated from this general pattern” (OECD,
2012b, p. 112).
Different skill levels, different impacts
These trends have not been uniform across workers with different levels of education and
skills. Studies on developed economies that have disaggregated total labour compensation by categories of workers have invariably found that recent trends were driven by
PART II
The fall in the labour income share
43
Figure 31 Adjusted labour income shares in developed economies, Germany,
the USA and Japan, 1970–2010
90
85
80
75
70
65
19
70
19
72
19
74
19
76
19
78
19
80
19
82
19
84
19
86
19
88
19
90
19
92
19
94
19
96
19
98
20
00
20
02
20
04
20
06
20
08
20
10
60
ADV
Japan
United States
Germany
Note: ADV = unweighted average of 16 high-income OECD countries (Australia, Austria, Belgium, Canada, Denmark, Finland, France, Germany, Ireland, Italy,
Japan, the Netherlands, Spain, Sweden, the United Kingdom, and the United States. The Republic of Korea is excluded.)
Source: Stockhammer, forthcoming, from AMECO database.
the falling wage shares of low- and medium-skilled workers. The International Institute
for Labour Studies (IILS, 2011) calculated, for example, that in the ten developed economies for which data were available the wage share fell by 12 percentage points for
low-skilled workers between the early 1980s and 2005, while it increased by 7 percentage points for highly skilled workers. Similarly, the IMF found that between 1980 and
2005 the labour share of unskilled workers fell in the United States, Japan and Europe
(by 15 per cent, 15 per cent and 10 per cent respectively), but increased for skilled
workers educated to tertiary level and above (by 7 per cent, 2 per cent and 8 per cent
respectively) (IMF, 2007). More recently, the OECD found that in the 13 countries for
which data are available, the average wage share of those with low educational levels
fell (OECD 2012b). This occurred in the context of the observed polarization of jobs,
with increasing numbers of low- and high-skilled jobs and fewer medium-skilled jobs.
Although one could expect that an expansion of low-skilled jobs would in principle
raise the wages of low-skilled workers, it appears that such workers have increasingly
been displaced by overqualified workers with intermediate levels of education.
Taking out the top earners
Labour shares, as measured in the UN System of National Accounts, therefore underestimate the fall in the proportion of labour compensation going to workers paid below
the median wage. If the labour compensation of the top 1 per cent of income earners
44
Global Wage Report 2012/13
Figure 32 Adjusted labour income shares in developing and emerging economies, 1970–2007
75
70
65
60
55
19
70
19
72
19
74
19
76
19
78
19
80
19
82
19
84
19
86
19
88
19
90
19
92
19
94
19
96
19
98
20
00
20
02
20
04
20
06
50
DVP3
DVP5
DVP16
Note: DVP3 = unweighted average of Mexico, Republic of Korea and Turkey; DVP5 = unweighted average of China, Kenya, Mexico, Republic of Korea and
Turkey; DVP16 = unweighted average of Argentina, Brazil, Chile, China, Costa Rica, Kenya, Mexico, Namibia, Oman, Panama, Peru, Republic of Korea, Russia,
South Africa, Thailand and Turkey.
Sources: ILO Global Wage Database; Stockhammer, forthcoming.
was excluded from the computation, the drop of the labour share would appear even
greater (see, for example, IILS, 2011; OECD, 2012b). This reflects the sharp increase,
especially in English-speaking countries, of the wage and salaries (including bonuses
and exercised stock options) of top executives, who now cohabit with capital owners at
the top of the income hierarchy (see Atkinson, Piketty and Saez, 2011; Piketty and Saez,
2003; OECD, 2008; Wolff and Zacharias, 2009).22 The proportion of wage earnings in
the top segments of household income also increased, to various degrees, in other countries including Japan, the Netherlands, Canada, Italy, Spain and the United Kingdom –
though not in Sweden, Finland or Australia (Atkinson, Piketty and Saez, 2011).
The other side of the coin: The increasing capital share
The mirror image of the fall in the labour share is the increase in the capital share of
income (often called the profit share), which is measured most frequently as the share
of gross operating surplus of corporations as a percentage of GDP. The ILO/IILS found
that when total capital share is disaggregated by type of corporations, the growth of the
capital share has been faster in the financial sector than for non-financial corporations.
Also, in advanced economies, profits of non-financial corporations have increasingly
been allocated to pay dividends, which accounted for 35 per cent of profits in 2007
(IILS, 2011) and increased pressure on companies to reduce the share of value added
going to labour compensation.
PART II
The fall in the labour income share
45
Figure 33 Unadjusted labour income share in China, 1992–2008
65
55
45
35
92
19
93
19
94
19
95
19
96
19
97 1998 1999 2000
19
01
20
02
20
03
20
04
20
05
20
06
20
07
20
08
20
Note: The unadjusted wage share is calculated as total labour compensation of employees divided by value added. The sudden change between 2003 and 2004
likely reflects an adjustment to the data; nonetheless, it does not change the direction of the trend.
Source: ILO calculations based on data from the China Statistical Yearbooks, http://www.stats.gov.cn/english/statisticaldata/yearlydata/ [accessed 17 Sep.
2012].
Looking at a set of four developed economies (France, Germany, the United Kingdom and the United States), Husson found that over the period 1987–2008 a large part
of the increased surplus of corporations went into boosting the dividends paid to shareholders (Husson, 2010). He calculated that in France total dividends increased from
4 per cent of the total wage bill in the early 1980s to 13 per cent in 2008. Interestingly,
in the United Kingdom the shares of dividend payments and labour compensation both
increased, so that the higher dividends came at the expense of reduced retained earnings.23 In the United States, three-quarters of the increase in gross operating surplus
went into the payment of dividends. Given the greater concentration of income with
capital rather than labour, booming dividends have often contributed to higher overall
household income inequality (OECD, 2011; see also Roine and Waldenström, 2012).
5.2 The gap between wages and productivity
The effect on the labour share
A shrinking labour share is almost always tied to another empirical regularity, namely
the growing discrepancy between the respective growth rates of average wages and
labour productivity (for a detailed exposition of the relationship between wages,
productivity, unit labour costs and labour shares, see Appendix II). A publication by the
US Bureau of Labour Statistics, for example, shows that the gap between hourly labour
productivity and hourly compensation growth contributed to a decline in the labour
46
Global Wage Report 2012/13
Figure 34 Hourly productivity and compensation in the United States, Q1 1947–Q1 2012
6.300
6.100
5.900
5.700
Ln of indexes
Productivity
5.500
Real hourly compensation
5.300
5.100
4.900
4.700
2010:2
2007:3
2002:1
2004:4
1999:2
1996:3
1993:4
1991:1
1988:2
1985:3
1980:1
1982:4
1977:2
1974:3
1971:4
1969:1
1966:2
1963:3
1958:1
1960:4
1955:2
1952:3
1947:1
1949:4
4.500
Note: Shaded areas represent recessions.
Source: Figure reproduced from Fleck, Glaser and Sprague (2011) using updated data published by the Division of Major Sector Productivity of the Bureau of
Labour Statistics, as of 26 June, 2012.
share in the United States (Fleck, Glaser and Sprague, 2011). Since 1980 hourly labour
productivity in the non-farm business sector increased by around 85 per cent, while real
hourly compensation increased by about 35 per cent (figure 34).
Another example is Germany, where labour productivity (defined as value added
per person employed) has surged by almost a quarter (22.6 per cent) over the past two
decades, while real monthly wages have remained flat over the same period – indeed,
between 2003 and 2011 they actually fell below the level seen in the mid-1990s (see
figure 35(a)). The decline in monthly wages is attributable in part to a sharp reduction in
monthly working time, from 122.7 hours in 1991 to 110.7 hours in 2011,24 as the number
of workers in part-time and atypical forms of employment such as the so-called ‘minijobs’ rose substantially (see Federal Statistical Office, 2009). Even so, a discrepancy is
also apparent between hourly labour productivity and hourly wages (see figure 35 (b)).
In 2011, hourly wages were only marginally (0.4 per cent) above their 2000 level, while
hourly labour productivity had grown by 12.8 per cent over the same period.
Productivity outpaces pay in developed economies
Because some of the larger economies, including the United States, Germany and
Japan, have seen wage growth lagging behind productivity growth, our report estimates
that in developed economies as a whole average labour productivity has outpaced real
average wage growth. Based on the wage data for 36 countries, we estimate that since
1999 average labour productivity has increased more than twice as much as average
wages in developed economies (figure 36).
PART II
The fall in the labour income share
47
Figure 35 Trends in labour productivity and wages in Germany, 1991–2011:
(a) per month; (b) per hour
(a) Trends in labour productivity in Germany (per month)
115
110
105
100
95
90
85
19
91
19
92
19
93
19
94
19
95
19
96
19
97
19
98
19
99
20
00
20
01
20
02
20
03
20
04
20
05
20
06
20
07
20
08
20
09
20
10
20
11
80
Labour productivity, per employed person (Index, 2000 = 100)
Average gross monthly earnings, all employees (Index, 2000 = 100)
(b) Trends in labour productivity in Germany (per hour)
115
110
105
100
95
90
85
19
91
19
92
19
93
19
94
19
95
19
96
19
97
19
98
19
99
20
00
20
01
20
02
20
03
20
04
20
05
20
06
20
07
20
08
20
09
20
10
20
11
80
Labour productivity, per hour worked (Index, 2000 = 100)
Average gross hourly earnings, all employees (Index, 2000 = 100)
Note: Nominal average monthly and hourly wages published by the Federal Statistical Office have been deflated using the CPI from the same source.
Source: Federal Statistical Office, Germany, National Accounts: Domestic Product, Quarterly Results, Fachserie 18, Series 1.2 (May 2012), table 1.12; Federal
Statistical Office, 2012.
48
Global Wage Report 2012/13
Figure 36 Trends in growth in average wages and labour productivity in developed economies
(index: 1999 = 100)
114
112
110
Gap between productivity
and compensation
108
106
104
102
100
1999
2000
2001
2002
2003
2004
2005
2006
Labour productivity index
2007
2008
2009
2010
2011
Real wage index
Note: Since the indices refer to a weighted average, developments in the three largest developed economies (United States, Japan and Germany) have a particular impact on this outcome. Labour productivity is measured as output per worker (see note 9).
Sources: ILO Global Wage Database; ILO Trends Econometric Model, March 2012.
5.3 The role of financial markets and other factors
The search for explanations
Most studies that have documented the fall in the labour income share since the
1980s have also tried to understand its causes (see, for example, IMF, 2007; European
Commission, 2007; OECD, 2012a; ILO, 2008a; ILO 2010a; IILS, 2012).
The analysis undertaken in the previous Global Wage Report explored the possibility that trends in the labour share were determined by a compositional shift in employment from labour-intensive to more capital-intensive sectors, where labour shares are
lower. The analysis showed that the shift in sectoral composition was indeed a contributory factor, but that most of the fall in the labour share was the result of falling shares
within industries (ILO, 2010a). A recent OECD study confirmed this finding, pointing
out that “within-industry falls in the labour share explain an overwhelming proportion
of its aggregate decrease between 1990 and 2007” (OECD, 2012b, p. 119). Large falls
were observed in financial intermediation, and also in high- and medium-technology
manufacturing, while the decline was less steep in other service sectors, construction
and low-tech manufacturing.
PART II
The fall in the labour income share
49
New evidence: Revisiting the “usual suspects”
The present report goes further and provides a new set of empirical evidence. Figure 37
provides an illustration of the “usual suspects”: technological change, globalization,
financial markets, labour market institutions, and the decline in the bargaining power
of labour. In our illustration, the circles for technological change, globalization and
financial markets overlap, reflecting the difficulties in distinguishing between these
phenomena at both conceptual and empirical levels. The structure of the diagram also
indicates that the bargaining power of labour derives directly from labour market institutions (particularly the existence and strength of trade unions) but is also influenced
by globalization and financial markets, which give firms more options for investing
in financial assets as well as in real assets, both at home and abroad (Rodrik, 1997;
Onaran, 2011). In fact, while much evidence has focused on the role of globalization
and especially technology, many studies have overlooked the potential effects of financial markets and of the downsizing of labour and social institutions.
Figure 37 Factors influencing the labour income share
Bargaining power of labour
Technological
change
Globalization
Financialization
Labour market
institutions and
welfare state
Source: Stockhammer, forthcoming.
Functional
distribution of
income
50
Global Wage Report 2012/13
Technological changes are often presented as the main culprit, with the suggestion
that they have been “capital augmenting” rather than “labour augmenting”, increasing the demand for capital and complementary high-skilled labour and reducing the
demand for low-skilled workers (see IMF, 2007; European Commission, 2007; OECD,
2012b; IILS, 2012).25 The standard hypothesis is that the diffusion of information and
communication technologies (ICT) has allowed for automation of production, boosting productivity and displacing low-skilled workers. The latest OECD study estimated
that technical change and capital accumulation accounted, on average, for 80 per cent
of intra-industry change of the labour share in advanced economies over the period
1990–2007 (OECD, 2012b).
Studies typically also find negative but smaller effects of globalization on the
labour share. One possible explanation for this is that the intensification of competition
and the entry of labour-abundant countries into the global economy may have worked
as a wage-moderating factor (ILO, 2008a). More recent firm-level evidence produced
in a joint ILO–WTO publication (Bacchetta and Jansen, 2011) shows that increased
competition from trade liberalization has often induced firms in both developed and
developing countries to become more productive through a process of “industry rationalization”, involving the elimination of the least productive firms and the dismissal
of workers in the remaining firms. It is also possible that redistribution from labour to
capital has occurred through offshoring or the so-called “threat effects” that can occur
even without actual changes in production locations (Epstein and Burke, 2001; see also
Messenger and Ghosheh, 2010, on service sector offshoring and outsourcing).
A new focus on financialization
The globalization of financial markets and “financialization” – defined as the increasing role of financial motives, financial actors and financial institutions in the operation
of domestic and international economies (Epstein, 2005) – have been brought into the
picture only more recently. A report by the IILS found that the international integration
of financial markets has been a major driver of falling wage shares, at least in advanced
economies (IILS, 2011). The switch in the 1980s to corporate governance systems based
on maximizing shareholder value and the rise of aggressive returns-oriented institutions,
including private equity funds, hedge funds and institutional investors, put pressure on
firms to increase profits , especially in the short term (Rossmann, 2009; Lazonick and
O’Sullivan, 2000; Stockhammer, 2004; see also IILS, 2008; Hein and Schoder, 2011;
Argitis and Pitelis, 2001). In addition, as pointed out above, financial globalization has
probably weakened workers’ bargaining position (Rodrik, 1997; Onaran, 2011). Some
groups of workers, particularly top executives, may have benefited from this process of
“financialization” through deferred salaries in the form of pension funds and other types
of capital gains. For the average worker, though, the evidence indicates that the extent
and size of such gains are much more limited.
Labour market institutions: Declining collective power?
Labour market institutions and the size of the welfare state are also among the variables
that have been debated in the existing literature. These institutional indicators include
factors such as union density, minimum wage legislation, unemployment benefits and
PART II
The fall in the labour income share
51
coverage, severance pay, or government consumption. The decline in union density – the
number of trade union members as a percentage of total employees or as a percentage of
total employment – in many developed economies has often been linked to the weakening of workers’ bargaining power, negatively affecting their ability to negotiate a larger
share of the pie for labour compensation. The level of the minimum wage and other
“intermediary” institutions, including employment protection legislation, the generosity
of unemployment benefit and other benefits and contributions (the ‘tax wedge’), are
among the institutional variables that have been included in empirical studies (IMF,
2007; European Commission, 2007; OECD, 2012b). The level of unemployment benefit
can have an impact on the labour share by affecting workers’ “reservation wages”, that
is, the level of pay workers would accept as a minimum.
Deepening the analysis
The estimates in the present report provide new evidence to complement and update
existing studies. Our analysis covers a wider range of countries and a longer period of
time, drawing on the recently updated ILO Global Wage Database and other complementary data sources.26 It includes annual data from 71 countries (31 high-income economies and 40 developing economies, including emerging economies) for the period
1970–2007. Although data were available for the years 2007–09, the crisis period was
excluded to avoid the effect of structural breaks on the underlying historical trend and
because our main interest lies in the long-term trends in the run up to the crisis. The
estimates are based on a model that captures the factors in figure 37. Appendix III
provides a step-by-step account of the methodology used for estimation and summarizes the main results for the regression outcomes. The countries included are also
described in the appendix.
Figure 38 shows the results we obtained by decomposing the effects of the different factors that enter the model to explain changes in labour income shares over time.
This decomposition was calculated by weighting the measurable changes between two
selected periods (1990/04 and 2000/04) for each of the factors where the weights are
the estimated coefficients in the selected model (shown in table A4 of Appendix III).
The decompositions are estimated separately for developed and developing economies.
Figure 38(a) shows that in the case of developed economies all factors contributed to
the fall in the labour income share over time, with global financialization playing the
largest role. The estimates mean that, in terms of relative contribution, global financialization contributes 46 per cent of the fall in labour income shares, compared to
contributions of 19 per cent by globalization, 10 per cent by technology and 25 per cent
by changes in two broad institutional variables: government consumption and union
density. These results open up the possibility that the impact of finance may have been
underestimated in many of the previous studies and suggest that overlooking the role
of financial markets may have serious implications for our understanding of the causes
of labour share trends.
The negative contribution of the institutional factors to the labour income share
can be explained with reference to the diminution, on average, of government consumption as a share of GDP and union density in advanced economies. In other words, while
the positive and significant coefficients of these variables (see table A4) imply that
52
Global Wage Report 2012/13
Figure 38 Decomposing changes in the average adjusted labour income share
between 1990/94 and 2000/04
(a) Developed economies
0
FIN
GLOB
TECH
WFST
-0.5
-1
-1.5
-2
-2.5
-3
-3.5
(b) Developing countries
1
0.5
TECH
0
FIN
GLOB
WFST
-0.5
-1
-1.5
Notes: The decomposition is based on estimates in table A4. (a) Developed economies (table A4, column 3); (b) developing countries (table A4, column 4).
FIN stands for “financialization”; GLOB stands for “globalization”; TECH stands for “technology”; WFST stands for “welfare state measures and labour market
institutions”. See Appendix III for a detailed explanation of the steps leading to the decomposition.
Source: ILO estimates (Stockhammer, forthcoming).
PART II
The effects on economic growth
53
increases in government consumption and union density have a positive impact on
labour income shares, the actual drop in both government consumption and unionization has contributed to a decline in the labour share. On the other hand, financialization,
globalization and technological progress have all grown in magnitude over time, thus
contributing negatively to changes in labour income shares between the two periods.
In the case of developing economies, figure 38(b) illustrates our finding of a positive impact of technology on the labour share, which might possibly be explained by
some “catching up” effect of economic growth, with a tightening of labour markets and
the draining of excess labour supply. This technology effect partly offsets the adverse
effects of financialization, globalization and the shrinkage in the welfare state. Nevertheless, as was the case with the decomposition for developed economies, financialization stands as the single most adverse factor in terms of explaining the decline of
labour income shares among the economies in the developing world that are included
in our sample.
In addition to these variables, increases in unemployment also have strong negative impacts on the labour share, which should not come as a surprise given the downward pressure on wages and the weakening of workers’ bargaining position in the
presence of higher rates of unemployment (see Appendix III).
6 The effects of labour income shares on economic growth
6.1 Falling labour shares and aggregate demand: Ambiguous effects
Equity and economics: What happens when the labour share falls?
Because factor shares (capital share and labour share) link income to productive activity, they are often seen as an indicator of the fairness of the distribution of income. Also,
as pointed out by Atkinson, factor shares are a crucial issue in collective bargaining,
where a fair division of income may be regarded as one where increased labour productivity is reflected in increased labour compensation (Atkinson, 2009). Some commentators also consider that decreasing labour shares may have political consequences.27
Analysing the effects on aggregate demand
While these are important considerations, this section of the present report focuses on
the economic implications of declining labour shares. In particular, we underline the fact
that changes in labour share have different effects on the various key components of the
aggregate demand for goods and services produced in an economy. Aggregate demand
is the sum of consumption by households, private sector investment, net exports and
government consumption. The economic mechanism illustrated in figure 39 indicates
that a shift between the two components of the functional income distribution (labour
and capital shares) affects the main elements of aggregate demand and ultimately these
changes affect national income growth in a dynamic process.
But how exactly does a decline in the labour share affect aggregate demand?
This question has so far received relatively less attention, and does not have a simple
answer. We have set out to explore empirically the link between the observed changes
54
Global Wage Report 2012/13
Figure 39 The macroeconomic effects of functional income shares
Functional income share
Aggregate demand
Labour
income
share
Investment
Income
growth
Net exports
1%
Capital
income
share
Consumption
Source: ILO.
in labour income shares in the past four decades (1960s to 2000s) and each of the main
components of aggregate demand, namely consumption, investment and net exports.28
We have restricted our analysis to 15 countries that are members of the G20 and for
which sufficient data are available, and also look at the 12 eurozone member countries
as a group. The methodology in estimating the effect of wage shares on aggregate
demand and detailed results are provided in Appendix IV, and the main direction of
results is shown in table 2.29
Table 2 Direction of effects of a 1% decrease in labour income share on private consumption
of domestic goods and services, investment and net exports in 16 economies
Eurozone
Argentina
Australia
Canada
China
France
Germany
India
Italy
Japan
Mexico
Republic of Korea
South Africa
Turkey
United Kingdom
United States
Source: Onaran and Galanis, forthcoming.
Private consumption
Investment
↘
↘
→
↘
↘
↗
→
↘
↘
↗
→
↘
↗
↘
↘
↘
↘
↘
↘
↘
↘
↘
↗
↗
↗
↗
↗
→
↗
→
↗
→
Net exports
↗
↗
↗
↗
↗↗
↗
↗
↗
↗
↗
↗
↗
↗
↗
↗
↗
PART II
The effects on economic growth
55
Consumption down, exports up, investment uncertain
The table illustrates the finding that a 1 per cent decline in the labour share has been
consistently associated with a lower share of private consumption relative to GDP in
all 15 countries, as well as in the eurozone as a whole. Conversely, a 1 per cent lower
labour share was associated with a higher share of net exports in all countries, particularly in China (as highlighted by the two upward arrows) which has pursued a highly
explicit export-led growth strategy. The link between labour shares and investment
is less clear-cut. A 1 per cent lower labour share was associated with higher rates of
investment in GDP in nine countries as well as in the eurozone group, but had no
perceptible effect on investment in five emergent economies and the United States.
The positive effect of lower labour share on exports is perhaps not surprising,
given the close relationship between the concept of the labour share and the concept of
unit labour costs (labour costs per unit of output; for more detail on this relationship,
see Appendix I). A decline in unit labour costs is often seen as an improvement in external cost competitiveness, particularly in the eurozone, where individual Member States
cannot devalue their currency or adjust interest rates, and where lower unit labour
costs are therefore frequently advocated as a means of restoring economic growth and
promoting employment. This was, for example, the rationale behind the decision in
Greece to reduce the minimum wage by 22 per cent, with a further 10 per cent cut for
young workers, together with a reduction in non-wage costs (social security contributions) by 5 percentage points (see Part I of this report). Similar, though less radical,
measures were also part of IMF programmes in Portugal, Serbia and Latvia.30
Private consumption and the labour/capital share
However, a single-minded focus on lowering unit labour costs would fail to take into
consideration the generally negative impact of lower wages on private household
consumption, and hence the uncertain effect on overall aggregate demand. The positive effect on consumption of redistribution from the capital to the labour share most
likely arises because the propensity to consume out of labour compensation is higher
than the propensity to consume out of capital income, as the latter is mainly redistributed through dividends to wealthier people who save a higher proportion of their total
incomes. It is important to realize, though, that a substantial part of profit accrues to
companies, who pass on only a part of it in dividends, and whose retained earnings
contribute to generating future labour incomes. Also, a sizeable fraction of the dividends accrues to pension funds, which may pay out pensions at a later date that will be
spent on consumption. Furthermore, the State levies taxes on capital income and pays
transfers that may be an important determinant of consumption. Nevertheless, in spite
of these complexities, we find that labour compensation and household consumption
remain positively correlated.
Investment: Resources for the “real economy”
The relationship between the labour share and investment is less clear. In principle one
could expect that higher capital incomes might lead to more productive investment,
and this indeed seems to have been the case in a majority of countries. But there are
56
Global Wage Report 2012/13
also concerns that financialization may have drained internal means of finance for real
investment purposes away from corporations, through increases in dividend payments
in order to boost stock prices and thus shareholder value, or through risky financial
investments aimed at generating maximum short-run profits. Both types of activity
may have had negative effects on investment in capital stock in the “real economy”.31
In emerging economies, one possible explanation for the lack of correlation between
firms’ profits and overall investment may lie in the dominance of public industrial policies and public investment as the drivers of infrastructure and industrial development
(Akyuz et al., 1998). This hypothesis, though, calls for further research.
The labour share and aggregate demand: A delicate balance
Overall, our findings highlight the ambiguous effects that changes in the labour income
share can have on aggregate demand and income growth. In some countries and under
some circumstances, low wage growth relative to productivity growth might lead to
increases in net exports, in domestic capital investment, and in income growth.32 In
other countries or other circumstances, low wage growth and a falling labour share
might depress domestic consumption to such an extent that any gains in net exports
and/or investment could not offset an overall drop in aggregate demand and income
growth. That both outcomes are possible, however, indicates that changes in the functional distribution of national income between labour and capital do have an unpredictable impact on a country’s overall economic performance. This observation renders it
imperative that decision-makers continuously monitor the evolution of wages in relation to productivity and study the effects on national income. But a presumption that
wage moderation is always beneficial for economic activity would be misguided.
6.2 In pursuit of the optimal labour share
National and global strategies
This uncertainty about the effects of functional income shares on economic growth
raises the question of what the net effect is of a change in a country’s labour share. This
net effect certainly varies from country to country and is also likely to vary over time,
depending on internal and external circumstances. In some countries and some periods, a redistribution of income from capital to labour will provide a boost to national
income, while in other countries and at other times it will have the opposite effect.
The net effect of a changing labour income share in any given country will necessarily
depend on the international environment and on the strategies that are being pursued in
all other countries at that moment.
Export-driven growth
In recent years, many countries have pursued export-led growth strategies based on low
unit labour costs. Strong types of “export-driven” growth were observed in China and
Germany, but also to a greater or lesser extent in Argentina, Canada, Japan, Indonesia,
the Republic of Korea and Russia. Over the years 2000–08, all these countries maintained trade surpluses. In China, the large export surplus alone guaranteed an average
PART II
The effects on economic growth
57
Figure 40 Unit labour costs in selected eurozone countries, 2000–10 (index: 2000 = 100)
110
105
Index
100
95
90
85
Germany
Spain
Portugal
20
10
20
09
20
08
20
07
20
06
20
05
20
04
20
03
20
02
20
01
20
00
80
Greece
Source: Calculated from Eurostat. Real unit labour cost is defined as compensation per employee in current prices divided by GDP in current prices per
employed person.
rate of economic growth in excess of 2.5 per cent per year, and accounted for about
one-quarter of overall economic growth (reflecting the extraordinary rates of expansion of both private household consumption and, especially, investment). In the case
of Germany, where annual growth rates were much lower, private consumption barely
increased at all and the export surplus accounted for between one-third and one-half
of economic expansion. China’s export growth was based on a particularly competitive exchange rate. In Germany – a eurozone member that cannot devalue its currency
unilaterally – export surpluses were boosted by low inflation and falling real unit labour
costs relative to other eurozone countries (figure 40).
Debt-driven growth
Because one country’s surplus is another country’s deficit, not all countries can follow
the path of China and Germany. Export-driven growth requires high current account
surpluses in some countries and thus deficits in others. In some of the world’s main
“demand engines” consumption booms since the turn of the century were underpinned by soaring household debt rather than by rising wages. In the United States
58
Global Wage Report 2012/13
in particular, strong consumption growth in the face of stagnating median wages was
made possible only by wealth-based and debt-financed consumption. Stock market
and housing price booms have each increased (notional) wealth and thus collateral for
consumer credit and mortgage financed consumption.33 In addition, changing financial
norms, new financial instruments (credit card debt, home equity lending) and deterioration of creditworthiness standards, triggered by the securitization of mortgage debt,
made increasing amounts of credit available to low-income, low-wealth households,
in particular. Household debt thus became a substitute for higher wages as a source of
demand and consumption.
This debt-driven growth sustained global economic growth in the years before
the crisis. Had falling labour shares of the bottom 99 per cent in the United States
not been compensated for by debt-led consumption, it is likely that world economic
growth would have slowed or halted much earlier. Debt-driven consumption booms
can be observed not only in the United States, but also to a greater or lesser extent in
the United Kingdom, Australia, and the so-called “rescue economies” in the eurozone
(Greece, Ireland, Portugal and Spain). Figure 41 shows that current account deficits
are associated with higher household debt for a selection of advanced economies that
have in common easy access to credit markets, indicative of how finacialization has
contributed to external imbalances by channelling resources into household debt for
consumption demand.
Demand-led growth
Other countries follow more balanced models of ‘demand-led’ growth, based on wages
increasing in line with productivity rather than on household debt. In France (as in
the United States and the United Kingdom), growth was driven by domestic demand.
Net wealth–income ratios and residential property prices also increased. Yet in France,
unlike in the United States and the United Kingdom, domestic demand was almost
entirely based on wages increasing in line with productivity, rather than on debt-financed consumption demand. The ratio of gross household debt to income increased
only slightly and the financial balance of the private household sector remained positive, as did the financial balance of the private sector as a whole. Among the emerging
economies, Brazil perhaps stands out, with increases both in the labour share and in the
contribution of domestic demand to real GDP growth.
Yet even in Brazil there are signs of debt-driven consumption, on top of wagebased consumption (Bruno, 2011). The reason for this is that in Brazil the average wage
earner has a very high propensity to consume: studies find that most wage earners spend
100 per cent of their salaries, with private savings deriving solely from profits made by
the upper percentiles in the personal income distribution. At the same time, through the
impact of financialization, Brazil has experienced an expansion in lending and reduced
the average propensity to save of the average household. This has been particularly
fuelled by lower interest rates maintained by the authorities to encourage investment.
Although such an environment benefits those who promote capital investment, it is also
leading to an accumulation of debt that fuels economic growth through consumption.
PART II
The effects on economic growth
59
Figure 41 Changes in current account balance and household debt in selected countries,
2003–10
70
Ireland
60
Debt increases (% points of GDP)
50
Australia
40
Spain
Greece
United Kingdom
30
Portugal
Netherlands
Rep. Korea
USA
20
Italy
10
Austria
China
Russia
Switzerland
0
Japan
-10
-20
-15
Germany
-10
-5
0
5
10
15
Current account balance (% of GDP)
Debt
Linear prediction
Notes: Current account balances are given as averages for the period 2003–10. Increases in household debt are given as averages between 2000 and 2008.
Ireland starts at 2001; Switzerland starts at 1999 and ends in 2007. The line in the scatter diagram is based on only 16 observations, which may not be
sufficient to generate a statistically reliable estimate.
Source: Created from Lavoie and Stockhammer, forthcoming, table 13.
6.3 The “Great Recession” and the opportunity for more balanced growth
The different growth patterns described above can work for some countries for some
time, but recent experience has shown that debt-driven consumption was not sustainable at either the national or the global level. Debt-driven growth comes with rising
levels of household debt and excesses in pay and risk-taking in the financial sector.
The crisis and its subsequent painful deleveraging process have revealed the limits of
this growth model, which not only rested on internal imbalances, but also contributed
to global imbalances as high (or rising) current account surpluses in some countries
required the existence of deficits in others.
60
Global Wage Report 2012/13
Managing competition in a closed global economy
What is the way forward? In many cases, the policy advice to those economies that
had large current account deficits and household debts prior to the crisis involved
some combination of austerity and wage moderation (or wage cuts) to increase net
exports. This advice is based on the assumption that a unilateral downward adjustment
in labour costs can restore individual countries’ competitiveness. The extent to which
this can work is unclear, as competitiveness not only depends on labour costs but also
on a series of other factors, including the ability of countries to produce a wide range
of diverse and complex products (Felipe and Kumar, 2011). There is also a problem of
collective action: while each individual country may in principle increase aggregate
demand for its goods and services by exporting more, not all countries can do so at
the same time. The world economy as a whole is a closed economy. If competitive
wage cuts or wage moderation policies are pursued simultaneously in a large number
of countries, competitive gains will cancel out and the regressive effect of global
wage cuts on consumption could lead to a worldwide depression of aggregate demand.
There is also room to stimulate domestic demand in countries with a current account
surplus.
Moreover, the advice to cut unit labour costs seems to be based on the consensus
that surplus economies are the result of successful export-led strategies whereas debtled growth economies have lost competitiveness in their market for exports and, as
result, have relied on consumption fuelled by debt. It is indeed true that countries such
as Greece and Spain have experienced increasing current account deficits. It is striking,
however, that this happened in spite of increases in the real value of their exports. What
led to the deterioration in these countries’ current accounts was the significant increase
in imports between 2003 and 2008 and the negative impact of the so-called “factor
income” of the current account: that is, servicing loans from and credits to foreign
investors. Further cuts to unit labour costs are unlikely to solve the latter part of the
current account deficit.
PART III
Implications for
equitable growth
7 Internal and external imbalances
The Global Wage Report is a contribution to a wider literature on the changes in the
distribution and levels of wages within and across countries, as well as on the economic
and social implications of these trends. Some stylized facts emerge from this literature.
One of the key findings is the downward trend in the labour share and the growing
inequality in personal income distribution.
7.1 Functional and personal income distribution
A smaller share for workers
In terms of functional income distribution, which concerns how national income has
been distributed between labour and capital, the present report has shown that there
is a long-term trend towards a falling share of labour compensation and a rising share
of profits in many countries. This confirms the findings of the Global Wage Report
2010/11 (2010a), which identified a declining trend in the labour share in 17 out of 24
developed economies since the 1980s, and of the OECD’s Employment Outlook 2012
(2012b) which described a similar trend in 26 out of 30 countries since 1990. This indicates that there have been discrepancies between wages and labour productivity growth
in a large number of countries.
A growing gap between top and bottom earners
The personal distribution of wages has also become more unequal. The distance between
the top 10 per cent and the bottom 10 per cent of wage earners has increased in 23 out
of 31 countries since 1995–97 (ILO, 2008a), and the proportion of those with low pay
(defined as less than two-thirds of the median wage) has also increased in 25 out of 37
countries (ILO, 2010a). Such trends towards growing inequality remain strong when
other income sources, taxation, and income transfer are considered.
7.2 Wage-based consumption is down, affecting the recovery
These internal imbalances have tended to create or exacerbate external imbalances. The
skewed distribution in favour of capital income has tended to suppress consumption
demand. In some countries, consumption kept growing mostly as a result of a phenomenal increase in household debts. Other countries have looked for solutions outside,
with export surpluses compensating for weak domestic demand. But, ultimately, relying
62
Global Wage Report 2012/13
on easy credit turned out to be unsustainable, and export-led growth strategies based
on trade surpluses were also often only possible in combination with the debt-driven
consumption in deficit countries.
These imbalances all appeared before the Great Recession. While the full impact
of the crisis on these external and internal imbalances is not yet clear, there are few
reasons for excessive optimism. Average wages have declined in developed economies
in 2008 and 2011. Cuts in labour costs in crisis countries with current account deficits
involve economic risks: unless surplus countries allow for more wage-based consumption on both domestic and imported goods, the result could be a protracted period of
economic stagnation, or even recession.
The risks of austerity and recession
As for internal imbalances, austerity policies and a prolonged period of economic
downturn are unlikely to reverse trends in the personal distribution of wages and
incomes. Although the labour share briefly bounced back at the beginning of the
crisis it began to decline again after 2009. At the same time there are indications that
the crisis may have further increased inequality. In the United States the increase in
income inequality between 2010 and 2011 was the largest on record since 1993 and
the number of “working poor” has now reached 7.2 per cent of all workers in 2011,
up from 5.7 per cent in 2007 (US Census Bureau, various years). In Europe, over
8 per cent of people with a job are at risk of poverty and can be qualified as “working poor” according to the European Commission’s Employment and Social Developments in Europe 2011 (2012c).
These developments not only have consequences on economic stability and
growth, but they also challenged the notion of social justice and undermine social
cohesion. Unequal distribution and concentration of incomes among top earners and
the owners of capital have been the cause of public dissatisfaction across the world,
increasing the risk of social unrest and social instability. In developed economies, they
have reduced the acceptance of austerity and fiscal consolidation measures. In developing countries, they have sparked a multitude of strikes and protests, especially when
food and energy price increases have simultaneously eroded the purchasing power of
wage earners at the bottom.
8 Reconnecting wages and productivity
8.1 Coordinated policy action
What should be done? Our analysis suggests that policy actions towards “rebalancing”
should be taken at both national and global levels. In doing so, a simplistic view that
countries can just “cut” their way out of the recession needs to be avoided, and more
emphasis should be placed on policies that promote a close connection between the
growth of labour productivity and the growth of workers’ compensation. The existence
of a large current-account surplus in some countries indicates that there is room to
stimulate domestic demand, notably by better linking wage and productivity increases.
Great care should be taken not to promote a “race to the bottom” in labour shares in
PART III
Reconnecting wages and productivity
63
deficit countries or throughout the Eurozone. Unrestrained pursuit of labour cost advantage in securing economic competitiveness is likely to discourage economic innovation
and upgrading which have constituted key dynamics of the market economy. Austerity
measures that are imposed from the outside, bypassing social partners, will also harm
effective labour relations. Thus, global-level policy coordination which can prevent
the “low-road” option is strongly recommended to create favourable environments for
“internal rebalancing”.
8.2 Strengthening existing institutions
“Internal rebalancing” can begin by strengthening institutions for wage determination. This report highlights that the weakening of such institutions and hence workers’
bargaining position has contributed to the deterioration in both functional and personal
income distribution. Thus, policies are needed to “rebalance” bargaining power for
economic efficiency and social stability. Given the difficulty with organizing workers,
particularly in the context of increasing labour market segmentation and rapid technological changes, more supporting and enabling environments need to be created for
collective bargaining and to enable workers to demand a fair share of economic output.
At the same time, it should be noted that these workers, particularly low-paid workers,
have shouldered a greater burden of the widening inequality and need more protection
when it comes to wage determination. Minimum wages, if properly designed, have
proved an effective policy tool which can provide a decent wage floor and thus secure
a minimum living standard for these workers and their families. As the latest World
Development Report 2013: Jobs (World Bank, 2012) has shown, the potential negative
impacts of collective bargaining arrangements and minimum wages on employment
and other labour market outcomes have been rather over-stated in the past, while some
care needs to be taken in designing them to improve their effectiveness.
8.3 Beyond labour markets
Financial regulation
The findings of our report make it clear that it will not be enough to “rebalance” income
redistribution solely through labour market policies. As others have indicated (OECD,
2011 and 2012a; IILS, 2011 and 2012), one important contributing factor to the widening
inequality is the policies that have led to unconstrained “financial globalization”. Financialization has created incentives for diverting corporations’ internal means of finance
from real investment into risky speculative financial investments aimed at generating
maximum short-run profits. Unregulated financial markets have not only exacerbated
inequality but also tended to produce suboptimal and unstable economic outcomes.
Therefore, “rebalancing” requires better regulation of the financial sector and restoring
their role in channelling resources into productive and sustainable investments.
Taxation and social security
There are other critical dimensions of “rebalancing” which deserve a more detailed
analysis. Taxation, the subject of intense debates, is one of them. In various countries,
64
Global Wage Report 2012/13
the current taxation scheme tends to be relatively generous to capital incomes when
compared to labour incomes, which increases pressure on both labour costs to employers and the take-home pay of workers. Another important area which deserves emphasis
is social security and income policies. Our analysis of the labour income share indicates
that changes in social security system have impacts not just on income redistribution
but also on the primary income distribution such as the labour share. The latter can take
place in various channels, including by weakening workers’ bargaining position through
reducing their fall-back position (e.g. unemployment benefits) or what economists call
“reservation wages”. Therefore, adequate social security benefits can contribute to
creating more favorable institutional environments for effective wage bargaining and to
secure basic income for workers in need. At the same time, it is essential that a balance is
found between the costs and benefits of social security systems for society and different
groups of financers and beneficiaries.
8.4 Specificities of developing countries
The above policies apply to both developed and developing countries. The latter group
of countries however faces some specific challenges.
Reaching other earners
First, it must be recognized that only about half of all workers in developing and emerging countries are wage earners – most of the others are self-employed or family helpers.
This does not mean that minimum wages and collective bargaining are irrelevant. This
report has shown that in a sample of 32 developing countries taken at different points in
time in the period 1997–2006 no less than 64 million wage workers were earning less
than PPP$2 per day. Minimum wages and collective bargaining can be ways for these
workers and their families to achieve higher living standards. But additional measures
are needed to create more wage jobs and to raise the productivity and earnings of those
in self-employment. Employment guarantee schemes that pay minimum wages are also
ways to create incentives for private firms to comply with the minimum wage in order
not to lose their workforce.
Improving labour productivity
Additionally, wages are generally much lower in developing and emerging countries,
with average wages – even though increasing faster than in developed economies –
typically ranging from anywhere between PPP$150 and PPP$1,000 per month. In
this context, raising average labour productivity remains a key challenge which must
involve efforts to raise the level of education and the capabilities that are required for
productive transformation and economic development, combined with a policy environment that is conducive to growth and job creation.
Implementing social protection schemes
Finally, a key challenge for developing and emerging economies is the development of
well-designed social protection systems. These will allow workers and their families to
PART III
Reconnecting wages and productivity
65
invest in the education of their children, to reduce the amounts of precautionary savings
and to develop middle-class consumption patterns. The ILO has shown that effective
social protection floors are not beyond what countries can afford, whatever their level
of economic development (ILO, 2010e).
Appendix I
Global wage trends: Methodological issues
The methodology used to estimate global and regional wage trends was developed by
the ILO’s Conditions of Work and Employment Programme (TRAVAIL) for the previous Global Wage Report (2010) in collaboration with the Department of Statistics,
following proposals formulated by an ILO consultant and three peer reviews made
by four independent experts.34 This appendix describes the methodology adopted as a
result of this process.
Concepts and definitions
According to the international classification of status in employment (ICSE-93),
“employees” are workers who hold “paid employment jobs”, i.e. jobs in which the
basic remuneration is not directly dependent on the revenue of the employer. Employees include regular employees, workers in short-term employment, casual workers,
outworkers, seasonal workers and other categories of workers holding paid employment jobs.35
The word “wage” refers to total gross remuneration, including regular bonuses
received by employees during a specified period of time for time worked as well as time
not worked, such as paid annual leave and paid sick leave. Essentially, it corresponds
to the concept of “total cash remuneration”, which is the major component of income
related to paid employment.36 It excludes employers’ social security contributions.
“Wages”, in the present context, refer to real average monthly wages of employees. Wherever possible, we collected data that refer to all employees (rather than to
a subset, such as employees in manufacturing or full-time employees).37 To adjust
for the influence of price changes over different time periods, wages are measured in
real terms, i.e. the nominal wage data are adjusted for consumer price inflation in the
respective country.38 Real wage growth refers to the year-on-year change in real average monthly wages of all employees.
Census approach
The methodology used for the global and regional estimates is a census method with
non-response. In the census approach, the objective is to find wage data for all countries and to develop an explicit treatment in the case of total non-response (see “Treatment of total non-response”, below). We have tried to collect wage data for a total of
177 countries and territories, grouped into six separate regions.39
68
Global Wage Report 2012/13
Table A1 Regional groups
Regions
Countries and territories (with abbreviations in parentheses)
Developed economies
Australia (AUS), Austria (AUT), Belgium (BEL), Bulgaria (BUL), Canada (CAN), Cyprus (CYP), Czech
Republic (CZR), Denmark (DNK), Estonia (EST), Finland (FIN), France (FRA), Germany (DEU),
Greece (GRE), Hungary (HUN), Iceland (ICE), Ireland (IRE), Israel (ISR), Italy (ITA), Japan (JAP),
Latvia (LAT), Lithuania (LIT), Luxembourg (LUX), Malta (MTA), Netherlands (NET), New Zealand
(NZ), Norway (NOR), Poland (POL), Portugal (POR), Romania (ROM), Slovakia (SVK), Slovenia
(SVE), Spain (ESP), Sweden (SWE), Switzerland (CH), United Kingdom (UK), United States (USA)
Eastern Europe and
Central Asia
Albania (ALB), Armenia (ARM), Azerbaijan (AZB), Belarus (BLS), Bosnia and Herzegovina (BOS),
Croatia (CRO), Georgia (GEO), Kazakhstan (KAZ), Kyrgyzstan Republic (KYR), Republic of Moldova
(MOL), Russian Federation (RUS), Serbia (SBA), Tajikistan (TAJ), The Former Yugoslav Republic of
Macedonia (FYR), Turkey (TKY), Turkmenistan (TUR), Ukraine (UKR), Uzbekistan (UZB)
Asia
Afghanistan (AFG), Bangladesh (BAN), Bhutan BHU), Brunei Darussalam (BRU), Cambodia (CDA),
China (CHI), Fiji (FIJ), Hong Kong (China) (HK), India (IND), Indonesia (ISA), Islamic Republic of
Iran (IRA), Korea (North) (NK), Republic of Korea (KOR), Lao People’s Democratic Republic (LAO),
Macau (China) (MAC), Malaysia (MYA), Republic of Maldives (MDS), Mongolia (MON), Myanmar
(MYN), Nepal (NEP), Pakistan (PAK), Papua New Guinea (PAP), Philippines (PHL), Singapore
(SNG), Solomon Islands (SOL), Sri Lanka (SRI), Thailand (THA), Timor-Leste (TL), Viet Nam (VN)
Latin America and the
Caribbean
Argentina (ARG), Bahamas (The) (BAH), Barbados (BBO), Belize (BZE), Plurinational State of
Bolivia (BOL), Brazil (BRA), Chile (CHE), Colombia (COL), Costa Rica (COS), Cuba (CUB), Dominican Republic (DOM), Ecuador (ECU), El Salvador (ELS), Guadeloupe (GDP), Guatemala (GUA),
Guyana (GUY), Haiti (HAI), Honduras (HON), Jamaica (JAM), Martinique (MAR), Mexico (MEX),
Netherlands Antilles (NAN), Nicaragua (NIC), Panama (PAN), Paraguay (PAR), Peru (PER), Puerto
Rico (PR), Suriname (SUR), Trinidad and Tobago (TT), Uruguay (URU), Bolivarian Republic of
Venezuela (VZA)
Middle East
Bahrain (BAR), Iraq (IRQ), Jordan (JOR), Kuwait (KUW), Lebanon (LEB), Oman (OMA), Qatar
(QAT), Saudi Arabia (SAU), Syrian Arab Republic (SYR), United Arab Emirates (UAE), West Bank
and Gaza (WBG), Yemen (YEM)
Africa
Algeria (ALG), Angola (ANG), Benin (BEN), Botswana (BOT), Burkina Faso (BKF), Burundi (BUR),
Cameroon (CAM), Cape Verde (CAV), Central African Republic (CAR), Chad (CHA), Comoros (COM),
Congo (CON), Côte d’Ivoire (COI), Democratic Republic of the Congo (DRC), Egypt (EGY), Equatorial Guinea (EQG), Eritrea (ERI), Ethiopia (ETH), Gabon (GAB), Gambia (GAM), Ghana (GHA),
Guinea (GUI), Guinea-Bissau (GUB), Kenya (KEN), Lesotho (LES), Liberia (LIB), Libya (LBY),
Madagascar (MAD), Malawi (MAW), Mali (MAL), Mauritania (MAI), Mauritius (MUS), Morocco
(MOR), Mozambique (MOZ), Namibia (NAM), Niger (NIG), Nigeria (NIR), Reunion (REU), Rwanda
(RWA), Senegal (SEN), Sierra Leone (SL), Somalia (SOM), South Africa (SA), Sudan (SUD), Swaziland (SWA), United Republic of Tanzania (TAN), Togo (TOG), Tunisia (TUN), Uganda (UGA), Zambia
(ZAM), Zimbabwe (ZIM)
To enable easier comparison with regional employment trends, our regional
groupings are now compatible with those used in the ILO’s Global Employment Trends
(GET) model (see table A1). However, we have collapsed several GET regions into
a single region for Asia and the Pacific (which includes the GET regions East Asia,
South-East Asia and the Pacific, and South Asia) and also for Africa (which comprises
North Africa and sub-Saharan Africa). Note that the Republic of Korea and Singapore
are now grouped with Asia (and no longer with the advanced countries) and that all 27
member countries of the EU are included under “developed economies”. Further, the
Appendix I
Methodological issues
69
division between “Central and Eastern Europe” and “Eastern Europe and Central Asia”
is no longer maintained, with all former transition countries (apart from members of the
EU) and Turkey included in a single grouping, “Eastern Europe and Central Asia”. For
these regions, the regrouping means that regional wage trends published in the current
Global Wage Report cannot be directly compared to figures in the previous edition.
There have been no changes to the regions Latin America and the Caribbean, or the
Middle East. However, some data revisions by national statistical offices mean that
regional wage trends have been updated since publication of the last edition. Overall,
we succeeded in obtaining wage data from 124 countries and territories, with regional
coverage indicated in table A2. We have data from all developed economies and all
countries in Eastern Europe and Central Asia. In other regions, although repeated
attempts were made to obtain wage figures from national statistical offices and/or international repositories, in some instances wage data were not available. The coverage for
the remaining regions ranges from 41.2 per cent (Africa) to 75.0 per cent (Middle East).
However, since the database includes wage data for the largest and more prosperous
countries, the coverage in terms of employees and the total wage bill is higher than the
simple count of countries would suggest. In total, our database contains information
for 94.3 per cent of the world’s employees who together account for approximately
97.7 per cent of the world’s wage bill.
Table A2 Coverage of the Global Wage Database, 2010 (%)
Regional group
Country coverage
Employee coverage
Approximate coverage
of total wages
Africa
41.2
59.5
79.3
Asia
69.0
98.3
99.3
Eastern Europe and Central Asia
100.0
100.0
100.0
Developed economies
100.0
100.0
100.0
Latin America and the Caribbean
64.5
85.3
83.9
Middle East
75.0
76.4
91.3
World
70.1
94.3
97.7
Note: Country coverage refers to the number of countries for which we found wage data as a percentage of all the countries in the region, while employee coverage refers to the number of employees in countries with data available as a percentage of all employees in the region (as of 2010). The approximate coverage
of total wages is estimated based on the assumption that wage levels vary across countries in line with labour productivity (i.e. GDP per person employed, as
of 2010), expressed in 2005 PPP$.
Treatment of item non-response
In some countries for which we found data, the statistical series were incomplete, in the
sense that data for some years were missing. Table A3 provides coverage information
for each year from 2006 to 2011. As expected, the coverage of the database becomes
lower for the most recent years since some statistical offices are still processing these
data (most notably China, where wage data for 2011 are not yet available). As a consequence, for 2011 we have real observations for only about 74.5 per cent of the world’s
total wages, compared to 94.3 per cent in 2010.
70
Global Wage Report 2012/13
While the coverage in the most recent year is good in the developed economies
and in Eastern Europe and Central Asia, we have too few real observations for the
Middle East in 2010 and 2011 to make a reliable estimate, and therefore the most recent
wages trends for the Middle East are likely to change. We also flag regional growth
rates as “provisional estimates” when they are based on coverage of c. 75 per cent and
as “tentative estimates” when the underlying coverage of our database is between 40
and 74 per cent to draw attention to fact that they might be revised once more data
become available.
Table A3 Coverage of the Global Wage Database, 2006–11 (%)
Regional group
2006
2007
Africa
79.6
78.1
65.2**
64.8**
64.9**
43.2**
Asia
95.8
96.0
96.2
96.4
96.5
(38.1)
Eastern Europe and Central Asia
98.4
99.0
98.9
98.7
98.6
97.2
100.0
99.2
100.0
99.2
99.4
86.7
Latin America and the Caribbean
84.9
84.7
84.4
84.0
82.6
79.0
Middle East
91.7
91.9
91.7
68.0**
(22.4)
(12.0)
World
97.4
96.8
96.9
95.6
94.3
74.5*
Developed economies
2008
2009
2010
2011
Notes:
* Growth rates published as “provisional estimates” (based on coverage of c. 75 %).
** Growth rates published as “tentative estimates” (based on coverage of c. 40– c. 74%).
() Growth rates published but likely to change (based on coverage of less than 40%).
See text for estimation of coverage. A country is counted as covered only when a real observation is available, either from the preferred series or from a secondary series.
To address this kind of item non-response (i.e. gaps in the data for countries
covered) we used a “model-based framework” to predict missing values.40 This is necessary in order to hold the set of responding countries constant over time and so avoid the
undesired effects associated with an unstable sample. Depending on the nature of the
missing data points, we used several complementary approaches that are described in
detail in Technical Appendix I of the 2010/11 edition of the Global Wage Report.
Treatment of total non-response
Response weights
To adjust for total non-response (when no time-series wage data are available for a
given country) a “design-based framework” was used in which non-response was
considered as a sampling problem. Because non-responding countries may have wage
characteristics that differ from those of responding countries, non-response may introduce a bias into the final estimates. A standard approach to reduce the adverse effect of
non-response is to calculate the propensity of response of different countries and then
weight the data from responding countries by the inverse of their response propensity.41
This implies that no imputations are made for non-responding countries.
Appendix I
Methodological issues
71
In this framework, each country responds with a probability ϕj and it is assumed
that countries respond independently of each other (Poisson sampling design). With the
probabilities of response, ϕj, it is then possible to estimate the total, Y, of any variable
yj:
(1)
by the estimator:
(2)
where U is the population and R is the set of respondents. This estimator is unbiased if
the assumptions are true (see Tillé, 2001). In our case, U is the universe of all countries
and territories listed in table A1 and R are those “responding” countries for which we
could find time-series wage data.
The difficulty is, however, that the response propensity of country j, ϕj, is generally not known and must itself be estimated. Many methods of estimation of the
response propensity are available from the literature (see e.g. Tillé, 2001). In our case,
the response propensity was estimated by relating the response or non-response of
a given country to its number of employees and its labour productivity (or GDP per
person employed in 2005 PPP$). This is based on the observation that wage statistics
are more readily available for richer and larger countries than for poorer and smaller
countries. We choose the number of employees and labour productivity since these
variables are also used for calibration and size weighting (see below).42
For this purpose, we estimated a logistic regression with fixed effects as follows:
prob(response) = Λ(αh + β1xj2010 + β2nj2010)
(3)
where xj2010 is ln(GDP per person employed in 2005 PPP$) of country j in the year 2010,
nj2010 is ln(number of employees) in 2010, and Λ denotes the logistic cumulative distribution function (CDF).43 The fixed effects, αh, are dummies for each of the regions with
incomplete data (Asia and the Pacific, Latin America and the Caribbean, Middle East,
Africa), while the two remaining regions with complete data form the omitted benchmark category. The logistic regression had a universe of N = 177 cases and produced a
pseudo R² = 0.380. The estimated parameters were then used to calculate the propensity
of response of country j, ϕj.
The response weight for country j, φj, is then given by the inverse of a country’s
response propensity:
(4)
Calibration factors
The final adjustment process, generally called calibration (see Särndal and Deville,
1992), is designed to ensure consistency of the estimate with known aggregates. This
procedure ensures appropriate representation of the different regions in the final global
estimate. In the present context, a single variable “number of employees”, n, in a given
72
Global Wage Report 2012/13
year t was considered for calibration. In this simple case, the calibration factors, are
given by γjt:
(5)
where h represents the region to which country j belongs, nht is the known number of
employees in that region in year t, and n^ht is an estimate of total number of employees
in the region and the same year that was obtained as a sum product of the uncalibrated
weights and the employment data from the responding countries within each region.44
The resulting calibration factors for the year 2010 were 1.00 (Developed economies;
Eastern Europe and Central Asia), 0.975 (Asia and the Pacific), 1.045 (Latin America and the Caribbean), 1.042 (Africa) and 1.086 (Middle East). Since all calibration
factors are either equal to or very close to 1, these results show that estimates n^ht were
already very close to the known number of employees, nht, in each region. Note that the
calibration process was repeated for each year so that the weight of each region in the
global estimate changes over time in proportion to its approximate share in the global
wage bill.
Calibrated response weights
The calibrated response weights, φ'jt, are then obtained by multiplying the initial
response weight with the calibration factor:
φ’jt = φj × γjt
(6)
The regional estimate of the number of employees based on the calibrated response
weights is equal to the known total number of employees in that region in a given year.
Thus, the calibrated response weights adjust for differences in non-response between
regions. The calibrated response weights are equal to 1 in the regions where wage data
were available for all countries (Developed economies; Eastern Europe and Central
Asia). They are larger than 1 for small countries and countries with lower labour
productivity since these are underrepresented among responding countries.
Estimating global and regional trends
One intuitive way to think of a global (or regional) wage trend is in terms of the evolution
of the world’s (or a region’s) average wage. This would be in line with the concept used
for other well-known estimates, such as regional GDP per capita growth (published by
the World Bank) or the change in labour productivity (or GDP per person employed).
The global average wage, ȳ, at the point in time t can be obtained by dividing the
sum of the national wage bills by the global number of employees:
(7)
where njt is the number of employees in country j and ȳjt is the corresponding average
wage of employees in country j, both at time t.The same operation can be repeated for
the subsequent time period t+1 to obtain ȳ*t+1, using the deflated wages ȳ*t+1 and the
Appendix I
Methodological issues
73
number of employees nt+1, where * refers to real wages. It is then straightforward to
calculate the growth rate of the global average wage, r.
However, while this is a conceptually appealing way to estimate the global wage
trends, it involves some difficulties that we cannot at present overcome. In particular,
aggregating national wages, as done in equation (7), requires them to be converted into
a common currency, such as PPP$. This conversion would make the estimates sensitive to revisions in PPP conversion factors. It would also require that national wage
statistics be harmonized to a single concept of wages in order to make the level strictly
comparable.45
More importantly, the change in the global average wage would also be influenced by composition effects that occur when the share of employees shifts between
countries. For instance, if the number of paid employees fell in a country with high
wages but expanded (or stayed constant) in a country of similar size with low wages,
this would result in a fall of the global average wage (while wage levels remained
constant in all countries). This effect makes changes in the global average wage difficult to interpret, as one would have to differentiate which part was due to changes in
national average wages and which part was due to composition effects.
We therefore gave preference to an alternative specification to calculate global
wage trends that maintains the intuitive appeal of the concept presented above but
avoids its practical challenges. To ease interpretation, we also want to exclude effects
that are due to changes in the composition of the world’s employee population. We
therefore avoid the danger of producing a statistical artefact of falling global average
wages that could be caused by a shift in employment to low-wage countries (even when
wages within countries are actually growing).
When the number of employees in each country is held constant, the global wage
growth rate rt can be expressed as a weighted average of the wage growth rates in the
individual countries:
rt = Σjwjt × rjt
(8)
where rjt is wage growth in country j at point in time t and the country weight, wjt, is the
share of country j in the global wage bill, as given by:
wjt = njt × ȳjt / Σjnjt × ȳjt
(9)
While we have data for the number of employees, njt, in all countries and relevant
points in time from the ILO’s Global Employment Trends Model,46 we cannot estimate
equation (9) directly since our wage data are not in a common currency. However, we
can again draw on standard economic theory, which suggests that average wages vary
roughly in line with labour productivity across countries.47 We can thus estimate ȳjt as a
fixed proportion of labour productivity, LP:
ȳ^jt = α × LPjt
(10)
where α is the average ratio of wages over labour productivity. We can therefore estimate the weight as:
74
which is equal to:
Global Wage Report 2012/13
^ jt = njt × α × LPjt / Σjnjt × α × LPjt
w
(11)
^ jt = njt × LPjt / Σjnjt × LPjt
w
(12)
^ jt for w and introducing the calibrated response weight, φ'j, into equation
Substituting w
jt
(8) gives us the final equation used to estimate global wage growth:
(13)
and for regional wage growth:
(13')
where h is the region of which country j is part. As can be seen from equations (13)
and (13′), global and regional wage growth rates are the weighted averages of the
national wage trends, where φ'j corrects for differences in response propensities
between countries.
Appendix II
How a divergence between labour productivity and wages
influences unit labour costs and the labour income share
The widening gap between productivity gains and increases in real wages in many
developed economies was highlighted by the Global Wage Report 2010/11. Labour
productivity sets the output of a production process in relation to the input used to
generate it – in this case, the labour input. It is commonly measured as either value
added per employed person or per hour worked. The hour-based measure has the
advantage that it is not influenced by changes in output that are due to variations
in working hours. However, reliable information on hours worked is not always
available, so value added per employed person is often the preferred measure (as,
for example, is the case with the Millennium Development Goals Indicator “labour
productivity”; see Luebker, 2011). Organizations such as the OECD therefore publish
both indicators (see McKenzie and Brackfield, 2008). Labour productivity is always
measured in real terms; hence the measure for value added needs to be expressed
in constant currency prices (i.e. adjusted for inflation, using the double-deflation
method where both inputs and outputs are valued in constant prices). However, since
the implicit GDP deflator might diverge from the consumer prices index (which is
used to deflate wages) it can sometimes be useful to compare nominal value added
and nominal wages.
The two concepts “wages” and “compensation of employees” are closely related.
The term “wages”, as used in the Global Wage Report, refers to total gross remuneration, including regular bonuses, received by employees during a specified period of
time for both time worked and time not worked, such as paid annual leave and paid sick
leave. Essentially, it corresponds to the concept of “total cash remuneration”, which
is the major component of income related to paid employment. It excludes employers’ social security contributions. This is the major difference from “compensation of
employees” as found in the UN System of National Accounts (2008). This is made up
of two components, namely “wages and salaries” (which corresponds to the concept
of wages in the Global Wage Report) and “employers’ social contributions” to pension
and other social security schemes. The labour income share (LS) relates compensation
of employees (CoE) to total value added (GDP). The unadjusted measure is obtained
by dividing total compensation by total value added, either at national or at sectoral
level:
(1)
76
Global Wage Report 2012/13
Alternatively, one can calculate the labour income share as compensation per worker
over value added per worker:
(1')
Readers will recognize that the denominator – GDP per worker – corresponds to labour
productivity as defined above. However, the numerator does not entirely match the
concept of average wages as it is used in the Global Wage Report. First, CoE (unlike
wages) also includes employers’ social contributions. Secondly, “average wages” refers
only to employees (and not to all workers, a term that also includes self-employed
persons). Equation (1′) above can be rewritten so that it relates average wages directly
to labour productivity:
(1'')
where α stands for CoE / wages and β for workers / employees. A common procedure
(used also in Part II of the Global Wage Report) is to adjust the labour share for the
share of employees in total employment. The adjusted labour share (LS′) can then be
written as:
(1''')
Fortunately for analysts, the coefficient α is remarkably stable over time. This holds
even for a country like Germany, which over the past 35 years has gone though substantial structural change, a reunification, and reforms designed to reduce employers’ social
contributions. Nonetheless, the coefficient of CoE over wages and salaries remained in
a narrow range between 1.21 and 1.24 from 1976 to 2011 (see Federal Statistical Office,
2012, table 1.8). This means that changes in the labour share can be attributed almost
entirely to changes in the relationship between average wages and labour productivity.
The labour share is therefore a convenient statistic to track the disconnection between
these two variables that has occurred in many countries over the past decade.
The labour share is closely linked to unit labour costs (ULC). These are commonly
defined as the average cost of labour per unit of output. Although they are frequently
used as an indicator for the competitiveness of an economy, the OECD cautions that
“ULCs should not be interpreted as a comprehensive measure of competitiveness, but
as a reflection of cost competitiveness”.48
Unit labour costs are usually expressed in nominal terms by relating nominal
labour costs to real value added:
(2)
where n and r denote nominal and real values, respectively. Real GDP is obtained by
deflating nominal GDP by a price index P. An alternative way to calculate nominal unit
labour costs is therefore to use the price index P alongside the nominal values for CoE
and GDP:
Appendix II
Influence of a divergence between labour productivity and wages
77
(2')
As can be seen from these two equations, nominal ULC can increase because nominal
compensation of employees grows faster than nominal GDP, or because prices increase.
Countries with high inflation will therefore usually see a faster increase in nominal unit
labour costs than those with low inflation. This makes it difficult to compare nominal
unit labour costs across countries that use different currencies.
The alternative is to calculate real unit labour costs, which sets the real (i.e. inflation-adjusted) cost of labour in relation to real output. In other words, both CoE and
GDP need to be deflated with a price index P:
(3)
Since the price indices cancel each other out, real unit labour costs are therefore usually
calculated on the basis of nominal values (OECD, 2008). This also avoids the spurious
results that that can arise when the consumer price index (CPI) is used to deflate labour
cost, but the producer price index (PPI) for GDP (see Fleck, Glaser and Sprague, 2011).
For presentational purposes, unit labour costs are often expressed as an index that takes
the value of 100 in a base year (e.g. 2005).
As it turns out, equation 3 for real unit labour costs is exactly the same as equation
(1) for the labour income share. This is no coincidence, and in fact the terms “labour
income share” and “real unit labour costs” are often used as synonyms (see McKenzie and Brackfield, 2008). What this implies is that policies to reduce real unit labour
costs will in effect delink wages from productivity and reduce the labour income share
(thereby increasing the capital income share).
Nominal unit labour costs can of course also fall as a result of a decline in the price
index P. However, few policy-makers will aim for outright deflation – a phenomenon
that made the Great Depression of the 1930s much worse and increases the real value
of existing debts. When prices continue to rise, reducing nominal unit labour costs will
therefore require an even sharper decline in the wage share than merely reducing real
unit labour costs.
While a reduction in labour costs appears popular among some economic
commentators, it is much less clear whether the implications for the functional income
distribution have been thought though – and it remains unclear why increasing profits
at the expense of wages should be good economic policy (the question addressed in
Part II of the Global Wage Report).
Appendix III
Determinants of labour shares
Box A1 Data selection and estimation procedure:
An econometric methodology
The methodology employed in the estimation procedure to determine the effects of different variables on labour shares is based on a causal framework that requires four basic steps. The dependent
variable (labour income share) and independent variables (internal and external factors) are constructed by combining datasets (Step 1), carefully considering problems of misreporting and endogeneity (Step 2). The determinants of labour income shares are grouped according to the factors in
figure 37 (Step 3) and the combination of the determinants (Step 4) underlines the specifications,
leading to the estimates in tables A4 and A5.
Step 1: The following information sources were combined to construct the dependent variable and
set of independent variables:
•
Dependent variable: ILO/ILLS database for the construction of the main indicator on wage
shares as proxy for labour income shares.
•
Deterministic factors: AMECO database, OECD database, Chinese National Accounts, UNIDO
Industrial Index, World Bank World Development Indicators (WB-WDI), PENN World Tables,
EU-KLEMS database.
•
Complementary data were also drawn direction from the studies of Aleksynska and Schindler
(2011), Bassanini and Duval (2006) and Lane and Milesi-Ferretti (2007).
Treatment and nature of the data: The dependent variable and the determinants are estimated on an
annual basis for the period 1970–2007 for 71 economies.
Step 2: The dependent variable is total wage share, which equals total wage bill divided by national
income. It is constructed allowing for two adjustments:
•
•
Adjustment 1 (control for mis-reporting): Income data from the self-employed includes salaries
and profits. To avoid overestimating the contribution from the self-employed (by excluding profits),
the total wage bill is estimated as the sum of wages from “salaried employees” augmented by an
element corresponding to the share of the self-employed in the workforce.Thus, employees act as
counterfactuals to what would have been the salaries of the self-employed had they been wage
workers (Gollin, 2002).
Adjustment 2 (controlling endogeneity): The total wage bill includes the wages from the public
sector closely related to the measure of government consumption (GC). The variable GC is included
in the right-hand side of the causal relation to pick up the effect on changes in “total wage share”.
Thus, the adjusted measure of total wage share has to be further adjusted by subtracting GC from the
total wage bill: the second adjustment makes GC (in the right-hand side) exogenous to total wage
share (in the left-hand side).
80
Global Wage Report 2012/13
Box A1 Data selection and estimation procedure (continued)
Apply adjustment 1 and adjustment 2: The final dependent variable is the private sector total wage
bill, adjusted for the self-employed, as percentage of national income.
Step 3:The estimating procedure considers five sets of independent factors as key determinants
of labour income share:
•
Real GDP growth is included to control for cyclic and structural changes and might effects the
secular trend of the share of functional income. Real GDP growth captures within country heterogeneity that varies derministically over time.
•
Technological progress: industrial share of GDP, agro-fishery share of GDP, average labour productivity and – for developed economies – capital–labour share and ICT–capital shares. In terms of
capital–labour share, the measure is used exclusively for advanced economies where the use of
average labour productivity does not help capture technological progress due to the homogeneity
of average labour productivity between economies and over time. Thus, in the estimates capital–
labour share (for advanced economies only) is measured as the value of the total capital services
as a ratio of the total number of employees in that sector: it is therefore a measure of average labour
productivity with exclusive reference to capital.
•
Financialization (global financialization): constructed as total external assets plus external liabilities of an economy as share of GDP. This is the standard method followed in the literature to
measure the importance of the financial sector for an economy (see European Commission,2007;
Rodrick, 1997; Stockhammer, forthcoming).
•
Globalization: trade openness (total exports and imports as share of GDP) and terms of trade (unit
value of exports to unit value of imports).
•
Government consumption as share of GDP (as proxy for the welfare state).
•
Labour market institutions: union density, a minimum wage index, unemployment benefits indicators
(replacement rates and coverage), advance notice period for unemployment, severance payments
and controls for supply-side effects (labour force and population).
Step 4: The model assumes a static causal relationship between the variables. Estimates are constructed by pooling the data available from an unbalanced panel (71 countries, with at most 37
years of observations from each country) while controlling for individual fixed effects. Accordingly,
the model can be expressed as follows:
WSAPit = F[FINit, GLOBit, TECHit, WFSTit, LMIit; eit]
i; country among n countries
t; time period of observation
e; stochastic shocks
Including or excluding particular sets of variables allows for two distinct sets of specifications:
•
Baseline specification: ignores labour market institutional variables (LMI) to enable a better
understanding of the joint effects of globalization and the bargaining power of employees
(table A4)
•
Augmented baseline specification: allows each of the five variables identified as labour market
indicators in Step 3 to enter the baseline specification, leading to new set of estimates
(table A5).
Appendix III
Determinants of labour shares
81
Results and interpretation
Table A4 shows estimates for the baseline specification for three groups of countries:
all economies (71 economies), industrialized economies (28 OECD economies) and
developing economies (9 economies). This distinction is important from both conceptual and practical points of view. High-income OECD economies have more homogeneous labour markets and industrial structures, and have better-quality data over a
longer time-span. These conditions allow us to work on an extended model with all of
the potential factors without much risk of statistical errors or unreliability (e.g. statistical “noise”). Thus, a full model specification is used for industrialized economies.
The impact of globalization is captured by the variables “trade openness” and “terms
of trade”, where the former measures the exposure to the global market and the latter
measures the relative competitiveness of a country in international trade. The impact of
“financial globalization” is captured by the sum of external assets and external liabilities in GDP (from Lane and Milesi-Ferretti, 2007). Both government consumption and
union density are also included.
However, such an approach is not feasible for developing economies, largely
because of the limitations on available data, particularly relating to union density. A
different model specification is thus used, including some new variables – share of the
industrial sector, share of the agro-forestry and labour productivity – to control for the
effects of technological progress and structural change. When all 71 countries are taken
together in the regression, the country variations between developed and developing
economies are such that industry share, agro-forestry share and labour productivity are
considered sufficient to capture the impacts of technology and structural change on the
labour income share. However, in the case of developed economies these three variables are too homogeneous and do not identify the heterogeneity in technological gaps
between countries in this group. Instead, the variables capital–labour ratio and capital–
service ratio are used to capture such gaps when estimating the baseline specification
for the 28 OECD high-income countries. Finally, real economic growth is included
to control for the short-run business cycle adjustment on wage setting behaviour; the
negative sign is consistent with the finding that wages are countercyclical.
All estimates shown in table A4 can be read in terms of the magnitude of the impact
(the value of the coefficients) and the direction of the impact (the sign). The estimates
confirm the role of technology and globalization in international trade and financial
markets in reducing the labour income share in both developed and developing economies. Interestingly, the impact is similar in magnitude irrespective of country grouping.
Positive changes in government consumption increase the labour income share in both
developed and developing economies. However, the impact is smaller in magnitude
when the estimates cover all 71 economies, potentially pointing to the relative variability of government consumption between developed and developing countries as determinant of labour income shares.49 Likewise, the coefficient for union density (for OECD
economies) indicates the positive effect of bargaining power on labour income shares.50
Using the estimates based on the 71 countries together, we see that both increasing
levels of industrialization and increases in the capital–labour ratio (both measures of capital augmentation through technological progress) have an adverse effect on labour income
shares, as expected and consistently with the findings of previous studies on the topic
82
Global Wage Report 2012/13
(IMF, 2007; Kumhof and Rainciere, 2011; IMF 2010; OECD, 2012b).51 Nevertheless, in
the case of developing economies the coefficients for industrialization and labour productivity imply a positive relationship between technological progress and labour income
shares. This could be an indicator of the catching-up effect that some of these economies
have experienced – at least up to 2007 – as explained in the IMF report on the globalization of labour (IMF, 2007). During the period of catching up, when economies are shifting
their emphasis from agricultural to industrial sectors, the resulting tightening of the labour
market may push wages up, as labour productivity increases and technology is upgraded.
Similar findings have recently been confirmed by other studies (e.g. OECD, 2012b).
The baseline specification can be further augmented to include indicators for labour
market institutions (LMIs), i.e. those variables that (in addition to union density) are
directly indicative of the strength of the bargaining process in determining the share of
income that goes to labour. Table A5 shows the result of running various specifications
where each LMI has been added as an additional factor to the baseline specification
explained and tabulated in table A4. The reason for adding each of the LMI indicators
separately is twofold. First, given the positive impact of unionization density on labour
wage shares, adding independent indicators that are likely to be the cause of unionization allows better understanding of the possible transition mechanisms between unionization (bargaining power) and the labour share of income. Secondly, the LMIs are
likely to be highly correlated, so that adding each separately avoids multicollinearity
problems in identification of the estimated parameters.
The estimates are based on all 71 economies in the sample. In practice the estimates show that no single variable on its own is causal to change in the labour income
share: that is, the variability within each variable between countries means that we
cannot detect significance for any one of the LMIs. It must be pointed out that even
when the substantive legal provisions remain unchanged (e.g. the level of minimum
wages and unemployment benefits), it is still possible for their effectiveness to be
reduced as more workers are excluded from their coverage. De facto deregulation has
taken place in many countries with a growing number of non-standard workers and the
further segmentation of the labour market; this might explain the finding of no significance for LMI variables in table A5. It is important to point out that the LMI variables
employed in the present analysis are not new and have been widely used in empirical
studies (IMF, 2007; European Commission, 2007; OECD, 2012b);52 as in this report,
the estimates in similar studies are not statistically significant.
In table A4 unionization density had a positive impact on the labour share of
income; the lack of unionization in developing economies implies that we cannot identify this variable in the specifications proposed in table A5. In order to understand
whether the results in table A5 are the result of poor data quality in developing economies, an alternative specification was run based only on the 28 OECD high-income
economies, using all seven LMI variables simultaneously and adding the variable
“union density”. The resulting coefficient did not change the argument: the five variables that control for strength of LMIs were not significant and only “union density”
had a positive and significant effect on the determination of the labour share of income.
Therefore, it is clear that it is unionization – and not the outcomes that result from
unionization – that provides a cushion for falling labour income shares in the presence
of globalization and financialization.
Appendix III
Determinants of labour shares
83
Finally, other specifications were tried adding variables that control for possible
structural changes such as unemployment rate, the volatility of exchange rates and
financial reforms.53 Increases in unemployment were found to have strong negative
impacts on the labour share, which should not come as a surprise given the downward
pressure on wages and the weakening of workers’ bargaining position in the presence
of higher rates of unemployment. Likewise, an increase in the riskiness of international
trade (as expressed by volatility in exchange rate) may reduce the labour share: this
finding is consistent with some earlier studies (e.g. Jayadev, 2007; IILS, 2011). Finally,
financial liberalization has the effect of tilting the functional income distribution from
labour to capital. When the credit control index developed by Abiad et al. – which
measures liberalization in credit control – is included in the model, the effect is to
reduce the labour share (Abiad, Detragiache and Tressel, 2008), a finding that is consistent with the predictions of Obstfeld and Rogoff (Obstfeld and Rogoff, 2009). Similar impacts (albeit of varying significance) are found when the baseline specification
includes other indices of financial reform such as credit controls, interest rate controls,
entry barriers, privatization, international capital flows and security markets.
Table A4 The factors influencing the adjusted labour income shares
Dependent variable: Adjusted labour income shares
All economies
(28 OECD, 3 non-OECD
high-income, 27 emerging,
13 developing)
Factors
Real GDP growth
Industrialized economies
(28 OECD)
Developing economies
(9)
-11.2** (2.97)
-16.4** (3.2)
-26.6** (13.0)
Financial globalization (1)
-3.1** (0.59)
-2.4** (0.7)
-5.0 (3.6)
Trade openness
-6.2** (1.40)
-5.9** (1.8)
-5.9** (6.8)
Terms of trade
Government consumption
(% of GDP)
Industrial sector (% of GDP)
-4.2** (1.30)
-4.5** (1.8)
••
0.4** (0.19)
0.9** (0.2)
0.8** (0.4)
-0.3** (0.07)
••
0.6** (0.2)
Agro-forestry sector (% of GDP)
-0.1 (0.10)
••
-0.07 (0.2)
Average labour productivity
-2.4 (2.08)
••
23.7** (9.4)
(1)
Union density
0.1* (0.06)
Capital–labour ratio (1)
-7.0* (3.7)
Capital services (% of GDP) (1)
1.4 (0.9)
Diagnostics
Number of observations
1,450
470
101
Adjusted R-square
0.98
0.94
0.99
Durbin–Watson D-statistic
1.72
1.81
2.04
Note: All models employ a fixed effect estimation procedure on the pool panel data. Financial globalization measures external assets plus external liabilities
divided by GDP; trade openness measures exports plus imports divided by GDP; terms of trade measures export unit value relative to import unit value; average
labour productivity measures PPP-converted GDP per worker at constant prices; government consumption is expressed as % of GDP; industrial sector measures
all industrial sectors’ added values as percentage of GDP; agro-forestry sector as % of GDP includes the value added by forestry, hunting, fishing, crop cultivation
and livestock production; union density measures the proportion of the working population unionized; capital–labour ratio measures total capital services divided
by the number of workers; capital services measures information communication and technology investment divided by gross value added.
(1)
These variables enter in logarithmic form. ** Indicates significance at the 5% level; * indicates significance at 10% level. Bracketed numbers are standard errors.
Source: ILO estimates (Stockhammer, forthcoming).
84
Global Wage Report 2012/13
Table A5 The impact of external factors on adjusted labour income shares
Dependent variable: Adjusted labour income shares
Baseline specification
augmented by each of the
following labour market
indicators (LMI)
All economies
(28 OECD, 3
non-OECD highincome, 27
emerging, 13
developing)
No. of
observations
No. of variables
Adjusted
R-square
Durbin–Watson
D-statistic
Minimum wage index
-0.5 (1.7)
718
8
0.97
1.7
Unemployment benefits,
replacement rates
-2.5 (1.9)
1,007
8
0.98
1.7
0.5 (0.8)
878
8
0.98
1.7
-1.2 (0.8)
1,026
8
0.98
1.7
Severance pay after 4 years
of service
0.1 (0.4)
1,026
8
0.98
1.7
Size of the labour force (1)
5.0 (3.7)
1,242
8
0.98
1.7
-9.7 (6.5)
1,450
8
0.98
1.7
Unemployment benefits, coverage
Advance notice period
after 4 years of service
Size of the population (1)
Note: All models employ a fixed effect estimation procedure on the pool unbalanced panel data with information from 1970 to 2007. The minimum wage index
measures the ratio between the minimum wage and the mean wage (Kaitz Index).
(1)
These variables enter in logarithmic form. ** Indicates significance at the 5% level; * indicates significance at 10% level. Bracketed numbers are standard errors.
Source: ILO estimates (Stockhammer, forthcoming).
Table A6 Description of countries included in the estimation of tables A4 and A5 and box A1
Groups
Individual countries
High-income OECD
members (28 countries)
Criteria: US$12,276 or more income per capita and OECD members
Australia, Austria, Belgium, Canada, Czech Republic, Denmark, Estonia, Finland, France,
Germany, Greece, Hungary, Iceland, Ireland, Italy, Japan, Luxembourg, Netherlands, New
Zealand, Norway, Poland, Portugal, Slovakia, Spain, Sweden, Switzerland, United Kingdom,
United States
Non-OECD high-income (31
countries)
Criteria: US$12,276 or more income per capita
High-income OECD members listed above (28) and Hong Kong, Kuwait and Oman
Upper–middle-income (27
countries)
Criteria: US$3,976–12,275 income per capita
Algeria, Argentina, Azerbaijan, Belarus, Botswana, Brazil, Bulgaria, Chile, China, Colombia, Costa
Rica, Iran, Jordan, Latvia, Lithuania, Mauritius, Mexico, Namibia, Panama, Peru, Russia, South
Africa, South Korea, Thailand, Tunisia, Turkey, Venezuela
Lower–middle-income
(9 countries)
Criteria: US$1,006–3,975 income per capita
Armenia, Côte d’Ivoire, Egypt, India, Moldova, Mongolia, Nigeria, Philippines, Sri Lanka
Low-income
(4 countries)
Criteria: US$1,005 or below income per capita
Kenya, Kyrgyzstan, Niger, Tanzania
Source: ILO estimates (Stockhammer, forthcoming).
Appendix III
Determinants of labour shares
85
Explaining the decomposition of labour income shares in figure 38
1. Assume a particular specification that links a set of covariates to the wage share
(WS) observed for 71 economies (i) for the years 1970 to 2007. These variables are GDP growth, R, technology, TH, globalization, G, financialization, F,
government consumption, GC, and unionization, U:
wsit = β1Rit + β2Git + β3Fit + β4THit + β5GCit + β6Uit + residualit + fi
where
i; country, t = time, fi : fixed effects
(1)
2. Run the model to get the coefficients in expression (1). This is done allowing
for all observations to enter as if we had a cross section. Once the model is estimated we can interpret expression (1) as follows in expression (2):
Following table A1:
Developed:
wsit = −16.4 × Rit −(5.9 × OPENit + 4.5 × TOT) − 2.4 × Fit − 7.0 × THit + 0.9 × GCit + 0.1 × Uit + êit
Developing:
where
OPEN: trade openness, TOT: terms of trade
(2)
wsit = −26.6 × Rit − 5.9 × TOT − 5.0 × Fit + (0.6 × INDit + 23.7 × LPit − 0.7 × AGit) + 0.8 × GCit + eit
where
IND: industrial sector, LP: labour productivity,
AG: agricultural production
3. The decomposition as shown in figure 38 is based on specifications and coefficients in expression (2). Let’s take ‘developed economies’ as example:
1. Select two periods over time: 1990–94 and 2000–04.
2. For each period estimate the average of each variable (G, F, TH, C and
U) as if the average between countries emulates some ‘hypothetical’
country. The variable ‘real GPD growth’ has not changed over the two
selected periods so that its contribution to the final decomposition is
neglible (can be ignored).
3. Each of the averages is weighted by the corresponding (estimated) coefficient as given in expression (2). For example, F is measured as the
logarithm of the sum of external assets and external liabilities: let’s say
the average of F for all economies and for the period 1990–94 gives a
total of 0.04 whereas for the period 2000–04 the average is 1.5. Then,
each of these numbers is weighted by the same coefficient value of -2.4.
86
Global Wage Report 2012/13
4. Taking differences between the two weighted values – i.e., (1.5)(-2.4)(0.06)(-2.4) = -3.3 – shows the contribution of the variable ‘financialization’ (or global financialization) in figure 38.
5. Doing the same for each of the variables and adding the total provides
the “predicted” difference between periods for the wage share. This
equals (approximately) -7.1, i.e., between the periods 1990–94 and
2000–04 the wage share has decreased by 7.1 per cent. The same applies
to developing economies in the second set of bars for figure 38: in this
case the average change in WS for the ‘hypothetical’ economy in the
developing world is -2 per cent.
Appendix IV
The effect of labour share on aggregate demand
Box A2 Data, estimation and simulations
Our simulations on the effects of lower labour shares on components of aggregate demand are based
on elasticity estimates that assume single equations to explain (independently) each of the items
that integrate aggregate demand, namely GC (government consumption), C (aggregate domestic private consumption on goods and services), I (aggregate private investment) and NX (aggregate net
exports, i.e. the value of exports minus imports). It is assumed that functional income shares affect
each of the components in the identity that explains national income Y (i.e. Y = GC + C + I + NX)
but feedback effects between the components are not accounted for when providing final simulation effects. The simplification reduces the problem of using untestable assumptions on a system of
equations; avoiding such assumptions allows for a clear policy-oriented interpretation of the results.
The estimation process consists of three steps:
Step 1: Selecting the countries, the time-span and the databases
•
16 economies: Eurozone (12 core high-income economies), Argentina, Australia, Canada,
China, France, Germany, India, Italy, Japan, Mexico, Republic of Korea, South Africa,
Turkey, United Kingdom, United States.
•
Time series periods: 1960–2007 for developed economies; 1970–2007 for developing economies; 1978–2007 for China. The period of the crisis is omitted.
•
Dependent variables: Growth in private consumption, investment, net exports.
•
Independent (causal) variables: indicators of labour income shares and profit income shares.
The labour income share (or labour wage share, LWS) has been adjusted in the same form
as described in step 2 of Appendix III. Capital (or profit) income shares follow by construction from LWS: CIS = 1 − LWS. Other indicators include industrial share (IND), agricultural
share (AGR), terms of trade (TOT), World GDP (wGDP), import prices (MP), export prices
(XP), domestic prices (P), unit labour cost (ULC).
•
Databases and sources: ILO/IILS, World Bank WDI, UNIDO; for Argentina and South Africa,
Lindenboim et al. (2011) and UN National Accounts; for China, Zhou et al. (2010).
Step 2: Specification of long-run relationship between labour income shares and capital income
shares and the dependent variables (C, I, NX):
The following specifications are applied to each economy independently:
ct
consumption: investment: exports: mt
imports: xt
it
= f[lwst, cist, indt, agrt; et]
= f[cist, indt, agrt; et]
= f[tott, wgdpt, mpt, pt, ulct; et]
= f[tott, wgdpt, xpt, pt, ulct; et]
88
Global Wage Report 2012/13
Box A2 Data, estimation and simulations (continued)
Assumptions:
•
Single equation approach
•
Long run relationship where the LWS and the CIS are exogenous to the aggregate demand
component.
Step 3: Simulations
Effect of a 1 per cent decrease on LWS (1 per cent increase in CIS) on C, I, NX:
Estimate each of the causal relations in step 2, using log transformation in all variables, to find
the elasticities (coefficients) of each variable included in the specification.
Apply the elasticities to the identities that explain each of the aggregated demand items (C, I,
NX) in the form of marginal changes with respect to national income. Take the mean average
change of consumption, income and net exports to be the mean average change observed over
the period (in real terms).
Simultaneous decrease of 1 per cent LWS (1 per cent increase in CIS) on each country’s total
aggregate private demand:
Assume n economies where economy i is a trade partner of all other j economies in n. The simultaneous effect on a country’s aggregated demand (AD) of a change in LWS in all n economies for
an economy i is given as the sum of the following 4 components:
Results and interpretation
Our estimation strategy consists in using a dynamic framework on time series data for
the period 1960–2007 to estimate elasticities of labour income shares for 16 economic
units, individually, for each economy and for each of the three items in aggregate demand.
The elasticities measure how responsive each of the aggregate demand components is
to changes in labour income share. The demand side interpretation of national income
assumes the existence of stable, long-run equilibrium between aggregate demand and
labour income share. On the other hand, the modelling strategy assumes no feedback
effects between the different aggregate demand components (consumption, investment
and net exports) and a change in labour income shares. The simplification comes at
the cost of potential imprecisions in the estimate of the elasticities. On the other hand,
estimating single equations for each economy has the advantage that it avoids having
to make untestable identifying assumptions that further complicate the interpretation
of the results for the purpose of policy advice.54 It is important to point out the duality
in the estimation procedure: an elasticity that measures the impact of a change on any
Appendix IV
The effect of labour share on aggregate demand
89
given item (say, investment) for a 1 per cent fall (increase) in labour income share is
equivalent to measuring the change on the same item for a 1 per cent increase (fall) in
capital (i.e. profit) income share. Government consumption has been ignored because
by definition government consumption is the same as public employment income
share. In this respect, the wage shares in the empirical estimates that follow have been
adjusted as described above.
The estimated elasticities are used in the empirical analysis in two different forms.
First, they are used to simulate the change in consumption, investment and net exports
(relative to GDP) caused by a 1 per cent fall in labour income share; this is simply done
by multiplying the estimated elasticities by the observed mean value of the corresponding items in aggregate demand weighted by the factor prices. Second, the estimated
elasticities are used in a more general framework to simulate the change in aggregate demand for any given economy (among the 16 economic units) if all other 15
economic units experienced a simultaneous 1 per cent fall in labour income share: the
feedback effect is simulated assuming that each country’s fall in labour income share
has a measurable impact on its net exports.
Figure A1 shows the results of simulating the impact of a 1 per cent fall in labour
income shares on each of the components of aggregate demand. Compared to investment and net exports, the response of private consumption of domestic goods is negative and substantial across all economic units: in this case it is not possible to distinguish between developed and developing economies as all seem to suffer losses of
similar magnitude. With the exceptions of Argentina, Australia and South Africa, all
countries and the eurozone as a whole would experience a drop in consumption of
0.3 per cent or more. In the case of economies with significantly large populations and,
therefore, large internal markets (the eurozone, China, Germany, Mexico, Turkey, the
United States), the drop in consumption is greater, ranging between 0.4 per cent and
0.5 per cent.
Whereas consumption falls, investment is positively affected by a decline in labour
income share in all but six economic units, and in these the effect is non-zero but negligent: these are Argentina, China, India, the Republic of Korea, Turkey and the United
States. One possible reason why investment is not sensitive to a fall in labour income
share (i.e. to an increase in the profit income shares) in emerging economies is the lack
of a correlation between firms’ profits and overall investment, because in these countries public industrial policies and public investment are the drivers of infrastructure
and industrial development. Thus, for most emerging economies, high investment rates
are part of the authorities’ attempt to create an optimal business environment – with a
view to catching up in the global market – whereas short-term private profit shares have
only weak effects on investment rates (Akyüz et al., 1998). The only advanced economy where an increase in profit share shows zero impact on investment is the United
States: in an earlier study by Onaran et al. (2011), the inclusion of interest and dividend payments in the definition of investment for the United States was found to have
confounding effects that made it impossible to detect the significance of an increase in
capital income share (a drop in labour income share) for investment. The same might
be happening in the present set of estimates.55 For all other developed economies, the
impact of a 1 per cent fall in labour income share (i.e. a 1 per cent increase in capital
90
Global Wage Report 2012/13
income share) is to increase investment by 0.1 per cent or more. The effect is greatest
in the eurozone (0.3 per cent), Germany (0.38 per cent) and Japan (0.29 per cent).
In the case of net exports, figure A1(c) shows that a 1 per cent drop in labour
income share induces an increase in net exports in all countries. It is important to note
that in the case of net exports the magnitude is estimated with a composite of elasticities that depend on the relative prices of exports and imports, the degree of openness of
the economy and price elasticity at home.56 The effects are larger for developing countries such as Mexico and South Africa and, as expected, extraordinarily high in China
as this is the most aggressive export-led economy in the global market. It is illustrative
to point out that the estimate of a 2 per cent increase in net exports for China (given a
1 per cent drop in labour income share in China) is composed of 1.1 per cent increase
in the share of exports (in GDP) and a 0.9 per cent decline in import share (of GDP).
These marked effects are related to several factors that characterize the Chinese labour
market. First, the elasticity of prices with respect to unit labour costs is the highest in
the world, indicating a highly labour-intensive export structure with high mark-ups.
Second, the elasticity of exports with respect to relative prices is again the highest
in the world, reflecting the highly price-elastic character of the demand for Chinese
exports, which rely heavily on consumer goods such as textiles. Finally, the elasticity
of imports with respect to relative prices is the second highest in the world after South
Africa. This last point might also explain why South Africa shows the second highest
impact on net exports among the 16 economic units of a 1 per cent drop in labour
income share (figure A1(c)).
One might be tempted to add up all the independent effects for each of the economic
units to illustrate the overall impact of a 1 per cent drop in labour income shares on
private aggregate demand. This would be misleading, for figure A1 and the estimates
leading to it ignore the feedback effects that exist between consumption, investment
and net exports. Nevertheless, the estimates presented in figure A1 are informative: for
most of the economies considered, the impact of lowering the labour share of income –
say, by reducing wages below average productivity to gain competitiveness – is likely
to have such a negative effect on domestic consumption (domestically traded goods and
services) that it would require a massive response in the form of domestic investment
and net exports to offset the adverse impact on aggregate demand. The findings are in
line with those of Felipe and Kumar, who find that cutting unit labour costs (reducing
the labour income share) is detrimental to economies that do not have a niche for their
basket of exports in the global market: there is no gain in cutting unit labour costs when
they compete with China to place a similar basket of exports in the global economy, for
that cut in unit labour costs will simply deepen a county’s recession further through the
adverse effect on consumption (reducing effective demand) and investment (widening
the technological gap) (Felipe and Kumar, 2011).
Appendix IV
The effect of labour share on aggregate demand
91
Figure A1 Effect of a 1% decrease in labour income share on private consumption of domestic
goods and services, investment and net exports: (a) private consumption of goods
and services; (b) investment; (c) net exports
Private consumption
Investment
Net exports
Note: The bracketed value shows the % change in each of the corresponding items: % change in private consumption of goods and services, % change in
investment goods, % consumption of exports value minus import value (net export).
Source: Onaran and Galanis, forthcoming.
Notes
Major trends in wages
1 For unemployment rates in individual countries, see ILO, 2011c.
2 “Paid employees” excludes own-account workers, contributing family workers,
members of workers’ cooperatives and workers unclassifiable by status. Wages are
defined in Appendix I.
3 See ILO, 2012b. An alternative measure of wages would have been hourly wages,
but these are available for only a limited number of countries with more advanced
statistical systems.
4 Estimates including China may somewhat overstate global wage growth, given that
the only wage series which covers the entire period from 2006 to 2012 refers only to
“urban units”, which in practice cover mostly State-owned enterprises, collectiveowned units and other type of companies linked to the State. A new series published
in the China Yearbook of Statistics now provides separate estimates of annual wages
paid to employees in “urban private units”, but this series only started in 2009 and
no series is available that covers all employees.
5 Work-sharing programmes are also known as “short-time work” or as “partial” or
“technical” unemployment (see Messenger, 2009).
6 Work-sharing programmes have been implemented in Argentina, Austria,
Bulgaria, Canada, Chile, Croatia, the Czech Republic, Belgium, France, Germany,
Hungary, Mexico, the Netherlands, Poland, Romania, Serbia (at company level
only), Slovakia, Slovenia, South Africa, Switzerland, Turkey and Uruguay; small
programmes have been implemented in a number of individual states in the United
States (see ILO, 2011a). For further information regarding work-sharing measures
in middle-income countries, see also Messenger and Rodríguez, 2010).
7 Preliminary estimates, using preliminary quarterly data from 30 selected developed
economies for which data are available, suggest that real average wages are likely
to grow by about 0 per cent in developed economies in 2012.
8 Figure 9 also confirms that higher inflation in 2008 was not caused by higher
nominal wage demands, as nominal wages continued to grow at the same (or even
a slightly slower) rate as in 2007. On the contrary: the higher prices were passed on
to workers, who as a result received lower real wages. The figure also suggests that
positive wage growth in 2009 prevented a fuller price deflation in 2009.
9 While there are a number of different ways to measure labour productivity, they
all define economic output in relation to labour input (see OECD, 2001). In line
with the United Nations’ Millennium Development Goals, this report uses GDP
per person employed as a simple measure of labour productivity. While more
94
Global Wage Report 2012/13
refined approaches that adjust for hours worked are often useful for single-country
studies (see e.g. the labour productivity figures published by the US Bureau of
Labor Statistics at http://www.bls.gov/lpc/ [accessed 17 Sep. 2012]), our simple
measure is more appropriate for studies such as the Global Wage Report that cover
a large number of countries, for many of which no reliable data on hours worked
are available.
10 For trends in Ukraine between 1992 and 2002 see Ganguli and Terrell, 2006; for
more recent trends, see ILO, 2011d.
11 The proportion of people available to work full-time but working shorter hours shot
up from 4.4 per cent in 2007 to 10.6 per cent in 2008 and to 19.4 per cent in 2009,
before declining again to 12.3 per cent in the first half of 2010.
12 Argentina identified some inconsistencies in its wage series which could not be
resolved before publication of this report; for this reason, the decision was made not
to publish them in this edition of the report.
13 The members of the GCC are Bahrain, Qatar, Kuwait, Oman, Saudi Arabia and the
United Arab Emirates.
14 The 2008 ILO Declaration on Social Justice for a Fair Globalization highlights as
part of its Decent Work Agenda the promotion of “policies in regard to wages and
earnings, hours and other conditions of work, designed to ensure a just share of the
fruits of progress to all and a minimum living wage to all employed and in need of
such protection” (ILO, 2008a, p. 10). The 2009 Global Jobs Pact also encouraged
governments to “consider options such as minimum wages that can reduce poverty
and inequity, increase demand and contribute to economic stability” (ILO, 2009,
p. 7).
15 See the Minimum Wage Fixing Convention, 1970 (No. 131).
16 From €877 per month (i.e. €751 payable over 14 months) to €684 per month.
17 In early 2010, the ILO and the World Bank conducted a joint survey of policy
responses to the crisis in 77 countries over a two-year period (mid-2008 to end
2010). The resulting database and the joint report can be seen at http://ww.ilo.org/
crisis-inventory [accessed 17 Sep. 2012]. The minimum wage was one of 62 policy
tools surveyed. Several explanations were put forward for the variation among
countries, including the institutional setting of the minimum wage which makes it
easy – and sometimes compulsory – to adjust its level (Bonnet, Saget and Weber,
2012).
18 The US$1.25 international poverty line corresponds to the mean national poverty line
of 15 least developed countries (LDCs), while the US$2 international poverty line
corresponds to the median poverty line of 75 developing economies. The national
poverty lines are based on the estimated cost of a basket of basic consumption
goods, which are typically anchored to minimum nutrition requirements. See
Ravallion et al., 2008.
Notes
95
Falling labour shares and equitable growth
19 These include the previous two editions of the Global Wage Report (ILO, 2008a,
2010a); European Commission, 2007; IMF, 2007; World Bank, 2011; OECD, 2011,
2012a; UNCTAD, 2011 and 2012; and IILS, 2011, 2012, to mention but a few. In the
case of studies that deal with the effect of wage share on aggregate macroeconomic
components, studies such as those by UNCTAD (2011) show that much of the
research on the topic so far has been in the form of descriptive correlations as
opposed to estimates of the causal empirical framework we present in the current
report.
20 These empirical findings date back to the early twentieth century, when Arthur
Bowley first observed such regularity using British data from the nineteenth and
twentieth centuries and formulated “Bowley’s Law”. Paul Douglas made a similar
finding regarding the labour share in the United States, and developed, together with
the mathematician Charles Cobb, the famous Cobb–Douglas production function,
which simplifies economic modelling by assuming that the functional income
distribution between labour and capital always remains constant (see Mankiw,
2003). Keynes described this empirical constancy as “a bit of a miracle” (Keynes,
1939) and later Solow questioned the reliability of the empirical evidence (Solow,
1958) (see La Marca and Lee, forthcoming).
21 Roughly, the (non-adjusted) labour income share is equal to the total compensation
of employees divided by GDP, while the adjusted labour income share assumes
that self-employed workers have similar average earnings to employees and
adds this element to the total compensation of labour. There are advantages and
disadvantages in using this standard adjustment methodology. On the one hand, the
reality of self-employment is different in different types of economies: in advanced
economies the self-employed are more likely to be in the formal sector and their
remunerations are likely to be above that of their counterfactual employees, thus the
adjusted labour share probably underestimates the true labour share. The opposite
is the case for less developed economies where the self-employed are more likely
to be vulnerable workers with remunerations below that of their counterfactuals in
the formal sector. At the same time, however, failing to adjust the labour share for
the self-employed workers leads to a significant underestimation of the actual share
of GDP going to workers in the form of employment-related income. In addition,
trends (the main focus of our analysis) do not change significantly when different
adjustments are applied (see ILO, 2010a). Use of the adjusted labour share also
provides for a consistent benchmark with most other studies.
22 The World Top Income database is available online at the Paris School of Economics
at http://g-mond.parisschoolofeconomics.eu/topincomes/
23 Retained earnings are defined here as gross operating surplus minus dividend
payments.
24 Federal Statistical Office, Germany, National Accounts: Domestic Product,
Quarterly Results, Fachserie 18, Series 1.2, table 1.11.
96
Global Wage Report 2012/13
25 A European Commission report concluded that “for the period for which the data
is available (i.e. from the mid-1980s to early 2000s), the estimation results clearly
indicate that technological progress made the largest contribution to the fall in the
aggregate labour income share” (European Commission, 2007, p. 260). However,
evidence is rather limited for developing countries.
26 For a description of the data sources, see Stockhammer, forthcoming.
27 In an interview with the Financial Times in 2007, Alan Greenspan, former President
of the Federal Reserve Bank, apparently considered that the decline in the labour
share and the gap between wages and productivity growth in the United States
might undermine political support for free markets: see Guha (2007).
28 Aggregate demand, as noted above, is the sum of consumption, investment, net
exports and government expenditures. Government consumption has been excluded
from the analysis because by definition government consumption is the same as
public employment income share.
29 All specific econometric results underlying the table can be found in Onaran and
Galanis, forthcoming.
30 See e.g. IMF, 2012c. Note that the concept of unit labour costs as a measure of
cost competitiveness is not without its critics. Felipe and Kumar consider, for
example, that when unit labour costs increase, then by definition unit capital costs
must decrease, and so the impact on external competitiveness is unclear (Felipe and
Kumar, 2011).
31 The only advanced economy that shows zero impact on investment of an increase
in profit share is the United States. In an earlier study by Onaran et al. (2011),
the inclusion of interest and dividend payments in the definition of investment
for the United States was found to have compounding effects that prevented the
identification of the significance of an increase in capital income share (a drop in
labour income share) on investment. The same may be happening in the present set
of estimates. See also Hein and Vogel, 2008, who find no effects of capital income
on US investment, consistent with the findings in this report.
32 One question in such a scenario would be how the incremental economic growth that
might result from a lower income share would be distributed among the population.
But this question is beyond the scope of the present report. For the importance of
introducing the microeconomic impact of changing functional income distribution
into the debate, see Atkinson, 2009.
33 Several case studies have examined this phenomenon for the United States in
particular. See esp. Barba and Pivetti, 2009; Cynamon and Fazzari, 2008; Guttmann
and Plihon, 2010; van Treeck Hein and Dünhaupt, 2007; and van Treeck, 2009).
Econometric studies have shown that (financial and housing) wealth is a statistically
significant determinant of consumption, and not only in the United States. See
Ludvigson and Steindel, 1999; Mehra, 2001; Onaran, Stockhammer and Grafl,
2011; Boone and Girouard, 2002; Dreger and Slacalek, 2007.
Notes
97
Appendix I
34 ILO commissioned report by Farhad Mehran, Estimation of global wage trends:
Methodological issues, International Labour Office, mimeo; peer reviews by Prof.
Yves Tillé, Expertise report on the “Estimation of global wage trends: Methodological
issues”, Institute of Statistics, University of Neuchatel, mimeo; Prof. Yujin Jeong
and Prof. Joseph L. Gastwirth, Comments on the draft ILO report “Estimation of
global wage trends: Methodological issues”, HEC Montreal and George Washington
University, Washington, DC, mimeo; Dr Joyup Ahn, Responses to draft ILO report
“Estimation of global wage trends: Methodological Issues”, Korea Labor Institute,
mimeo.
35 ILO resolution concerning the International Classification of Status in Employment
(ISCE), adopted by the 15th International Conference of Labour Statisticians,
Geneva, Oct. 1993.
36 ILO resolution concerning the measurement of employment-related income, adopted
by the 16th International Conference of Labour Statisticians (Geneva, October
1998).
http://www.ilo.org/global/What_we_do/Statistics/standards/resolutions/
lang--en/docName--WCMS_087490/index.htm.
37 Aiming for the broadest possible coverage is in line with the idea that decent work
and hence adequate earnings are a concern for all workers, and that statistical
indicators should cover all those to whom an indicator is relevant. See ILO, 2008c.
38 We do this on the basis of the IMF’s consumer price index (CPI) for the respective
country. In the case of Brazil and the United States, where our national counterparts
recommended the use of an alternative CPI, we relied on national sources provided
by the Brazilian Institute of Geography and Statistics (IBGE) and the BLS,
respectively. We also rely on the national CPI or real wage values in cases where the
national statistical office of a country provides us with the data directly, or where a
country’s primary wage series is provided in nominal and real form.
39 Our universe includes all countries and territories for which data on employment
are available from the ILO’s Global Employment Trends Model (GET Model), and
thus excludes some small countries and territories (e.g. the Channel Islands or the
Holy See) that have no discernible impact on global or regional trends.
40 This is in line with standard survey methodology, where a model-based framework
is generally used for item non-response, while a design-based framework is used
for questionnaire non-response.
41 For a discussion of the missing data problem, see also ILO, 2010c, p. 8.
42 An alternative specification with GDP per capita and population size produced very
similar results.
43 Data for the number of persons employed and the number of employees are
from KILM, and data on GDP in 2005 PPP$ are from the World Bank’s World
Development Indicators.
98
Global Wage Report 2012/13
44 The estimate, n̂h, of the number of employees in region h is obtained by multiplying
the number of employees in countries from the region for which we have wage data
with the uncalibrated weights, and then summing up across the region.
45 See e.g. the work done mainly for industrialized countries by the International
Labor Comparisons programme of the US Bureau of Labor Statistics (http://www.
bls.gov/fls/ [accessed 17 Sep. 2012]). Since we do not compare levels, but focus on
change over time in individual countries, data requirements are less demanding in
our context.
46 We estimate the number of employees in 2009 (which is not yet available from
KILM) by calculating the ratio of employees over employment in 2008, and then
multiplying total employment in 2009 with this ratio. The main data source for
KILM is Laborsta.
47 See also ILO (2008b, p. 15) for the association between wage levels and GDP per
capita. Notwithstanding this, wage developments can diverge from trends in labour
productivity in the short and medium term.
Appendix II
48 OECD Glossary of statistical terms, stats.oecd.org/glossary/ [accessed 17 Sep.
2012].
Appendix III
49 The indicator government consumption as welfare indicator suggests a hump-shaped
development over time: government expenditure as share of GDP peaked in the
early 1980s and has followed a declining trend ever since. The role of government
expenditure and the generosity of welfare spending has been highlighted previously
in the literature, with emphasis on the role of the latter on the reservation wage of the
working-age population; see Pierson, 1994; Korpi and Palme, 2003. Incidentally,
a reduction in welfare state generosity has occurred since 1980, which is precisely
the moment when the labour wage share began its downward trend. For studies
that include government consumption as share of GDP to explain the falling labour
wage share, see Harrison, 2002; Jayadev, 2007.
50 European Commission, 2007, and IMF, 2007, find surprisingly small, if any, effects
of union density. The IMF includes union density and the tax wedge after having
found no effect of other LMI variables.
51 Technological changes have also been approximated by capital–labour ratios and
ICT capital or combinations of these in Bentolila and Saint-Paul, 2003, and in
European Commission, 2007. The use of ICT capital (or ICT services) is a less
ambiguous proxy for technological change as it reflects implemented technological
change independent of the motives of its implementation.
52 In particular, such studies point to the significance of government spending and the
welfare state in determining the reservation wage of participants, i.e., the level at
Notes
99
which individuals are willing to enter the labour market. An increase in generosity
(the welfare state) shifts the reservation wage upward (income effect through labour
market disincentives) and therefore shifts the distribution of wages to the right,
making wages higher for all: this, holding everything else constant, increases the
labour income share.
53 Unemployment is expressed as the unemployment rate in the economy, and exchange
rate volatility as a function of the variance of the real exchange rate. Financial
reforms is based on a variable that measures entry barriers, international capital
flows, interest rate controls, privatization, the development of security markets and
a financial reform index. For more detail on a battery of related specifications to the
baseline specification, see Stockhammer, forthcoming.
Appendix IV
54 The use of single equations in a similar aggregate demand framework has been widely
used in the literature: see e.g. Onaran, 2011; Hein and Vogel, 2008; Naastepad and
Storm, 2007. An alternative to the single equation approach is to estimate elasticities
on a VAR system where the underlying identification restrictions are often arbitrary
assumptions on the relation between consumption, investment and net exports. One
advantage of using a VAR system is that of allowing for the endogeneity of the
labour income share. In the single equation system the assumption of a long-run
relation helps to overcome the problem of endogeneity; that is, the model assumes
a stable long-run equilibrium relation in a causal framework.
55 See also Hein and Vogel, 2008: they find no effects of profit shares on US investment,
consistent with the findings in this report.
56 For more details, see Onara and Galanis, forthcoming.
Bibliography
Abiad, A.G.; Detragiache, E.; Tressel, T. 2008. A new database of financial reforms,
IMF Working Papers, 08/266. Dataset available at: http://www.imf.org/external/
pubs/ft/wp/2008/Data/wp08266.zip [17 Sep. 2012].
Akyüz, Y.; Chang, H.-J.; Kozul-Wright, R. 1998. “New perspectives on East Asian
development”, in Journal of Development Studies, Vol. 34, No. 6, pp. 4–36.
Aleksynska, M.; Schindler, M. 2011. Labor market regulations in low-, middle- and
high-income countries: A new panel database, IMF Working Paper No. 11/154
(Washington, DC). Dataset available at: http://www.imf.org/external/pubs/cat/
longres.aspx?sk=25015.0 [27 Sep 2011].
Anderson, L. 2011. “Demystifying the Arab Spring: Parsing the differences between
Tunisia, Egypt, and Libya”, in Foreign Affairs, Vol. 90, No. 3 May–June, pp. 2–7.
Anspal, S.; Kraut, L.; Rõõm, T. 2010. Sooline palgalohe Eestis: empiiriline analuus.
Uuringuraport (Gender pay gap in Estonia: empirical analysis). Eesti Rakendusuuringute Keskus CentAR, Poliitikauuringute Keskus PRAXIS, Sotsiaalministeerium. Available at: http://www.sm.ee/fileadmin/meedia/Dokumendid/
V2ljaanded/Publikatsioonid/2011/Gender_pay_gap_Estonia_analysis.pdf [17
Sep. 2012].
Arandarenko, M.; Avlijas, S. 2011. “Behind the veil of statistics: Bringing to light
structural weaknesses in Serbia”, in V. Schmidt and D. Vaughan-Whitehead
(eds): The impact of the crisis on wages in South-East Europe (Budapest: ILO
Decent Work Technical Support Team and Country Office for Central and Eastern
Europe) pp. 123–58.
Argitis, G.; Pitelis, C. 2001. “Monetary policy and the distribution of income: Evidence
for the United States and the United Kingdom”, in Journal of Post Keynesian
Economics, Vol. 23, No. 4, pp. 617–38.
Artus, P. 2009. L’équilibre macroéconomique du Monde, Natixis Special Report
No. 286 (Paris).
ASDA’A Burson-Marsteller Arab Youth Survey. 2012. “Top 10 Findings”. Available at:
http://www.arabyouthsurvey.com/english/ [24 Sep 2012].
Assaad, R. 1997. “The effects of public sector hiring and compensation policies on the
Egyptian labor market”, in World Bank Economic Review, Vol. 11. No. 1, Jan.,
pp. 85–118.
Atkinson, A. 2009. “Factor shares: The principal problem of political economy?” in
Oxford Review of Economic Policy, Vol. 25, No. 1, pp. 3–16.
Atkinson, A.; Piketty, T.; Saez, E. 2011. “Top incomes in the long run of history”, in
Journal of Economic Literature, Vol. 49, No. 1, pp. 3–71.
102
Global Wage Report 2012/13
Azam, M. 2009. “Changes in wage structure in urban India 1983–2004: A quantile
regression decomposition”, IZA Discussion Paper Series No. 3963 (Bonn),
pp. 1–48.
Bacchetta, M.; Jansen, M. (eds). 2011. Making globalization socially sustainable
(Geneva, ILO and WTO).
Bank for International Settlements (BIS). 2006. 76th Annual Report (Basel).
Barba, A.; Pivetti, M. 2009. “Rising household debt: Its causes and macroeconomic
implications – A long-period analysis”, in Cambridge Journal of Economics,
Vol. 33, No. 10, pp. 113–37.
Bassanini, A.; Duval, R. 2006. Employment patterns in OECD Countries: Reassessing the role of policies and institutions, OECD Economics Department Working
Papers 486 (Paris, OECD).
Belser, P.; Rani, U. 2011. “Extending the coverage of minimum wages in India: Simulations from household data”, in Economic and Political Weekly, Vol. 46, No. 22,
28 May, pp. 47–55.
Bentolila, S.; Saint-Paul, G. 2003. “Explaining movements in the labor share”, in
Contributions to Macroeconomics, Vol. 3, No. 1, pp. 1–31.
Bleaney, M. 1976. Underconsumption theories: A history and critical analysis (New
York International Publishers).
Boily, L. 2011. “Pay premiums among major industry groups in New York City”, in Monthly
Labor Review, US Bureau of Labor Statistics, Washington, DC, Oct., pp. 22–8.
Bonnet, F.; Saget, C.; Weber, E. 2012. Social security and minimum wage responses
to the 2008 financial and economic crisis: Findings from the ILO/World Bank
Inventory, Employment Working Paper No. 113 (Geneva, ILO). Available at:
http://www.ilo.org/employment/Whatwedo/Publications/working-papers/
WCMS_175204/lang--en/index.htm [17 Sep. 2012].
Boone, L.; Girouard, N. 2002. The stock market, the housing market and consumer
behaviour, OECD Economic Studies No. 35 (Paris), pp. 175–200.
Borbely, J.M. 2011. “Characteristics of displaced workers 2007–2009: a visual essay”,
in Monthly Labor Review, US Bureau of Labor Statistics, Washington, DC, Sep.,
pp. 3–15.
Brown, D.; Deardorff, A. 2011. “The apparel industry and the Jordanian economy:
Calculating the domestic share of sector value added”, paper prepared for Better
Work Jordan: Garment industry 3rd compliance synthesis report (Geneva, ILO).
Bruno, M. 2011. Regime de crescimento e acumulascao de capital no Brasil: Uma
caracterizascao preliminar do periodo 1995–2010, ILO Working Paper (Geneva).
Centre de Recherche et d’Etude sur la Sécurité Sociale [Tunisia]. 2011. Enquête sur
la structure des salaires Tunisie 2011, final report, République Tunisienne/ILO,
unpublished.
Crimmann, A.; Wiessner, F.; Bellmann, L. 2010. The German work-sharing scheme:
An instrument for the crisis, Conditions of Work and Employment Series No. 25
(Geneva, ILO).
Bibliography
103
Cynamon, B.; Fazzari, S. 2008. “Household debt in the consumer age: Source of growth
– risk of collapse”, in Capitalism and Society, Vol. 3, No. 2, pp. 1–30.
Dougherty, C. 2010. “A comparison of public and private sector earnings in Jordan”,
Conditions of Work and Employment Series No. 24 (Geneva, ILO).
Draghi, M. 2012. “Monetary policy in unconventional times”, BIS Central Bankers’
Speeches, (Frankfurt am Main, European Central Bank).
Dreger, C.; Slacalek, J. 2007. “Finanzmarktentwicklung, Immobilienpreise und
Konsum”, in DIW Wochenbericht, Vol. 74, pp. 533–36.
Elbadawi, I.; Soto, R. 2011. Fiscal regimes in and out of the MENA region, Economic
Research Forum Working Paper (Cairo).
—; —. 2012. Resource rents, political instability and economic growth, Economic
Research Forum Working Paper (Cairo).
Epstein, G. (ed.). 2005. Financialization and the world economy (Cheltenham, Edward
Elgar Publishing).
—; Burke, S. 2001. Threat effects and the internationalization of production, Political
Economy Research Institute Working Paper 15 (Amherst, University of Massachusetts).
Estevão, M.; Nargis, N. 2002. Wage moderation in France, IMF Working Paper (Washington, DC).
European Commission (EC). 2007. “The labour income share in the European Union”,
in Employment in Europe 2007, Directorate-General for Employment, Social
Affairs and Equal Opportunities (Brussels), pp. 237–72.
—. 2010. Industrial Relations in Europe 2010, Directorate-General for Employment,
Social Affairs and Inclusion (Brussels).
—. 2012a. Towards a job-rich recovery, Communication from the Commission to the
European Parliament, the Council, the European Economic and Social Committee and the Committee of the Regions. Available at: http://ec.europa.eu/commission_2010-2014/andor/headlines/news/2012/04/20120418_en.htm [17 Sep.
2012].
—. 2012b. AMECO: Annual macro-economic database, Directorate-General for
Economic and Financial Affairs (link to dataset http://ec.europa.eu/economy_
finance/ameco/user/serie/SelectSerie.cfm [17 Sep. 2012]).
––. 2012c. Employment and Social Developments in Europe 2011 (Brussels).
Federal Statistical Office, Germany. 2009. Niedrigeinkommen und Erwerbstätigkeit
(Wiesbaden), Seite 8.
—. 2012. Volkswirtschaftliche Gesamtrechnungen, Inlandsproduktsberechnung, Lange
Reihen ab 1970, Vol. 18, No. 1.5 (Wiesbaden), table 1.8.
Feldstein, M. 2008. Did wages reflect growth in productivity?, NBER Working Paper
Series No. 13953 (Cambridge, MA).
Felipe, J.; Kumar, U. 2011. Unit labour costs in the eurozone: The competitiveness
debate again (Manila, Asian Development Bank).
104
Global Wage Report 2012/13
Fleck S.; Glaser, J.; Sprague, S. 2011. “The compensation–productivity gap: A visual
essay”, in Monthly Labor Review, US Bureau of Labor Statistics, Washington,
DC, Jan., pp. 57–69.
Ganguli, I.; Terrell, K. 2006. “Institutions, markets and men’s and women’s wage
inequality: Evidence from Ukraine”, in Journal of Comparative Economics, Vol.
34, No. 2, pp. 200–27.
Glyn, A. 2009. “Functional distribution and inequality”, in W. Salverda, B. Nolan and
T. Smeeding (eds): The Oxford handbook of economic inequality (Oxford, Oxford
University Press), pp. 101–26.
Gollin, D. 2002. “Getting income shares right”, in Journal of Political Economy
(Chicago), Vol. 110, No. 2, pp. 458–74.
—. 2010. Explaining labour’s declining share of national income, G-24 Policy Brief
No. 4, Oxford University, Department of Economics.
Guha, K. 2007. “A global outlook”, in Financial Times, 17 Sep.
Guttman, R.; Plihon, D. 2010. “Consumer debt and financial fragility”, in International
Review of Applied Economics, Vol. 24, No. 3, pp. 269–83.
Harrison, A. 2002. Has globalization eroded labor’s share? Some cross-country
evidence, mimeo, University of California at Berkeley.
Hein, E.; Mundt, M. Forthcoming. Financialization and the requirements and potentials for wage-led recovery:A review focussing on G20 countries, Conditions of
Work and Employment . (Geneva, ILO).
—; Schoder, C. 2011. “Interest rates, distribution and capital accumulation: A
post-Kaleckian perspective on the U.S. and Germany”, in International Review of
Applied Economics, Vol. 25, No. 6, pp. 693-723.
—; Vogel, L. 2008. “Distribution and growth reconsidered: Empirical results for
six OECD countries”, in Cambridge Journal of Economics, Vol. 32, No. 3,
pp. 479–511.
Holman, C.; Joyeux, B.; Kask, C. 2008. “Labor productivity trends since 2000, by
sector and industry”, in Monthly Labor Review, US Bureau of Labor Statistics,
Washington, DC, Feb., pp. 64–82.
Husson, M. 2010. “Le partage de la valeur ajoutée en Europe”, in La Revue de l’IRES,
Vol. 64, No.1, pp. 47–91.
International Institute for Labour Studies (IILS). 2008. World of Work Report 2008:
Income inequalities in the age of financial globalization (Geneva, ILO/IILS).
—. 2011. World of Work Report 2011: Making markets work for jobs (Geneva, ILO/
IILS).
—. 2012. World of Work Report 2012: Better jobs for a better economy (Geneva, ILO/
IILS).
International Labour Office (ILO). 2008a. Global Wage Report 2008/09: Minimum
wages and collective bargaining – Towards policy coherence (Geneva).
—. 2008b. ILO Declaration on social justice for a fair globalization (Geneva).
Bibliography
105
—. 2008c. Measurement of decent work, Discussion Paper for the Tripartite Meeting of
Experts on the Measurement of Decent Work, Geneva, 8–10 Sep.
—. 2009. Recovering from the crisis: A Global Jobs Pact (Geneva).
—. 2010a. Global Wage Report 2010/11: Wage policies in times of crisis (Geneva).
—. 2010b. Global Wage Report 2010/11: Africa brief (Geneva).
—. 2010c. Trends econometric models: A review of the methodology (Geneva).
—. 2010d. Decent work country profile: Tanzania (mainland) (Geneva).
—.2010e. World Social Security Report 2010/11: Providing coverage in times of crisis
and beyond (Geneva).
—. 2011a. Working time in the twenty-first century, Report for Discussion at the Tripartite Meeting of Experts on Working-time Arrangements, Conditions of Work and
Employment Programme, TMEWTA/2011 (Geneva).
—. 2011b. Remuneration in domestic work, Domestic Work Policy Brief 1, Conditions
of Work and Employment Branch (Geneva).
—. 2011c. Key Indicators of the Labour Market (KILM), 7th edn (Geneva).
—. 2011d. Decent work country profile: Ukraine (Geneva).
—. 2011e. Panorama Laboral 2011. América Latina y el Caribe (Lima, ILO Regional
Office).
—. 2012a. Global Employment Trends 2012: Preventing a deeper jobs crisis (Geneva).
—. 2012b. Decent Work Indicators: Concepts and definitions, 1st version, May
(Geneva).
—; International Finance Corporation. 2012. Better Work Jordan: Garment industry
3rd compliance synthesis report (Geneva, ILO).
—; World Bank. 2012. Inventory of policy responses to the financial and economic
crisis: A joint synthesis report (Geneva and Washington, DC).
International Monetary Fund (IMF). 2007. “The globalization of labor”, in World
Economic Outlook, April2007: Spillovers and cycles in the world economy
(Washington, DC), pp. 161–92.
—. 2009. World Economic Outlook, April 2009: Crisis and recovery (Washington, DC).
—. 2010. World Economic Outlook, April 2010: Rebalancing growth (Washington,
DC).
—. 2012a. World Economic Outlook, April 2012: Growth resuming, dangers remain
(Washington, DC).
—. 2012b. World Economic Outlook, October 2012: Coping with high debt and sluggish growth (Washington, DC).
—. 2012c. The IMF’s advice on labor market issues, IMF Factsheet. Available at: http://
www.imf.org/external/np/exr/facts/pdf/labor.pdf [17 Sep. 2012].
Jayadev, A. 2007. “Capital account openness and the labour share of income”, in
Cambridge Journal of Economics, Vol. 31, No. 3, pp. 423–43.
106
Global Wage Report 2012/13
Jetin, B. 2012. “Distribution of income, labour productivity and competitiveness: Is the
Thai labour regime sustainable?”, in Cambridge Journal of Economics, Vol. 36,
No. 4, pp.895—917.
Kapsos, S.; Horne, R. 2011. “Working poverty in the world: Introducing new estimates
using household survey data”, in ILO: Key Indicators of the Labour Market, 7th
edn (Geneva, ILO), Ch. 1A.
Kerr, C. 1977. Labor markets and wage determination: The balkanization of labor
markets and other essays (Berkeley, University of California Press).
Keynes, M. 1939. “Relative movements of real wages and output”, in Economic Journal, Vol. 49, No. 193, pp. 34–49.
Korpi, W.; Palme, J. 2003. “New politics and class politics in the context of austerity
and globalization: Welfare state regress in 18 countries, 1975–95”, in American
Political Science Review, Vol. 97, No. 3, pp. 425–46.
Krueger, A. 1999. “Measuring labor’s share”, in American Economic Review, Vol. 89,
No. 2, pp. 45–51.
Kulikov, G.; Blyzniuk, V. 2010. Impact of the financial and economic crisis on wages,
income distribution and the tax system (Budapest: ILO Decent Work Technical
Support Team and Country Office for Central and Eastern Europe).
Kumhof, M.; Rancière, R. 2011. Inequality, leverage and crises, IMF Technical Report
(Washington, DC).
La Marca, M.; Lee, S. Forthcoming. “Wages and growth in open economies: A policy
dilemma?”, in I. Islam and D. Kucera (eds): Inclusive growth and structural transformation (Basingstoke, Palgrave Macmillan and Geneva, ILO).
Lane, P.R.; Milesi-Ferretti, G.M. 2007. “The external wealth of nations mark II: Revised
and extended estimates of foreign assets and liabilities, 1970–2004”, in Journal of
International Economics, Vol. 73, No. 2, pp. 223-250. Available at: http://www.
imf.org/external/pubs/ft/wp/2006/data/update/wp0669.zip [15 Feb 2011].
Lavoie, M.; Stockhammer, E. Forthcoming. Wage-led growth: concept, theories
and policies, Conditions of Work and Employment Series No. 41 (Geneva,
ILO).
Lazonick, W.; O’Sullivan, M. 2000. “Maximising shareholder value: A new ideology
for corporate governance”, in Economy and Society, Vol. 29, No. 1, pp. 13–35.
Lee, S. 2012. “Varieties of minimum wage systems: Through the lens of indicator-based
country rankings”, in International Labour Review, Vol. 51, No. 3, pp. 261–74.
Lindenboim, J.; Kennedy, D.; Graña, J.M. 2011. “ Wage share and aggregate demand:
Contributions for labour and macroeconomic policy”, paper delivered at Regulating for Decent Work Conference, ILO, Geneva, July 6-8.
Low Pay Commission. 2012. National minimum wage: Low Pay Commission Report
2012 (Norwich, The Stationery Office).
Ludvigson, S.; Steindel, C. 1999. “How important is the stock market effect on
consumption?”, in Federal Reserve Bank of New York Economic Policy Review,
July, pp. 29–51.
Bibliography
107
Luebker, M. 2011. “Labour productivity”, in T. Sparreboom and A. Albee, eds: Towards
decent work in sub-Saharan Africa: Monitoring MDG Employment Indicators
(ILO, Geneva).
Lukiyanova, A. 2011. Effects of minimum wages on the Russian wage distribution,
Working Paper in the Basic Research Program 09/EC/2011 Series: Economics
(Moscow, National Research University, Higher School of Economics).
McKenzie, R.; Brackfield,D. 2008. The OECD system of unit labour costs and related
indicators, OECD Statistics Working Paper 2008/04 (Paris).
Mankiw, N.G. 2003. Macroeconomics, 5th edn (New York, Worth Publishers).
Mehra, Y.P. 2001. “The wealth effect in empirical life-cycle aggregate consumption
equations”, in Federal Reserve Bank of Richmond Economic Quarterly, Vol. 87,
No. 2, pp. 45–68.
Messenger, J.C. 2009. Work sharing: A strategy to preserve jobs during the global jobs
crisis, TRAVAIL Policy Brief No. 1 (Geneva, ILO).
—; Rodriguez, S. 2010. New developments in work sharing in middle-income countries, TRAVAIL Policy Brief No. 2 (Geneva, ILO).
—; Ghosheh, N. (eds). 2010. Offshoring and working conditions in remote work
(Geneva, ILO; Basingstoke, Palgrave Macmillan).
Naastepad, C.W.M.; Storm, S. 2007. “OECD demand regimes (1960–2000)”, in Journal of Post Keynesian Economics, Vol. 29, No. 2, pp. 211–46.
Obstfeld, M.; Rogoff, K. 2009. “Global imbalances and the financial crisis: Products of
common causes”, MS, University of California at Berkeley.
Onaran, Ö. 2011. “Globalisation, macroeconomic performance and distribution”, in
E. Hein and E. Stockhammer (eds), A modern guide to Keynesian macroeconomics and economic policies (Cheltenham, Edward Elgar).
—; Galanis, G. Forthcoming. Is aggregate demand wage-led or profit-led? National and
global effects, Conditions of Work and Employment Series No. 40 (Geneva, ILO).
—; Stockhammer, E.; Grafl, L. 2011. “Financialization, income distribution, and
aggregate demand in the US”, in Cambridge Journal of Economics, Vol. 35,
No. 4, pp. 637–66.
Organisation for Economic Co-operation and Development (OECD). 2001. “Measuring
productivity: Measurement of aggregate and industry-level productivity growth”,
in OECD Manual (Paris).
—. 2008. OECD Employment Outlook 2008 (Paris).
—. 2011. Divided we stand: Why inequality keeps rising (Paris).
—. 2012a. Inequality in labour income: What are its drivers and how can it be reduced?,
OECD Economic Department Policy Notes No. 8 (Paris).
—. 2012b. OECD Employment Outlook 2012 (Paris).
Oya, C. 2010. Rural inequality, wage employment and labour market formation in
Africa: Historical and micro-level evidence, Policy Integration Department Working Paper No. 97 (Geneva, ILO).
108
Global Wage Report 2012/13
Pastore, F.; Verashchagina, A. 2004. The distribution of wages in Belarus, Discussion
Paper No. 1140, Institute for the Study of Labour (Bonn).
Pierson, P. 1994. Dismantling the welfare state? Reagan, Thatcher, and the politics of
retrenchment (Cambridge, Cambridge University Press).
Piketty, T.; Saez, E. 2003. “Income inequality in the United States, 1913–1998”, in
Quarterly Journal of Economics, Vol. 118 , No. 1, pp. 1–39.
Rani, U.; Belser P. 2012. “The effectiveness of minimum wages in developing countries: The case of India”, in International Journal of Labour Research, Vol. 4,
No. 1, pp. 45–66.
Ravallion, M.; Chen, S.; Sangraula, P. 2008. Dollar a day revisited, World Bank Policy
Research Working Paper 4620 (Washington, DC).
Rizzio, M. 2011. Rural wage employment in Rwanda and Ethiopia: A review of the
current policy neglect and a framework to begin addressing it, Policy Integration
Department Working Paper No. 103 (Geneva, ILO).
Rodrik, D. 1997. Has globalization gone too far? (Washington, DC, Institute of International Economics).
—. 1999. “Democracies pay higher wages”, in Quarterly Journal of Economics,
Vol. 114, No. 3, pp. 707–38.
Roine, J.; Waldenström, D. 2012. “On the role of capital gains in Swedish income
inequality”, in Review of Income and Wealth, Vol. 58, No. 3, pp. 569–87.
Rossman, P. 2009. Financialization and casualization of labour – building a trade
union and regulatory response, paper presented at the Global Labour University
Conference, Mumbai, Feb.
Russian Federation Federal State Statistics Service. 2011. Statistical Yearbook:
Socio-economic indicators of the Russian Federation in 1991–2010, annex. Available at: http://www.gks.ru/wps/wcm/connect/rosstat/rosstatsite/main/publishing/
catalog/statistic Collections/doc_1270707126016 [24 Sep 2012].
Särndal, C.-E.; Deville, J.-C. 1992. “Calibration estimators in survey sampling”, in
Journal of the American Statistical Association, Vol. 87, No. 418, pp. 376–82.
Schmidt, V.; Vaughan-Whitehead, D. (eds). 2011. The impact of the crisis on wages
in South-East Europe (Budapest: ILO Decent Work Technical Support Team and
Country Office for Central and Eastern Europe).
Shehata, D. 2011. “The fall of the Pharaoh: How Hosni Mubarak’s reign came to an
end”, in Foreign Affairs, Vol. 90, No. 3, May–June, pp. 26–32.
Solow, R. 1958. “A skeptical note on the constancy of relative shares”, in American
Economic Review, Vol. 48, pp. 618–31.
Sommers D.; Franklin, J.C. 2012. “Employment outlook 2010–2020: Overview of
projections to 2020”, in Monthly Labor Review, US Bureau of Labor Statistics,
Washington, DC, Jan., pp. 3–2000.
Soto, R.; Huauas, I. 2011. Has the UEA escaped the oil curse?, Economic Research
Forum Working Paper (Cairo).
Bibliography
109
—; Vazquez-Alvarez, R. 2010. The effects of short lived immigration policies (contracts)
on human capital stocks (and productivity) (Dubai, UAE, Economic Policy and
Research Center, Dubai Economic Council).
Stockhammer, E. 2004. “Financialisation and the slowdown of accumulation”, in
Cambridge Journal of Economics, Vol. 28, No. 5, pp. 719–41.
—. 2009. Determinants of functional income distribution in OECD countries, IMK
Studies 05-2009 (Düsseldorf, Hans Böckler Stiftung).
—. Forthcoming. Why have wage shares fallen? A panel analysis of the determinants
of functional income distribution, Conditions of Work and Employment Series
No. 35. (Geneva, ILO).
Syrian Arab Republic, Central Bureau of Statistics. 2011a. Labour Force Survey. Available at: http://www.cbssyr.org/index-EN.htm [24 Sept 2012].
—. 2011b. Statistical Abstract. Available at: http://www.cbssyr.org/index-EN.htm
[24 Sept 2012].
Tillé, Y. 2001. Théorie des sondages: Echantillonage et estimation en populations
finies (Paris, Dunod).
United Nations Industrial Development Organization (UNIDO). 2006. Industrial
Statistics Database. Available at: http://dx.doi.org/10.5257/unido/indstat3/2006
[15 Feb 2011].
United Nations Conference on Trade and Development (UNCTAD). 2011. Trade and
Development Report 2011 (Geneva and New York, United Nations). Available at:
http://unctad.org/en/docs/tdr2011_en.pdf [17 Sep. 2012].
—. 2012. Trade and Development Report, 2012 (Geneva and New York, United
Nations). Available at: http://unctad.org/en/PublicationsLibrary/tdr2012_en.pdf
[24 Sep. 2012].
United Nations Statistics Division. Various years. UN National Accounts Official
Country Data, UNData Explorer. Available at: http://data.un.org/Explorer.aspx?d=SNA
United States Department of Labor, Bureau of Labor Statistics (BLS). 2011. “International comparisons of hourly compensation costs in manufacturing, 2010”, news
release. Available at: http://www.bls.gov/news.release/pdf/ichcc.pdf [17 Sep. 2012].
—. 2012. “The recession of 2007–2009”, in Spotlight on Statistics. Available at: http://
www.bls.gov/spotlight/2012/recession/ [17 Sep. 2012].
Van Treeck, T. 2009. “The political economy debate on ‘financialisation’: A macroeconomic perspective”, in Review of International Political Economy, Vol. 16,
No. 5, pp. 907–44.
—; Hein, E.; Dunhaupt, P. 2007. Finanzsystem und wirtschaftliche Entwicklung:
Neuere Tendezen in den USA und in Deutschland, IMK Studies 5/2007 (Düsseldorf: Hans Böckler Stiftung).
Vaughan-Whitehead, D. (ed.). 2011. Work inequalities in the crisis: Evidence in Europe
(Cheltenham, Edward Elgar, and Geneva, ILO).
110
Global Wage Report 2012/13
— (ed.). 2010. The minimum wage revisited in the enlarged EU (Cheltenham, Edward
Elgar and Geneva, ILO).
Vazquez-Alvarez, R. 2012a. Labor markets in Dubai: Main Dubai versus free zones
(Dubai, UAE, Dubai Economic Council).
—. 2012b. Assessing the effect of the new labor market regulations for Dubai (Dubai,
UAE, Economic Policy and Research Center).
Wolff, E.; Zacharias, A. 2009. “Household wealth and the measurement of economic
well-being in the United States”, in Journal of Economic Inequality, Vol. 7,
No. 2, pp. 83–115.
World Bank. 2011. Migration and Remittances Factbook, 2011 (Washington, DC).
—. 2012. World Development Report 2013: Jobs (Washington, DC).
Zhou, M.; Xiao, W.; Yao, X. 2010. Unbalanced economic growth and uneven national
income distribution: Evidence from China, Institute for Research on Labor and
Employment Working Paper 2010–11 (Los Angeles, University of California Los
Angeles).
Baixar