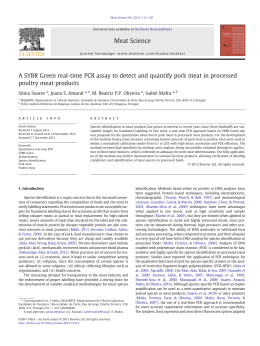
May 2012
Rabobank International
Authors
Rabobank Pork Quarterly
[email protected]
[email protected]
[email protected]
Outlook for Global and Regional Markets
Q1’12
Q4’11
QOQ
Q1’11
Brazil
1.82
1.98
-8.1%
1.90
-4.2%
China
2.59
2.69
-3.7%
2.20
17.7%
US
1.90
1.90
-0.0%
1.80
5.6%
Canada
1.64
1.71
-4.1%
1.53
7.2%
EU
2.06
2.13
-3.3%
1.91
7.9%
YOY
Source: Bloomberg, EU Commission, USDA, 2012
Figure 2: Rabobank 5-nation finished hog price index, 2006-2012
Jan 2006 = 100
170
160
150
140
130
120
110
100
Rabobank index
Average 2006-2011
Note: Average finished hog prices weighted by share of global exports
(Brazil, China, the US, Canada and EU).
Source: Rabobank, 2012
Trade disruption continues to play an important role in the
global industry. The fact that Brazil still is not allowed to export
Rabobank Pork Quarterly Q2 2012
Page 1
Jan 12
Sep 11
Jan 11
May 11
Sep 10
Jan 10
May 10
Sep 09
Jan 09
May 09
Sep 08
90
Jan 08
The global pork market is returning to a more ‘normal’ situation
now that the disease-related Asian import surge is fading. This is
mainly impacting the United States (US), where the buoyant
export growth experienced in 2011has stopped, which reflects
the declining pork prices in China. Remarkably, exports from the
European Union (EU) continued to perform strongly with an
increase of 17% in Jan-Feb 2012 compared with Jan-Feb
2011and just a slight decline (-1.5%) compared with Nov-Dec
2011, but here also some pressure can be expected in the
coming months.
Countries
May 08
In line with expectations, the Rabobank 5-nation finished hog
price index continued its declining trend in Q1 2012 with a 4.3%
lower price level in March compared with December 2011 and
14.3% lower than the latest peak in July 2011 (see Figures 1 and 2).
A recovery in Chinese production and a commensurate
reduction in imports have been the main drivers, along with
slightly higher than expected global production.
USD/kg, percent
Sep 07
Global hog prices have softened in recent weeks to the
extent that the Chinese government announced in late April
that it has initiated procurement for its frozen pork reserves.
However, hog prices are still high by historical standards in
order to offset high feed costs. With Chinese hog prices
projected to rebound at the end of the year, the prospects
remain positive, with supply discipline in the key export
markets essential to support elevated price levels. Longer
term, our view is that growth in global meat protein
consumption will continue to lag income and population
growth in important emerging markets, raising volume risks
to processors and price risks to buyers, from processors to
consumers.
Figure 1: Global average hog prices including QOQ and YOY
growth, Q1 2012
Jan 07
Rabobank expects stable, slightly pressured global hog
prices in Q2 2012, with a modest recovery in the second half
of the year. The ‘success’ of the grilling season in the
Northern Hemisphere and prospects for Asian imports will
be the key determining market factors as we move through
2012. As always, producers will need to monitor crop
production developments as we remain in a ‘no margin for
error’ feed supply situation.
In 2H 2012 the primary driving forces in the market will be
production declines in Europe against production growth in the
US and the potential for herd liquidation in China. Overall, we
currently expect a stable market barring major new events,
including crop market developments.
May 07
Global Overview
Sep 06
•
Global pork market softens to more normal levels
Asian imports are good but not as great as in 2011
Pork trade continues to be disrupted
A seasonal upswing is expected in the Northern
Hemisphere in Q2 2012
Price levels will remain elevated in 2H 2012 but economic
development and China imports are the main wildcards
Jan 06
•
•
•
•
pork to Russia and the strength of the Brazilian real are the
primary reasons for low Brazilian pork prices. Falling pork prices
have also caused farmers in South Korea and Taiwan to protest
against imports. In South Korea, the government has reduced
the quota-free import volume of bellies from the US by 50,000
tonnes to 20,000 tonnes. In Taiwan, protests started after pork
imports were allowed from countries where ractopamine is legal
and the discovery of ractopamine residues in domestic pork has
resulted in a large decline in demand and has put prices under
pressure.
May 06
2nd Quarter 2012
www.rabobank.com/far
May 2012
Regional Updates
Figure 3: Hog and sow inventory changes in China, 2009-2012
China
•
Chinese pork supply continues to recover from the 2011
drop, with 3.8.% growth in the first two months of 2012
compared with the same period of 2011. Although the hog
inventory decreased for three consecutive months from
December 2011 onwards, the sow inventory rose until
January 2012 (see Figure 3). This shows that producers held
a positive view on 2012 market potential and therefore
increased herd replenishment rates. The rising piglet price
against the falling hog and pork prices in February and
March 2012 supports this argument as farmers procure
piglets to build up stocks. Rabobank believes that the
decrease in hog inventory in the past three months was
mainly due to the impact of disease rather than economic
disincentive. Because of the disease-related piglet shortage
in early 2012, hog supply is expected to be tight in May
and June given the four month growth cycle.
Consequently, hog and pork prices will likely rebound in
the near term. The disease situation is now abating, helped
by the spring weather, and the piglet supply is gradually
recovering.
million head
•
Gross margins on the farming side are shrinking due to
falling hog and pork prices (USD 17/head in mid-April) and
strong feed prices. This is 70% lower than in the same
period in 2011 and 85% lower than the record high of
USD 120/head seen in July 2011. In contrast to the falling
hog prices, cost of production continues to rise because of
rising feed prices, the higher cost of oil and more
expensive labour. Small farmers will continue to leave the
market due to cost pressure and expectation of higher
market risks. However, due to the rapid expansion of large
hog farms, the recovery pace of the hog supply will be only
slightly affected by the departure of small farmers.
•
The new 12th Five-Year Development Plan for the Meat
Industry issued by the Ministry of Industry and
Information Technology on 24 February 2012 focuses
on the establishment of a cold chain distribution
system. Currently, the cold chain is underdeveloped;
less than 20% of total meat can be transported and
distributed via a cold chain. This is the main bottleneck
for the further development of the meat industry and
one of the most important causes of food safety issues.
The government’s aim is to improve the cold chain
distribution ratio to 30% and the cold chain
transportation ratio to 50% of total meat by 2015.
Rabobank Pork Quarterly Q2 2012
480
51
470
50
49
460
48
450
47
440
46
430
45
Hog inventory
Jan 12
Nov 11
Jul 11
Sep 11
May 11
Jan 11
Mar 11
Nov 10
Jul 10
Sep 10
May 10
Jan 10
Mar 10
Nov 09
Jul 09
Sep 09
May 09
43
Jan 09
44
410
Mar 09
420
Sow (adult fem. swine) inventory (RHS)
Source: MOA, Rabobank, 2012
•
In the week of 20 April, the National Development and
Reform Commission (NDRC) announced that the
Chinese government has initiated the procurement of
a frozen pork reserve to stabilise the pork price and
prevent losses on the farming side as the current hogto-corn price ratio is around 5.8:1. When the hog-tocorn price ratio falls below 6:1, similar initiatives will be
implemented in the future. Compared with the
previous macro control instruments in 2009, this new
initiative will increase the volume of the pork reserve at
both national and local levels. Another adjustment is
that the government will release the pork reserve when
the hog-to-corn price ratio goes above 8.5:1 to avoid
further price rises. This ratio was not included in the
2009 controls. The new policy not only takes account
of farmers' interests, but also protects the welfare of
urban low-income residents.
•
With the continuous recovery of pork production, it is
expected that hog and pork prices will generally trend
downwards, with periodic fluctuations, in the remainder of
2012 (see Figure 4). It is likely that prices will fall 15% to 20%
in the summer, the low season for meat consumption,
compared with the average level in 2011. Decreasing hog
prices will reduce the profitability of farming and slow
down hog herd replenishment and recovery in the
following winter. This will result in another rebound in hog
prices in the next peak season of consumption, which will
be Q4 2012 and early 2013.
Page 2
May 2012
Figure 4: Prices of piglets, live hogs and pork in China, 20002012
•
With demand weaker recently, our outlook for profitability
for both the producer and packer segments has declined
modestly through the end of the year, but we still expect
margins to be in the black. The two most closely watched
factors affecting profitability for the rest of 2012 will be the
fate of the corn and soy crops, and prospects for exports,
especially to China.
RMB/tonne
45,000
40,000
35,000
30,000
Figure 5: US lean hog prices, April 2007-April 2012
25,000
20,000
USD/cwt
15,000
110
10,000
100
5,000
90
0
Piglet
Live hog
80
Pork meat
70
Source: MOA, Rabobank, 2012
60
United States
•
Hog prices have dropped sharply in recent weeks, by
about 10% and close to 25% from the highs last autumn
(see Figure 5). Hog prices are still high by historical
standards, as required due to high corn and meal costs.
The biggest issue is probably exports, which seem to be
normalising after last year’s strong exports to Korea, China
and Japan. This is especially true in bellies, a product with a
high preference in South Korea and which is also a big
foodservice item. Foodservice demand in the US remains
lacklustre, impacted by weak economic growth and rising
gasoline prices. Demand at retail also seems to be
softening.
•
With the decline in hog prices, both spot and futures,
producer profitability has declined, and the ability to lock in
summertime profits has fallen precipitously. In January,
producers could have locked in profits of over
USD 20/head for this summer. Now it is barely breakeven.
•
Packers are absorbing some of the weakness in demand as
cut-out prices have dropped more than live hog prices.
Packer margins have dropped sharply in recent weeks and
may be in the red even after accounting for offal, ham
conversion, and higher margins on exports.
•
•
The USDA’s March Hogs and Pigs report showed little signs
of herd expansion, with the breeding herd up only 0.6%.
We believe producers remain cautious as we still have a ‘no
margin for error’ corn and meal cost situation and as
producers understand how dependent the market has
become on exports, which can be volatile and unreliable.
Given what is going on in the markets today, their caution
clearly has been well placed. In fact, farrowing intentions in
the March Hogs and Pigs were down for both the MarchMay and June-August time frames. Despite close to flat
breeding herd and farrowing intentions, we expect pork
production to maintain YOY increases of about 2% due to
productivity improvements.
Overall protein supplies remain tight in the US and globally
which should be supportive to pricing. YTD US animal
protein production is down 2.7%, with pork up 1%, beef
down 3.4%, and chicken down 5%. Beef production will
decline further as we move through the year. Chicken
production will come up against production declines that
began last autumn as we hit this autumn, so YOY
comparisons will level out.
Rabobank Pork Quarterly Q2 2012
50
40
2007
2008
2009
2010
2011
2012
Source: USDA, Bloomberg, 2012
EU
•
•
•
•
•
EU hog prices resumed their rising trend in February after
the normal decline after the end of year holiday season
and reached EUR 1.62/kg in March, an increase of 11% YOY
(see Figure 6). Main drivers were the slightly lower
production by an estimated 0.5% Jan-Mar, and continuing
strong export performance (+17% Jan-Feb 2012/2011).
Compared with the last two months of 2011, exports
dropped by 1.5%, with the 7.3% decline to China largely
compensated by the 3.8% increase to Hong Kong,
resulting in a 1.7% drop to both countries combined.
Slaughter numbers have been mainly down in northwest
Europe while growing in southern Europe where the large
integrators more than offset the decline observed at the
smaller, independent producers.
With the seasonal peak in combination with the
approaching European Championship Football in June and
London Olympic Games in July and piglet prices on
average 19% higher in March compared with both
December 2011 and the average from March 2006-2011, all
signs are positive for hog prices to rise further in Q2.
However, wildcards are retailer resistance to these higher
prices, pressured consumer purchasing power and
possible export pressure.
The high piglet prices show the impact of the decline of
the number of sows by 3.4% at the latest herd inventory of
1 December 2011. With the number of ‘gilts not yet
covered’ down by 5.1% on that date, hog production can
be expected to be under pressure for the remainder of the
year. Rabobank forecasts a decline of EU pork production
of 1% over 2012 as a whole. This will support continued
elevated price levels, which are needed to cover the
continuing high feed costs.
Into 2013, the main question is the impact of the partial
sow stall ban on the number of sows in 2H 2012. With
currently about 60% to 70% of sows compliant, the fact
that just nine member states have announced they will be
100% compliant by 2013 and the strict enforcement
Page 3
May 2012
announced by the European Commission, pressure on sow
numbers can be expected. However, the current high
piglet prices are encouraging the farmers who intend to
cease their activities by 2013 to continue production until
the end of 2012. This implies that EU pork production will
not be further impacted before 2H 2013.
Figure 7: Gross margin for hog production in Brazil, 2009-2012
BRL/head
140
120
100
Figure 6: EU pork prices, January 2004-March 2012
80
EUR/kg*
60
40
1.7
20
0
1.6
-20
1.5
Jan 12
Mar 12
Nov 11
Jul 11
Sep 11
May 11
Jan 11
Mar 11
Nov 10
Jul 10
Sep 10
May 10
Jan 10
Mar 10
Nov 09
Jul 09
Sep 09
May 09
Jan 09
1.4
Mar 09
-40
Note: Prices as recorded in Patos de Minas, Minas Gerais
1.3
Source: Rabobank, 2012
1.2
Jan
Feb Mar Apr May Jun
Average 2004-2009
Jul
2010
Aug Sep
2011
Oct
Nov Dec
•
The scenario was slightly brighter on the export side, with
international sales in Q1 growing by 5% YOY in spite of the
Russian ban on Brazilian pork and the difficulties in selling
to Argentina (see Figure 8). This rise in exports was mainly
driven by the increase in sales to Hong Kong (+54% YOY)
and Ukraine (+346% YOY), with the latter possibly being
used as a gateway for Brazilian pork to Russia. Although the
amount exported rose, the prices received went down by
an average 3% from last year’s levels, which, coupled with
the still strong Brazilian currency, ultimately compromised
export profitability
2012
*: Reference price
Source: European Commission, 2012
Canada
•
•
Canada’s breeding herd remains flat relative to year-ago
levels at 1.3 million head. The sow herd has hovered
around this level since the beginning of 2010 and is likely
to remain there for the foreseeable future. Future
production growth will require export growth, which is
unlikely to materialise while Canada is forced to contend
with a relatively weak US dollar. Canadian producers,
however, have gained a relative feed cost advantage as
ethanol demand has increased the basis in the US.
Figure 8: Brazilian pork exports–volumes and prices, 2009-2011
thousand tonnes
Canada’s overall pork exports are forecast to decline by
1.8% in 2012, while its imports are forecast to increase by
5.4%. YTD (January–February) pork trade with the US has
heavily favoured the US. Canada’s exports to the US are up
9.6% YTD, while imports from the US are up 38.1%. Retailers
in Canada are looking for alternative suppliers to the
consolidated Canadian industry.
Brazil pork and hog prices have decreased by 14% since
the beginning of the year despite the significant rise in
exports (+5% YOY). The weak local demand and increase in
supply have weighed especially on prices, while domestic
consumption was also negatively influenced by low beef
and poultry prices and by the Easter season, the period in
which pork consumption usually goes down. On the
supply side, farmers increased their offers in an attempt to
diminish losses as a result of low hog prices combined with
the ongoing high feed costs (see Figure 7).
Rabobank Pork Quarterly Q2 2012
300
3.50
250
3.00
2.50
200
2.00
150
1.50
100
Brazil
•
USD/kg
1.00
50
0.50
0
0.00
Volume
Price
Source: Secex, 2012
•
For Q2 2012, pork and hog prices are anticipated to remain
weak as the projected low beef price (resulting from higher
supply) continues to weigh on these products. However, a
further significant decrease may be limited by a possible
reduction in hog supplies from independent producers
combined with strong exports. The latter may accelerate
even more if Russia finally lifts its ban on Brazil as expected
by the sector in the near future. In addition, the expected
increase in poultry prices will help to set a floor for pork
and hog values. Under these circumstances, margins for
both independent producers and packing companies
should remain pressured as grain values are set to remain
high at least until the arrival of the second corn crop in
Page 4
May 2012
•
Japan
Despite the current difficult economic situation in Japan
and the fact that the demand for premium product has not
recovered, pork consumption increased for January and
February 2012 by 266,000 tonnes (+3%) compared with
the same period last year (see Figure 9).
KRW/kg
30,000
This development was even more surprising given that
retail prices were flat, with domestic loins selling at JPY
2,500/kg (USD 31/kg) and imported loins at JPY 1,600/kg
(USD 20/kg) and despite declining wholesale carcass prices
(Tokyo Market). The 2012 wholesale March price for
average grade dropped to JPY 324/kg (USD 4/kg), 15%
lower than last year.
Figure 9: Japanese pork consumption, 2009-2012
5,000
Farm Price
percent
200
60
180
80
40
Jan 12
Jul 11
Oct 11
Jan 11
Apr 11
Jul 10
Oct 10
Jan 10
Apr 10
Jul 09
Oct 09
0
Jan 09
Apr 09
Jan 12
Mar 12
Nov 11
Jul 11
Sep 11
May 11
Jan 11
Mar 11
Meanwhile, Taiwanese pork prices have dropped by almost
30% to TWD 50/kg (USD 1.7/kg) since December 2011. At
current prices, farmers lose an estimated TWD 15/kg (USD
0.5/kg) per animal, given high production costs. Despite
government assurance measures to stimulate demand, the
country's pig farmers worry that pork prices might remain
low until mid-2013.
•
According to the Taiwanese pig farm association, about
50% to 60% of the country's pig farmers may go bankrupt
by the end of 2012 if this situation does not improve. This
could reduce the current herd size of 6.3 million head to 4
million. If such a scenario materialises, the supply shortage
will be filled by massive imports.
10
20
Jul 08
Nov 10
•
20
60
Oct 08
Jul 10
The Taiwanese pork industry has been experiencing one of
its worst crises ever since ractopamine residues were found
in domestic pork. As a consequence, consumers are
shifting to imports, which are considered safer. Ironically,
these imports may also be from countries where
ractopamine is used legally. For example, the EU has
banned pork imported from the U.S due to the use of
ractopamine among other things. Despite strong
controversy and protests by farmers, the government (or
retail) has not made a statement at this stage to stop the
import and sale of pork which may have been treated with
ractopamine.
30
100
Jan 08
Sep 10
•
40
120
Apr 08
Consumer price
Source: Korea Meat Trade Association, 2012
50
160
140
Import share in total consumption
Source: Japan ALIC, 2012
South Korea
•
South Korean hog inventory continues to recover and has
now reached 8.1 million head as of December 2011, a 4%
increase from Q1 2011. However, this growth is slower than
the 6% experienced in Q3 2011. We believe it is unlikely
that South Korea will recover to the pre-crisis level of
9.8 million head in the near future.
•
The combination of production recovery, a sluggish
economy which pressures consumption and high import
Rabobank Pork Quarterly Q2 2012
Wholesale price
Taiwan
thousand tonnes
Consumption
May 10
0
Jan 10
Given current market signals, it is likely that pork demand
gained momentum against more expensive beef, and that
2012 imports may rise above the five-year average of
760,000 tonnes.
10,000
Mar 10
•
15,000
Nov 09
The lower prices did not deter imports, with volumes
already reaching132,000 tonnes in the first two months of
2012, 10%more than the same period last year.
20,000
Jan 09
•
25,000
Jul 09
•
Figure 10: South Korea pork price, January 2009-March 2012
Sep 09
•
Strong farmer protests channeled by the Korea Swine
Association (KSA) resulted in the reduction of the
previously agreed volume of 70,000 tonnes of tariff-free
pork belly imports from the US down to 20,000 tonnes. KSA
represents 90% of South Korean pig growers. Given rising
feed costs, the South Korean government will have a hard
time maintaining farmers’ profitability and containing
consumer price inflation. Moreover, the government
agreed to earmark KRW 100 billion (USD 88.7 million) for
buying up pork when the price falls below production cost.
May 09
•
levels has resulted in a drop in South Korean pork prices of
about 20% in Q1 2012 compared to Q1 last year. This also
means that unsold volumes were added to cold storage
inventories (see Figure 10).
Mar 09
Brazil. However, companies focused on processed
products will be in a better position than their counterparts
whose sales are concentrated on fresh pork.
For Q3 and Q4, pork and hog prices should slightly recover
from Q2 levels on the back of the anticipated increase in
cattle and beef prices (that is also expected to be modest)
and the seasonal rise in demand. Additional fuel may come
from a possible acceleration in exports in the wake of an
increase in the number of plants allowed to export to
China. Currently only three plants are allowed to export but
another four are about to be granted an export permit.
Page 5
May 2012
Mexico
•
production growth, reaching 1.19 million tonnes versus
1.18 million tonnes in 2011.
During 2011, consumer pork prices in Mexico increased
4.6%, more than poultry prices, which rose 3.5%. The
upward trend in pork prices has continued in early 2012,
pushing Q1 2012 average prices 9% over year-ago levels. In
Q1, carcass prices increased 23.4% while hog prices went
up 8.5% (see Figure 11).
Figure 11: Mexican hog (live) and pork (cwe) prices, 2010-2012
•
In 2012, economic growth and price dynamics will revive
pork per capita consumption, allowing it to show a
marginal increase. This year we expect total domestic
consumption to reach 1.776 million tonnes, versus 1.746
million tonnes in 2011.
•
Mexican pork is gaining access into international markets
such as Japan, South Korea and the US. During 2010 and
2011, Mexican exports grew consistently around 10% each
year. Furthermore, in April, the Chinese government
certified five Mexican meat producers which will begin
exporting pork meat to China.
MXN/kg
45
40
35
Russia
30
•
25
20
15
Live hogs
Mar 12
Jan 12
Nov 11
Sep 11
Jul 11
May 11
Mar 11
Jan 11
Nov 10
Sep 10
Jul 10
May 10
Mar 10
Jan 10
10
Meat
Figure 13: Live hog prices in Russia per region, 2009-2012
RUB
Source: Confeporc, SNIIM, 2012
•
The continued spread of African Swine Fever (ASF) reduced
the growth of Russian pork production in 2011 to 3.9%
compared to the 6.9% CAGR from 2005 to 2011. As a result,
hog prices increased gradually in all regions with the
highest growth in Asia supported by strong Chinese
import demand (see Figure 13)
160,000
The increase in pork prices during 2012 has given strong
incentives to increase imports. Just to illustrate, in Q1 2012
ham imports (the most relevant Mexican pork meat
import) increased 15% YOY (see Figure 12). This upward
trend is in contrast with 2011 pork imports, which dropped
around 10% YOY.
140,000
120,000
100,000
80,000
60,000
Figure 12: Mexican ham imports, 2010-2012
40,000
2009
Central
Oeral
South
thousand tonnes
40
35
2010
2011
Northeast
Siberia
Northern Caucasus
2012
Volga
Asian region
Source: Sagarpa, 2012
30
•
With strong domestic demand, Russian imports increased
by 40,000 tonnes to 946,000 tonnes (+ 3.3%). The
continued ban on Brazilian product created opportunities
for alternative suppliers, mainly the EU and Canada, which
increased their market shares by 6% to respectively 52%
and 16%. ASF mainly affects backyard farms and outdated
agricultural enterprises the share of in total inventory
dropped by 3% to 30% of the total 17.3 million head
inventory.
•
The ratification of the WTO accession by Russian officials,
which is expected to take place this summer, will reduce
the in-quota rates to zero and out-of-quota to 65% from
the current 15% and 75%, respectively. As of 2020, the tariff
will be replaced by a general flat rate of 25%. This implies
that the Russian accession will not have a relevant impact
on pork imports and prices in the coming years. In
combination with the reduction of the quota in 2012 by
70,000 tonnes to 430,000 tonnes, import pressure will
remain limited, which will be positive for domestic
production.
25
20
2010
Dec
Nov
Oct
Sep
Ago
Jul
Jun
May
Apr
Mar
Feb
Jan
15
2011
Source: Sagarpa, 2012
•
The increase in imports during 2012 has eliminated some
price pressure. At the end of March, consumer pork prices
decreased and have stayed relatively flat throughout April.
For 2012, we expect pork prices (at the consumer level)
and hog prices to increase around 5% to 7% YOY.
Furthermore, if feed costs continue to lose momentum,
pork producers will face a profitable year.
•
For Q2 2012, we expect a pork production increase of
around 0.57% YOY. For the full year, we expect 0.7%
Rabobank Pork Quarterly Q2 2012
Page 6
May 2012
•
With tariffs for live hogs to fall from 40% to 5% after WTO
accession, Russian live hog imports from the EU may
increase sharply. However, the ban on live imports from
the EU for alleged veterinary health concerns on 2 March
can be seen as an example of protectionist measures that
may take place going forward. In addition, Russia has
announced in advance of joining the WTO that it plans to
renegotiate a higher tariff and has suggested that it will use
the WTO safeguard mechanism when live imports surge
after accession. Due to inconsistencies in its commitments
and statements, it cannot be assumed that Russia will
resume live imports after accession.
•
Until WTO accession, Russian pork prices will remain
elevated with slower but growing domestic production
with the potential for live animal imports.
to capture back some of the lost ground with a resulting positive
impact on the shares. The exception is China, where the
combination of low supply and food safety scandals by two
processors resulted in a more or less stable share performance
after a steep decline in 1H 2011.
In Q1 2012 this development continued with the relatively
unexpected drop in Chinese pork prices towards the end of the
quarter. The resulting decline of US exports had an immediate
impact on processors in China and North America.
Pressure on pork processor margins can be expected to continue
in Q2 2012. In the US and China this will be due to the
continuing difficult export performance, while in the EU,
processors will not be able to forward part of the elevated pig
prices.
Chile
•
In Q1 2012, Chilean pork exports reached USD 95.6 million,
which is a 10% increase in value and an almost 12%
increase in volume, or nearly 26,000 net tonnes, compared
to the same period in 2011. Remarkably, during this period,
exports to Russia underwent an almost threefold increase
in volume, reaching 2,900 net tonnes and a 228% increase
in value, totalling USD 7.8million.
•
Due to the start-up of Agrosuper’s Huasco project in
December 2011, the country’s sow herd increased by
15,000 head, resulting in an additional 4,100 tonnes of pork
per month. This has triggered a notable squeeze in the
domestic hog prices, which decreased by circa 30%
between December 2011 and April 2012. On the other
hand, it seems that retailers are not lowering pork prices,
under the auspice of ‘protecting’ the price of beef, which is,
in most cases, imported directly. This implies that
producers are going through a hard period with
continuing high costs.
Industry comments
For most pork processors, 2011 was a relatively disappointing
year with margin pressure due to the difficulty of passing on the
high prices. Especially during spring and summer this resulted in
squeezed margins, as confirmed by the pressure on share
performance in all regions globally (see Figure 14).
Figure 14: Indexed share performance of listed pork companies,
average per region, January 2011-April 2012
January 2011 = 100
20
10
0
-10
-20
-30
-40
North America
Brazil
EU
Apr 12
Feb 12
Mar 12
Jan 12
Dec 11
Nov 11
Oct 11
Sep 11
Jul 11
Aug 11
Jun 11
May 11
Apr 11
Mar 11
Jan 11
Feb 11
-50
China
Source: Bloomberg, 2012
With more or less stabilising prices towards the end of the year
and an even stronger focus on efficiency, processors where able
Rabobank Pork Quarterly Q2 2012
Page 7
May 2012
Rabobank International
Rabobank Food & Agribusiness Research and
Advisory Animal Protein Global Sector Team
Analysts
US – David C. Nelson
[email protected]
US – Ethan Hendricks
[email protected]
US – Don Close
[email protected]
Brazil – Guilherme Melo
[email protected]
North East Asia – Chenjun Pan
[email protected]
North East Asia – Jean-Yves Chow
[email protected]
EU & Russia – Albert Vernooij
[email protected]
EU – Gorjan Nikolik
[email protected]
EU – Nan-Dirk Mulder
[email protected]
Mexico – Pablo Sherwell
[email protected]
New Zealand – Rebecca Redmond
[email protected]
Chile – Valeria Mutis
[email protected]
www.rabobank.com
This document is issued by Coöperatieve Centrale Raiffeisen-Boerenleenbank B.A. incorporated in the Netherlands,
trading as Rabobank International (“RI”). The information and opinions contained in this document have been
compiled or arrived at from sources believed to be reliable, but no representation or warranty, express or implied,
is made as to their accuracy, completeness or correctness. This document is for information purposes only and is
not, and should not be construed as, an offer or a commitment by RI or any of its affiliates to enter into a
transaction, nor is it professional advice. This information is general in nature only and does not take into account
an individual’s personal circumstances. All opinions expressed in this document are subject to change without
notice. Neither RI, nor other legal entities in the group to which it belongs, accept any liability whatsoever for any
loss howsoever arising from any use of this document or its contents or otherwise arising in connection therewith.
This document may not be reproduced, distributed or published, in whole or in part, for any purpose, except with
the prior written consent of RI. All copyrights, including those within the meaning of the Dutch Copyright Act, are
reserved. Dutch law shall apply. By accepting this document you agree to be bound by the foregoing restrictions.
© Rabobank International Utrecht Branch, Croeselaan 18, 3521 CB, Utrecht, The Netherlands +31 30 216 0000
Rabobank Pork Quarterly Q2 2012
Page 8
Download