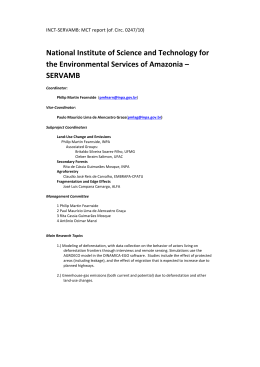
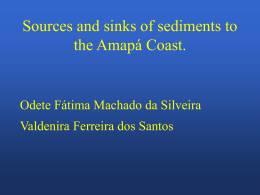
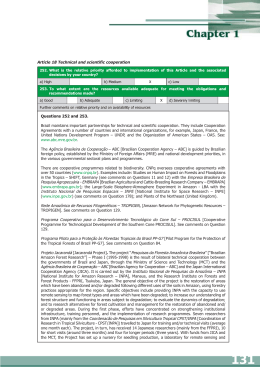
ISSN 1415-4765
TEXTO PARA DISCUSSÃO Nº 828
EXPLAINING AGRICULTURE EXPANSION
AND DEFORESTATION: EVIDENCE FROM
THE BRAZILIAN AMAZON — 1980/98*
Claudio Ferraz**
Rio de Janeiro, outubro de 2001
* This paper is part of the World Bank project “Making Long Term Growth More
Sustainable”. I would like to thank Mohan Munasinghe and Jorge Araújo (project
coordinators), Eustáquio J. Reis and Ronaldo Seroa da Motta for extensive comments
and discussions. I also thank Edward Barbier, Sergio Margulis, Octávio Tourinho, Sven
Wunder and Carlos Young for comments on a previous version and Rosane Campos,
Alexia Rodrigues and Luiza de Camaret for research assistance. All the views expressed
in the paper, as well as any remaining errors, are my responsibility alone.
** From Diretoria de Estudos Macroeconômicos do IPEA and University of California,
Berkeley.
[email protected]
MINISTÉRIO DO PLANEJAMENTO, ORÇAMENTO E GESTÃO
Martus Tavares - Ministro
Guilherme Dias - Secretário Executivo
Presidente
Roberto Borges Martins
Chefe de Gabinete
Luis Fernando de Lara Resende
DIRETORIA
Eustáquio José Reis
Gustavo Maia Gomes
Hubimaier Cantuária Santiago
Luís Fer nando Tironi
Murilo Lôbo
Ricardo Paes de Barros
Fundação pública vinculada ao Ministério do Planejamento, Orçamento
e Gestão, o IPEA fornece suporte técnico e institucional às ações
governamentais e disponibiliza, para a sociedade, elementos necessários
ao conhecimento e à solução dos problemas econômicos e sociais do
país. Inúmeras políticas públicas e programas de desenvolvimento
brasileiro são formulados a partir de estudos e pesquisas realizados
pelas equipes de especialistas do IPEA.
Texto para Discussão tem o objetivo de divulgar resultados
de estudos desenvolvidos direta ou indiretamente pelo IPEA,
bem como trabalhos considerados de relevância para disseminação
pelo Instituto, para informar profissionais especializados e
colher sugestões.
Tiragem: 130 exemplares
DIVISÃO EDITORIAL
Supervisão Editorial: Helena Rodarte Costa Valente
Revisão: Alessandra Senna Volkert (estagiária), André Pinheiro,
Elisabete de Carvalho Soares, Lucia Duarte Moreira,
Luiz Carlos Palhares e Miriam Nunes da Fonseca
Editoração: Carlos Henrique Santos Vianna, Rafael Luzente
de Lima, Roberto das Chagas Campos e Ruy Azeredo de
Menezes (estagiário)
Divulgação: Libanete de Souza Rodrigues e Raul José Cordeiro Lemos
Reprodução Gráfica: Cláudio de Souza e Edson Soares
Rio de Janeiro - RJ
Av. Presidente Antonio Carlos, 51, 14º andar - CEP 20020-010
Tels.: (0xx21) 3804-8116 / 8118 – Fax: (0xx21) 2220-5533
Caixa Postal: 2672 – E-mail: [email protected]
Brasília - DF
SBS. Q. 1, Bl. J, Ed. BNDES, 10º andar - CEP 70076-900
Tels.: (0xx61) 3315-5336 / 5439 – Fax: (0xx61) 315-5314
Caixa Postal: 03784 – E-mail: [email protected]
Home page: http://www.ipea.gov.br
ISSN 1415-4765
© IPEA, 2000
É permitida a reprodução deste texto, desde que obrigatoriamente citada a fonte.
Reproduções para fins comerciais são rigorosamente proibidas.
SUMÁRIO
RESUMO
ABSTRACT
1 - INTRODUCTION..........................................................................................1
2 - DEFORESTATION, LAND USE CHANGE AND ECONOMIC
GROWTH.......................................................................................................4
2.1 - The Evolution of the Causes of Deforestation .......................................7
2.2 - The Social Costs of Deforestation........................................................14
3 - THE EMPIRICAL MODEL AND ECONOMETRIC
SPECIFICATION........................................................................................15
4 - THE DATA..................................................................................................19
5 - ESTIMATION RESULTS ..........................................................................21
5.1 - Estimation Results for the Cattle Head Density...................................22
5.2 - Estimation Results for the Agriculture Cleared Area...........................26
6 - CONCLUDING REMARKS .......................................................................30
REFERENCES ..................................................................................................34
RESUMO
O desflorestamento na Amazônia aumentou significativamente durante os últimos
20 anos. Aproximadamente 400.000 km2 de florestas tropicais foram devastados
entre 1978 e 1998, sendo a sua maioria convertida em pastagens e lavouras. Este
trabalho usa dados de painel de oito estados da Amazônia, de 1980 a 1998, para
estimar um modelo dos determinantes da expansão da área plantada e de cabeças
de gado na região. Os resultados mostram que a expansão da área plantada está
associada a variações de preços da terra, crédito agrícola e estradas, enquanto o
aumento do número de cabeças de gado está determinado principalmente pela
redução do preço do boi e pela expansão da malha rodoviária.
ABSTRACT
The extent of deforestation in the Brazilian Amazon grew significantly in the last
20 years. Approximately 400,000 km2 of tropical forest were cleared from 1978 to
1998. Land conversion to pasture and crop areas were the main sources of
deforestation, though the contribution of logging increased significantly in the
nineties. This paper uses panel data for eight states of the Brazilian Amazon, from
1980 to 1998, to estimate a model of the determinants of crop area and cattle herd
expansion within the region. Results show that the expansion of crop area is
determined by changes in land prices, government agriculture credit and roads
while the growth of cattle herd is mainly driven by the decrease in the price of
cattle head and the expansion of the road network.
EXPLAINING AGRICULTURE EXPANSION AND DEFORESTATION: EVIDENCE FROM THE BRAZILIAN
AMAZON — 1980/98
1 - INTRODUCTION
The Brazilian Amazon is regarded as one of the most important ecosystems in the
world containing near 50% of the known biodiversity in the planet. It comprises
an area of near 5 million squared kilometers of which approximately 70% are
continuous forest domain. Due to its vast unclaimed territory, it has attracted
migrants from other regions of the country searching for agricultural land.
Nonetheless, it remains a frontier region. Because of its large distance from main
centers and due to dense forest areas, almost 85% of its original forest cover is
still intact.
Several attempts for development were undertaken by the Brazilian government
since the beginning of the sixties. In order to integrate the northern region to the
rest of the country a series of highways were constructed starting with the BelémBrasília, followed by the Cuiabá-Santarém and the Tranzamazônica [Mahar
(1988) and Moran (1996)]. Additionally numerous settlement projects were
undertaken in regions near the new highways which were meant as a substitute for
the lack of agrarian reform and massive demand for land in other regions of the
country [Almeida and Campari (1995)]. Large amounts of subsidized credit were
given for agriculture and cattle ranching activities and huge development projects
such as the Carajás project were undertaken [Reis (1996)]. Nonetheless, these
efforts were not successful in generating a sustainable growth process in the
region. Although the regional GDP has grown substantially in the last 20 years,
the Amazon is still characterized by poverty and unequal income and land
distribution. Moreover, the pattern of growth is generating an unsustainable
deforestation process that can jeopardize future economic potentials.
The extension of deforestation has grown significantly during the past 20 years.
Approximately 400,000 km2 of tropical forest were cleared between 1978 and
1998 according to satellite image estimates.1 Moreover, the increasing forest fires
and selective logging activities, which are not captured by satellite images, could
imply that the extension of the deforested area is even larger.2
The causes of the increasing deforestation trend are closely related to government
policies adopted in the past. Mahar (1988) and Binswanger (1991), describe
government policies that have induced and aggravated the economic incentives for
forest clearing. Among others, subsidized credit, tax breaks for agriculture and
cattle ranching activities, land titling processes in open access areas and highway
constructions are described as the main policies that created incentives for
settlement, and at the same time, agriculture land clearing in the Amazon region.
The macroeconomic environment generated additional incentives for deforestation
through high interest rates and uncertainty derived from high inflation rates. The
1
This estimates are based on INPE (2000) subtracting the estimated cleared area in 1998 from the
estimated cleared area in 1978.
2
See Fearnside (1996) for a comparison of deforestation estimates.
1
EXPLAINING AGRICULTURE EXPANSION AND DEFORESTATION: EVIDENCE FROM THE BRAZILIAN
AMAZON — 1980/98
prevailing high price of land decreased the incentive for smaller farmers to buy
land and increased the incentives for migrating to the frontier generating a race for
property rights. This movement was undertaken for acquiring land in order to
develop an agriculture activity, and also as a way to speculate, expecting future
rises in the land prices and capital gains.3
Since the mid-eighties, several government policies have changed. Agriculture
credit subsidies have decreased considerably, tax exceptions have been reduced
drastically, direct colonization settlements have terminated and large infrastructure
projects have been phased out. Nevertheless, deforestation has not slowed down.
The building of new paved and the pavement of existing roads are regarded as one
of the main factors driving the persistence of the deforestation process. In some
cases, roads create fresh access to new settlements in frontier regions. More often,
however, they drastically reduce transportation costs in earlier settled areas thus
relieving one of the main restrictions to the profitability of agro pastoral activities
in the Amazon context. Alves (1999) estimates that between 1991 and 1996,
more than 75% of the total cleared area near the three major road networks
occurred with a 50 km distance from the roads. 4 The clearing and appropriation of
open access areas adjacent to paved roads also contribute for a substantial portion
of deforestation, especially when initial non-paved roads were opened by logging
purposes. Additional incentives for deforestation were created by the contradictory
policies of government agencies such as the Brazilian Renewable Resource
Institute (Ibama) and the Agrarian Reform Institute (Incra). While the Ibama
obliges all properties in the Amazon to retain 80% of their forest area, the Incra
will often consider a property that follows this rule as unproductive and thus
susceptible to expropriation [Alston, Libecap and Mueller (2000)].
The macroeconomic policies adopted during the nineties may have exacerbated
the prevailing institutional failures. Stabilization macro policies may have
increased incentives for deforestation through high interest rates and low credit
availability that could have had a significant impact on the choice for land
clearing. Theoretically speaking, the impact of interest rate on deforestation is
ambiguous, increases in interest rate make a large owner postpone investment in
agriculture and cattle ranching and tends to decrease new land clearing. On the
other hand, for small owners and agents living in the frontier an increase in
interest rates increases the cost of capital generating a negative income effect that
could have effects of increasing frontier settlement. This could help explain why
deforestation by small holders increased in the Amazon during the nineties.
The objective of this paper is to analyze the causes of frontier expansion and
deforestation in the Brazilian Amazon in the eighties and nineties. The analysis
3
For a description and analysis of this process see Alston, Libecap and Schneider (1995) and
Schneider (1995).
4
Moreover, Alves (1999) also seem to indicate that major deforestation processes are taking place
near pioneer deforestation areas that were opened up in the eighties.
2
EXPLAINING AGRICULTURE EXPANSION AND DEFORESTATION: EVIDENCE FROM THE BRAZILIAN
AMAZON — 1980/98
uses annual data, from 1980 to 1998, for eight states of the region5 to explain the
expansion of crop areas and cattle herds. The paper undertakes panel data
estimation of the causes of deforestation using as explanatory variables output and
input prices, government credit, road extension, distance and soil quality.
Previous econometric studies of tropical deforestation in the Amazon used crosssection [Reis and Guzmán (1993)] or panel data models, based upon municipal
data from the Brazilian Agricultural Census published every five years except for
1990 when the census survey was not undertaken [Reis (1996)]; Andersen,
Granger and Reis (1997); Young (1996)]. Another approach was undertaken by
Reis and Margulis (1991) and Pfaff (1999), combining agricultural census data
with satellite image data. None of the previously mentioned empirical analysis,
however, went beyond the mid-eighties. Moreover, to incorporate the 1995/96
Agricultural Census data is not an easy task because of methodological changes
that created problems of comparison with the previous 1985 Agricultural Census.6
This paper uses a new database which combines state level data from two annual
agricultural surveys undertaken by IBGE — Pesquisa Agrícola Municipal (PAM),
and Pesquisa Pecuária Municipal (PPM) and data on agricultural credit and roads
from other government sources with FGV (Fundação Getúlio Vargas) data on crop
and factor prices in agriculture and cattle activities. This data enable us to update
the analysis of deforestation process in the Amazon up to the late-nineties. An
additional contribution of the paper is the improved specification of the estimation
procedure using fixed-effect and panel corrected standard error models, allowed
by the use of time series cross-section data, notwithstanding the fact that the time
span of the sample — 19 years — is still short.
A disadvantage of using the PAM and PPM is that the data on cropped areas from
and cattle herds are less precise estimators of deforestation compared to the
consistent land use categories of the Agricultural Census. Cropped areas do not
necessarily lead to clearing and deforestation, since fallow lands could be
available for use. The same is true for pasture areas. However, for cattle rising,
even pasture areas will have to be inferred from the size of herds, the only
information available. Therefore, we have to assume a stable relation between
herds and pasture areas or intensity of grazing.
The theoretical background model used is based upon Reis and Guzmán (1993),
Deacon (1995), Angelsen (1997), Cropper, Griffiths and Mani (1999) and Barbier
(1999). The land clearing process is simply modeled as an interaction of demand
and supply of cleared land for agriculture and a reduced form for the demand of
cleared agriculture land is obtained. Although this model does not take into
account important dynamic issues such as land speculation, we believe it is
5
The region defined as the Legal Amazon comprises of the states of Acre, Amapá, Amazonas,
Maranhão (west of the 44o W), Mato Grosso, Pará, Rondônia, Roraima and Tocantins.
Nevertheless, data on the state of Amapá was not available for the whole analyzed period.
6
See Helfand (1999) for a comparison of the 1995 census results with the PAM.
3
EXPLAINING AGRICULTURE EXPANSION AND DEFORESTATION: EVIDENCE FROM THE BRAZILIAN
AMAZON — 1980/98
realistic and simple enough to motivate the economic determinants of
deforestation in the Amazon.
This study has several contributions. First, it explores the time-series cross-section
structure of our data estimating OLS, fixed and random effects and panel
corrected standard error models. Second, it generates elasticities for changes in percentage
of crop area and density of cattle with respect to prices, credit and roads (variables that are
influenced directly by the government).
2 - DEFORESTATION, LAND USE CHANGE AND ECONOMIC
GROWTH
The extension of deforestation has grown significantly during the past 20 years.
Approximately 400,000 km2 of tropical forest were cleared between 1978 and
1998 according to satellite image estimates.7
In Table 1 we present the extension of deforestation in km2 for selected years
showing that from 1978 to 1988, approximately 225,000 km2 of forest were
cleared. For some states like the Amazonas and Roraima, the growth in the cleared
areas was above 1,000%.
The growth in deforestation decreased for the whole Amazon region during the
1988/98. Nonetheless, still approximately 174,000 km2 of forests was cleared in
this period. In the states of Amapá, Mato Grosso and Roraima, the extension of
deforestation actually increased during the nineties and for Acre and Rondônia, it
remained relatively stable.
Table 1
The Extension of Deforestation in the Brazilian Amazon: 1978, 1988 and
1998
(Km2)
States
1978
Acre
Amapá
Amazonas
Maranhão
Mato Grosso
Pará
Rondônia
Roraima
Tocantins
Total
% Growth in
Deforested Area
1978/88
% Growth in
Deforested Area
1988/98
1988
1998
2,500
200
1,700
63,900
20,000
56,400
4,200
100
3,200
8,900
800
19,700
90,800
71,500
131,500
30,000
2,700
21,600
14,714
1,962
28,866
100,590
131,808
188,372
53,275
5791
26,404
256.0
300.0
1,058.8
42.1
257.5
133.2
614.3
2,600.0
575.0
65.3
145.3
46.5
10.8
84.3
43.2
77.6
114.5
22.2
154,178
379,488
553,780
146.1
45.9
Source: INPE (2000).
7
These estimates are based on INPE (2000) subtracting the estimated cleared area in 1998 from
the estimated cleared area in 1978.
4
EXPLAINING AGRICULTURE EXPANSION AND DEFORESTATION: EVIDENCE FROM THE BRAZILIAN
AMAZON — 1980/98
Table 2 presents data from the 1985 and 1996 Agriculture Censuses.
Decomposing the major land uses and comparing their evolution, it is found that
approximately 145,837 km2 of land clearing occurred between 1985 and 1995/96
(this is close to the value of 174,292 obtained by satellite estimates if we subtract
the extension of deforestation in 1998 from the value in 1988).8 The area of
planted pasture increased from 298,423 km2 in 1985 to 477,273 km2 in 1996,
representing an increase of approximately 60% in 10 years.
Table 2
Land Use in the Brazilian Amazon: 1985 and 1996 (Area in km2)
Land Use
Perennial Crops
Annual Crops
Planted Forest
Planted Pasture
Fallow Land
Productive Land not Used
Total Cleared Area
1985
10,183.27
79,735.44
3,031.78
298,423.46
43,517.64
114,754.61
1,378,194.56
1996
10,788.24
70,604.42
5,800.30
477,273.20
29,030.27
74,275.44
1,524,032.00
Source: IBGE agriculture census 1985 and 1995. The Brazilian Amazon considered here includes the state
of Maranhão and the state of Goiás.
In this study, we use annual data for crop area and the number of cattle heads as
indicators of deforestation. A disadvantage of using the PAM and PPM is that the
data on cropped areas from and cattle herds are less precise estimators of
deforestation compared to the consistent land use categories of the Agricultural
Census. Cropped areas do not necessarily lead to clearing and deforestation, since
fallow lands could be available for use. The same is true for pasture areas. For
cattle rising, even pasture areas will have to be inferred from the size of herds, the
only information available. Nonetheless, there is a close correlation between the
evolution of crop area and cattle heads and the extension of deforestation
[Andersen et alii (1996)].
In Figure 1 we present the evolution of the total crop area and the total number of
cattle heads in the region as obtained by the PAM and PPM. We observe a
dramatic increase in both proxies for deforestation during the 20-year period;
although the trend of cattle head is more stable.
Logging is currently considered an important source of deforestation in the
Amazon. Although it is hard to measure the exact amount of extracted timber due
to illegal and unreported logging, Table 3 presents the volume of timber extracted
in the Brazilian Amazon for the years 1980, 1985, 1990, 1995 and 1999 as
estimated by the Brazilian Statistical Office (IBGE). The volume of timber
8
Although there are some problems of comparability between both census. A general trend can be
inferred by comparing their results. For a description of the change of methodology that was
undertaken by IBGE for the 1995/96 census and its possible consequences see Helfand (1999).
5
EXPLAINING AGRICULTURE EXPANSION AND DEFORESTATION: EVIDENCE FROM THE BRAZILIAN
AMAZON — 1980/98
extraction increased by 345% between 1980 and 1995, but after 1995, the IBGE
figures suggest that the amount of timber extracted decreased considerably.9
Figure 1
Evolution of Crop Area and Cattle Head in the Brazilian Amazon: 1979-1999
Crop area (1000 hectare)
Number of cattle heads (1000)
56657.5
Crop area (1000 hectare)
Number of cattle heads (1000)
11246.4
5814.62
24463.3
1979
1999
Year
Table 3
Timber Extraction in the Brazilian Amazon
(In 1,000 m3)
Year
1980
1985
1990
1995
1999
Volume of Timber Logs Extracted
11,720.7
23,960.0
46,310.3
52,285.6
16,535.6
Source: IBGE Extraction Survey.
9
Although the estimations undertaken from the IBGE are highly controversial, they are very close
to the result obtained by Veríssimo, Arima and Lima (2000) from a field survey undertaken in a
sample of sawmills throughout the Amazon. They estimate an extraction of 27,8 millions of m3 for
the period 1997/96. In contrast, the IBGE estimates that for 1996 approximately 43,980,000 m3
were extracted from the Amazon region while in 1997 this value decreased to 20,694,000 m3. An
average between these two values would be quite close to the Veríssimo, Arima and Lima (2000)
estimates.
6
EXPLAINING AGRICULTURE EXPANSION AND DEFORESTATION: EVIDENCE FROM THE BRAZILIAN
AMAZON — 1980/98
2.1 - The Evolution of the Causes of Deforestation
The economic literature on deforestation, summarized by Kaimowitz and
Angelsen (1998), separates the variables affecting the land clearing process into
three different levels: underlying causes, immediate causes and sources of
deforestation. Underlying causes are related to macro level variables and are
generally thought as income, population and macroeconomic policies. In this
level, increasing rural population density and GDP per capita are usually blamed
as the most important factors driving the deforestation dynamics [Cropper and
Griffiths (1994) and Cropper, Griffiths and Mani (1999)]. Nevertheless, the
evidence is somewhat mixed once other important variables are included in the
econometric analysis [Angelsen and Kaimowitz (1999)].
Existent evidence for the Brazilian Amazon seems to support the hypothesis of
rural population migrations having a large effect only in opening new frontier
areas. Pfaff (1999) find that once the area is occupied, increasing population
density, controlling for other variables, have a negligent effect on land clearing
expansion. It is important to note that population is actually an endogenous
variable and migrations occur as a response to economic incentives. An alternative
model is used by Andersen, Granger and Reis (1997) who explains migrations
based on a set of economic variables. Nonetheless, after controlling for other
characteristics including neighbor change in clearing, rural population density is
not found to be statistically significant.
The Amazon region GDP grew by an average of 15% per year from 1970 to 1980
and income per capita more than doubled. Economic growth was obtained in the
Amazon through the establishment of colonization projects in the region and the
massive infrastructure investment and credit concessions. The leading sector in
this boom was the industry with an average growth rate of 26% per year motivated
by the creation of the Manaus Free Export Processing Zone. The share of industry
in local production increased from 15% in 1970 to an impressive 40% in 1980
[Reis and Blanco (1996)].
During the eighties and nineties, the growth was maintained, but there was a
substantial difference among states. Industrial growth was not widespread and in
some states, agriculture activities were the main factor motivating growth. In
Table 4 we show the average and the cumulative GDP growth for each state of the
Legal Amazon from 1985 to 1997. We also include the agriculture GDP growth as
a mean of comparison. The first important observation is that the most
industrialized state, Amazonas, had a low average growth rate while other states
such as Acre and Rondônia that depend mostly on agriculture, cattle and
extraction had average growth rates over 4%. We also observe that the states with
the highest growth rates, Roraima and Amapá, also had a highest agriculture GDP
growth (based on agriculture and cattle ranching, both activities which induce
deforestation). This pattern seems to be confirmed when we compare Table 4 with
7
EXPLAINING AGRICULTURE EXPANSION AND DEFORESTATION: EVIDENCE FROM THE BRAZILIAN
AMAZON — 1980/98
Table 1. The states that presented the highest agriculture GDP growth also had the
highest deforestation growth rate between 1988 and 1998.
Table 4
GDP Growth Rates in the Amazon Region States between 1985 and 1997
State
Acre
Amapá
Amazonas
Maranhão
Mato Grosso
Pará
Rondônia
Roraima
Tocantins
Amazon region
GDP Average
Growth Rate
4,86
6,72
0,56
1,05
2,91
2,68
4,01
7,20
2,53
3,61
Cumulated
Cumulated GDP Agriculture GDP
Growth Rate
Average Growth Agriculture GDP
Growth Rate
Rate
58,31
80,65
6,77
12,56
34,96
32,17
48,11
86,34
30,41
0,31
11,02
0,50
0,94
2,68
5,14
4,57
16,98
0,22
4,71
3,71
132,20
6,06
11,24
32,13
61,65
54,85
203,82
2,65
Source: Silva and Medina (1999).
Despite the significant growth in GDP, high inequality in income and land is still
present in the region. The Gini coefficient for land in the northern region of Brazil
decreased from 0.86 in 1975 to 0.79 in 1985 [Schneider (1995)], but it is still one
of the largest in the world. Additionally, land and environmental degradation and
the lack of rural development have generated a massive migration to urban areas
creating additional problems.
The urban population in the Amazon region increased considerably during the
nineties. In 1991, 44% of the population in the Amazon was rural. In 2000, the
preliminary results from the IBGE census indicate that this proportion decreased
to 32%. Moreover, the urban population in the Amazon region increased in an
average of 5.9% per year while for Brazil as a whole the urban population
increased by an average of 2.7% per year. An important point is that the largest
growth in urban population occurred in Amapá and Roraima, states which are both
agriculture related activities. This could be an indication of a rural-urban
migration process that may be occurring due to unsustainable pattern of
agriculture production and poor living conditions in remote rural areas.
Macro variables affect immediate causes, which can be described as parameters
that shape economic agents´ decisions. These parameters are related to institutions
(property rights), markets, governments and technology. Both levels are important
for the Brazilian case and are closely related. Government policies have had an
impact on both the deforestation process and the microeconomic relations through
an institutional context of land inequality, insecure tenure rights and market
imperfections that have contributed to intensify regional policy failures.
8
EXPLAINING AGRICULTURE EXPANSION AND DEFORESTATION: EVIDENCE FROM THE BRAZILIAN
AMAZON — 1980/98
Migration processes and property right allocations are closely linked to
deforestation. Weak defined property right structures are known to be one of the
main determinants of land clearing processes in tropical forests. The colonization
projects introduced in the Amazon during the seventies attracted a huge amount of
farmers to the frontier motivated by property right claims. Almeida and Campari
(1995), Schneider (1995) and Alston, Libecap and Schneider (1996) have found a
strong relationship between incentives for land clearing and insecure property
right regimes.
Immediate causes of deforestation are closely linked to economic incentives.
Imperfect markets for crops, labor and land have induced land-clearing processes.
Among these factors, land speculation has been one of the driving aspects
inducing deforestation processes in the region, especially in the eighties. The open
access characteristic of the Amazon forest induced a race for property rights, both
as direct government strategy and as a market response to the possibility of
obtaining land titles. Subsidized rural credit for pasture conversion and cattle
ranching created an additional pressure on land prices through the demand for
large amounts of land.10 Additionally, the great uncertainty generated by high
inflationary processes contributed for the use of land as a secure asset.
Therefore, the relationship between changes in the price of land and the demand
for cleared land is quite complex. An increase in the price of land raises the cost of
acquiring or renting land and tends to decrease the demand for cleared land as an
input. Nevertheless, in dynamic terms, an increase in the price of land generates
expected future gains and could increase the demand for land for speculative
motives. Additionally, cattle and land serve as secure assets in periods of high
inflation.
In Figure 2 we present the evolution of the price of land in the Amazon region.
From the early eighties until the Real plan in 1994 the price of land was greatly
determined by macroeconomic variables, specially inflation and interest rate
[Reydon (1999)]. The increase in the real price of land that occurred in the
seventies until the mid-eighties created an additional incentive for deforestation
through smaller farmers. Since high land prices limited the possibility of smaller
farmers to buy land, it created incentives for migration and frontier settlements
generating further forest conversion [Schneider (1995)]. After a peak in 1986 the
price of land has decreased considerably and since 1994, reduced inflation rates
associated with restrictive macroeconomic policies on credit and consumption,
brought down definitively the price of land for both crop areas and pasture land as
we observe in Figure 2. Another observation is that the price of cropland is, on
average, higher than the price of pastureland, although over time their behavior is
almost identical.
10
See Brandão (1988) for an analysis of the determinants of the price of land in Brazil.
9
EXPLAINING AGRICULTURE EXPANSION AND DEFORESTATION: EVIDENCE FROM THE BRAZILIAN
AMAZON — 1980/98
Figure 2
Average Price of Land in the Brazilian Amazon: 1979/99
Price of Crop Land
Price of Pasture Land
1,000
Price of Land (1994 R$/ha)
800
600
400
200
1980
1985
1990
Year
1995
2000
The deforestation process in the Amazon is closely linked to the rural labor market
as well. The opportunity cost of migrating in the frontier is given, in part, by the
rural wage that could be obtained by working on a farm. Low rural wages imply
low opportunity cost of migration inducing a higher land clearing. Moreover, the
demand for additional land is also related to the cost of inputs, inclusively rural
labor. In Figure 3 we present the evolution of the average rural wage rate for
temporary workers in the Brazilian Amazon. Except for peaks in 1986 and 1989,
and the 1992/96 periods, the rural wage has been on a declining trend since 1979.
This decline creates incentives for hiring labor intensively for clearing activities
and, at the same time, decreases the opportunity cost of migration, creating
incentives for movements along the frontier in search of open access land.
Land price dynamics and wage rate movements in the Amazon are closely related
to infrastructure building, especially road constructions [Binswanger (1991)].
Since the seventies, a massive colonization effort through road building was
undertaken by the Brazilian government. The availability of roads decreased
transport costs enabling large pastures and agriculture areas to become financially
viable.
Extensive networks of paved and unpaved roads were built in the Amazon during
the 1979/99 period as illustrated by Figures 4 and 5. The extension of paved roads
increased by more than 100% during the 1979/99 period and unpaved roads
increased by approximately 460%. On average 16,000 km of additional non-paved
roads were built between 1980 and 1995. Although paved roads are generally
related to new frontier areas, small-unpaved roads opened by logging companies
also generate further occupation.
10
EXPLAINING AGRICULTURE EXPANSION AND DEFORESTATION: EVIDENCE FROM THE BRAZILIAN
AMAZON — 1980/98
Figure 3
Average Rural Wage in the Brazilian Amazon
Rural Wage (1994 R$/month)
200
150
100
50
1980
1985
1990
Year
1995
2000
Figure 4
Extension of Paved Roads in the Brazilian Amazon: 1979/99
30,000
Paved Roads (km)
25,000
20,000
15,000
10,000
1980
1985
1990
Year
1995
2000
11
EXPLAINING AGRICULTURE EXPANSION AND DEFORESTATION: EVIDENCE FROM THE BRAZILIAN
AMAZON — 1980/98
Figure 5
Extension of Unpaved Roads in the Brazilian Amazon: 1979/99
300,000
Unpaved Roads (km)
250,000
200,000
150,000
100,000
1980
1985
1990
Year
1995
2000
A fraction of the deforestation process is undertaken by smallholders who clear
land for subsistence consumption. Another substantial portion is carried out by
commercial crop and cattle-ranching activities. Since cattle-ranching activities are
in general oriented towards the market, we would expect the price of output to
determine the expansion of commercial agriculture and cattle ranching in the
Amazon region.
In Figure 6 we present the evolution in the average price of commercialized cattle
in the Amazon from 1979 to 1999. Despite of some short-term fluctuations, we
observe a declining trend. Although the price of beef has been declining in real
terms as well, it is very likely that the decrease in the real price of cattle has
induced a capital accumulation effect.
Schneider et al. (2000) estimate a low internal rate of return for the cattle activity
in the Amazon suggesting that additional explanations are needed in order to
elucidate on the massive growth of cattle in the region. Walker, Moran and
Anselin (2000) suggest that even tough beef prices felt in real terms, the relative
price of beef with respect to crops such as rice, beans and black pepper have
increased making cattle-ranching profitable even for small farmers. Additionally it
is important to take into account that there are additional returns to the cattle
activity such as the establishment of property rights and protection against high
inflation. Another possible explanation for the increasing cattle-herd is history
dependence and important cultural and institutional aspects, especially due to past
government incentives.
12
EXPLAINING AGRICULTURE EXPANSION AND DEFORESTATION: EVIDENCE FROM THE BRAZILIAN
AMAZON — 1980/98
Figure 6
Average Price of Cattle in the Brazilian Amazon: 1979/99
Price of Cattle Head (1994 R$/kg)
4
3
2
1
1980
1985
1990
Year
1995
2000
It is widely agreed that government credit, through subsidies and tax break
incentives, was one of the most important factors that drove the agriculture
frontier expansion in the Amazon [Biswanger (1991), Schneider (1995),
Andersen, Granger and Reis (1997)]. In Figure 7 we present agriculture and cattleranching credit distributed by the government. We observe that the availability of
rural credit decreased considerably during the economic crisis of the early eighties.
Nonetheless, from 1984 to 1989 there was a substantial growth in government
credit particularly for agriculture activities. In the nineties, rural credit increased
again until 1994 and since 1995 it has been relatively stable.
Figure 7
Government Credit for Agriculture and Cattle-Head Activities: 1979/99
Agriculture Credit
Cattle-Ranching Credit
Government Credit (1994 R$ 1,000,000)
3,000
2,000
1,000
0
1980
1985
1990
Year
1995
2000
13
EXPLAINING AGRICULTURE EXPANSION AND DEFORESTATION: EVIDENCE FROM THE BRAZILIAN
AMAZON — 1980/98
2.2 - The Social Costs of Deforestation
Deforestation and environmental degradation in the Amazon introduces social
costs to local economic agents as well as affects citizens outside its borders. The
current unsustainable deforestation process can have important effects on future
growth possibilities in the region. The conversion of forest into pastureland and
crop area is almost irreversible since the soil nutrients are exhausted leaving the
soil in extremely poor conditions. Seroa da Motta and Ferraz (2000) estimated the
user cost associated with timber extraction in the Amazon. They show that
logging, following the process of land conversion to agriculture, do not reflect
scarcity and depletion costs.
The deforestation process harms other activities as well. The possibilities of future
income with sustainable forestry, use of biodiversity, eco-tourism, carbon
sequestration and other environmental services decrease considerably with the
current deforestation rate.
One of the main consequences of deforestation is the loss of biodiversity. In 1997
there were 228 fauna species in danger of extinction in Brazil [(Ibama (1997)]
from which approximately 90 species were from the Amazon [BDT (2001a)].
Although it is hard to calculate the value of biodiversity in the region, it is widely
agreed that the Amazon presents several unique ecosystems and species, some of
which could have pharmaceutical use value and others may have a large existence
value for non-residents.
Predatory logging also causes extinction of valuable commercial tree species such
as Mahogany. Martini et al. (1994) discriminated 305 species of trees into three
groups according commercial interests and ecological parameters. They found that
45 species are strongly susceptible to timber extraction in terms of population
reduction.
The deforestation process in the Amazon also creates environmental social costs
through CO2 emissions. Andersen and Reis (2000) estimate average carbon
emissions from the Legal Amazon of 168 million tons per year during the 1970/85
period. This corresponds to approximately 95 ton of Carbon per hectare cleared,
which contributes to aggravate the world concentrations of CO2, the main cause of
climate change.
Deforestation and logging are also related to the increasing risk of fires in the
region. With its humid microclimate, the tropical forest contributes to fire control.
Both the selective logging and the land clearing processes increase the probability
of fire dispersion in a significant manner. This occurs because of the damages
wreaked by logging, particularly because logging opens up the forest canopy — up
to 50% — allowing the sun's heat to reach the earth, drying out leaf litter and other
materials that may become combustible. Therefore, deforestation induces potential
for massive ecological and economic losses through accidental fires [Nepstad et
al. (1999)].
14
EXPLAINING AGRICULTURE EXPANSION AND DEFORESTATION: EVIDENCE FROM THE BRAZILIAN
AMAZON — 1980/98
3 - THE EMPIRICAL MODEL AND ECONOMETRIC SPECIFICATION
Constructing a simple model to describe the pattern of deforestation in the
Brazilian Amazon is not an easy task. The difficulty comes from the fact that the
Amazon is a heterogeneous region where several institutional settings coexist. In
some parts of the region, particularly in the first frontier areas such as parts of
Mato Grosso, Tocantins and Pará, there are developed land and labor markets.
Conversely, in areas beyond the frontier, markets are weakly developed and open
access areas prevail. Further differences arise from economic agents clearing the
forest that range from small subsistence agrarian peasants to large cattle
landholders.
In order to simplify our analysis and study the specific variables that are likely to
influence the evolution of cleared land, we will assume that we can represent the
process of deforestation by a simple demand and supply model. We follow Reis
and Guzmán (1993) and Cropper, Griffiths and Mani (1999) in breaking up the
deforestation process in two steps: at each price level, economic agents chose the
amount of land that is cleared. Separately, at prevailing prices, farmers chose the
amount of land that would be used for cropping. Although farmers may clear their
own land and farm it, this two-step framework allows us to model separately the
effects of agriculture decisions on the deforestation process.
The demand for cleared land is derived from farmers undertaking a crop based or
cattle activity. A representative farmer uses traditional inputs labor, capital and
cleared land in order to produce an agriculture output. Additionally its production
is affected by geographical and agro-ecological factors such as distance to markets
and soil quality.
The supply of cleared land and the demand of cleared land by farmers from
equation determine the equilibrium amount of cleared land and its rental price. It
would be possible to take this model to the data, except for the fact that we do not
observe separate supply and demand for cleared land. Instead, what we observe is
the equilibrium extension of cleared land used for agriculture and cattle ranching
at each period. In order to take this model to an estimable equation, we follow
Reis and Guzmán (1993) and Cropper, Griffiths and Mani (1999) and we suggest
a reduced form equation of cleared land.
The reduced form equation of cleared land obtained depends on the factors
affecting the demand for cleared land, but also on factors affecting the supply of
deforested land. In the present model, the amount of cleared land increases with
the output price, the road availability, the soil quality and the amount of credit and
should decrease with the distance to the market, the forest density, the rural wage
and the price of land.
Our objective is to estimate the main determinants of the evolution of agriculture
land and cattle head in the Brazilian Amazon. The approach undertaken consists
in estimating two separate independent regressions — one for cattle and one for
15
EXPLAINING AGRICULTURE EXPANSION AND DEFORESTATION: EVIDENCE FROM THE BRAZILIAN
AMAZON — 1980/98
agriculture — using a panel data approach.11 According to our model, the area of
cleared land for agriculture and the number of cattle heads, in state i at period t,
are determined by three types of factors: market incentives, geographical factors
and agro-ecological characteristics.
Since the extension of cleared land for agriculture and the number of cattle head
per state are likely to vary with the size, omitting size from the estimated equation
causes a spurious correlation between cleared agriculture area and size varying
variables such as roads and credit.12 This is not a problem in the fixed-effect
estimation since size will disappear once we take first-differences, but it will be a
problem in the random effect estimation. In order to keep comparability between
estimates, we control for different state sizes in all estimations by dividing the
dependent variable and size varying factors, such as roads and credit, by the size
of the state area.13
The estimations were undertaken in linear and log form. The logarithmic
specification resulted in a better-fit, expected signs of coefficients and
significance. Therefore, we only present the estimated equations in logarithmic
form with the coefficients generating direct elasticity estimates.
The reduced form estimated equation for the evolution of the cattle head density in
the Amazon is:
ln chd it = α 0 + α 1 ln pch it −1 + α 2 ln ppl it −1 + α 3 ln w it −1 + α 4 ln ccrd it −1 +
+ α 5 ln prd it −1 + α 6 ln nprd it −1 + α 7 ln dist i + α 8 ln sd i + f i + ε it
(1)
where chd is the density of cattle head; pch is the price of cattle head; ppl is the
price of pasture land; wit is the rural wage rate; ccrd is the rural credit density for
cattle ranching activities; prd is the density of paved roads (paved roads/state
area); nprd is the density of non-paved roads (non-paved roads/state area); dist is
the distance from the state capital to the federal capital; sd is the proportion of
medium to high quality soil; fi is a specific effect for each state and εit is the
contemporaneous error term.
For the crop area, we estimate a similar reduced form equation, except that the
dependent variable is cad, the crop area density, and for the covariates, the price of
11
Although it would be desirable to estimate a structural model linking both sources, we do not
undertake such a task due to data restrictions: the area for agriculture cannot be directly linked with
the data for cattle head. Only the use of census data would permit such a task. See Andersen,
Granger and Reis (1997) for a transition model of land use.
12
See Granger and Hyung (1997) for possible problems of spurious correlation that occur when
omitting size variables.
13
Of course it would be more precise to divide it by the size of the potential agricultural area.
Nevertheless such figures are not available.
16
EXPLAINING AGRICULTURE EXPANSION AND DEFORESTATION: EVIDENCE FROM THE BRAZILIAN
AMAZON — 1980/98
land pcl, refers to crop land and credit density acrd refers to agriculture credit
density. The estimated equation can be expressed as:
ln cad it = β 0 + β1 ln pcl it −1 + β 2 ln w it −1 + β 3 ln acrd it −1 + β 4 ln prd it −1 +
β 5 ln nprd it −1 + β 6 ln dist i + β 7 ln sd i + µ i + ηit
(1)
Although equations (1) and (2) represent simple models, their estimation raises
several important econometric issues. Both equations are estimated using paneldata for small number of states and large time series (8 states and 19 years), which
makes our data similar to data sets used in estimations of growth country studies
and political science statistic applications.
We assume the existence of significant fixed effects even when we take into
account state specific variables such as soil quality and distance from main
markets. Several other factors such as state inherent population ability, rain fall,
climate, vegetation cover, slopes, public infrastructure, and other factors could
explain different crop area and cattle head density. Since these omitted factors are
likely to be correlated with included variables such as rural credit, roads and land
prices, the omission of any of these variables would generate biased coefficients
under OLS estimation.
The advantage of working with panel-data is that such fixed-effects can be wipedout using a least square dummy variable (LSDV) model. We believe that
controlling for non-observed fixed characteristics for each state will generate more
precise estimates of the causes of land clearing expansion. Of course, there is a
disadvantage of using a fixed-effect model; we cannot estimate directly the effect
of soil quality and distance to main markets on the planted area and cattle
density.14
Another important issue is the existence of non-spherical error covariance
matrices. The type of data used — time series cross section (TSCS) — is generally
characterized by groupwise heterocedasticity, panel correlation and
autocorrelation. These issues are generally not emphasized in econometric
applications with large N and small T. Nonetheless, models with small N and large
T, common in political science studies, usually require appropriate variancecovariance matrix in order to make correct inference and hypothesis testing.
The traditional correction for auto-regressive processes and correlation between
panels, generally known as the Parks method, uses a FGLS estimator to compute
adequate standard errors. Asymptotically, this solution will generate unbiased and
consistent estimates of parameters and standard errors. Nonetheless, in finite
samples, especially those usually used by political scientist, where T varies from
15 to 40, Beck and Katz (1995a) find that this method would seriously underestimate standard errors generating wrong inference. Usually this method would
tend to over-reject the null hypothesis that specific parameters are equal to zero.
14
There are indirect methods of retrieving such estimates.
17
EXPLAINING AGRICULTURE EXPANSION AND DEFORESTATION: EVIDENCE FROM THE BRAZILIAN
AMAZON — 1980/98
An alternative method, the panel corrected standard error (PCSE) is proposed by
Beck and Katz (1995a) suggesting that it is a more accurate estimator of standard
errors. In a different article, Beck and Katz (1995b) compare their estimator with
Kmenta (1986) cross-sectionally heterocedastic and timewise autocorrelated
(CHTA) model. They conclude that the weighting procedure for eliminating
heterocedasticity is only worth if it is a real problem and that for modeling
dynamics, the use of a lagged-dependent variable is highly preferred than the
FGLS model. Beck and Katz (1995b) argue strongly in favor of using an OLS
estimator with a lagged dependent variable and PCSE. They emphasize that the IV
estimator for removing the correlation between the lagged dependent variable and
the error term should only be used if there is really the presence of strong serial
correlation.15
Another significant point in the estimation procedure is related to the price of
land. It is hard to assume that perfect functioning land markets exist in the whole
Amazon. Some regions have weak markets and even no markets (open access).
This is exactly one of the causes of deforestation. Therefore introducing the
market land price seems like a strong assumption based on our model.
Nonetheless, in regions where land markets are developed, an increase in the price
of land would induce a reduction in the demand for land as a factor of production
and consequently a decrease in land clearing. If land is just used as a production
factor in a static context, then a negative relationship between the land price and
the amount of cleared land is expected. Nevertheless, our model indicates that a
higher expected value of land will generate further land clearing.16 The first effect
occurs through the demand for cleared land while the latter occurs through the
supply of deforested land. That is, by privatizing the land, prices will increase
from zero (open access) to some positive value. Hence, an increase in the price of
land can be a signal for increasing clearing and supplying additional deforested
land. Therefore, we cannot assume a priori a specific sign for the relationship
between cleared land and land price.
An extra difficulty in the estimation procedure is related to simultaneity. Since we
are estimating an assumed reduced form of a demand and supply system of
agriculture cleared land, the price of land could be correlated with the error term.17
In order to identify our reduced form demand equation, we would need a costshifting variable that can serve as an instrument for land price. As it is well
known, this variable has to be correlated with land price and not correlated with
the error term. Nevertheless, in practice finding a suitable instrument is not an
15
See Arellano and Bond (1991) for the IV estimator in the presence of lagged dependent variable
and FE.
16
Moreover, an increase in the price of land diminishes the possibility of poorer farmers to buy
land creating incentives for penetration into open access areas.
17
One exception for this problem would be if the demand and supply are undertaken by the same
economic agent, as occurs in some regions of the Amazon.
18
EXPLAINING AGRICULTURE EXPANSION AND DEFORESTATION: EVIDENCE FROM THE BRAZILIAN
AMAZON — 1980/98
easy task.18 To diminish this problem, we use the lagged value of the land price as
an explanatory variable for the cleared land and cattle head. Thus, in our model,
farmers are assumed to decide how much cropland would be used in the beginning
of the period and if they decide to use more land, they would take the purchase
decision in the beginning of the period depending on previous period prices.
Using current rural wages could also cause simultaneity problems. An increase in
the planted area is likely to generate an additional demand for rural labor that
would increase the rural wage rate. A solution for this problem would be to find a
valid instrumental variable for rural wage as well, but similarly to the case of the
land price, such instrumental variable is not available. We choose for the same
strategy using the rural wage from last period as an explanatory variable for
current planted area.
The problem of simultaneity is also important for the other variables such as credit
and roads. It is hard to define the right causality between credit and crop area since
more rural-credit creates incentives for increasing the crop area, but usually land is
used as collateral and a higher proportion of crop area would induce a larger
amount of rural credit. The same is true for roads since the demand for new roads
could be generated in places where the crop area is large and there is a necessity of
distribution network. In order to avoid reversal causality effects and simultaneity
we prefer to include both credit and road variables using one period lag.
4 - THE DATA
In order to analyze the causes of land clearing expansion in the Brazilian Amazon
we use state level data from 1980 to 1998 for eight states considered part of the
Amazon ecosystem: Acre, Amazonas, Goiás, Maranhão, Mato Grosso, Pará,
Rondônia and Roraima. The state of Amapá, although part of the Amazon, is not
included in our analysis due to the lack of complete data on land prices, cattle
prices and wages. Oppositely, the states of Maranhão and Goiás are completely
included, although only parts of them are considered to be on the Amazon
ecosystem. Moreover, the state of Goiás, which was separated into the states of
Goiás and Tocantins in 1988, is also included entirely since it was not possible to
obtain data for some variables for Tocantins alone prior to 1988. For the years
after 1988, we combined the data for Goiás and Tocantins.
Our aim is to estimate the causes of the expansion of the deforestation. Since the
data on the extension of deforestation measured by satellite, for all states of the
Amazon, is only available after 1988, we approximate the agro-pastoral frontier
18
For the Amazonian context, a variable which reflects the property right structure could be used
as an instrument. We would expect property right structure to affect the behavior of land clearing,
but not the demand for agriculture land. In a reduced form estimation, the property right structure
would only affect the equilibrium amount of cleared land through its effect on the price of land.
Although such a variable is available from the agriculture census, it is not available for all the years
we are using.
19
EXPLAINING AGRICULTURE EXPANSION AND DEFORESTATION: EVIDENCE FROM THE BRAZILIAN
AMAZON — 1980/98
evolution by analyzing the change in the proportion of crop area and the density of
cattle head through time. It is important to note the difference from the
methodology undertaken by Reis and Guzmán (1993), Reis (1996) and Andersen
et al. (1996) that used census data at the municipality level and estimated the
cleared area as cropland plus pasture land and planted forest. Since the agriculture
census is not available yearly, we opted for using annual data, but losing
information on the extension of pastureland. Our study also differs from
Andersen, Granger and Reis (1997) who estimated the probability of forestland
being converted into crop area or pastureland.
Each indirect deforestation source is analyzed in a separate regression. Data for
crop area was obtained from the Pesquisa Agrícola Municipal (PAM) and the data
for cattle head was taken from the Pesquisa Pecuária Municipal (PPM), both
surveys are undertaken yearly by the IBGE at the municipal level. Nevertheless,
since economic variables such as prices, wages, credit and roads are only available
annually, we aggregated the municipal information. There are substantial
differences between the results reported by the PAM and PPM when compared to
the agriculture census. Since the census is a more detailed survey, we will expect
it to be more precise with respect to estimated crop area. Nevertheless, the PAM
and the PPM are the only annual agriculture surveys available, and although we
observe its limitations and interpret the results obtained here with caution, they are
the best source we can work with.
The price of agriculture products was calculated using a moving base Laspeyres
index. Two types of indices were constructed: one using all products and another
using only the five most important products for each state.19 The price of each
product was obtained implicitly from the PAM by dividing the reported value of
production by the quantity produced of each crop. The indexes were then deflated
by the general price index (IGP-OG) with a 1994 = 100 base.
Land prices were obtained from the Fundação Getulio Vargas (FGV) for crop area
and pastureland. Prices are available by semester and an average was calculated in
order to obtain annual figures. The price of land given in Real per hectare were
then deflated and expressed in 1994 currency. Rural wages for permanent workers
were also obtained from the FGV database.20 Monthly wages were averaged to get
annual figures and then deflated in order to obtain real wages in terms of 1994
currency.
For both land prices and rural wages, we have missing variables for five
observations. Two alternatives were used to complete the series. First, a linear
interpolation was used between the years for which data was available. Second,
we analyzed the evolution of the missing variables in neighbor states and assumed
19
The most important products were ranked according to crop area and production. Both
categorizations yielded approximately the same results.
20
Similar calculations were undertaken for temporary workers, but did not introduce any
significant changes in our results.
20
EXPLAINING AGRICULTURE EXPANSION AND DEFORESTATION: EVIDENCE FROM THE BRAZILIAN
AMAZON — 1980/98
that the variables behaved as an average of the change in neighbor states. We
undertook a simple comparison of both strategies for years where data was
available and find that the first methodology was preferred yielding more accurate
estimations.
The extension of paved and non-paved roads was obtained from the Geipot
statistical yearbook. The yearbook provides data on the extension of paved and
unpaved roads in Km for all Brazilian states. For 1994 and 1996, the data was not
available for some states and we undertook a linear interpolation between the
available years. It is important to note that due to depreciation and lack of
investment the extension of roads decrease in some periods.
Data on soil quality was obtained from soil maps available from the IBGE
tabulated in the Desmat dataset.21 The soil quality variable was calculated as the
percentage area of each state that have soils considered of regular to high quality.
This variable is imperfectly measured due to the aggregation of soil types that
made impossible to separate some type of medium quality soils from high quality
soils.
Another important variable is the distance from the main market that is used as a
proxy for transportation costs. It was calculated as the distance of each state
capital to the national capital Brasilia.
Finally, government agriculture and livestock credit was obtained from the Central
Bank Rural Credit Annual Yearbook. It includes total rural credit that was granted
by government institutions for rural activities. Two adjustments were undertaken
on total rural credit figures. For agriculture credit, we subtracted credit given for
extractive activities that we think do not influence the crop choice. For livestock
credit, we subtracted all credit granted for other activities other than cattle
ranching. Both credit variables were then converted to 1994 currency and deflated
by the IGP-OG.
5 - ESTIMATION RESULTS
We estimate equations (1) and (2) separately. Although it is widely agreed that
deforestation agents first use the land for temporary crops and then introduce
cattle, it was not possible to introduce a structural approach due to the difference
in the type our data (we do not have the area devoted for cattle, only the number of
cattle heads).
Both equations are estimated as a function of four types of variables: output and
input prices, government credit, road availability, geographical variables (distance
to the market and the proportion of high quality soil). Of course, variables that do
21
We thank Eustáquio Reis for making this data available. For a description of the Desmat dataset
see Andersen, Granger and Reis (1997).
21
EXPLAINING AGRICULTURE EXPANSION AND DEFORESTATION: EVIDENCE FROM THE BRAZILIAN
AMAZON — 1980/98
not vary over time (distance and high quality soil) drop out when we estimate the
fixed-effect model. For each equation, we estimate alternative specifications with
all the available explanatory variables and excluding non-significant variables.
As mentioned before, some deforestation econometric models use the rural
population density as an explanatory variable. We expect its effects on land use
decisions to be captured in wages and land prices. As expected, after including
other variables, rural population density was not found to be significant and was
not included in final estimations.
We estimate both equations by OLS, fixed-effects (FE), random-effects (RE) and
panel corrected standard error (PCSE) methods taking into account group
heterocedasticity, panel correlation and autocorrelation.
5.1 - Estimation Results for the Cattle Head Density
The results for the regression on the behavior of cattle head density are reported in
Table 5. It is important to note that for cattle ranching, we do not have data on
land use and we employ instead, the cattle head density as a proxy for pastureland
expansion.22
The dependent variable is the log of the density of cattle head (number of cattle
heads divided by the state area) and the independent variables used are the price of
pasture land, the price of cattle head, density of government credit for cattle,
density of paved roads, density of non-paved roads, distance to federal capital and
the proportion of high quality soil. All variables are used in logarithmic terms and
all covariates are lagged one period in order to decrease the chances of
endogeneity, as mentioned in Section 4. Distance to federal capital and the
proportion of quality soil are fixed variables that disappear in the fixed effect
estimations.
The price of beef is likely to be an important variable to explain the evolution of
cattle head, but state level data is not available for the Amazon. We included this
variable varying only through time, but due to its high correlation with the price of
cattle head, it was not found to be significant. Another variable that was tested
was the rural wage. Since cattle’s ranching is a land intensive activity (relative to
labor), we would not expect changes in the rural wage rate to determine the
number of cattle heads. We estimated the model including wage rate in our
specification and as expected, it was not found to be significant in any estimation
as well. Another specification that was used was a two-way fixed effect model.
None of the time dummies was found to be statistically significant and was
excluded from the presented model.
22
Although we know this is a far from perfect proxy due to the intensification of the cattleranching activity in some states of the Amazon, we hope to obtain an approximate answer for the
pattern of deforestation dynamics driven by the cattle ranching activity. Similar analysis was
undertaken by Barbier and Burgess (1996).
22
EXPLAINING AGRICULTURE EXPANSION AND DEFORESTATION: EVIDENCE FROM THE BRAZILIAN
AMAZON — 1980/98
On the first two columns of Table 5 we present estimates of the OLS model. All
the variables are statistically significant, although the price of pastureland has an
unexpected positive sign. The OLS model explains a large portion of the variance
in the density of cattle head (R2 = 0.91). The simple OLS estimation does not take
into account fixed geographical characteristics. Once we control for geographical
variables such as distance and soil quality, the price of land turns out to be nonsignificant with all the other variables being significant. The introduction of these
two variables improves only slightly the fit of the regression increasing the R2 by
0.03. The OLS results suggest that cattle head density increases with lower cattle
head prices; larger amount of credit, more paved and unpaved roads, smaller
distance from the federal capital and higher quality soil.
Table 5
Determinants of Cattle Head Density in the Brazilian Amazon: OLS and FE
Results
OLS
Ln (Price of Cattle-Head) t-1
Ln (Price of Pasture Land) t-1
Ln (Cattle Credit Density) t-1
Ln (Paved Road Density) t-1
Ln (Unpaved Road Density) t-1
(1)
(2)
(3)
(4)
-0.498
(0.126)**
0.223
(0.073)**
0.166
(0.047)**
0.117
(0.050)*
0.638
(0.052)**
-0.375
(0.100)**
0.012
(0.073)
0.070
(0.034)*
0.216
(0.048)**
0.403
(0.043)**
-0.644
(0.088)**
0.233
(0.024)**
9.734
(0.971)**
152
0.94
-0.516
(0.085)**
0.032
(0.064)
0.027
(0.023)
0.156
(0.050)**
0.214
(0.049)**
-0.468
(0.074)**
0.163
(0.050)**
0.213
(0.049)**
3.286
(0.449)**
152
0.63
3.560
(0.249)**
152
0.63
Ln (Distance)
Ln (Prop. of High Quality Soil)
Constant
Observations
R2
FE
3.084
(0.549)**
152
0.91
Note: The dependent variable is the log of cattle head density. Robust standard errors in parentheses for
OLS, Standard errors are in parentheses. * Indicates variables significant at 5% level and ** indicates
variables significant at the 1% level. The R2 for the FE is the within R2. The period used is 1980/98 and the
eight states included in the regression are AC, AM, MA, MT, PA, RO, RR .
Nonetheless, if we believe the existence of important regional effects apart from
distance and soil quality, the previous pooled OLS estimators would be biased and
inconsistent. Alternatively, we estimate the model using a fixed-effect (FE) model
which controls for these other fixed state characteristics.
Once we include dummies for states, the density of government credit is not found
to be statistically significant. Even after we take out the price of pastureland,
credit density is still non-significant. We also tried specifications with the price of
land taking out the price of cattle head, but the price of land and credit were not
23
EXPLAINING AGRICULTURE EXPANSION AND DEFORESTATION: EVIDENCE FROM THE BRAZILIAN
AMAZON — 1980/98
significant in all combination of specifications. Therefore, in column (4) we
present the results for the FE including only the significant variables.
The three significant variables that explain the evolution of the density of cattle
head in the Amazon are the price of cattle head, the density of unpaved roads and
the density of paved roads. All three variables are statistically significant at the 1%
level and have the expected sign. We also note that the coefficient value on the
price of cattle increases and the coefficients of the two road variables decrease
once we use fixed effects instead of the two geographical variables. This suggests
that unobserved fixed effects are negatively correlated with the price of cattle head
and positively correlated with the two road variables.
A decrease in the price of cattle head of 1% increases the density of cattle head by
0.47%. Both increases in the density of paved and unpaved roads are associated
with an increase in density of cattle head. The elasticity of paved roads is 0.16
while the elasticity of unpaved roads is 0.21. These results seem to indicate that
unpaved roads have a larger effect on the adoption of a larger stock of cattle than
paved roads. However, this difference decreases once we account for fixed effects.
The importance of using fixed effects instead of a simple OLS is inspected with an
F-test. For the complete specification, we reject the null hypothesis that all fixed
effects are zero with an F(7,139) = 31.95 while for the second specification we
reject the null hypothesis with an F(7,140) = 36.37.
An additional model is estimated assuming that specific state level effects are
random instead of fixed. The advantage of the random effect model is based on
efficiency criteria. The random effects transformation removes less of the
variation due to differences in means among units than the fixed effect
transformation does, preserving more of the information in the data. Therefore, it
can be shown that the random effect transformation is more efficient, at least
when the assumptions of the random effects model are satisfied (unit-specific
errors fi are uncorrelated with other regressors in the model). However, if they are
correlated, the estimates are inconsistent. The fixed effects model does not require
such assumption as they are viewed as the coefficients of regular dummy variables
that are allowed to covary with other regressors. The well-known Hausman test is
used to decide which estimator is more appropriate for fitting our model. For the
complete cattle-head model the test-statistic for the Hausman test is equal to 87.4
rejecting the null hypothesis of zero correlation and endorsing the use of the fixedeffect model.
Additional test were used for checking the robustness of the FE model. A
modified Wald test for groupwise heteroskedasticity is used in both fixed effect
models rejecting the null hypothesis of homocedasticity for both estimations
(X2(8) = 405.27 for the first specification and X2(8) = 345.17 for the second). A
Breusch-Pagan LM test was used to inspect the possibility of cross-section
independence. Based on the results, we cannot reject the null hypothesis of
independence (values for the test are X2(28) = 25.92 and X2(28) = 34.22).
24
EXPLAINING AGRICULTURE EXPANSION AND DEFORESTATION: EVIDENCE FROM THE BRAZILIAN
AMAZON — 1980/98
An additional issue that comes out, specially with a long time series is the
possibility of serial-correlation. Since we use annual data and all variables are
lagged, there is a high chance that a shock in one period propagates into the next
period causing serial-correlation. We tested for serial-correlation in our fixedeffect specifications and found evidence of autocorrelation. For the model
presented in column (3), the LM test rejects the null hypothesis of no
autocorrelation, that is, that either rho = 0 if residuals are AR(1) (LM = 37.72) or
that lambda = 0 if residuals are MA(1) (LM5 = 6.14).
Following the proposed estimation method discussed in Beck and Katz (1995), we
present additional estimations correcting the standard errors obtained in our
regressions for heterocedasticity, panel correlation and autocorrelation. This panel
corrected standard errors (PCSE) methodology is found to generate correct
standard errors allowing for accurate inference. Three type of PCSE models are
presented: a simple OLS estimation with correct standard errors, an OLS with
correct standard errors controlling for distance and soil-quality and PCSE model
with state fixed-effects. All models assume a unique AR(1) autocorrelation
coefficient which is estimated in a first stage OLS regression. After that, a PraisWisten method is used to account for the assumed AR(1) process.23 The results
are presented in Table 6.
Table 6
Determinants of Cattle Head Density in the Brazilian Amazon: PCSE
Estimations
Independent Variable
Ln (Price of cattle-head) t-1
Ln (Price of pasture land) t-1
Ln (Cattle credit density) t-1
Ln (Paved road density) t-1
Ln (Unpaved road density) t-1
OLS/PCSE
-0.296
(0.102)**
0.065
(0.053)
0.067
(0.023)**
0.250
(0.056)**
0.525
(0.059)**
Ln (Distance)
Ln (Prop. of High Quality Soil)
Constant
State Dummies
R2
ρ
Observations
4.568
(0.450)**
No
0.73
0.70
152
-0.204
(0.063)**
-0.020
(0.034)
0.018
(0.014)
0.219
(0.054)**
0.188
(0.049)**
-1.070
(0.111)**
0.358
(0.035)**
12.725
(0.773)**
No
0.78
0.80
152
FE/PCSE
-0.203
(0.061)**
0.221
(0.054)**
0.198
(0.050)**
-1.071
(0.102)**
0.361
(0.033)**
12.735
(0.588)**
No
0.79
0.79
152
-0.311
(0.064)**
0.004
(0.036)
0.012
(0.015)
0.175
(0.060)**
0.167
(0.050)**
3.481
(0.423)**
Yes
0.91
0.63
152
Note: The dependent variable is the log of cattle head density. Robust standard errors in parentheses for
OLS, Standard errors are in parentheses. * Indicates variables significant at 5% level and ** indicates
variables significant at the 1% level. The R2 for the FE is the within R2. The period used is 1980/98 and the
eight states included in the regression are AC, AM, MA, MT, PA, RO, RR .
23
For more details on the PCSE see [Beck and Katz (1995a and b)].
25
EXPLAINING AGRICULTURE EXPANSION AND DEFORESTATION: EVIDENCE FROM THE BRAZILIAN
AMAZON — 1980/98
The first two columns present OLS results. In column (1) we estimate the simple
OLS while in column (2) we control for geographical characteristics. We observe
that once we control for distance and soil quality and use the corrected standard
errors, credit is not significant for explaining differences in cattle head density.
This result is robust and is found if we control for unobserved fixed characteristics
with dummy variables. The other significant variables (price of cattle and roads)
continue to be significant with a slight change in the estimated coefficient due to
the Prais-Winsten transformation.
The presence of serial correlation is confirmed from the estimations of the
correlation coefficient between 0.70 and 0.80. The fit of the equations with the
Prais-Winsten transformation decreases, but remain acceptable with an R2 of 0.80
for the OLS/PCSE and 0.63 for the FE/PCSE.
In sum, the differences and evolution of cattle head density among states in the
Amazon are driven by the price of cattle head and paved and unpaved roads. A
decrease in 1% in the price of cattle head increases the density of cattle head in
0.31% while the elasticity for paved and unpaved roads is found to be equal with
an estimated value of 0.17.
5.2 - Estimation Results for the Agriculture Cleared Area
For the agriculture cleared land density, we introduce two additional variables: the
price of agriculture products (a Laspeyres index) and the rural wage. We would
expect an increase in output prices and a decrease in real rural wages to increase
the proportion of crop area. Similar to what was done for the cattle head
estimation, we first present the OLS and fixed-effects estimations in Table 7.
For the OLS estimation, three specifications are presented in columns (1), (2) and
(3). The price of agriculture output is not found to be statistically significant in
both specifications (1) and (2) and therefore it is excluded from specification (3).
All the other variables included in the first model are significant, most of them at
the 1% level. Nonetheless, the sign of rural wage is puzzling since we would
expect a higher cost of labor to decrease the extension of crop area. One possible
explanation for this result is the correlation of rural wage with omitted variables
such as distance and soil quality. In column (2) we take into account these two
factors and the rural wage variable turns out to be non-significant, together with
the price of land and the distance. This result is unchanged if we take out the price
of agriculture output as presented in column (3).
In the OLS model, the elasticity of agriculture credit is estimated in 0.30 while the
elasticities for paved and unpaved roads are estimated at 0.67 and 0.28
respectively. Surprisingly, neither the price of cropland nor rural wage is
significant. Greater distance, included in the third OLS specification, is likely to
increase transport costs and decrease profitability, but it is not found to be
significant as well. Even tough the OLS model explains a large part of the
26
EXPLAINING AGRICULTURE EXPANSION AND DEFORESTATION: EVIDENCE FROM THE BRAZILIAN
AMAZON — 1980/98
variance in the proportion of crop area with agriculture credit, paved roads,
unpaved roads and soil quality (R2 = 0.9).
Table 7
Determinants of Crop Area in the Brazilian Amazon: OLS and FE Estimations
OLS
(1)
Ln (Price of Agriculture Products) t-1
Ln (Price of Crop Land) t-1
Ln (Rural Wage) t-1
Ln (Agriculture Credit Density) t-1
Ln (Paved Road Density) t-1
Ln (Unpaved Road Density) t-1
Ln (Distance)
Ln (Prop. High Quality Soil)
Constant
Observations
R-squared
FE
(2)
(3)
(4)
(5)
0.004
0.148
-0.040
(0.101)
(0.080)
(0.054)
-0.276
-0.055
-0.071
-0.090
-0.092
(0.073)**
(0.101)
(0.102)
(0.060)
(0.060)
0.532
0.001
0.060
-0.190
-0.207
(0.205)*
(0.216)
(0.209)
(0.120)
(0.117)
0.237
0.292
0.300
0.075
0.076
(0.044)** (0.046)** (0.048)** (0.028)** (0.028)**
0.550
0.656
0.671
0.190
0.204
(0.074)** (0.071)** (0.068)** (0.054)** (0.050)**
0.478
0.311
0.284
0.085
0.082
(0.065)** (0.067)** (0.065)**
(0.051)
(0.051)
0.319
0.331
(0.171)
(0.176)
0.232
0.214
(0.037)** (0.038)**
3.006
1.936
2.184
2.628
2.623
(0.782)**
-1.516
-1.566 (0.439)** (0.438)**
152
152
152
152
152
0.87
0.90
0.90
0.30
0.30
Note: The dependent variable is the log of cattle head density. Standard errors are in parentheses. *
Indicates variables significant at 5% level and ** indicates variables significant at the 1% level. The period
used is 1980/98 and the eight states included in the regression are AC, AM, MA, MT, PA, RO, RR .
Although we controlled for some geographical and ecological characteristics in
our OLS results, we are likely to have two types of problems with the pooled OLS
estimation. First, other type of fixed-effects between states such as climate
conditions, which are likely to be correlated with included variables, may exist.
Thus, the OLS estimation would generate biased and inconsistent coefficients.
Second, standard errors generated by the OLS do not take into account typical
anomalies of TSCS data such as panel heterocedasticity, panel correlation and
autocorrelation. Thus, standard errors used for inference could be biased.
We try to correct for these problems sequentially. First, we control for omitted
fixed state characteristics using the least square dummy variable (LSDV)
estimator. This FE model control for the missing characteristics by introducing a
dummy variable for each state included in the regression. The results for this
second model are presented in columns (4) and (5).
The importance of the FE are confirmed with an F-test (F(7,138) = 78.97)
rejecting the hypothesis that the fixed-effects are jointly zero. For the other
27
EXPLAINING AGRICULTURE EXPANSION AND DEFORESTATION: EVIDENCE FROM THE BRAZILIAN
AMAZON — 1980/98
specifications, the value of the F-test is similar, confirming the existence of
significant fixed-effects that should be taken into account.
We would expect fixed effects to include agro-ecological and geographical
characteristics that are fixed through time and are not restricted to type of soil and
distance. The comparison between the OLS specification including distance and
soil quality in column (3) and the second specification of the FE in column (5)
differ substantially in the estimated coefficients for credit and roads. Once we take
into account other important fixed characteristics of states, the estimated
coefficients for agriculture credit and paved roads decrease substantially
suggesting that unobserved fixed effects might be positively correlated with these
variables. Additionally, unpaved roads turns out to be significant only at the 10%
level.
The results from the FE model suggest that agriculture credit and paved road
density are the main factors that explain the proportion of crop areas (unpaved
road density is only significant only at 10% level). An increase in 1% in the
density of agriculture credit is associated with an increase in of 0.075% of the
proportion of crop area while the coefficient for paved road density states that an
increase in 1% the paved road density is associated with an increase of 0.19% of
the proportion of crop area. The specification presented in column (5) leaves out
the price of agriculture product and the results obtained are quite similar: credit
and paved roads determine the proportion of crop area.
An alternative model was used to estimate the previous relationship by assuming
random effects. If the correlation between the error term and the included
variables were zero, the RE would generate estimates that are more efficient. We
test this using the Hausman test. The test rejects the null hypothesis of zero
correlation between the random effects and the regressors (H = 47.38 for the
complete model). This test value indicates that the FE model presented would
produce consistent estimates of our desired parameters.
The OLS and FE models presented above were estimated without taking into
account some particular characteristics of the TSCS dataset. Usually this type of
data is characterized by correlation between panels, panel heterocedasticity and
autocorrelation, especially if dynamics are not modeled correctly. All these
properties would cause residuals to be biased and wrong standard errors would be
used for inference. We tested the residuals obtained from the FE estimations for
these three problems.
For all models, the modified Wald test for groupwise heteroskedasticity rejected
the null hypothesis of constant variance across panels (chi2 (8) = 283.8 for the
first FE model and chi2 (8) = 337.2 for the second). For testing for correlation
between panels we use a Breusch-Pagan LM test of independence. The test values
cannot reject the hypothesis that panels have independent residuals (chi2(28) =
38.4 Breusch-Pagan LM test of independence: chi2(28) = 33.5). The last test we
undertake is for autocorrelation. Since we are not modeling the dynamics that are
28
EXPLAINING AGRICULTURE EXPANSION AND DEFORESTATION: EVIDENCE FROM THE BRAZILIAN
AMAZON — 1980/98
likely to exist in cropping activity, the residuals are likely to be dependent through
time. The null hypothesis that either rho = 0 if residuals are AR(1) or that lambda
= 0 if residuals are MA(1) are rejected based on the LM = 54.4 (asymptotically
distributed as chisq(1)) and LM5 = 7.4 (asymptotically distributed as N(0,1))
respectively.
Following the PCSE estimation method employed previously, we present
additional estimations correcting the standard errors for heterocedasticity, panel
correlation and autocorrelation. Three type of PCSE models are presented: a
simple OLS estimation with correct standard errors, an OLS with correct standard
errors controlling for distance and soil-quality and PCSE model with state fixedeffects. All models assume a unique AR(1) autocorrelation coefficient which is
estimated in a first stage OLS regression. After that, a Prais-Wisten method is
used to account for the assumed AR(1) process.
The first interesting comparison to make from the results presented in Table 8 is
between the previous OLS estimation (Table 7, column 1) and the OLS estimation
with PCSE (Table 8, column 1). Once the model corrects standard errors for
grouwise heterocedasticity and serial-correlation, the wage variable is not found to
be significant anymore.
Table 8
Determinants of Crop Area in the Brazilian Amazon: Panel Corrected
Standard Errors
Independent Variables
OLS/PCSE
(1)
Ln (Price of Agriculture Products) t-1
Ln (Price of Crop Land) t-1
Ln (Rural Wage) t-1
Ln (Agriculture Credit Density) t-1
Ln (Paved Road Density) t-1
Ln (Unpaved Road Density) t-1
(2)
0.009
(0.061)
-0.132
-0.132
(0.060)* (0.060)*
0.104
0.104
(0.115)
(0.115)
0.152
0.153
(0.031)** (0.031)**
0.355
0.353
(0.094)** (0.093)**
0.349
0.350
(0.074)** (0.074)**
Ln (Distance)
Ln (Prop. High Quality Soil)
Constant
State Fixed-Effects
R2
ρ
Observations
2.925
2.948
(0.674)** (0.658)**
No
No
0.50
0.50
0.83
0.83
152
152
(3)
0.056
(0.061)
-0.175
(0.062)**
0.117
(0.119)
0.132
(0.033)**
0.442
(0.090)**
0.223
(0.077)**
-0.626
(0.184)**
0.297
(0.062)**
8.626
(1.302)**
No
0.72
0.74
152
FE/PCSE
(4)
(5)
(6)
0.013
(0.048)
-0.122
(0.050)*
0.050
(0.094)
0.046
(0.026)
0.161
(0.073)*
0.119
(0.055)*
-0.170
-0.121
(0.062)**
(0.050)*
0.115
0.051
(0.117)
(0.094)
0.129
0.047
(0.032)**
(0.026)
0.410
0.157
(0.091)**
(0.070)*
0.219
0.121
(0.077)**
(0.054)*
-0.667
(0.184)**
0.291
(0.062)**
8.931
2.326
2.349
(1.294)** (0.549)** (0.547)**
No
Yes
Yes
0.70
0.90
0.90
0.76
0.65
0.65
152
152
152
Standard errors in parentheses. * Significant at 5% and ** significant at 1%.
29
EXPLAINING AGRICULTURE EXPANSION AND DEFORESTATION: EVIDENCE FROM THE BRAZILIAN
AMAZON — 1980/98
Nonetheless, as described previously, these results are likely to be biased due to
the existence of important state level fixed effects. These FE are corrected first by
introducing distance and soil quality and alternatively by introducing state dummy
variables.
Differently from the previous OLS results, with the corrected standard errors both
distance and soil quality are found to be significant to explain the proportion of
crop area (columns 3 and 4). The elasticity of distance is found to be large with an
increase in 1% in the km distance from the federal capital, the proportion of crop
area decreases by 0.66% (once we leave out the price of agriculture products). The
elasticity found for soil implies that an increase in 1% in the proportion of
medium to high quality soil increases the proportion of crop area by 0.29%.
The price of cropland, that was not found to be significant once distance and soil
were introduced in Table 7, is now significant with an elasticity of -0.17. The
other three important variables — credit, paved roads and unpaved roads — are
still significant, but their estimated elasticities are lower than previously
estimated.
Instead of including distance and soil quality to control for geographical
characteristics, we include a state fixed effect. The main effect of using FE is to
lower the estimated coefficient of agriculture credit (which is only significant at
the 10% level), paved roads and unpaved roads. This effect was shown to occur in
the results presented in Table 7 as well and is probably due to the positive
correlation between the unobserved fixed effects and these three variables.
What are then the main differences between FE estimations with and without
PCSE? The first main issue is related to the importance of the price of land. Once
we correct the standard errors, the price of cropland is found to be significant in
explaining the proportion of crop area. A 1% increase in the price of cropland is
found to decrease the proportion of cropland in 0.12%. Unpaved roads, which
were also not found to be significant, are now significantly different from zero
once we use the corrected standard errors. Agriculture credit is only significant at
the 10% level and the estimated elasticity is lower than the previously found
0.067.
6 - CONCLUDING REMARKS
Deforestation in the Brazilian Amazon is a complex phenomenon. The forest
conversion process is undertaken by several economic agents such as family
farmers, large cattle-ranchers, frontier settlers, land speculators and logging
companies. Moreover, the process is influenced by markets as well as institutions
and government policies. Therefore modeling its dynamics is not an easy task.
We use a simple model of the cleared land market in order to motivate our
econometric estimation. We advanced beyond previous studies in two issues.
30
EXPLAINING AGRICULTURE EXPANSION AND DEFORESTATION: EVIDENCE FROM THE BRAZILIAN
AMAZON — 1980/98
First, we use an annual panel-data at the state level in order to measure the causes
of agriculture land clearing in the Brazilian Amazon. Moreover, previous
econometric studies of the causes of deforestation had only used data until 1985.
Instead, we analyze the evolution of cattle head density and proportion of crop
area for the 1980/98 period. Second, we use different estimation methods
including the PCSE methodology in order to obtain standard errors that are robust
to Time Series-Cross-Section characteristics such as group heterocedasticity and
autocorrelation.
The conversion of forest into pastureland is still the main source of deforestation
in the region. This is found both by analyzing the land use pattern comparing the
agriculture census of 1985 and 1996 and by observing the evolution of the cattleherd in the Amazon. Nevertheless, such an observation does not explain why
cattle formation has been increasing.
With an average of 0.3 animals per hectare in the whole region [Chomitz and
Thomas (2000)] and an internal rate of return for the activity that varies between
4% to 14% [Schneider et al. (2000)], it is not easy to understand its dynamics only
in terms of economic returns. Additional incentives must exist in order to generate
such a massive investment in cattle ranching. Of course, part of this process is
explained by large government subsidies and the need to use the land for acquiring
property rights. Other explanations such as insurance and risk diversification are
also possible and should be examined in future research using household level
data.
Based on our estimations, we find that decreasing prices of cattle had allowed
farmers to increase their stock. Government policies, especially road construction,
are directly related to cattle head expansion in the region. The construction of a
paved road network has created the access to potential markets and decreased
transport costs. Nevertheless, our estimations present evidence that unpaved roads
are also responsible for a substantial portion of cattle-head expansion, probably
more associated with smaller farmers’ activities.
Walker, Moran and Anselin (2000) have found evidence that smaller farmers are
responsible for a substantial portion of deforestation in the Amazon adopting
pasture and cattle ranching activities. Surprisingly, the decrease in the price of
pastureland does not appear to have helped small and large owners to obtain land
through markets and develop cattle related activity.
The expansion of crop area density, although a smaller source of deforestation in
the Amazon, is also important since part of the land conversion process is
undertaken through nutrient mining. Farmers first convert forest into crop area,
use the soil as much as they can and then, when productivity has been sufficiently
reduced by nutrient mining, convert the area to pasture.
Changes in the demand for agriculture-cleared area seem to be more affected by
economic variables. Although output prices and rural wages are not found to be
31
EXPLAINING AGRICULTURE EXPANSION AND DEFORESTATION: EVIDENCE FROM THE BRAZILIAN
AMAZON — 1980/98
significant in explaining differences of crop areas, land prices are found to be
significant in explaining agriculture land clearing, once we take into account the
existence of groupwise heterocedasticity and serial-correlation.
The price of land is expected to play a dual-role in deforestation incentives. A
higher price of land decreases the demand for land as an input and therefore
decreases the incentives for agriculture land clearing. In contrast, a higher price of
land creates a wealth for deforestation agents by increasing expected prices
generating sustained speculative processes. This effect can only be picked up in
models that include time-series variables since price change dynamics are not
incorporated in cross-section spatial models such as Chomitz and Gray (1996) and
Pfaff (1999). The price of land is only found to be significant in explaining the
proportion of crop area once we take into account serial-correlation. Then it has a
negative sign that means that a higher price of land would reduce the demand for
additional crop areas.
The lack of response of agriculture clearing to output prices was also found by
Cropper, Griffiths and Mani (1999) in Thailand. They test the effect of the prices
of rice and other crops such as Cassava and Maize on land clearing expansion and
do not find any evidence of incentives for deforestation created by agriculture
output prices variation. In our case, one possible explanation for this result is the
existence of subsistence agriculture shifting cultivation, which do not have access
to major markets, and do not respond to output prices. Nonetheless, with such
aggregate data we can only hypothesize about this issue.
Government credit for agriculture, differently from credit for cattle, is found to be
marginally significant in explaining variation of crop areas. Although rural
government credit disbursements have been reduced for the Amazon region during
the last decade, our results suggest that it still constitutes an important incentive
for cropping in many areas. This result is related to similar findings from the work
of Andersen, Granger and Reis (1997) and Pfaff (1999) that found a significant
effect of credit in deforestation incentives.
Paved roads, as expected, are also found to generate agriculture land clearing.
Road construction decrease the transportation costs of inputs and outputs and
create networks for production distribution. Roads also facilitate migration
process and integrate rural labor markets. All this effects increase incentives for
land clearing. Additionally, non-paved roads are also significant in explaining the
evolution of crop area. This result is important due to the growing timber logging
activities in the Amazon which open small non-paved roads to extract timber
creating the possibility for new peasants’ movements in the frontier.
Our results that introduce geographical variables show that the distance to the
federal capital and soil quality are important to explain both the density of cattle
head and the proportion of agriculture area. The expected negative sign is found
for distance, implying that states that are far away in the frontier, controlling for
other variables, have a lower cattle- head density. This effect can be capturing
32
EXPLAINING AGRICULTURE EXPANSION AND DEFORESTATION: EVIDENCE FROM THE BRAZILIAN
AMAZON — 1980/98
precipitation level which is quite important for a profitable agriculture and cattle
activity and it is not included in our model. States localized more far away in the
north have on average higher precipitation rates and a lower probability of
succeeding with cattle-activities [Chomitz and Thomas (2000)].
Although the current study generates important insights on the deforestation
process of the Brazilian Amazon, there are several data and methodological
limitations. A better comprehension of the deforestation process would be
obtained with more desegregated data, such at the municipal level, or even
household units. Such data would enable the application of spatial econometric
techniques which are crucial in understanding deforestation spatial distribution.
Nevertheless, another important component of the deforestation process is
dynamics. A dynamic model is needed in order to fully understand the effects of
land prices, speculation and history dependence of previous settlements.
Another point is related to the proxies used for deforestation. It would be
important to combine in a way undertaken by Pfaff (1999) local census data with
satellite images in order to analyze both the spatial and dynamic distribution of
deforestation. Nevertheless this type of data is not available yet under a large timeseries with sufficient spatial distribution.
The contribution of logging to deforestation is another important issue which is
not taken into account. A reliable database is needed in order to access the
contribution of logging to deforestation and create environmental policies which
are related to the sources of deforestation in the region. Institutional factors are
also important, and the incorporation of property rights in econometric models
should be undertaken in the future. The dynamics of the frontier can only be fully
understood once such institutional effects are introduced in the model. Technology
adoption and technical change are another important feature to be studied. An
increase in technological change could either increase or decrease deforestation
depending on the factors used and the type of technological change introduced.
Therefore, understanding the effect of agriculture R&D on deforestation is crucial
for sustainable policy formulations.
Even with such methodological and data limitations, the results found here are
useful for policy recommendations. The results emphasize the importance of
paved and unpaved roads in driving both the cattle ranching activity and the crop
area expansion. The Brazilian government is proposing under the Avança Brasil
program,24 the construction of a network of paved roads in order to foster growth
and development in the Amazon region. According to our results, the increase in
1% in the extension of paved roads per km2 increases by 0.18% the density of
cattle and 0.15% the proportion of crop area in the region. The elasticities of
unpaved roads are lower, but quite significant with 0.17% for cattle density and
0.12% for crop area. This result is different from the Pfaff (1999) that obtain a
negative coefficient for non-paved roads.
24
See Nepstad et al. (2000) for an overview of the Avança Brasil project.
33
EXPLAINING AGRICULTURE EXPANSION AND DEFORESTATION: EVIDENCE FROM THE BRAZILIAN
AMAZON — 1980/98
Moreover, we note that the impact of roads on cattle and crop area is
overestimated if we do not take into account geographical effects such as distance
to federal capital, soil quality and in the last estimation, fixed-effect.
Although we do not simulate the possible effects of the Avança Brasil program,
this type of infrastructure policies, given the prevailing incentives and institutional
background, are likely to generate a boom in the deforestation process while
imposing serious doubts on the sustainable and equitable economic growth in the
region.
REFERENCES
ALMEIDA, A. L., O. de., CAMPARI, J. S. Sustainable settlement in the Brazilian
Amazon. Oxford, Oxford University Press. 1995.
ALSTON, L. J., LIBECAP, G. D., MUELLER, B. Land reform policies. The sources of
violent conflict and implications for deforestation in the Brazilian Amazon. Journal
of Environmental Economics and Management, 2000.
ALSTON, L. J., LIBECAP, G. D., SCHNEIDER, R. Property rights and the
preconditions for markets: the case of the Amazon frontier. Journal of Institutional
Theoretical Economics, v.151, p. 89-107, 1995.
__________. The determinants and impact of property rights: land titles on the Brazilian
Amazon. NBER, 1996 (Working Paper, 5.405).
ALVES, D. S. An analysis of the geographical patterns of deforestation in Brazilian
Amazônia in the 1991-1996 period. Paper presented in the conference patterns and
processes of land use and forest change in the Amazon. University of Florida,
Gainesville, 1999.
ANDERSEN, L., REIS, E. J. Deforestation development, and government policy in the
Brazilian Amazon: an econometric analisys. IPEA, 1997 (Texto para Discussão,
513).
ANDERSEN, L. E., GRANGER, C. W. J., REIS, E. J. A random coefficient VAR
transition model of the changes in land use in the Brazilian Amazon. Revista de
Econometria, v.17, n.1, 1997.
ANDERSEN, L. E. et alii. Report on Amazon deforestation, 1996. Working Paper
UCSD, 96-40).
ANGELSEN, A. The poverty — environment thesis: was brundtland wrong? Forum for
Development Studies, n. 1, p. 185-154, 1997.
ANGELSEN, A. Agricultural expansion and deforestation: modeling the impact of
population. market forces and property rights. Journal of Development Economics,
v. 58, p.185-218, 1999a.
34
EXPLAINING AGRICULTURE EXPANSION AND DEFORESTATION: EVIDENCE FROM THE BRAZILIAN
AMAZON — 1980/98
__________. A Why do farmers expand their land into forests? Theories and evidence
from Tanzania. Environment and Development Economics, v. 4, p. 313-331, 1999b.
ANGELSEN, A., KAIMOWITZ, D. Rethinking the causes of deforestation: lessons from
economic models. The World Bank Research Observer, v. 4, n. 1, p. 73-98, 1999.
ARIMA, E., UHL, C. Pecuária na Amazônia Oriental: Desempenho Atual e Perspectivas
Futuras. Belém, Imazon, 1996 (Série Amazônia n. 1).
BARBIER, E. B. Institutional constraints and deforestation: an empirical application.
Paper presented at the European Environmental Economic Association Meeting,
1999.
BARBIER, E. B., BURGESS, J. C. Economic analysis of deforestation in Mexico.
Environmental and Development Economics, p. 203-239, 1996.
BINSWANGER, H. P. Brazilian policies that encourage deforestation in the Amazon.
World Development, v.19, n.7, p. 821-829, 1991.
BRANDÃO, A. S. P. Mercado da terra e estrutura fundiária. In: BRANDÃO, A. S. P.
(ed.). Os principais problemas da agricultura brasileira: análise e sugestões. Rio de
Janeiro, PNPE/IPEA, 1988.
CHOMITZ. K. M., GRAY. D. A. Roads, land use, and deforestation: a spatial model
applied to Belize. The World Bank Economic Review, v.10, n.3, p. 487-512, 1996.
CHOMITZ, K. M. THOMAS, T. S. Geographic patterns of land use and land intensity
in the Brazilian Amazon. World Bank, 2000, mimeo.
CROPPER, M. GRIFFITHS, C. The interaction of population, growth and environmental
quality. American Economic Review, v. 84, n. 2, p. 250-254, 1994.
CROPPER, M., GRIFFITHS, C., MANI, M. Roads, Population and deforestation in
Thailand — 1976-1989. Land Economics, v. 75, n. 1, p. 58-73, 1999.
DEACON, R. T. Assessing the relationship between government policy and
deforestation. Journal of Environmental Economics and Management, v.28, p. 1-18,
1995.
DEININGER, K. W., MINTEN, B. Poverty, policies, and deforestation: the case of
Mexico. Economic Development and Cultural Change, v. 47, n. 2, 1999.
FEARNSIDE, P. M. Deforestation in Brazilian Amazon: comparison of recent Landsat
estimates INPA, 1996, mimeo.
FOSTER, A. D., ROSENZWEIG, M. R., BEHRMAND, J. R. Population growth. income
growth and deforestation: management of village commons in India. Quarterly
Journal of Economics (forthcoming).
35
EXPLAINING AGRICULTURE EXPANSION AND DEFORESTATION: EVIDENCE FROM THE BRAZILIAN
AMAZON — 1980/98
GRANGER, C. W. J., HYUNG, N. Correlação espúria em modelos de painel: uma
análise do desmatamento na Amazônia. Pesquisa e Planejamento Econômico, v. 27,
n.3, 1997.
HELFAND, S. The 1995/1996 agriculture census: fiction or fact? Paper presented at the
Nemesis/Pronex meeting. Rio de Janeiro, IPEA, Dec. 1999.
IBAMA. Portaria de Biodiversidade, n. 62, 1997.
INPE. Relatório Anual de Desflorestamento na Amazônia. São José dos Campos, 2000.
KAIMOWITZ, D., ANGELSEN, A. Economic models of tropical deforestation: a
review. Cifor. Bogor, Indonesia, 1998.
MAHAR, D. J. Government policies and deforestation in Brazil´s Amazon Region.
Washington D. C.: World Bank, 1988.
MORAN, D. Deforestation in the Brazilian Amazon. In: SPONSEL, L. E. et al. (ed.).
Tropical deforestation: the human dimension. Columbia University Press: New
York, 1996.
MUELLER, B. Property rights and the evolution of a frontier. Land Economics, v. 73,
n. 10, p. 42-57, 1997.
NELSON, G. C., HELLERSTEIN, D. Do roads cause deforestation? Using satellite
images in econometric analysis of land use. American Journal of Agricultural
Economics, v. 79. p. 80-88, 1997.
NEPSTAD, D. et al. Avança Brasil: os custos ambientais para a Amazônia. Relatório do
projeto “Cenários futuros para a Amazônia”. Belém: Ipam/Instituto Socioambiental,
2000.
PFAFF, A. What drives deforestation in the Brazilian Amazon? Evidence from satellite
and socioeconomic data. Journal of Environmental Economics and Management,
v. 37, p. 26-43, 1999.
REIS, E. J. Os impactos do pólo siderúrgico de Carajás no desflorestamento da
Amazônia brasileira. A Economia Brasileira em Perspectiva — 1996, Rio de
Janeiro, IPEA, v. 2, 1996.
REIS, E. J., BLANCO, F. A Capacidade tributária dos estados brasileiros — 1970/90. A
Economia Brasileira em Perspectiva — 1996. Rio de Janeiro, IPEA, v. 1, 1996.
REIS, E. J., GUZMÁN, R. H. Um modelo econométrico do desflorestamento da
Amazônia. Pesquisa e Planejamento Econômico, v. 23, n. 1, abril, 1993.
REIS, E. J., MARGULIS, S. Options for slowing Amazon jungle clearing. In:
DORNBUSCH, P., POTERBAR, J. (eds.). Economic policy responses to global
warming. Cambridge, MA: MIT Press, 1991.
36
EXPLAINING AGRICULTURE EXPANSION AND DEFORESTATION: EVIDENCE FROM THE BRAZILIAN
AMAZON — 1980/98
SCHNEIDER, R. R. Government and the economy on the Amazon frontier. Washington,
D. C., World Bank, 1995 (World Bank Environment Paper, 11).
SCHNEIDER, R. R. et. al. Amazônia sustentável: limitantes e oportunidades para o
desenvolvimento rural. Brasília, Imazon, 2000 (Série Parcerias Banco Mundial).
SEROA DA MOTTA, R., FERRAZ, C. Estimating timber depreciation in the Brazilian
Amazon. Environment and Development Economics, v. 5, n. 1 e 2, p. 129-142,
Feb./May 2000.
SILVA, A. B. O., MEDINA, M. H. Produto Interno Bruto por unidade da Federação:
1985/98. IPEA (Texto para Discussão, 677).
STAVINS, R. N., JAFFE, A. B. Unintended impacts of public investments on private
decisions: the depletion of forested wetland. American Economic Review, v.80, n. 3,
p. 337-352, 1990.
WALKER, R., MORAN, E., ANSELIN, L. Deforestation and cattle ranching in the
Brazilian Amazon: external capital and household processes. World Development,
v.28, n. 4, p. 683-699, 2000.
YOUNG, C. E. F. Economic adjustment policies and the environment: a case study of
Brazil. Unpublished Ph.D. Dissertation. University College London, 1996.
37
Download