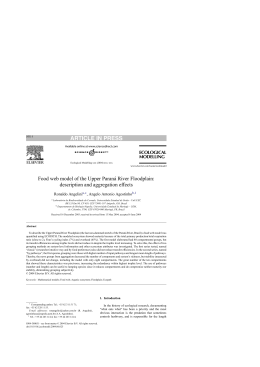
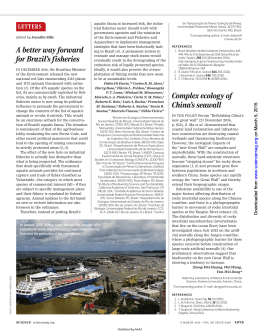
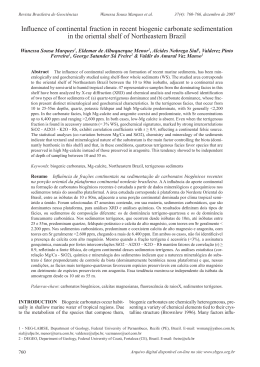
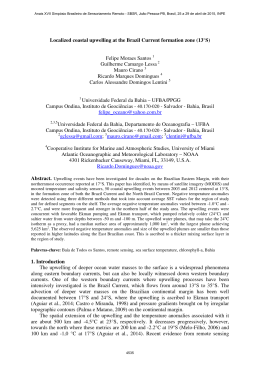
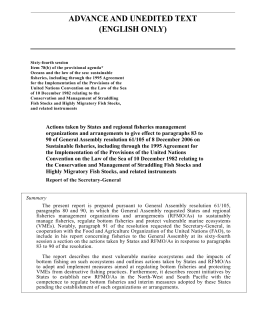
Fisheries Research 50 (2001) 279±295 Fisheries catches and the carrying capacity of marine ecosystems in southern Brazil Marcelo Vasconcellosa,*, Maria A. Gasallab a Fisheries Centre, University of British Columbia, 2204 Main Mall, Vancouver, BC, Canada V6T 1Z4 Instituto de Pesca, Centro de Pesquisa Pesqueira Marinha, Av. Bartolomeu de GusmaÄo, 192, Santos, SP 11030-906, Brazil b Received 1 June 1999; received in revised form 24 February 2000; accepted 25 April 2000 Abstract The carrying capacity of marine shelf ecosystems in southern Brazil for harvestable species is analyzed by (1) quantifying the amount of available primary production appropriated by ®sheries catches, (2) evaluating the trend in the mean trophic level of ®sheries, and (3) simulating the ecosystem effects of ``®shing down the food web'' in an intensively exploited shelf region. Fisheries utilize ca. 27 and 53% of total primary production in the southern and south-eastern shelf regions, respectively. Regional variation in the carrying capacity appropriated by ®sheries results from differences in the primary production, catch volume and trophic transfer ef®ciencies. Overall, ®sheries landings do not display a trend of decreasing trophic level with time due to the collapse of the sardine ®shery and the recent increasing of offshore ®shing for higher trophic level species, mainly tunas and sharks. However, the simulations show that ®shing down the food web through ®sheries that target small pelagic planktivorous ®shes, while at ®rst increasing catches in intensively exploited regions, has the potential of decreasing yields, by interrupting major energy pathways to exploited, high-trophic level species. The consequences of these results to the design of precautionary measures for future ®shing policies are discussed. # 2001 Elsevier Science B.V. All rights reserved. Keywords: Carrying capacity; Shelf ecosystems; Trophic model; Marine ®sheries; Brazil 1. Introduction Recent assessments of the worldwide status of marine capture ®sheries reveal alarming signs of human dominance and impact on the oceans. Fisheries alone appropriate ca. 8% of the total marine primary production and up to one-third of temperate continental shelf systems production (Pauly and Christensen, 1995). Over 60% of the most important ®sh stocks are either overexploited or at the limit of becoming over* Corresponding author. Tel.: 1-604-822-1864; fax: 1-604-822-8934. E-mail addresses: [email protected] (M. Vasconcellos), [email protected] (M.A. Gasalla). exploited by current ®shing intensity (Garcia and Newton, 1997), and approximately 27 million t of non-target animals are discarded annually as ``trash'' ®sh (Alverson et al., 1994). Also, present exploitation patterns are resulting in a ``®shing down marine food webs'' phenomenon, from long-lived, high-trophic level piscivorous ®sh to short-lived, low-trophic level invertebrates and planktivorous pelagic ®shes (Pauly et al., 1998). In line with some of these global trends, marine capture ®sheries of Brazil are in a state of crisis caused by the scarcity of resources, over-capitalization of ®sheries activities and the lack of sound ®sheries management policies. At the same time, there are major efforts to assess the potential production of 0165-7836/01/$ ± see front matter # 2001 Elsevier Science B.V. All rights reserved. PII: S 0 1 6 5 - 7 8 3 6 ( 0 0 ) 0 0 2 1 7 - 4 280 M. Vasconcellos, M.A. Gasalla / Fisheries Research 50 (2001) 279±295 ®shery resources in the Exclusive Economic Zone triggered by the country's rati®cation of the United Nations Convention on the Law of the Sea. Early assessments of the ®sheries resources along the coast during the 1970s (Hempel, 1971; Neiva and Moura, 1977) indicated a potential total catch of over 1 million t per year, yet in fact, since the mid-1980s landings have stabilized around 700 000 t per year, and many of the traditional ®sh stocks have become either fully exploited or overexploited (Dias Neto, 1991a,b; IBAMA, 1994a-c; Reis et al., 1994; Cergole, 1995; Matsuura, 1995; Haimovici et al., 1997). This raises concerns as to whether the level of exploitation can be sustained without impairing the productivity and integrity of the marine ecosystems. Brazil has an extensive coastline from 58N to 348S, including regions of tropical and subtropical climate. Matsuura (1995) divided the Brazilian coast in ®ve regions with distinct environmental characteristics and types of ®shing activities (Fig. 1). In the north, biological production is high as a result of the continental runoff from the Amazon river (Teixeira and Tundisi, 1967). The wide continental shelf and the rich benthic community favor the development of trawling activities in this region, mostly for shrimps and large cat®shes. The northeast and east regions are oligotrophic due to the in¯uence of tropical waters from the Brazil Current. Rocky bottoms and a mostly narrow continental shelf induced the development of hookand-line ®sheries for rock®shes, sharks and tunas. In Fig. 1. Shelf regions of Brazil. Regions defined based on environmental characteristics and types of fishing activities, as suggested in Matsuura (1995). M. Vasconcellos, M.A. Gasalla / Fisheries Research 50 (2001) 279±295 the southeast, primary production is mainly driven by seasonal upwelling of nutrient-rich, cold subtropical waters pumped by alongshore winds and by cyclonic vortexes originated from the Brazil Current (Bakun and Parrish, 1990; Matsuura, 1995). The southern part of the Brazilian coast is under the in¯uence of the subtropical convergence between the southward and northward ¯owing Brazil and Malvinas Currents. The con¯uence of water masses and the high volume of continental runoff provide physical and chemical conditions for high biological production on the shelf (Seeliger et al., 1997). Trawling is the main type of ®shing activity in the south-eastern and southern regions, although the presence of highly abundant pelagic stocks, mainly sardine, in the southeast has also lead to the development of an important purse seine ®shery especially since 1950. The regions also differ in the type of ®sheries production. While catches in the north, northeast and east regions are mainly from artisanal activities (Diegues, 1995), in the southern regions it is the industrial ®sheries provide most of the landings, accounting for approximately half of the total Brazilian catches (IBAMA/IBGE, 1995). Historically, it was in the south and southeast that industrial ®sheries were mostly developed through a series of government incentives, and this is where ®sheries data are best documented. This paper presents a comparative analysis of ®sheries in the south-eastern and southern regions of Brazil which aims to assess the carrying capacity of the marine shelf ecosystems for harvestable species. Carrying capacity has been de®ned as the maximum size of a population or activity that could be inde®nitely sustained without degrading the ecosystem's future productivity or suitability for that use (Odum, 1997). In the oceans, carrying capacity is usually referred to as the upper limit of biomass of organisms that can be supported by a set of primary production and food web structure (Christensen and Pauly, 1998). Fisheries yield is directly related to the carrying capacity of marine ecosystems, since there is a maximum sustainable rate of ®sh production associated with the total ®sh biomass at the carrying capacity. Fisheries can directly affect the carrying capacity of marine ecosystems by altering the structure of food webs and changing their potential productivity. Ecosystem carrying capacity is analyzed in three ways. 281 First by computing the total ¯ux of energy, originated from primary producers, available to different trophic levels in the food web, and the total primary production required to sustain ®sheries catches (Pauly and Christensen, 1995). The ratio of these two quantities provides a measure of the ``appropriated carrying capacity'' (sensu Rees, 1996) of ecosystems, i.e. the amount of the available energy in an ecosystem already appropriated by ®sheries catches. Second, we present a diagnosis of ®sheries for the ``®shing down the food web'' phenomenon using trophic level estimates and national and regional catch statistics. Third, the impact of ®sheries on the structure of an exploited ecosystems is evaluated by simulating the effect of a ``®shing down the food web'' scenario in the southern shelf region, where traditional demersal ®sh stocks are overexploited and the prospects for increasing yield rely on exploiting abundant small pelagic forage ®sh. 2. Methods The method used here to quantify the appropriated carrying capacity follows the approach developed by Pauly and Christensen (1995) for the analysis of primary production required to sustain world ®sheries. Primary production required by ®sheries (PPR) is estimated based on the trophic level of the species caught, the energy transfer ef®ciency between trophic levels, and on the primary productivity of the two shelf regions (Table 1). Primary production estimates for the southeast and south were obtained from Brandini (1990) and Odebrecht and Garcia (1997), respectively. Species trophic levels (Table 2) were computed according to Odum and Heald (1975) using available information on diet composition, and from trophic models. In this analysis, primary producers are trophic level 1, and each higher order consumers are trophic level 1 plus the weighted average trophic level of its preys. Rocha et al. (1998) constructed a trophic model of the Ubatuba region in the south-eastern shelf that is here used to calculate the mean trophic transfer ef®ciency for the region. Mean trophic transfer ef®ciency for the southern shelf is calculated from the trophic model described below. In these models, transfer ef®ciencies are calculated as the percentage of throughput entering a trophic level that is subse- 282 M. Vasconcellos, M.A. Gasalla / Fisheries Research 50 (2001) 279±295 Table 1 Area, primary productivity and total primary production of southern and south-eastern shelf regions of Brazila Region Southeast South a b Area (1010 m2) 17.14 11.40 PP (gC mÿ2 per year) Minimum Likeliest Maximum 33 72 84 160 158 382 Total PP (1012 gC per year)b 14.40 18.25 Shelf areas were measured to the 200 m depth line using planimetry. Based on the likeliest primary productivity. Table 2 Trophic level of the main species landed in Brazil Table 2 (Continued ) Group Species Trophic levela Shrimps Penaeus brasiliensis Penaeus spp. Xiphopenaeus kroyeri 2.3 2.3 2.3 Lobsters Panulirus argus Panulirus spp. 2.6 2.6 Small and mid-size pelagics Sardinella brasiliensisb Engraulididae Scomber japonicus Scomberomorus spp. 2.8 3.0 3.1 3.3 Common squids Loligo spp. 3.4 Miscellaneous marine fishesc Osteichthyes Micropogonias furnierid,e Umbrina canosaif Cynoscion spp.g,h Macrodon ancylodoni Trichiurus lepturusj Balistes capriscusk Pomatomus saltatrixl Pinguipes spp.k Ariidaem Mugilidaek 3.5 3.4±3.5 3.2 3.9±4.0 4.3 4.3 3.4 4.2 3.8 3.8 3.8 Sharks, rays and skates Elasmobranchsk,n 3.4±3.8 Groupers Epinephelus spp. Mycteroperca spp. 3.7 3.7 Snappers Lutjanidae Ocyurus chrysurus 3.8 3.8 Common dolphinfish Coryphaena hippurus 3.9 o Group Species Trophic levela Thunnus thynnus Xiphias gladius Other Scombroidei 3.9 3.9 3.9 a Trophic level estimates are from the model in Fig. 2, from diet composition studies (references in table footnote), and/or from other published trophic models (Christensen and Pauly, 1993). b Goitein (1983) and Gasalla and Oliveira (1997). c Vazzoler et al. (2000). d Gasalla (1995). e Vazzoler (1975). f Haimovici et al. (1989). g Gasalla (1995). h Vieira (1990). i Juras and Yamaguti (1985). j Martins and Haimovici (1997). k Froese and Pauly (1998). l Haimovici and Krug (1992). m Araujo (1984). n Soares et al. (1992). o Vilela (1990). p Zavala-Camin (1987). q Vaske (1992). r Vyalov and Ovchinnikov (1980). quently passed on to the next trophic level or harvested. PPR estimates are based on a conversion factor of 0.06 g carbon1 g wet weight of catches (Walsh, 1981) and on the mean transfer ef®ciency per trophic level, i.e. Skipjack tuna Katsuwonus pelamis 3.9 PPR catches a TLÿ1 Tuna-like fishesp,q,r Thunnus Thunnus Thunnus Thunnus 3.9 3.9 3.9 3.9 where aTEÿ1, and TE is the mean trophic transfer efficiency between consecutive trophic levels (TLs). PPR is commonly expressed as a percentage of the total primary production (%PP). alalunga albacares atlanticus obesus M. Vasconcellos, M.A. Gasalla / Fisheries Research 50 (2001) 279±295 In order to account for uncertainties on parameter estimates, a Monte Carlo sampling procedure was designed to generate con®dence intervals around the estimated PPR values. Two sources of uncertainties were considered: uncertainty on primary production, which was represented by triangular distributions de®ned by the most likely, minimum and maximum values in Table 1, and uncertainty on the species trophic level, which we considered to be within a 10% error around our estimates. Relatively small variations in the trophic level of an organism are expected from shifts in its diet following changes in prey abundance, but large variations will be generally limited by biological constraints imposed, for instance, by morphology (e.g. a piscivore will never succeed in ®lter-feeding on plankton). Catch statistics obtained from Haimovici et al. (1997), Haimovici (1998) and from the Instituto de 283 Pesca, SaÄo Paulo, and IBAMA/CEPSUL were used in the analysis of PPR between the two shelf regions. FAO catch statistics of reported Brazilian catches were used to compute the mean trophic level of landings in Brazil from 1950 to 1994. We explored the ecosystem effects of ``®shing down the food web'' for anchovy in the southern shelf with a simpli®ed mass-balance model (ECOPATH; Christensen and Pauly, 1992) of the trophic interactions in the pelagic ecosystem (Tables 3 and 4, Fig. 2). The model was constructed based on the pelagic species association described by Mello et al. (1992) for the winter and spring, and depicts anchovy as the dominant planktivorous ®sh species, being responsible for most of the transfer of energy from lower trophic levels to higher order consumers (Fig. 2). The system is de®ned by the coordinates 32±438300 S and 51±548W with a total area of 28 661 km2. Table 3 Parameters of the trophic model of the pelagic ecosystem off southern Brazila Species/group TL B (t kmÿ2) P/B (per year) Q/B (per year) EE Yield (t kmÿ2 per year) Cutlassfish Hake Sharks Other pelagics Weakfish Mackerel Jack Mackerel Anchovy Squids Marine shrimps Zooplankton Phytoplankton Detritus 4.25 4.11 3.94 4.02 3.59 3.11 3.11 3.00 3.32 2.00 2.11 1.00 1.00 0.240b 0.085 0.342 0.748 2.000h 1.329 0.300i 13.710j 0.200l 0.298 9.000n 16.700o 150.000p 0.410d 0.355d 0.400f 0.570f 0.480d 0.340f 0.350i 1.290k 1.500f 3.930m 64.920n 100.000o ± 2.050e 1.750e 4.000f 5.300f 2.340e 2.710e 3.000e 5.155e 3.230f 19.130f 324.600 ± ± 0.852 0.950 0.950 0.950 0.935 0.950 0.958 0.240 0.894 0.950 0.619 0.965 1.148 0.015c 0.004c 0.130c 0.405g 0.306c 0.033g 0.054g ± ± 0.040g ± ± ± a Values in italic and trophic levels (TLs) were estimated by the model. Martins and Haimovici (1997). c Haimovici (1998). d Based on Peterson and Wroblewski (1984). e Based on Palomares and Pauly (1989). f Based on other trophic models (Christensen and Pauly, 1993). g Haimovici et al. (1997). h IBAMA (1993). i Saccardo (1980). j Lima and Castello (1995). k Freire (unpublished). l Haimovici (1997). m D'Incao (1991). n Resgalla Jr. (unpublished). o Odebrecht and Garcia (1997). p According to Pauly et al. (1993). b 284 M. Vasconcellos, M.A. Gasalla / Fisheries Research 50 (2001) 279±295 Table 4 Diet matrix of the model of the pelagic ecosystem off southern Brazila Prey/predator 1 2 3 4 5 6 7 8 9 10 11 1. Cutlassfish 2. Hakec 3. Sharksd 4. Other pelagicse 5. Weakfishe,f 6. Mackerele 7. Jack Mackerele 8. Anchovyg 9. Squidsh 10. Mar. shrimpsi 11. Zooplankton 12. Phytoplankton 13. Detritus 0.140 0.020 ± ± 0.120 ± 0.030 0.570 0.050 0.010 0.010 ± ± ± 0.100 ± ± ± ± 0.030 0.800 0.030 ± ± ± ± ± ± ± ± 0.050 ± 0.020 0.330 0.030 0.070 ± ± ± ± ± ± ± 0.050 0.100 ± 0.300 0.050 0.050 ± ± ± ± ± ± 0.050 ± ± 0.450 ± 0.200 0.200 ± ± ± ± ± ± ± ± ± ± ± 0.010 0.990 ± ± ± ± ± ± ± ± ± ± ± ± 1.000 ± ± ± ± ± ± ± ± ± ± ± ± 0.900 0.050 0.050 ± ± ± ± 0.050 ± ± 0.150 ± ± 0.800 ± ± ± ± ± ± ± ± ± ± ± ± ± 0.200 0.800 ± ± ± ± ± ± ± ± ± ± 0.100 0.550 0.350 Import 0.050 0.040 0.500 0.450 0.100 ± ± ± ± ± ± b a Values represent the proportion of the diet of a predator (column) made of a given prey (row). Some of the groups (mainly sharks, weakfish, and other pelagics) have several feeding habitats such as the outer shelf and benthic habitats. For these groups an import was included as a ``prey'' in the diet composition. b Martins (1992). c Haimovici et al. (1993). d Castello et al. (1997). e Castello (1997). f Vieira (1990). g Schwingel and Castello (1995). h Haimovici (1997). i Based on other trophic models (Christensen and Pauly, 1993). Trophic mass-balance models in ECOPATH rely on a system of linear equations which for any given group i can be represented for any time interval by n X P Q EEi ÿ Bj DCji ÿ Y EXi DBi Bi B i B j j1 (1) where Bi is the biomass of i during the period in question, (P/B)i the production/biomass ratio, EEi the ecotrophic efficiency, i.e. the fraction of the production of i that is consumed within the system or harvested, Yi the yield (with YiFiBi, and F as the fishing mortality), Bj the biomass of consumers or predators, (Q/B)i the food consumption per unit of biomass of j, and DCji the fraction of i in the diet of j. DBi is the biomass accumulation rate per time in cases where the analysis does not use data from an initial equilibrium situation. ``Fishing down the food web'' was simulated by increasing fishing mortality F for anchovy from 0 to 1 per year, while maintaining F constant for other exploited groups. We used ECOSIM (Walters et al., 1997) to calculate the predicted changes in equilibrium biomasses of species/group and the total catch from the system over the range of F values for anchovy. The model provides biomass predictions of each group in the system as affected directly by fishing and predation, changes in food availability, and indirectly by fishing or predation on other groups in the system (Walters et al., 1997). Different hypotheses about ``top-down'' versus ``bottom-up'' control of trophic interactions were tested by setting the maximum instantaneous mortality rate that consumer j could ever exert on food resource i (see Walters et al., 1997). Setting low values (in our case four times the baseline mortality rate) lead to bottomup control where prey availability governs the productivity of predators, while high values (20 times the baseline mortality rate) lead to top-down control where changes in the biomass of predators lead to cascade effects in the food web. M. Vasconcellos, M.A. Gasalla / Fisheries Research 50 (2001) 279±295 285 Fig. 2. Flowchart of trophic relationships in the pelagic association off southern Brazil. It describes the flows between groups (boxes), the biomass of each group (area of boxes proportional to the log of biomass), and the respective trophic levels. Only the consumption flows are shown. For full parameter descriptions, see Tables 3 and 4. 3. Results 3.1. PPR and trophic levels PPR estimates by shelf region and species landed are shown in Tables 5±7. Fig. 3 shows the expected PPR when uncertainties on primary production and species trophic level are taken into account. Fisheries in southern Brazil already use a large proportion of the productive capacity of the shelf ecosystems. In the south, primary production required to sustain catches has changed little from the 1970s to the 1990s, being Fig. 3. Fisheries landings and PPR estimates for the south and southeast during two time periods. PPR is expressed as percentage of total primary production. The mean (dot) and 95% interval (line) of PPR estimates were obtained by resampling from the primary production and trophic level estimates. 286 M. Vasconcellos, M.A. Gasalla / Fisheries Research 50 (2001) 279±295 Table 5 Trophic level, mean catch and PPR estimates for the southern shelf Species Micropogonias furnieri Umbrina canosai Cynoscion guatacupa Macrodon ancylodon Miscellaneous teleosteansa Netuma spp. Trichiurus lepturus Demersal sharksb Rhinobatus horkelli Rays and skates Marine shrimps Small and mid-size pelagicsc Pomatomus saltatrix Mugil spp. Katsuwonus pelamis Pelagic sharks Tuna-like fishes 1975±1979 1990±1994 Trophic level Catches (t) PPR (1010 gC) Catches (t) PPR (1010 gC) 3.5 3.2 3.9 4.3 3.5 3.8 4.3 3.8 3.4 3.6 2.3 3.2 4.2 3.8 3.9 3.7 3.9 14308 16900 6439 7941 4052 3983 75 2584 1010 116 ± 1549 4290 2081 ± 182 915 42.8 26.2 66.5 184.0 16.2 31.1 1.8 17.4 2.95 0.5 ± 1.4 89.8 14.7 ± 1.0 8.5 14709 9629 8785 3966 4143 615 441 5931 460 746 1148 3848 3521 1524 8088 547 2402 44.1 14.9 90.7 91.9 14.2 4.8 11.0 39.8 1.3 3.2 0.2 5.2 73.7 10.8 71.8 3.0 22.4 a Pogonias cromis; Merluccius hubbsi; Paralichthys spp., Pagrus pagrus; Prionotus punctatus; Urophycis brasiliensis and Poliprion americanus. b Mostly Galeorhinus galeus; Mustelus schmitti and Squatina spp. c Brevoortia pectinata; Scomber japonicus and Trachurus lathami. in the order of 27% of the total primary production. Little change is also observed in the mean trophic level of ®sheries in the south which have been targeting mostly high-trophic level species (Tables 5 and 7). An increase in catches of tunas and sharks was observed in the southern shelf in the early 1990s accompanying the depletion of important demersal ®sh stocks, such as Umbrina canosai, Macrodon ancylodon and cat®sh species, Netuma spp. (Table 5). This alternation of species in the catches did not result in major changes in the PPR or in the mean trophic level of landings between the two periods. Landings in the southeast are on the other hand dominated by low-trophic level species, sardine and marine shrimps being the most important stocks in terms of catch volume (Table 6). With the collapse of Table 6 Trophic level, mean catch and PPR estimates for the south-eastern shelf Species Micropogonias furnieri Macrodon ancylodon Cynoscion jamaiscencis Balistes capriscus Sardinella brasiliensis Rays and skates Marine shrimps Sharks Katswonus pelamis Tuna-like fishes Trophic level 3.4 3.7 4.0 3.4 2.8 3.4 2.3 3.8 3.9 3.9 1977±1980 1990±1995 10 Catches (t) PPR (10 gC) PPR (1010 gC) 7126 2053 1921 ± 146520 63.9 36.7 92.2 ± 193.2 17371 517 1380 694 5.1 12.8 47.6 25.4 4541 1870 2245 2144 54414 504 13997 2144 7197 4771 40.7 33.4 107.7 19.8 71.7 4.7 4.1 53.2 248.5 174.9 M. Vasconcellos, M.A. Gasalla / Fisheries Research 50 (2001) 279±295 287 Table 7 Summary statistics of the mean catch, mean trophic level (TL), mean transfer efficiency (TE), the primary production required by fisheries catches (PPR), and the percentage of the total primary production appropriated by fisheries (%PP) in the southern and south-eastern shelves Region Catch (t per year) TL TE (%)a PPR (1010 gC per year) %PP Southern 1975±1979 1990±1994 66425 70503 3.6 3.6 8 505 503 27.7 27.6 South-eastern 1977±1980 1990±1995 177582 93826 2.8 3.1 5 477 758 33.1 52.7 a Transfer efficiencies are estimated from trophic models in Rocha et al. (1998) and from this paper. the Brazilian sardine during the late 1980s and early 1990s, and the increase in tuna and sharks catches, there was an increase in the mean trophic level of ®sheries from 2.8 to 3.1 (Table 7). Although catches were considerably lower in the latter period, the change in relative importance of the species landed resulted in an increase in PPR from 33.1 to 52.7% of the total shelf primary production. Note that PPR values as high as 100% are obtained for the southeastern shelf depending on the input values for primary production and trophic level (Fig. 3). Higher PPR values in the southeast result from the combined effect of higher catches, lower primary productivity and lower trophic transfer ef®ciencies compared to the southern shelf (Table 7). The increasing trend in the mean trophic level of catches is also observed in the FAO ®sheries statistics for Brazil (Fig. 4). Fisheries in Brazil had a relatively constant mean trophic level of the species landed from 1950 to the early 1980s, but show a recent increase in mean trophic level caused by the combined effect of the collapse of small and mid-size pelagics (mostly sardine) and the increasing landings of large pelagic ®shes (tunas and sharks) with the development of offshore ®sheries. 3.2. Fishing down the food web A strategy very often proposed to increase catches in exploited ecosystem is to ®sh down the food web for highly abundant, small pelagic planktivorous ®shes, after larger species are depleted. Simulation results of ®shing down food web scenario for anchovy in the southern shelf are shown in Figs. 5 and 6. Fig. 5 represents the predicted equilibrium yield and biomass of anchovy, and the percentage change in biomass of all other groups in the system under ``topdown'' and ``bottom-up'' control of trophic interactions. The model predicts considerably smaller yields and optimal ®shing mortality rates for anchovy under top-down control (Fmsy top-down 0.1 per year; Fmsy bottom-up 0.3 per year). Both hypotheses generate a similar pattern of decrease in biomass of higher trophic level species, increase in biomass of midtrophic level groups and increase in zooplankton biomass with increasing F for anchovy. Predictions of biomass changes at the mid-trophic level are more pronounced under top-down control, where the release in predation mortality due to the depressed biomass of top predators leads to a sharp increase of jack mackerel abundance. Fig. 6a shows the changes in the total production (catches from all groups) at trophic level with increasing equilibrium ®shing mortality for anchovy. Fishing down the food web has the effect of increasing yield up to a threshold ®shing mortality rate for anchovy Fmsy beyond which ®sheries production become gradually impaired by over®shing and by divergence or complete interruption of major energy pathways to the higher trophic levels. With the over®shing of anchovy, total catches decrease and the mean trophic level of catches increases (lesser low-trophic level species in the catches). The backward bending curve between the mean trophic level of catches and total catch suggests that production at trophic level becomes considerably smaller when anchovy is over®shed, i.e. the system is unable to capitalize the energy previously available for ®sheries and other organisms at the higher trophic 288 M. Vasconcellos, M.A. Gasalla / Fisheries Research 50 (2001) 279±295 Fig. 4. Mean trophic level (A), and species composition (B and C) of total Brazilian landings (source: FAO). levels. The depressed abundance and productivity of top predators in turn impede the complete recovery of the mean trophic level of catches, which become composed mainly by mid-trophic level groups also targeted by ®sheries. Parallel changes occur in the mean trophic level of the system (Fig. 6b). The mean trophic level of the system is smaller than that of ®sheries catches (due to the contribution of zooplankton and phytoplankton), and shows a progressive decrease with the increase in anchovy exploitation. With ``bottom-up'' control, total system production at the end of the simulation is smaller than that originally obtained before ®shing down the food web. These generic effects are attenuated under ``top-down'' control when the model predicts that total catch may remain high after anchovy depletion as a result of the sharp increase in abundance of other mid-trophic level species (e.g. Jack Mackerel, Fig. 5) also targeted by ®sheries. 4. Discussion The primary production required to sustain marine capture ®sheries in southern Brazil is estimated to vary between 27 and 53% of the total shelf primary production. Results indicate a level of ®sheries impact in this portion of the Brazilian coast comparable to the most intensively exploited temperate shelf ecosystems of the world (Pauly and Christensen, 1995), where ®sheries utilize up to one-third of the primary production. Fisheries in the upwelling ecosystem of the south-eastern shelf appropriate a larger proportion of the primary production than in the southern shelf due to the combined effect of higher catches, lower primary productivity and lower trophic transfer ef®ciencies. Upwelling ecosystems are considered relatively inef®cient in transferring energy up the food web. Trophic transfer ef®ciencies of ca. 5% were estimated by Jarre-Teichman and Christensen M. Vasconcellos, M.A. Gasalla / Fisheries Research 50 (2001) 279±295 289 Fig. 5. Equilibrium simulation of increasing fishing mortality for anchovy. Upper panel represents the predicted equilibrium yield and absolute biomass of anchovy. Lower panels show the predicted relative change in biomass of all other groups in the system. 290 M. Vasconcellos, M.A. Gasalla / Fisheries Research 50 (2001) 279±295 Fig. 6. Relationship between (A) total catch from the system and the mean trophic level of catches, and (B) total catch and the mean trophic level of the system (detritus excluded) with increasing fishing mortality for anchovy. The arrows indicate the direction of increase in F, and the dots correspond to 0.01 increments in fishing mortality (from 0 to 1 per year). (1998) for four major upwelling ecosystems, which are lower than the mean of ca. 10% computed across different types of aquatic ecosystems (Pauly and Christensen, 1995). Their energetic inef®ciency seems to be related to the characteristics of primary productivity and food web organization. The high and variable new primary production characteristic of upwelling systems yields a higher export of carbon compared to more stable and less productive systems, where most of the primary production is regenerated (Berger et al., 1989). Our PPR estimates may be conservative considering that discards were not included in the calculations, and that part of the catches may remain unreported in of®cial ®sheries statistics (Gasalla and TomaÂs, 1998). Both unreported catches and discards can cause the underestimation of the footprint of ®sheries, and bias the estimated mean trophic level of landings. Haimovici et al. (1997) suggested that discards might represent ca. 25% of total annual catches in the southern shelf. Including discards in our estimates for this region, with the same mean trophic level of the species M. Vasconcellos, M.A. Gasalla / Fisheries Research 50 (2001) 279±295 landed, raises the expected PPR for the early 1990s from 5031010 to 6111010 gC per year and from 27.6 to 33.5% of the total primary production. The high PPR values in the southern shelf corroborate the fact that most commercially important estuarine, coastal, and shelf stocks are either fully or overexploited in the region, and landings are expect to decrease with current ®shing pressure (Haimovici et al., 1997). The prospect of increasing catches in the region has to come from two non-exclusive strategies: (i) by better utilizing or recovering stocks which are currently over®shed, such as most demersal stocks (Table 5), and/or (ii) by ``®shing down the food web'' for alternative resources not yet utilized, mostly anchovy and jack mackerel (Haimovici et al., 1997). Fishing down the food web has been shown to increase catches up to threshold ®shing intensity beyond which ®sheries production may become impaired by shifts in major energy pathways in the system (Fig. 6). Can this type of ®sheries-induced change in the ecosystem happen? Fishing down the food web is not an observed phenomenon in Brazil. Instead, ®sheries have been targeting high-trophic level species, with the exception of sardine in the southeast, and show a recent increasing trend due to the development of offshore ®sheries for high-trophic level species such as tunas and pelagic sharks. This increasing trend of mean trophic level of ®sh landings was also obtained by Pauly et al. (1998) for the Southwest Atlantic, and attributed to the development of new ®sheries, which, according to the authors, tend to mask the ®shing down the food web phenomenon. In Brazil, both national and regional data indicate that although ®sheries expanded into areas/stocks not previously exploited there is no underlying downward trend in the mean trophic level of catches. Regional experience with intensive ®shing for a forage species in south-eastern Brazil has shifted a system that once supported a large ®shery for sardine to one occupied by an abundant population of anchovy, Engraulis anchoita, that is not commercially harvested (Castello et al., 1991). Nonetheless, the extent to which the collapse of the sardine ®shery and the switch to an anchovy-dominated system was due to human or natural factors is still inconclusive (Rossi-Wongtschowski et al., 1996). Many marine ecosystems underwent major ``regime shifts'' or changes in species composition and production rates 291 apparently triggered by environmental factors but intensi®ed by the effect of ®sheries (Steele, 1996). Among the most documented examples are the sardine/anchovy switches in coastal upwelling systems (Lluch-Belda et al., 1989), the gadoid outbursts in the North Sea (Cushing, 1980; Daan, 1980), and the decline of marine mammals and outburst of pollock in the Bering Sea (Trites et al., 1999). On the other hand, recent global assessments of the trophic level of marine ®sheries (Pauly et al., 1998) provide evidence of the ®shing down food web phenomenon and of associated ®sheries-induced changes in the food webs similar to that predicted in Fig. 6. Much scienti®c debate on the causes of shifts in species compositions in many marine ecosystems has been focusing on a ``bottom-up'' perspective in which the effect of physical forcing, mediated through climatic±oceanographic processes, leads to changes in primary production and reproductive success of ®sh populations which in turn will trigger changes up in the food web (Beamish, 1995; Bakun, 1996). An alternative ``top-down'' perspective, mostly applied in the study of lakes, asserts that predation affects directly and indirectly the structure of populations and communities, and production processes at all trophic levels in the food web (Kitchell et al., 1994). Model simulations allowed us to explore the effects of both assumptions in predicting the changes in the food web accompanying the exploitation of anchovy. Under topdown control, the system responded with a marked increase in the biomass of a competitor species due to cascade effects in the food web. This pattern was not observed under bottom-up control, when competitions for food resources were limiting interactions. These results, also obtained by Mackinson et al. (1997) for other ecosystems, differ from the early emphasis placed on food competition as the driving force of species replacement (Cushing, 1980; Daan, 1980), but reinforce the potential role of predation mechanisms and trophic cascades effects in shaping the dynamics of mid-trophic level, forage species. The predicted Fmsy values for anchovy were also very sensitive to the type of control of trophic interactions. Bottom-up control generally produces a catch curve that achieves an asymptote at higher Fs, predicting that the stock can sustain much higher ®shing pressure before it begins to decline. This occurs because under bottom-up control, predation mortality rate (MijQij/Bi) tends 292 M. Vasconcellos, M.A. Gasalla / Fisheries Research 50 (2001) 279±295 to remain more stable, while the consumption rate (Qi/ Bi) of anchovy increases more, due to donor control of total food eaten, making it more productive per biomass. Strong predation control prevents higher yields under top-down control. These results, so far impossible to predict with single-species approaches, offer warning to novice users of multi-species approaches regarding model sensitivity to trophic control assumptions (Mackinson et al., 1997; Walters et al., 1997). The model offers the possibility to test other complementary hypothesis to the classic top-down and bottom-up controls, such as the ``wasp waist'' control suggested by Rice (1995) to represent ecosystems regulated up and down from the middle usually occupied by small pelagic ®sh. For the hypotheses tested in this paper, the model predicted optimal ®shing mortality rates for anchovy close to the range of sustainable Fs for small pelagic stocks observed by Patterson (1992). This paper con®rms that ®sheries in southern Brazil already utilize a large proportion of the marine shelf ecosystem carrying capacity. In line with recent stock assessment reports, this indicates that the prospect of increasing catches and recovering the status of ®sheries activities must rely on better management of the stocks currently over®shed, and those offshore resources currently moderately exploited (as reported in IBAMA, 1994b; Matsuura, 1995), and/or ®shing down the food web for abundant short-lived, planktivorous ®shes. It is showed, however, that in an intensively exploited ecosystem the proposal for increasing ®sheries production by harvesting at lower levels in the food web has the potential risk of aggravating the depletion of high-trophic level species besides altering the structure of the ecosystem, and thus must be approached with caution. The adoption of precautionary measures and ecosystem principles in ®sheries policy decisions has been, at least theoretically, common in ®sheries literature and government agendas worldwide (see FAO Code of Conduct for Responsible Fisheries, Oceans Act Canada; GESPE, 1997). One such principle states that ``regulation of the use of living resources must be based on understanding the structure and dynamics of the ecosystem of which the resource is a part and must take into account the ecological (. . .) in¯uences that directly and indirectly affect resource use'' (Mangel et al., 1996). If ecosystem principles and precautionary measures are to be effectively implemented, managers and decision makers have to take the possibility of such ecosystem impacts of ®shing down the food web into account when designing policies for the exploitation of marine resources. Acknowledgements We thank Daniel Pauly, Jorge Pablo Castello and Manuel Haimovici for valuable suggestions and review of early manuscripts. We also thank Humber A. Andrade, AcaÂcio R.G. TomaÂs and FlaÂvia M. Saldanha Correia, for providing important data for this work, and Charrid Resgalla Jr., for his participation in the construction of an early version of the trophic model. Thanks are also given to the Instituto de Pesca (SaÄo Paulo, Brazil) for supporting a visit of M.A. Gasalla to the FC, UBC. This study was conducted while the author held a sponsorship from the Conselho Nacional de Desenvolvimento Cientõ®co e TecnoloÂgico, CNPq/Brazil. References Alverson, D.L., Freeberg, M.H., Murawski, S.A., Pope, J.G., 1994. A global assessment of fisheries bycatch and discards. FAO Fish. Technical Paper 339, 233. Araujo, F.J., 1984. HaÂbitos alimentares de treÃs espeÂcies de bagres marinhos (Ariidae) no estuaÂrio da Lagoa dos Patos, RS, Brasil. AtlaÃntica (Rio Grande) 7, 47±63. Bakun, A., 1996. Patterns in the ocean. Ocean processes and marine population dynamics. California Sea Grant, 323 pp. Bakun, A., Parrish, R., 1990. Comparative studies of coastal pelagic fish reproductive habitat: the Brazilian sardine (Sardinella aurita). J. Cons. Int. Explor. Mer. 46, 269±283. Beamish, R.J. (Ed.), 1995. Climate Change and Northern Fish Populations (Canadian Special Publication). Fisheries and Aquatic Sciences 121, 739 pp. Berger, W.H., Smetacek, V.S., Wefer, G., 1989. Ocean productivity and paleoproductivity Ð an overview. In: Berger, W.H., Smetacek, V.S., Wefer, G. (Eds.), Productivity of the Ocean: Present and Past. Wiley, New York, pp. 1±35. Brandini, F.P., 1990. Primary production and phytoplankton photosynthetic characteristics in the south-eastern Brazilian coast. Bolm Inst. Oceanogr. S. Paulo 38 (2), 147±159. Castello, J.P., 1997. Pelagic teleosts. In: Seeliger, U., Odebrecht, C., Castello, J.P. (Eds.), Subtropical Convergence Environments. The Coast and Sea in the Southwestern Atlantic. Springer, Berlin, pp. 123±128. Castello, J.P., Habiaga, R.P., Amaral, J.C., Lima Jr., I.D., 1991. ProspeccËaÄo hidroacuÂstica e avaliacËaÄo da biomassa de sardinha e M. Vasconcellos, M.A. Gasalla / Fisheries Research 50 (2001) 279±295 anchoita na regiaÄo sudeste do Brasil (outubro/novembro de 1988). Bolm Inst. Oceanogr. S. Paulo 8, 15±30. Castello, J.P., Haimovici, M., Odebrecht, C., Vooren, C.M., 1997. The continental shelf and slope. In: Seeliger, U., Odebrecht, C., Castello, J.P. (Eds.), Subtropical Convergence Environments. The Coast and Sea in the Southwestern Atlantic. Springer, Berlin, pp. 171±179. Cergole, M.C., 1995. Stock assessment of the Brazilian sardine, Sardinella brasiliensis, of the south-eastern coast of Brazil. Sci. Mar. 59 (3±4), 597±610. Christensen, V., Pauly, D., 1992. ECOPATH II Ð a software for balancing steady-state models and calculating network characteristics. Ecol. Model. 61, 169±185. Christensen, V., Pauly, D. (Eds.), 1993. Trophic models of aquatic ecosystems. In: ICLARM Conference Proceedings No. 26. ICLARM, Manila, Philippines, 390 pp. Christensen, V., Pauly, D., 1998. Changes in models of aquatic ecosystems approaching carrying capacity. Ecol. Appl. 8 (1), 104±109. Cushing, D.H., 1980. The decline of the herring stocks and the gadoid outburst. J. Cons. Int. Explor. Mer. 39, 70±81. Daan, N., 1980. A review of replacement of depleted stocks by other species and the mechanisms underlying such replacement. Rapp. P. -v. ReÂun. Cons. Int. Explor. Mer. 177, 405± 421. Dias Neto, J., 1991a. A pesca da Piramutaba (Brachyplatystoma vaillanti, Val.) na regiaÄo norte do Brasil. AtlaÃntica 13 (1), 11± 20. Dias Neto, J., 1991b. Pesca de camaroÄes no norte do Brasil. AtlaÃntica 13 (1), 21±28. Diegues, A.C.S., 1995. Povos e Mares: Leituras em SoÂcioantropologia MarõÂtma. NUPAUB, University of SaÄo Paulo, Brazil, 260 pp. D'Incao, F., 1991. Pesca e biologia de Penaeus paulensis na Lagoa dos Patos, RS. AtlaÃntica (Rio Grande) 13 (1), 159±169. Froese, R., Pauly, D. (Eds.), 1998. FishBase '98. Concepts, Design and Data Sources. ICLARM, Manila, Philippines. Garcia, S.M., Newton, C., 1997. Current situation, trends, and prospects in world capture fisheries. In: Pikitch, E.K., Huppert, D.D., Sissenwine, M.P. (Eds.), Global Trends: Fisheries Management, Vol. 20. Proceedings of the American Fisheries Society Symposium, Maryland, pp. 3±27. Gasalla, M.A., 1995. OrganizacËaÄo troÂfica da ictiofauna do Saco de MamanguaÂ, Parati, Estado do Rio de Janeiro. M.Sc Thesis. Instituto OceanograÂfico, University of SaÄo Paulo, Brazil, 145 pp. Gasalla, M.A., Oliveira, M.R., 1997. Papel troÂfico de clupeõÂdeos da costa sudeste do Brasil. In: Proceedings of the XIIth Encontro Brasileiro de Ictiologia (Abstracts). Instituto OceanograÂfico, University of SaÄo Paulo, SaÄo Paulo. Gasalla, M.A., TomaÂs, A.R.G., 1998. An evaluation of the status of fisheries data collection and stock assessment problems in SaÄo Paulo, south-eastern Brazil. In: Quinn II, T.J., Funk, F., Heifetz, J., Ianelli, J.N., Powers, J.E., Schweigert, J.F., Sullivan, P.J., Zhang, C.-I. (Eds.), Fishery Stock Assessment Models. Alaska Sea Grant College Program, AK-SG-98-01. University of Alaska, Fairbanks. 293 Goitein, R., 1983. Sardinella brasiliensis (Steindachner, 1879): estudos sobre alimentacËaÄo nas regioÄes de Ubatuba (238260 S), Santos (248000 S) e CananeÂia (258010 S). Naturalia 8, 197± 209. Grupo Executivo do Setor Pesqueiro (GESPE), 1997. Plano baÂsico para o ordenamento da pesca marõÂtma nacional. RelatoÂrio do Subgrupo de Trabalho Para a Pesca MarõÂtima, Brazil, Junho de 1997. Haimovici, M., 1997. Cephalopods. In: Seeliger, U., Odebrecht, C., Castello, J.P. (Eds.), Subtropical Convergence Environments. The Coast and Sea in the Southwestern Atlantic. Springer, Berlin, pp. 146±150. Haimovici, M., 1998. Present state and perspectives for the southern Brazil shelf demersal fisheries. Fish. Mgmt. Ecol. 5, 277±289. Haimovici, M., Krug, L.C., 1992. AlimentacËaÄo e reproducËaÄo da enchova Pomatomus saltatrix no litoral sul do Brasil. Rev. Brasil. Biol. (Rio de Janeiro) 52 (3), 503±513. Haimovici, M., Arruda, M.C., Teixeira, R.L., 1989. AlimentacËaÄo da castanha Umbrina canosai no litoral sul de Brasil. Rev. Brasil. Biol. (Rio de Janeiro) 49 (2), 511±522. Haimovici, M., Martins, A.S., Teixeira, R.L., 1993. DistribuicioÂn, alimentacõÂon y observaciones sobre la reproduccõÂon de la merluza Merluccius hubbsi en el sur de Brasil. Frente Maritmo (Montevideo) 14, 81±86. Haimovici, M., Castello, J.P., Vooren, C.M., 1997. Fisheries. In: Seeliger, U., Odebrecht, C., Castello, J.P. (Eds.), Subtropical Convergence Environments. The Coast and Sea in the Southwestern Atlantic. Springer, Berlin, pp. 183±196. Hempel, G., 1971. Southwest Atlantic. In: Gulland, J.A. (Ed.), Fish Resources of the Oceans. Fishing News Books, Oxford, pp. 146±152. IBAMA, 1993. Peixes demersais. ColecËaÄo Meio Ambiente. SeÂries Estudos Pesca, BrasõÂlia, Vol. 8. MinisteÂrio do Meio Ambiente, 94 pp. IBAMA, 1994a. Lagosta, Carangueijo-uca e camaraÄo do Nordeste. RelatoÂrio das ReunioÄes dos Grupos Permanentes de Estudos-GPE's, Brasilia, Vol. 10. IBAMA Estudos de Pesca, 190 pp. IBAMA, 1994b. Sardinha, atuns e afins. Relatorio das ReunioÄes dos Grupos Permanentes de Estudos-GPE's, Brasilia, Vol. 11. IBAMA Estudos de Pesca, 201 pp. IBAMA, 1994c. RelatoÂrio da reuniaÄo do Grupo Permanente de Estudos sobre camaroÄes das regioÄes sudeste e sul do Brasil. CEPSUL-IBAMA, 4 a 8 de outubro. ItajaõÂ, SC, 1993, 7 pp. IBAMA/IBGE, 1995. EstatõÂstica da Pesca. CEPENE, TamandareÂ, PE. Jarre-Teichman, A., Christensen, V., 1998. Comparative modelling of trophic flows in four large upwelling ecosystems: global versus local effects. In: Durand, M.H., Cury, P., Mendelssohn, R., Roy, C., Bakun, A., Pauly, D. (Eds.), Global Versus Local Changes in Upwelling Systems. ORSTOM Editions, Paris, pp. 425±443. Juras, A.A., Yamaguti, N., 1985. Food and feeding habits of the king weakfish (Macrodon ancylodon) (Bloch and Schneider 1801) caught in the southern coast of Brasil (Lat 29±328S). Bolm Inst. Oceanogr. S. Paulo 33 (2), 149±157. 294 M. Vasconcellos, M.A. Gasalla / Fisheries Research 50 (2001) 279±295 Kitchell, J.F., Eby, L.A., He, X., Schindler, D.E., Wright, R.A., 1994. Predator±prey dynamics in an ecosystem context. J. Fish Biol. 45 (Suppl. A), 209±226. Lima, I.D., Castello, J.P., 1995. Distribution and abundance of South-west Atlantic anchovy spawners (Engraulis anchoita) in relation to oceanographic processes in the southern Brazilian shelf. Fish. Oceanogr. 4 (1), 1±16. Lluch-Belda, D., Crawford, R.J., Kawasaki, T., MacCall, A.D., Parrish, R.H., Schwartzlose, R.A., Smith, P.E., 1989. Worldwide fluctuations of sardine and anchovy stocks: the regime problem. S. Afr. J. Mar. Sci. 8, 195±205. Mackinson, S., Vasconcellos, M., Sloman, K., Pitcher, T., Walters, C., 1997. Ecosystem impacts of harvesting small pelagic fish in upwelling systems: using a dynamic mass-balance model. In: Proceedings of the Forage Fishes in Marine Ecosystems. Alaska Sea Grabt College Program, pp. 731±749. Mangel, M., et al., 1996. Principles for the conservation of wild living resources. Ecol. Appl. 6 (2), 262±338. Martins, A.S., 1992. Bioecologia do peixe-espada, Trichiurus lepturus Linnaeus, 1758, no sul do Brasil. M.Sc. Thesis. University of Rio Grande, Brasil. Martins, A.S., Haimovici, M., 1997. Distribution, abundance and biological interactions of the cutlassfish Trichiurus lepturus in the southern Brazil subtropical convergence ecosystem. Fish. Res. 30, 217±227. Matsuura, Y., 1995. Os ecossistemas brasileiros e os principais macrovetores de desenvolvimento. SubsõÂdio ao Planejamento da GestaÄo Ambiental. Projeto CenaÂrios para o Planejamento da GestaÄo Ambiental (MMA/PNMA), BrasõÂlia, DF, pp. 39±104. Mello, R.M., Castello, J.P., Freire, K.F.M., 1992. AssociacõÂon de especies pelaÂgicas marinas en el sur de Brasil durante invierno y primavera. Frente Maritmo (Montevideo) 11, 63±69. Neiva, G.S., Moura, S.J.C., 1977. SumaÂrio sobre a exploracËaÄo de recursos marinhos do litoral brasileiro: situacËaÄo atual e perspectivas. PDP-SUDEPE, Vol. 27. SeÂrie Doc. Ocasionais, Rio de Janeiro, 1977, pp. 1±44. Odebrecht, C., Garcia, V.M.T., 1997. Phytoplankton. In: Seeliger, U., Odebrecht, C., Castello, J.P. (Eds.), Subtropical Convergence Environments. The Coast and Sea in the Southwestern Atlantic. Springer, Berlin, pp. 105±109. Odum, E.P., 1997. Ecology. A Bridge between Science and Society. Sinauer, MA, 330 pp. Odum, W.E., Heald, E.J., 1975. The detritus-based food web of an estuarine mangrove community. In: Cronin, L.E. (Ed.), Estuarine Research, Vol. 1. Academic Press, New York, pp. 265±286. Palomares, M.L.D., Pauly, D., 1989. A multiple regression model for predicting the food consumption of marine fish populations. Aust. J. Mar. Freshw. Res. 40, 259±273. Patterson, K., 1992. Fisheries for small pelagic species: an empirical approach to management targets. Rev. Fish. Biol. Fish. 2, 321±338. Pauly, D., Christensen, V., 1995. Primary production required to sustain global fisheries. Nature 374, 255±257. Pauly, D., Soriano-Bartz, M.L., Palomares, M.L.D., 1993. Improved construction, parametrization and interpretation of steady-state ecosystem models. In: Christensen, V., Pauly, D. (Eds.), Trophic Models of Aquatic Ecosystems. ICLARM Conference Proceedings 26, pp. 1±13. Pauly, D., Christensen, V., Dalsgaard, J., Froese, R., Torres Jr., F., 1998. Fishing down marine food webs. Science 279, 860±863. Peterson, I., Wroblewski, J.S., 1984. Mortality rate of fishes in the pelagic ecosystem. Can. J. Fish. Aquat. Sci. 41 (7), 1117±1120. Rees, W.E., 1996. Revisiting carrying capacity: area-based indicators of sustainability. Population Environ. 17 (3), 195± 215. Reis, E.G., Vieira, P.C., Duarte, W.S., 1994. Pesca artesanal de teleoÂsteos no estuaÂrio da Lagoa dos Patos e costa do Rio Grande do Sul. AtlaÃntica 16, 69±86. Rice, J., 1995. Food web theory, marine food webs, and what climate changes may do to northern marine fish populations. In: Beamish, R.J. (Ed.), Climate Change and Northern Fish Populations, Vol. 121. Canadian Special Publication of Fisheries and Aquatic Sciences, pp. 561±568. Rocha, G.R.A., Gasalla, M.A., Rossi-Wongtschowski, C.L.D.B., Soares, L.S.H., Pires-Vanin, A.M.S., Muto, E.Y., Cergole, M.C., Aidar, E., Mesquita, H.S.L., Gianesella-GalvaÄo, S.M.F., Vega-Perez, L.A., Jarre-Teichmann, A., 1998. Quantitative model of trophic interactions in the Ubatuba shelf system (Southeastern Brazil). Naga, The ICLARM Quart., 25±32. Rossi-Wongtschowski, C.L.D.B., Saccardo, S.A., Cergole, M.C., 1996. Are fluctuations in Brazilian sardine catches related to global-scale climate changes? Ann. Acad. Bras. Ci. 68 (Suppl. 1), 239±250. Saccardo, S.A., 1980. Biologia e bionomia de Trachurus lathami (Nichols 1920) (Teleostei: Carangidae) na plataforma continental brasileira entre 238S (RJ) e 308S (RS). Ph.D. Thesis. University of SaÄo Paulo, Brazil. Schwingel, P.R., Castello, J.P., 1995. AlimentacioÂn de la anchoita, Engraulis anchoita, en el sur de Brasil. Frente Maritmo (Montevideo) 15, 67±86. Seeliger, U., Odebrecht, C., Castello, J.P. (Eds.), 1997. Subtropical Convergence Environments. The Coast and Sea in the Southwestern Atlantic. Springer, Berlin, 308 pp. Soares, L.S.H., Rossi-Wongtschowski, C.L.D.B., Alvares, L.M.C., Muto, E.Y., Gasalla, M.A., 1992. Grupos troÂficos de peixes demersais da plataforma continental interna de Ubatuba, Brasil. I. Chondrichthyes. Bolm Inst. Oceanogr. SaÄo Paulo 40 (1±2), 79±85. Steele, J.H., 1996. Regime shifts in fisheries management. Fish. Res. 25, 19±23. Teixeira, C., Tundisi, J., 1967. Primary production and phytoplankton in equatorial waters. Bull. Mar. Sci. 17 (4), 884± 891. Trites, A.W., Livingston, P., Vasconcellos, M.C., Mackinson, S., Springer, A.M., Pauly, D., 1999. Ecosystem considerations and the limitations of ecosystem models in fisheries management: insights from the Bering Sea. In: Proceedings of the Symposium on the Ecosystem Effects of Fisheries, Anchorage, 1998. Vaske Jr., T., 1992. Idade, crescimento e alimentacËaÄo de albacora de lage, Thunnus albacares (Bonnaterre, 1788) (Perciformes: Scombridae), explorada no sul do Brasil. Master Thesis. University of Rio Grande, Brazil. M. Vasconcellos, M.A. Gasalla / Fisheries Research 50 (2001) 279±295 Vazzoler, G., 1975. DistribuicËaÄo da fauna de peixes demersais e ecologia dos Sciaenedae da plataforma continental brasileira entre as latitudes 298210 S (Torres) e 348440 S (Chui). Bolm Inst. Oceanogr. SaÄo Paulo 24, 85±169. Vazzoler, A.E.A.M., Soares, L.S.H., Cunningham, P.T.M., 1999. Ictiofauna brasileira, Chap. 19. In: Lowe-MacConnel, R.H. Estudos EcoloÂgicos de Communidades de Peixes Tropicais. EDUSP, SaÄo Paulo, Brasil. 535 p. Vieira, P.J.C., 1990. Biologia populacional de Cynoscion striatus (Pisces: Scianidae) no litoral sul do Brasil. Master Thesis. University of Rio Grande, Brasil. Vilela, M.J., 1990. Idade, crescimento, alimentacËaÄo e avaliacËaÄo do estoque de bonito listado (Katsuwonus pelamis) (Scombridae: Thunnini), explotado na regiaÄo sudeste-sul do Brasil. Master Thesis. University of Rio Grande, Brazil. 295 Vyalov, Y.A., Ovchinnikov, V.V., 1980. Main results of the tuna, swordfish and sailfish studies in the Atlantic Research Institute for the Fisheries and Oceanography (Atlantniro) for the 20 year period (1957±1977). Collect. Vol. Sci. Pap. ICCAT Madrid 9 (3), 662±674. Walsh, J.J., 1981. A carbon budget for overfishing off Peru. Nature 290, 300±304. Walters, C., Christensen, V., Pauly, D., 1997. Structuring dynamic models of exploited ecosystems from trophic mass-balance models of marine ecosystems. Rev. Fish Biol. Fish. 7 (2), 139± 172. Zavala-Camin, L.A., 1987. OcorreÃncia de peixes, cefaloÂpodos e crustaÂceos em estoÃmagos de atuns e espeÂcies afins, capturadas com espinhel no Brasil (23±348S) 1972±1985. Bolm Inst. Pesca SaÄo Paulo 14 (1), 93±102.
Download