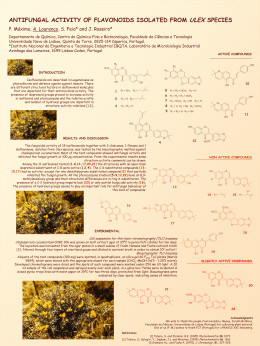
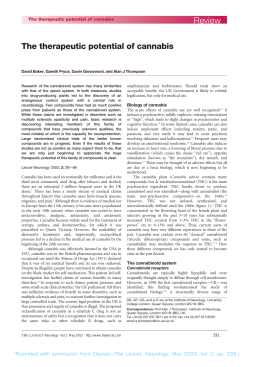
Article
pubs.acs.org/JAFC
Different Phenolic Compounds Activate Distinct Human Bitter Taste
Receptors
Susana Soares,† Susann Kohl,§ Sophie Thalmann,§ Nuno Mateus,† Wolfgang Meyerhof,*,§
and Victor De Freitas*,§
†
Department of Chemistry, University of Porto, Rua do Campo Alegre, 687, 4169-007, Porto, Portugal
German Institute of Human Nutrition (DIfE) Potsdam-Rehbrücke Arthur-Scheunert-Allee 114-116, 14558 Nuthetal, Germany
§
S Supporting Information
*
ABSTRACT: Bitterness is a major sensory attribute of several common foods and beverages rich in polyphenol compounds.
These compounds are reported as very important for health as chemopreventive compounds, but they are also known to taste
bitter. In this work, the activation of the human bitter taste receptors, TAS2Rs, by six polyphenol compounds was analyzed. The
compounds chosen are present in a wide range of plant-derived foods and beverages, namely, red wine, beer, tea, and chocolate.
Pentagalloylglucose (PGG) is a hydrolyzable tannin, (−)-epicatechin is a precursor of condensed tannins, procyanidin dimer B3
and trimer C2 belong to the condensed tannins, and malvidin-3-glucoside and cyanidin-3-glucoside are anthocyanins. The results
show that the different compounds activate different combinations of the ∼25 TAS2Rs. (−)-Epicatechin activated three
receptors, TAS2R4, TAS2R5, and TAS2R39, whereas only two receptors, TAS2R5 and TAS2R39, responded to PGG. In
contrast, malvidin-3-glucoside and procyanidin trimer stimulated only one receptor, TAS2R7 and TAS2R5, respectively. Notably,
tannins are the first natural agonists found for TAS2R5 that display high potency only toward this receptor. The catechol and/or
galloyl groups appear to be important structural determinants that mediate the interaction of these polyphenolic compounds with
TAS2R5. Overall, the EC50 values obtained for the different compounds vary 100-fold, with the lowest values for PGG and
malvidin-3-glucoside compounds, suggesting that they could be significant polyphenols responsible for the bitterness of fruits,
vegetables, and derived products even if they are present in very low concentrations.
KEYWORDS: polyphenols, bitterness, tannins
■
INTRODUCTION
subject relevant for people’s food choices and the chemopreventive potential of food.
Although bitterness in foods is usually unpleasant, there are
some foodstuffs in which it is a wanted sensory attribute, for
example, red wine and beer. In fact, most of the sensory analysis
data regarding polyphenol bitterness are related to red wine. It
is thought that the bitterness of red wine is mainly induced by
polyphenol compounds (e.g., tannins).2,3 However, the limited
available data regarding polyphenol’s structure/bitterness
relationship are rather inconsistent.3−7 In general, these
works studied the bitterness of polyphenol compounds, such
as polymeric fractions of tannic acid and tannins, as well as
flavan-3-ol monomers, dimers, and trimers, and demonstrated
that larger molecules tend to be less bitter and more
astringent.4,6 Peleg and co-workers4 found that (−)-epicatechin
was more bitter than the stereoisomer (+)-catechin and that
these both were more bitter than the procyanidin trimers,
catechin-(4−8)-catechin-(4−8)-catechin and catechin-(4−8)catechin-(4−8)-epicatechin. Robichaud and colleagues6 found
that tannic acid, a commercial hydrolyzable pentagalloylglucose-rich tannin, was more bitter than both (+)-catechin and a
grape seed extract, which is rich in polymeric procyanidins.
It has been well-known and common sense that the
consumption of diets rich in fruits and vegetables and with a
moderate intake of red wine (i.e., polyphenol-rich foods) is
inversely correlated to cardiovascular disease incidence and
cancer risk, probably because the polyphenols modulate several
biological reactions that lead to these disease conditions.1 In
fact, during the past years polyphenol compounds have been
suggested as chemoprevention agents.
Polyphenol compounds result from plant secondary
metabolism as chemical defense against predators and are
usually divided in nonflavonoids and flavonoids, the latter being
the most relevant ones. Flavonoids include very diverse
compounds such as anthocyanins and flavan-3-ols. Although
they are potentially beneficial to human health in small doses,
many of these compounds are toxic in high doses. Several of
these compounds are responsible for major organoleptic
properties of vegetables and fruits, namely, color and taste. In
fact, some of them are known to have a bitter taste and so,
despite their healthy properties, many people do not like to eat
vegetables and other plant-derived food because of the
bitterness associated with polyphenols.2 Debittering of food
has been a longstanding major sensory challenge for the food
industry2 that requires identification of those compounds
making food and beverages taste bitter. Therefore, studying the
sensorial properties of polyphenol compounds is a prominent
© 2013 American Chemical Society
Received:
Revised:
Accepted:
Published:
1525
March 5, 2012
January 7, 2013
January 13, 2013
January 13, 2013
dx.doi.org/10.1021/jf304198k | J. Agric. Food Chem. 2013, 61, 1525−1533
Journal of Agricultural and Food Chemistry
Article
Figure 1. Chemical structures of the four polyphenol compounds studied.
However, other studies have shown that bitterness of
polyphenols increases with molecular weight.3,5,8 Hufnagel
and Hofmann3 found that procyanidin dimers and a trimer
were more bitter than (−)-epicatechin. These authors also
demonstrated by taste reconstruction and omission experiments that the bitterness of the red wine could be induced by
subthreshold concentrations of phenolic acid ethyl esters and
flavan-3-ols. Besides these inconsistencies, there is insufficient
knowledge about the bitter taste of polyphenol compounds that
do not belong to tannin classes, such as anthocyanins.
Bitter taste is elicited by a specific subset of taste receptor
cells (TRC) localized in the oral cavity in groups of cells called
taste buds, which are embedded in the epithelium of the
gustatory papillae on the tongue and palate. These TRC are
characterized by the expression of members of the TASTE 2
Receptor (TAS2R) gene family encoding bitter taste
receptors.9−11 In humans, this gene family codes for ∼25
taste receptors (TAS2Rs) that are G protein-coupled receptors.
So far, 20 of them have been deorphaned, meaning that cognate
bitter compounds have been assigned to them.10,12−20 In
general, TAS2Rs are sensitive to several or multiple different
bitter compounds, a property that has been proposed to be the
basis for recognition of the countless bitter chemicals.12,20,21
Due to the presence of numerous nonsynonymous singlenucleotide polymorphisms (SNPs), the TAS2R genes encode
functionally distinct receptor variants that form the basis for
variations in bitterness perception in the population.15,16,22,23
To understand better structure/bitterness relation, to
overcome the inconsistencies associated with sensorial analysis,
and to identify which TAS2Rs are activated by the various
polyphenol compounds, an objective, robust, and reliable
method to analyze their bitterness is required. Few recent
studies used heterologous expression experiments to successfully measure TAS2R activation by purified bitter chemicals
that are normally present in food and beverage sources such as
beer hops, cheese, and soy products.17−20,24 In the present
paper this method was used to examine the activation of the
TAS2Rs by several polyphenol compounds widely spread in
foods and beverages derived from plants and commonly
present in our daily diet (Figure 1).
On the basis of their extensive prevalence in vegetables,
fruits, and derived products, the following six substances that
belong to some of the most important classes of polyphenols
(anthocyanins, flavan-3-ols, and hydrolyzable tannins) were
chosen:25 (−)-epicatechin, procyanidin dimer B3, and trimer
C2 (flavan-3-ols); malvidin-3-glucoside and cyanidin-3-glucoside (anthocyanins); and pentagalloylglucose (PGG) (hydrolyzable tannins). (−)-Epicatechin (structural unit of condensed
tannins) and a number of different procyanidin dimers and
trimers belong to the condensed tannins class and are present
in a variety of frequently ingested foods including red wine,
cocoa, grape seeds, tea, beer, and cereals.25 Malvidin-3glucoside and cyanidin-3-glucoside belong to the anthocyanin
class, being highly present in red fruits and their derived
products, red wine, and olives.25 Although PGG is not
1526
dx.doi.org/10.1021/jf304198k | J. Agric. Food Chem. 2013, 61, 1525−1533
Journal of Agricultural and Food Chemistry
Article
10.0 mM glucose (pH 7.4)] or in a mixture of dimethyl sulfoxide
(DMSO) and buffer C1 not exceeding a final DMSO concentration of
0.1% (v/v) to avoid toxic effects on the transfected cells.
Cell Transfection and Expression of TAS2Rs in Heterologous
Cells. Functional expression studies were carried out as described
before.19,20 Human embryonic kidney (HEK)-293T cells stably
expressing the chimeric G protein subunit Gα16gust44 were seeded
into poly-D-lysine-coated (10 μg mL−1) 96-well plates (Greiner BioOne, Frickenhausen, Germany) under regular cell culture conditions
[Dulbecco’s modified Eagle medium (DMEM) , 10% FCS, 1%
penicillin/streptomycin; 37 °C, 5% CO2, 95% humidity]. After 24−26
h, cells were transfected transiently with 150 ng expression plasmids
based on pEAK10 (Edge BioSystems) or pcDNA5/FRT (Invitrogen)
using 300 ng of Lipofectamine2000 (Invitrogen). In addition to the
TAS2R coding sequences, the plasmids contained the first 45 amino
acids of rat somatostatin receptor 3 for cell surface localization
followed by the herpes simplex virus (HSV) glycoprotein D epitope
for immunocytochemical detection of the receptor. The TAS2R
sequences are according to the literature.20
Calcium Imaging analysis. Twenty-four to 26 h after transfection, cells were loaded with the calcium-sensitive dye Fluo-4acetoxymethylester (2 μM, Molecular Probes) in serum-free DMEM.
Probenecid (Sigma-Aldrich GmbH), an inhibitor of organic anion
transport, was added at a concentration of 2.5 mM, to minimize the
loss of the calcium indicator dye from cells. One hour after loading, the
wells were washed three times with C1 buffer using a Denley Cell
Washer (Thermo Fisher Scientific, Inc., Waltham, MA, USA). Cells
were incubated in washing buffer in the dark for 30 min between the
washing steps. Fluorescence changes were recorded at 510 nm
following excitation at 488 nm by a fluorometric imaging plate reader
(FLIPR, Molecular Devices) before and after application of the test
compounds in each well. A second application of 100 nM
somatostatin-14 (Bachem) activating the endogenous somatostatin
receptor type 2 was used to assess cell vitality. All experiments were
performed at least in duplicates. Mock-transfected cells (cells
transfected with empty pcDNA5/FRT vector used as negative control)
were always measured in parallel on the same microtiter plates using
the same compound concentrations used to examine the cells
expressing the various TAS2Rs. All compounds were initially tested
at different concentrations for unspecific calcium responses in
untransfected HEK293T Gα16gust44 cells. On the basis of this pilot
experiment, the used maximal compound concentrations were always
lower than those concentrations [(−)-epicatechin, unknown, PGG,
100 μM, malvidin-3-glucoside, 30 μM, procyanidin trimer, 300 μM)
that generated unspecific responses in the absence of transfected
receptor DNAs.
Determination of Half-Maximal Effective Concentrations
(EC50) and Statistical Analysis. Having identified responsive
TAS2Rs, their concentration-dependent activation was examined and
half-maximal effective concentrations (EC50) values for their bitter
agonists were established. To calculate the concentration−response
curves, the fluorescence changes of mock-transfected cells were
subtracted from the corresponding values of receptor-expressing cells
by means of the FLIPR384 software (Molecular Devices, Munich,
Germany). To compensate for differences in cell density, signals were
normalized to background fluorescence for each well. Signals were
recorded in at least duplicate wells and the data averaged. Signal
amplitudes were then plotted versus log agonist concentration. EC50
values were calculated using SigmaPlot 9.01 (Systat Software Gmbh,
Erkrath, Germany) by nonlinear regression using the function
commonly found in a wide range of foodstuffs, it belongs to the
other class of tannins (hydrolyzable tannins) and is present in
pomegranate and green tea, and it can also be incorporated in
red wine during the winemaking process (by addition of
commercial tannic acid).26
Our aim was to elucidate if the selected polyphenol
compounds are activators of human bitter taste receptors and
to examine if different polyphenols activate different TAS2Rs.
■
MATERIALS AND METHODS
Chemicals. All reagents used were of analytical grade. (+)-Catechin and (−)-epicatechin were purchased from Sigma-Aldrich,
malvidin aglycon was purchased from Extrasynthèse, sodium
borohydride and tartaric acid were purchased from Aldrich, tannic
acid was purchased from Fluka Biochemica (Switzerland), taxifolin was
purchased from Extrasynthèse (Genay, France), and Toyopearl HW40(s) gel was purchased from Tosoh (Tokyo, Japan).
Malvidin-3-glucoside and Cyanidin-3-glucoside (Anthocyanins) Isolation. Malvidin-3-glucoside and cyanidin-3-glucoside were
isolated as described in the literature.27 Briefly, these compounds were
isolated from a grape skin extract that was applied to a TSK Toyopearl
HW-40(s) gel column. The elution was made with 10% CH3OH/
CH3COOH (v/v), and then the solvent was evaporated. The resulting
residue was applied to a C18 gel column, and the compounds were
eluted with 10% methanol acidulated. The solution was again
evaporated, and the resulting solution was mixed with distilled
water, frozen, and lyophilized. The compound’s purity was assessed by
HPLC-MS, direct MS, and NMR analysis and was >99%.
Spectroscopical data were in accordance with the literature.28,29
Procyanidin Dimer (B3) and Trimer (C2) (Condensed
Tannins) Synthesis. The synthesis of procyanidin dimer B3
(catechin-(4−8)-catechin) and trimer C2 (catechin-(4−8)-catechin(4−8)-catechin) followed the procedure described in the literature.30
Briefly, taxifolin and (+)-catechin (ratio 1:3) were dissolved in ethanol,
and the mixture was treated with sodium borohydride (in ethanol).
The pH was then lowered to 4.5 by addition of CH3COOH/H2O 50%
(v/v), and the mixture stood under argon atmosphere for 30 min. The
reaction mixture was extracted with ethyl acetate. After evaporation of
the solvent, water was added, and the mixture was passed through C18
gel, washed with water, and recovered with methanol. After
evaporation of methanol, the fraction was passed through a TSK
Toyopearl HW-40(s) gel column (300 mm × 10 mm i.d., 0.8 mL
min−1, methanol as eluent) coupled to a UV−vis detector. Several
fractions were recovered and analyzed by ESI-MS (Finnigan DECA
XP PLUS) yielding procyanidins dimers (B3 and B6) and trimer (C2).
The structure was elucidated by HPLC-MS and NMR analysis.
Spectroscopical data were in accordance with the literature.31
β-1,2,3,4,6-Penta-O-galloyl-D-glucopyranose (PGG) (Hydrolyzable Tannin) Synthesis. PGG was synthesized according to the
method of Chen and Hagerman.32 Briefly, 5.0 g of tannic acid was
methanolyzed in 70% methanol in acetate buffer (0.1 M, pH 5.0) at 65
°C for 15 h. The pH of the reaction mixture was immediately adjusted
to 6.0 with NaOH. Methanol was evaporated under reduced pressure
at <30 °C, and water was added to maintain the volume. The solution
was extracted with 3 volumes of diethyl ether and 3 volumes of ethyl
acetate. The ethyl acetate extracts were combined and evaporated, with
addition of water to maintain the volume. The resulting suspension
was centrifuged, and the precipitate was redissolved by heating in 2%
methanol solution. PGG precipitated as the solution cooled to room
temperature and was collected by centrifugation. PGG was washed
twice with an ice-cold 2% methanol solution and once with ice-cold
distilled water. The final material was lyophilized to yield a white
powder with an overall mass yield of 23%. The purity of the obtained
PGG was assessed by HPLC analysis33 and 1H NMR spectroscopy,
and it was ≤99%. Spectroscopical data were in accordance with the
literature.32
Test Compound Preparation. The compounds to be tested were
dissolved either in buffer C1 [130.0 mM NaCl, 5.0 mM KCl, 10.0 mM
N-2-hydroxyethylpiperazine-N′-2-ethanesulfonic acid, 2.0 mM CaCl2,
f (x) = min +
(max − min)
1 + (x /EC50)−nH
(1)
where x is the test compound concentration and nH the Hill
coefficient. Statistical significance of the difference between the several
calculated EC50 and of the signal amplitudes was evaluated by one-way
analysis of variance, followed by the Bonferroni test. Differences were
considered to be statistically significant when P < 0.05.
1527
dx.doi.org/10.1021/jf304198k | J. Agric. Food Chem. 2013, 61, 1525−1533
Journal of Agricultural and Food Chemistry
Article
Figure 2. Fluorescence changes of Fluo4-AM-loaded HEK293T-Gα16gust44 cells expressing the TAS2Rs indicated in the graphs following
administration of 10.0 mM (−)-epicatechin, 20.0 μM malvidin-3-glucoside, 100.0 μM procyanidin trimer, or 10.0 μM PGG. Responses of mocktransfected cells (empty plasmid) are indicated by the thinner solid line.
■
RESULTS
Identification of TAS2Rs That Respond to Polyphenol
Compounds. To identify the TAS2Rs that are sensitive to the
selected prototypical polyphenols, the 25 TAS2Rs, TAS2R1,
TAS2R3, TAS2R4, TAS2R5, TAS2R7, TAS2R8, TAS2R9,
TAS2R10, TAS2R13, TAS2R14, TAS2R16, TAS2R38,
TAS2R39, TAS2R40, TAS2R41, TAS2R42, TAS2R43,
TAS2R31, TAS2R45, TAS2R46, TAS2R30, TAS2R19,
TAS2R20, TAS2R50, and TAS2R60, were expressed individually in HEK293T cells stably expressing the chimeric G
protein Gα16gust44. This construct was designed to couple the
activation of TAS2Rs in heterologous cells to the release of
Ca2+ from intracellular stores, which can be measured using
calcium-sensitive fluorescence dyes.34 Receptor-mediated
changes in intracellular calcium concentrations were detected
as fluorescence changes by means of a fluorometric imaging
plate reader.
The six polyphenol compounds to be tested, (−)-epicatechin, procyanidin dimer and trimer, malvidin-3-glucoside,
cyanidin-3-glucoside, and PGG, were administered, at the
highest possible concentrations (predetermined in pilot
experiments, data not shown), by bath application to the 25
different receptor-expressing cell populations. (−)-Epicatechin
was employed up to 16.0 mM, whereas all the other
compounds were employed only at micromolar range
[procyanidin trimer, 100.0 μM; malvidin-3-glucoside, 20.0
μM; PGG, 10.0 μM (Figure 2)]. By tracing cytosolic calcium
levels, it was found that cells expressing TAS2R4, TAS2R5, or
TAS2R39 responded to challenge with (−)-epicatechin. Cells
transfected with DNA for TAS2R5 or TAS2R39 were also
sensitive to PGG. Elevation of calcium levels was also seen in
cells expressing TAS2R5 that have been exposed to procyanidin
trimer. Finally, it was found that malvidin-3-glucoside elicited
signals specifically in cells transfected with DNA for TAS2R7.
Cells expressing TAS2R1, TAS2R3, TAS2R8, TAS2R9,
TAS2R10, TAS2R13, TAS2R14, TAS2R16, TAS2R38,
TAS2R40, TAS2R41, TAS2R42, TAS2R43, TAS2R31,
TAS2R45, TAS2R46, TAS2R30, TAS2R19, TAS2R20,
TAS2R50, and TAS2R60 did not respond to the tested
compounds (data not shown). It is also important to note that
procyanidin dimer and cyanidin-3-glucoside did not activate
any receptor, at least in the highest possible concentrations
tested (100 μM).
Functional Characterization of Activated TAS2Rs. To
investigate the activation of the bitter receptors TAS2R4,
TAS2R5, TAS2R7, and TAS2R39 by the polyphenols in greater
detail, concentration−response functions were recorded and
the half-maximal effective agonist concentrations (EC50)
established (Figure 3). The concentration−response curves
followed sigmoid functions. The calculated EC50 values for the
compound−receptor pairs are presented in Table 1, where the
values with “≥” are estimates because the concentration−
response curves did not saturate and so we were unable to
determine an EC50 value.
Collectively, the data demonstrate that the EC50 values for
the different agonist/receptor pairs vary from the micromolar
to the millimolar range. Whereas the EC50 values for PGG at
both TAS2R5 and TAS2R39 are ≥8.5 and ≥6.6 μM,
respectively, those for (−)-epicatechin are ∼1000-fold higher
and vary between 3.2 and 3.8 mM. Like the EC50 values for
PGG, those for malvidin-3-glucoside and procyanidin trimer are
also in the micromolar range, being 12.6 μM at TAS2R7 and
35.6 μM at TAS2R5, respectively.
Besides these pronounced differences in the EC50 values, the
observed threshold concentrations, defined as the lowest
concentration that resulted in calcium signals in receptortransfected cells, are also largely different (Table 2). Whereas
PGG induced robust receptor responses already at a
1528
dx.doi.org/10.1021/jf304198k | J. Agric. Food Chem. 2013, 61, 1525−1533
Journal of Agricultural and Food Chemistry
Article
Figure 3. Concentration−response curves for HEK293T-Gα16gust44 cells transfected with DNA for the indicated TAS2R following stimulation
with the indicated test compound. Error bars represent the confidence interval (P = 0.05). Dose-dependent activation was observed for TAS2R4,
TAS2R5, and TAS2R39 by (−)-epicatechin (a), for TAS2R5 and TAS2R39 by PGG (b), for TAS2R7 by malvidin-3-glucoside (c), and for TAS2R5
by procyanidin trimer (d).
Table 1. EC50 Values for the Test Compounds and Respective Receptorsa
EC50 (μM)
(−)-epicatechin
procyanidin trimer
PGG
malvidin-3-glucoside
a
TAS2R4
TAS2R5
≥30151.0
3210.0 ± 42.0a
35.6 ± 0.7d
≥8.5
TAS2R7
TAS2R39
3800.0 ± 200.0bc
≥6.6
12.6 ± 0.7
Values with the same letter are not significantly different (P < 0.05). Values with ≥ are estimates because the dose-response curves did not saturate.
TAS2R39. Like PGG, threshold values for malvidin-3-glucoside
and procyanidin trimer were in the micromolar range. The
lowest concentrations that induced detectable receptor
responses were 6.0 μM malvidin-3-glucoside for TAS2R7 and
30.0 μM procyanidin trimer for TAS2R5.
Also, signal amplitudes, which are related to the efficiency of
the receptor activation, differ across receptors and the
polyphenols (Table 3). (−)-Epicatechin activated TAS2R5
cognate receptor as well as TAS2R4 and TAS2R39 with high
efficacy as revealed by the change in fluorescence, that is, the
corresponding ΔF/F values. Similarly, PGG was an efficient
stimulus for TAS2R39, and also malvidin-3-glucoside showed
high efficiency at its cognate receptor. In contrast, the observed
Table 2. Threshold Concentrations, Defined as the Lowest
Concentration That Resulted in Calcium Signals in
Receptor-Transfected Cells, for the Test Compounds
threshold concentrations (μM)
(−)-epicatechin
procyanidin trimer
PGG
malvidin-3-glucoside
TAS2R4
TAS2R5
2000.0
1000.0
30.0
3.0
TAS2R7
TAS2R39
1000.0
3.0
6.0
concentration of 3.0 μM at both TAS2R5 and TAS2R39, a
300−1000-fold higher concentration of (−)-epicatechin was
required to evoke receptor responses at TAS2R4, TAS2R5, and
1529
dx.doi.org/10.1021/jf304198k | J. Agric. Food Chem. 2013, 61, 1525−1533
Journal of Agricultural and Food Chemistry
Article
Table 3. Signal Amplitudes (Given as Relative Fluorescence Changes ΔF/F) for the Test Compounds
signal amplitudes
(−)-epicatechin
procyanidin trimer
PGG
malvidin-3-glucoside
TAS2R4
TAS2R5
0.44 ± 0.04a
0.59 ± 0.11a
0.22 ± 0.04c
0.36 ± 0.16d
TAS2R7
TAS2R39
0.65 ± 0.04a
0.61 ± 0.04d
0.54 ± 0.09
have at least one of these groups, whereas the other tested
compound, malvidin-3-glucoside, did not. Second, procyanidin
trimer and PGG, which possess three o-catechol groups and five
galloyl groups, respectively, activate TAS2R5 at 100-fold lower
concentrations than does (−)-epicatechin, which has only one
o-catechol group. However, this structural feature is not
required for other compounds that activate TAS2R5 because
the synthetic ligand 1,10-phenanthroline lacks these groups
completely. In fact, it is evident that the presence of these
groups is not sufficient for the responsiveness of this receptor
because the procyanidin dimer (which has two o-catechol
groups) does not activate this receptor. However, it seems that,
when a compound activates TAS2R5, the presence of these
groups could be essential for higher responses/interaction. The
importance of the hydroxyl groups in bitter receptor activation
is also referenced by Roland and co-workers,24 who have
studied the activation of receptor TAS2R39 by the soy
isoflavone genistein and structurally similar isoflavonoids.
These authors concluded that the presence of three hydroxyl
groups in the isoflavonoid ring system, which resembles that of
the polyphenols, seemed to be more favorable for TAS2R39
activation than the presence of fewer hydroxyl groups.
Notably, the above chemicals are the first natural bitter
compounds found for TAS2R5. So far, this specialist receptor
responded only to the synthetic compound phenantroline and
may therefore be the only TAS2R that is activated (“specific”)
by natural tannins.
Roland and co-workers24 also noted the importance of
glucose residues attached to their test compounds for TAS2R39
activation. The present study demonstrated that TAS2R39
responded to PGG, which also contains a glucoside moiety.
However, malvidin-3-glucoside and cyanidin-3-glucoside did
not activate this receptor. Interestingly, the glycosylated
compounds did not activate the TAS2R16, which has been
suggested to be specific for β-glucopyranosides.12 However,
these authors12 also found that the hydrophobicity and size of
the aglycons are critical for receptor activation. The great
structural differences between the compounds employed by
Bufe and co-workers and those tested here easily explain the
absence of responses of TAS2R16.
A receptor for which the presence of glucose residues seems
to be important is TAS2R7. Whereas malvidin-3-glucoside
activated TAS2R7, its aglycon form (without glucose residue)
failed to do so, at least at the tested concentrations. Our results
for malvidin-3-glucoside oppose those of a sensory study that
showed that this anthocyanin does not taste bitter.38 These
authors studied the bitterness of malvidin-3-glucoside in a
mixture with cyanidin-3-glucoside made in a solution saturated
with tartaric acid (pH 3.6) and containing ethanol. It is also
important to mention that anthocyanins coexist in solution in
different forms because of their well-known pH dependence:39
at low pH (1−2) they are essentially present in the red cationic
form (AH+), but as the pH increases rapid proton transfer
reactions occur, leading to the formation of blue quinonoidal
efficacy of procyanidin trimer at its cognate receptor is relatively
low.
■
DISCUSSION
It has been well-known and common sense that the
consumption of diets with high content of foods rich in
vitamins, minerals, fibers, and polyphenols, as well as low levels
of saturated fats, is directly associated with a low incidence of
cardiovascular and cancer diseases. The well-known “French
paradox” that appeared in 1992 is a classic example of this
association.35 Since that time, an exponential growth of
epidemiological, clinical, and experimental data has supported
the importance of a diet rich in polyphenol-rich foods.1 In fact,
these compounds have been suggested as chemoprevention
agents. For instance, pentagalloylglucose has been shown in
vivo to have anticancer effects against prostate, lung, and breast
cancers as well as to have antidiabetes activity.36 Also, cyanidin3-glucoside has been shown to be able to revert human
melanoma cells from the proliferating to the differentiated
state.37 Because of polyphenols’ beneficial effects on human
health, increasing the phytonutrient content of plant foods is a
potent dietary option for preventing diseases and a challenge
for the design of functional foods. However, many people do
not like to eat vegetables and/or derived products especially
because of their bitter taste.2 Therefore, the study of the
bitterness properties of polyphenol compounds is a prominent
subject that could reflect in people’s food choices and last in
people’s food chemoprevention.
Therefore, in this paper the activation of human bitter
receptor by six polyphenol compounds commonly present in
human diet [(−)-epicatechin, procyanidin dimer B3 and trimer
C2, malvidin-3-glucoside, cyanidin-3-glucoside, and PGG] was
studied, and the data indicate that four of the six polyphenol
compounds tested may mediate their bitterness through
activation of at least four human bitter taste receptors,
TAS2R4, TAS2R5, TAS2R7, and TAS2R39.
The agonist−receptor pairs display an interesting activation
pattern. First, different compounds activate the same receptor.
For example, (−)-epicatechin and PGG activate TAS2R39,
whereas (−)-epicatechin, PGG, and procyanidin trimer activate
TAS2R5. Second, different receptors are activated by the same
compound. This is evidenced by (−)-epicatechin, which
activates TAS2R4, TAS2R5, and TAS2R39, and PGG, which
stimulates TAS2R5 and TAS2R39. These results conform well
with the combinatorial activation patterns of TAS2Rs
previously reported13,20 (Table 1 in the Supporting Information).
Furthermore, by the structurally diverse compounds, these
data also have implications for structure−activity relationships.
They suggest that the catechol or galloyl group (which has only
one more hydroxyl group than catechol) is a critical feature
(but not essential) for the interaction of polyphenol
compounds with TAS2R5. First, the compounds that activated
this receptor, (−)-epicatechin, procyanidin trimer, and PGG,
1530
dx.doi.org/10.1021/jf304198k | J. Agric. Food Chem. 2013, 61, 1525−1533
Journal of Agricultural and Food Chemistry
Article
previously, this trimer has been reported to be present in beer
at 0.3 μg mL−1.25 However, procyanidin trimer C1 is known to
be present in red wine at 25.6 mg L−1 (29.6 μM).42
Although the existing results are controversial, some sensory
evaluations perceive smaller polyphenol molecules as more
bitter than larger ones.4,6 Peleg and co-workers4 studied the
bitterness of several compounds including (−)-epicatechin and
procyanidin dimers and trimers at the concentration of 0.9 g
L−1 in aqueous ethanol (1% v/v). This concentration
corresponds to 3093.0 μM (−)-epicatechin and to 1040.0
μM procyanidin trimer, which in the case of (−)-epicatechin
lies in the concentration range used herein but for procyanidin
trimer is much higher than the concentration range used herein.
At that concentration, Peleg4 found that monomers were
significantly more bitter than the dimers, which in turn were
significantly more bitter than the trimers.
Hufnagel and Hofmann3 studied the astringency and
bitterness of numerous compounds from a red wine by
sensorial analysis and demonstrated that the bitterness of that
red wine could be induced by phenolic acid ethyl esters and
flavan-3-ols [including (−)-epicatechin, procyanidin dimers,
and C1 trimer]. But in contrast to Peleg, they found that the
larger molecules were more bitter than smaller ones. In fact, the
bitter taste threshold for (−)-epicatechin was found to be 930.0
μM, and so these data correlate with our observations for
TAS2R39. However, the bitter taste thresholds they found for
procyanidins were between 400 and 500 μM, which are much
higher than the values found in this work (30.0 μM). This
observed correlation between the in vivo and in vitro analyses,
with sensory data showing mostly higher thresholds values in
comparison to in vitro data, is common and has been reported
previously.19 One possible explanation for this fact is the
formation of complexes with proline-rich proteins in the saliva
and/or adsorption of these compounds by the oral epithelium,
which could alter their effective oral concentrations differently
and explain the different concentration−response functions
recorded in vivo and in cell culture.19 It is also not possible to
exclude the possibility that a particular fully activated TAS2R
evokes bitter perception to a lesser degree than another one.
Also, a sensory analysis of fractions of grape seed phenolics
showed that bitterness increases along with molecular size.5
Moreover, Lea and Arnold8 showed that bitterness is associated
with oligomeric procyanidins reaching a maximum with the
epicatechin tetramer. This is in agreement with our results
because (−)-epicatechin monomer is less bitter that procyanidin trimer.
Apart from the molecular size of the bitter polyphenols under
study, other factors could affect the bitterness of the
compounds in sensory evaluations, as referred previously. For
example, whereas ethanol enhances bitterness intensity, varying
wine pH has little or no effect on perceived bitterness.44 Fischer
and Noble44 prepared 18 wines, varying in ethanol (8, 11, and
14% v/v), pH (2.9, 3.2, and 3.8), and (+)-catechin (100.0 and
1500.0 mg L−1), using a dealcoholized white wine concentrate.
In a completely randomized design, bitterness intensity was
rated by 20 subjects, and it was found that bitterness increased
by all three components. These authors have shown that an
increase of 3% v/v ethanol elevated bitterness more (around
50%) than adding 1400.0 mg/L catechin to the same wine
(which increased bitterness by 28%). Such an increase in
catechin is not common in the winemaking industry; however,
differences of 3% v/v ethanol occur frequently in table wines
and will produce a significant increase in bitterness.
bases (A and A−) and chalcones. Therefore, the two data sets
appear not to be comparable because the use of other
compounds and distinct experimental conditions could
influence the perceived bitterness and receptor responses
differently. It is important to point out that ethanol could not
be tested in the in vitro assay because it is toxic for cells already
at 1%.
Even though the factors that determine bitter intensity are
still unknown, the concentration−response functions of the five
polyphenols and their cognate receptors predict that PGG
appears to be a strong bitter compound in foodstuffs if present
at least in low micromolar concentrations. First, it activates
both receptors, TAS2R5 and TAS2R39. Second, it displays high
potency evident as low EC50 values at both cognate receptors.
Third, it shows also high efficacy as revealed by the high signal
amplitudes of the activated receptors, in particular for
TAS2R39. Malvidin-3-glycoside and procyanidin trimer are
also of high potency; that is, they have low EC50 values at their
receptors. However, both compounds activate one receptor
with relatively low efficacy, TAS2R7 and TAS2R5, respectively.
This could mean that these polyphenol compounds elicit a
weaker bitter taste than PGG, if they are present in food in
similar concentrations as PGG. (−)-Epicatechin also appears to
be a strong bitter chemical. It activates three receptors,
TAS2R4, TAS2R5, and TAS2R39, with high efficacy. The
potencies of this compound at its cognate receptors may be low
relative to the other four polyphenols because its EC50 values
are in the millimolar range. However, if (−)-epicatechin is
present in food in this concentration range, it would function as
a strong activator of bitterness due to its high efficacy. This is
supported by data about β-glucopyranosides, which have
millimolar potencies at only one receptor, hTAS2R16, yet
elicit strong bitterness and avoidance behavior.12,40 Thus, the
data clearly demonstrate that PGG, malvidin-3-glucoside, and
procyanidin trimer act as high-potency agonists on TAS2Rs,
whereas (−)-epicatechin is a low-potency stimulus.
Polyphenol concentrations in vegetables, fruits, and derived
products depend on many factors, for example, culture
conditions and degree of ripeness. The tested polyphenols
are present in numerous plant-derived products commonly
present in our diet (e.g., red wine, beer, cocoa, red fruits), even
though their concentrations vary widely.25 For instance,
(−)-epicatechin has been identified in 125 foods and beverages,
and it is known to be present in dark chocolate (mean content
of 0.070 mg g−1), apple (mean content of 0.008 mg g−1), and
blackberry (mean content of 0.012 mg g−1). Malvidin-3glucoside has been identified in 21 foodstuffs including black
grapes (mean content of 0.039 mg g−1) and beans (mean
content of 0.0006 mg g−1). Procyanidin trimer C2 has been
identified in beer (0.3 μg mL−1). The wide range of
concentrations is particularly evident in red wine.41,42
(−)-Epicatechin has been reported to be present in the range
of 5.0−88.0 mg L−1 (= 17.0−302.0 μM) in over 800 types of
red wines43 and malvidin-3-glucoside is present in the range of
40.0−510.0 mg L−1 (= 81.0−1035.0 μM) in Port wine.41 Thus,
the concentrations of (−)-epicatechin are about 10-fold below
its EC50 values at all cognate receptors, suggesting that this
polyphenol may contribute little to the bitterness of red wine.
Malvidin-3-glucoside is present at concentrations 6−80-fold
higher than its EC50 value at TAS2R7, suggesting that this
receptor is robustly activated when consuming these types of
wine. With regard to procyanidin trimer and PGG used herein,
there are no reported concentrations in red wine but, as stated
1531
dx.doi.org/10.1021/jf304198k | J. Agric. Food Chem. 2013, 61, 1525−1533
Journal of Agricultural and Food Chemistry
Article
(9) Matsunami, H.; Montmayeur, J. P.; Buck, L. B. A family of
candidate taste receptors in human and mouse. Nature 2000, 404,
601−604.
(10) Chandrashekar, J.; Mueller, K. L.; Hoon, M. A.; Adler, E.; Feng,
L.; Guo, W.; Zuker, C. S.; Ryba, N. J. P. T2Rs function as bitter taste
receptors. Cell 2000, 100, 703−711.
(11) Adler, E.; Hoon, M. A.; Mueller, K. L.; Chandrashekar, J.; Ryba,
N. J. P.; Zuker, C. S. A novel family of mammalian taste receptors. Cell
2000, 100, 693−702.
(12) Bufe, B.; Hofmann, T.; Krautwurst, D.; Raguse, J. D.; Meyerhof,
W. The human TAS2R16 receptor mediates bitter taste in response to
β-glucopyranosides. Nat. Genet. 2002, 32, 397−401.
(13) Behrens, M.; Brockhoff, A.; Kuhn, C.; Bufe, B.; Winnig, M.;
Meyerhof, W. The human taste receptor hTAS2R14 responds to a
variety of different bitter compounds. Biochem. Biophys. Res. Commun.
2004, 319, 479−485.
(14) Sainz, E.; Cavenagh, M. M.; Gutierrez, J.; Battey, J. F.; Northup,
J. K.; Sullivan, S. L. Functional characterization of human bitter taste
receptors. Biochem. J. 2007, 403, 537−543.
(15) Bufe, B.; Breslin, P. A. S.; Kuhn, C.; Reed, D. R.; Tharp, C. D.;
Slack, J. P.; Kim, U. K.; Drayna, D.; Meyerhof, W. The molecular basis
of individual differences in phenylthiocarbamide and propylthiouracil
bitterness perception. Curr. Biol. 2005, 15, 322−327.
(16) Pronin, A. N.; Xu, H.; Tang, H.; Zhang, L.; Li, Q.; Li, X. Specific
alleles of bitter receptor genes influence human sensitivity to the
bitterness of aloin and saccharin. Curr. Biol. 2007, 17, 1403−1408.
(17) Kuhn, C.; Bufe, B.; Winnig, M.; Hofmann, T.; Frank, O.;
Behrens, M.; Lewtschenko, T.; Slack, J. P.; Ward, C. D.; Meyerhof, W.
Bitter taste receptors for saccharin and acesulfame k. J. Neurosci. 2004,
24, 10260−10265.
(18) Maehashi, K.; Matano, M.; Wang, H.; Vo, L. A.; Yamamoto, Y.;
Huang, L. Bitter peptides activate hTAS2Rs, the human bitter
receptors. Biochem. Biophys. Res. Commun. 2008, 365, 851−855.
(19) Intelmann, D.; Batram, C.; Kuhn, C.; Haseleu, G.; Meyerhof,
W.; Hofmann, T. Three TAS2R bitter taste receptors mediate the
psychophysical responses to bitter compounds of hops (Humulus
lupulus l.) and beer. Chemosens. Percept. 2009, 2, 118−132.
(20) Meyerhof, W.; Batram, C.; Kuhn, C.; Brockhoff, A.; Chudoba,
E.; Bufe, B.; Appendino, G.; Behrens, M. The molecular receptive
ranges of human TAS2R bitter taste receptors. Chem. Senses 2010, 35,
157−170.
(21) Meyerhof, W. Elucidation of mammalian bitter taste. Rev.
Physiol. Biochem. Pharmacol. 2005, 154, 37−72.
(22) Kim, U.; Wooding, S.; Ricci, D.; Jorde, L. B.; Drayna, D.
Worldwide haplotype diversity and coding sequence variation at
human bitter taste receptor loci. Hum. Mutat. 2005, 26, 199−204.
(23) Drayna, D. Human taste genetics. Annu. Rev. Genomics Hum.
Genet. 2005, 6, 217−235.
(24) Roland, W. S. U.; Vincken, J.-P.; Gouka, R. J.; Van Buren, L.;
Gruppen, H.; Smit, G. Soy isoflavones and other isoflavonoids activate
the human bitter taste receptors hTAS2R14 and hTAS2R39. J. Agric.
Food Chem. 2011, 59, 11764−11771.
(25) Neveu, V.; Perez-Jiménez, J.; Vos, F. C.; Du Chaffaut, L.;
Mennen, L.; Knox, C.; Eisner, R.; Cruz, J.; Wishart, D.; Scalbert, A.
Phenol-Explorer: An Online Comprehensive Database on Polyphenol
Contents in Foods, 2010
(26) Ren, Y.; Chen, X. Distribution, bioactivities and therapeutical
potentials of pentagalloylglucopyranose. Curr. Bioact. Compd. 2007, 3,
81−89.
(27) Soares, S.; Mateus, N.; De Freitas, V. Interaction of different
polyphenols with bovine serum albumin (BSA) and human salivary αamylase (HSA) by fluorescence quenching. J. Agric. Food Chem. 2007,
55, 6726−6735.
(28) Yawadio, R.; Tanimori, S.; Morita, N. Identification of phenolic
compounds isolated from pigmented rices and their aldose reductase
inhibitory activities. Food Chem. 2007, 101, 1616−1625.
(29) Atanasova, V.; Fulcrand, H.; Le Guernevé, C.; Cheynier, V.;
Moutounet, M. Structure of a new dimeric acetaldehyde malvidin 3-
Unfortunately, it is impossible to examine this interesting effect
of ethanol by means of the receptor assay, because ethanol is
highly toxic for cells above 1%.
In summary, the results show that different polyphenol
compounds activate different combinations of the ∼25
TAS2Rs. (−)-Epicatechin activated three receptors, TAS2R4,
TAS2R5, and TAS2R39, whereas only two receptors, TAS2R5
and TAS2R39, responded to PGG. In contrast, malvidin-3glucoside and procyanidin trimer stimulated one receptor,
TAS2R7 and TAS2R5, respectively. Overall, the EC50 values
obtained for the different compounds vary 100-fold, with the
lowest values for the compounds that belong to the
hydrolyzable tannin and anthocyanins classes, suggesting that
these polyphenols could be the major compounds responsible
for the bitterness of fruits and derived products, such as red
wine.
■
ASSOCIATED CONTENT
S Supporting Information
*
Additional table. This material is available free of charge via the
Internet at http://pubs.acs.org.
■
AUTHOR INFORMATION
Corresponding Author
*E-mail: [email protected] (W.M.); [email protected] (V.D.F.).
Telephone: +351220402558. Fax: +351220402658.
Funding
This work has been supported by a grant of the German
Research Foudation (DFG) to W.M. (Me 1024/2-3) and also
by two grants of the Fundaçaõ para a Ciência e Tecnologia
[one Ph.D. grant (SFRH/BD/41946/2007) and one project
grant (PTDC/AGR-ALI/67579/2006)].
Notes
The authors declare no competing financial interest.
■
ABBREVIATIONS USED
DNA, DNA; DMSO, dimethyl sulfoxide; 1H NMR, nuclear
magnetic resonance; HPLC, high-performance liquid chromatography; PGG, pentagalloylglucose; TRC, taste receptor cells
■
REFERENCES
(1) Perez-Vizcaino, F.; Duarte, J.; Andriantsitohaina, R. Endothelial
function and cardiovascular disease: effects of quercetin and wine
polyphenols. Free Radical Res. 2006, 40, 1054−1065.
(2) Drewnowski, A.; Gomez-Carneros, C. Bitter taste, phytonutrients, and the consumer: a review. Am. J. Clin. Nutr. 2000, 72, 1424−
1435.
(3) Hufnagel, J. C.; Hofmann, T. Quantitative reconstruction of the
nonvolatile sensometabolome of a red wine. J. Agric. Food Chem. 2008,
56, 9190−9199.
(4) Peleg, H.; Gacon, K.; Schlich, P.; Noble, A. C. Bitterness and
astringency of flavan-3-ol monomers, dimers and trimers. J. Sci. Food
Agric. 1999, 79, 1123−1128.
(5) Arnold, R. A.; Noble, A. C.; Singleton, V. L. Bitterness and
astringency of phenolic fractions in wine. J. Agric. Food Chem. 1980,
28, 675−678.
(6) Robichaud, J. L.; Noble, A. C. Astringency and bitterness of
selected phenolics in wine. J. Sci. Food Agric. 1990, 52, 343−353.
(7) Kallithraka, S.; Bakker, J. Evaluation of bitterness and astringency
of (+)-catechin and (−)-epicatechin in red wine and in model
solution. J. Sens. Stud. 1997, 12, 25−37.
(8) Lea, A. G. H.; Arnold, G. M. The phenolics of ciders: bitterness
and astringency. J. Sci. Food Agric. 1978, 29, 478−483.
1532
dx.doi.org/10.1021/jf304198k | J. Agric. Food Chem. 2013, 61, 1525−1533
Journal of Agricultural and Food Chemistry
Article
glucoside condensation product. Tetrahedron Lett. 2002, 43, 6151−
6153.
(30) Bras, N. F.; Goncalves, R.; Fernandes, P. A.; Mateus, N.; Ramos,
M. J. O.; De Freitas, V. Understanding the binding of procyanidins to
pancreatic elastase by experimental and computational methods.
Biochemistry 2010, 49, 5097−5108.
(31) Delcour, J. A.; Ferreira, D.; Roux, D. G. Synthesis of condensed
tannins. Part 9. The condensation sequence of leucocyanidin with
(+)-catechin and with the resultant procyanidins. J. Chem. Soc., Perkin
Trans. 1 1983, 1711−1717.
(32) Chen, Y.; Hagerman, A. E. Characterization of soluble noncovalent complexes between bovine serum albumin and β-1,2,3,4,6penta-O-galloyl-D-glucopyranose by MALDI-TOF MS. J. Agric. Food
Chem. 2004, 52, 4008−4011.
(33) Fernandes, A.; Fernandes, I.; Cruz, L. S.; Mateus, N.; Cabral,
M.; De Freitas, V. Antioxidant and biological properties of bioactive
phenolic compounds from Quercus suber L. J. Agric. Food Chem. 2009,
57, 11154−11160.
(34) Ueda, T.; Ugawa, S.; Yamamura, H.; Imaizumi, Y.; Shimada, S.
Functional interaction between T2R taste receptors and g-protein α
subunits expressed in taste receptor cells. J. Neurosci. 2003, 23, 7376−
7380.
(35) Renaud, S.; De Lorgeril, M. Wine, alcohol, platelets, and the
french paradox for coronary heart disease. Lancet 1992, 339, 1523−
1526.
(36) Zhang, J.; Li, L.; Kim, S.-H.; Hagerman, A.; Lü, J. Anti-cancer,
anti-diabetic and other pharmacologic and biological activities of
penta-galloyl-glucose. Pharm. Res. 2009, 26, 2066−2080.
(37) Serafino, A.; Sinibaldi Vallebona, P.; Lazzarino, G.; Tavazzi, B.;
Rasi, G.; Pierimarchi, P.; Andreola, F.; Moroni, G.; Galvano, G.;
Galvano, F.; Garaci, E. Differentiation of human melanoma cells
induced by cyanidin-3-O-β-glucopyranoside. FASEB J. 2004, 18,
1940−1942.
(38) Vidal, S.; Francis, L.; Noble, A.; Kwiatkowski, M.; Cheynier, V.;
Waters, E. Taste and mouth-feel properties of different types of tanninlike polyphenolic compounds and anthocyanins in wine. Anal. Chim.
Acta 2004, 513, 57−65.
(39) Brouillard, R.; Delaporte, B. Chemistry of anthocyanin
pigments. 2. Kinetic and thermodynamic study of proton transfer,
hydration, and tautomeric reactions of malvidin 3-glucoside. J. Am.
Chem. Soc. 1977, 99, 8461−8468.
(40) Mueller, K. L.; Hoon, M. A.; Erlenbach, I.; Chandrashekar, J.;
Zuker, C. S.; Ryba, N. J. P. The receptors and coding logic for bitter
taste. Nature 2005, 434, 225−229.
(41) Mateus, N.; Machado, J. M.; De Freitas, V. Development
changes of anthocyanins in Vitis vinifera grapes grown in the douro
valley and concentration in respective wines. J. Sci. Food Agric. 2002,
82, 1689−1695.
(42) Carando, S.; Teissedre, P.-L.; Pascual-Martinez, L.; Cabanis, J.C. Levels of flavan-3-ols in french wines. J. Agric. Food Chem. 1999, 47,
4161−4166.
(43) Hollman, P. C. H.; Arts, I. C. W. Flavonols, flavones and
flavanols − nature, occurrence and dietary burden. J. Sci. Food Agric.
2000, 80, 1081−1093.
(44) Fischer, U.; Noble, A. C. The effect of ethanol, catechin
concentration, and pH on sourness and bitterness of wine. Am. J. Enol.
Vitic. 1994, 45, 6−10.
1533
dx.doi.org/10.1021/jf304198k | J. Agric. Food Chem. 2013, 61, 1525−1533
Baixar