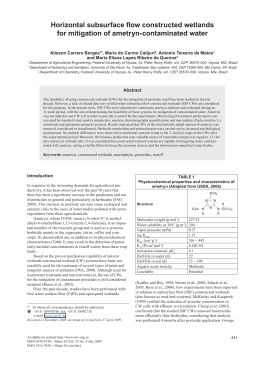
INDEPENDENT JOURNAL OF MANAGEMENT & PRODUCTION (IJM&P)
http://www.ijmp.jor.br
ISSN: 2236-269X
v. 5, n. 1, October – January 2014.
STATISTICAL PROCESS CONTROL (SPC): A CONTROL TOOL
AGAINST WASTE OF INPUTS IN BRAZILIAN DAIRY
Tiago Henrique de Paula Alvarenga
Federal University of Technology - Paraná (UTFPR), Brazil
E-mail: [email protected]
Ademir José de Abreu
Instituto de Ensino Superior Presidente Tancredo de Almeida Neves,
Brazil
E-mail: [email protected]
Cassiano Moro Piekarski
Federal University of Technology - Paraná (UTFPR), Brazil
E-mail: [email protected]
Juliana Vitória Messias Bittencourt
Federal University of Technology - Paraná (UTFPR), Brazil
E-mail: [email protected]
Eloiza Aparecida Silva Ávila de Matos
Federal University of Technology - Paraná (UTFPR), Brazil
E-mail: [email protected]
Submission: 21/09/2013
Accept: 05/10/2013
ABSTRACT
By reason of the requirements of quality on the part of consumers and
regulatory agencies, the dairy industries require tools capable of
optimizing their processes in virtue of threats from countries which have
a lower cost of production. The Statistical Process Control (SPC) is a
powerful tool to evaluate and monitor the process in relation to their
stability. This paper presents an application of Statistical Process
Control (SPC) in a dairy plant located in the south of Minas Gerais. The
process analyzed was the packaging of butter in 200g pots. The
purpose of this article is to identify the actual state of the filling process
of butter in this dairy and compare them with the requirements
established by legislation. Therefore, was used samples and control
charts to demonstrate the current state of the process and normality
tests, in particular the t-student. The results demonstrate that the
214
INDEPENDENT JOURNAL OF MANAGEMENT & PRODUCTION (IJM&P)
http://www.ijmp.jor.br
ISSN: 2236-269X
v. 5, n. 1, October – January 2014.
industry does not harm the consumer and that is faithful to the legislation. However, it
was identified that in case the industry presents an overweight in nominal content of
each package, which leads to considerable injury once the feedstock used in the
production of butter (cream) is of great economic value.
Keywords: Statistical process control; control charts; dairy.
1. INTRODUCTION
Milk production and its derivatives play an important role on the national stage,
whether in economics, is the social aspect as employment generation, maintenance
of the population in rural areas and improving the quality of life in rural areas
(CAPUCHO; PARRÉ, 2012).
The importance of this industry can be seen in the context of agribusiness,
where it is referred to as one of the leading sectors in terms of national income and
tax revenues (SOUZA, 2006). O leite e seus derivados estão entre os seis primeiros
produtos mais importantes da agropecuária nacional, ficando à frente de produtos de
culturas tradicionais como café e o arroz. Para cada real acrescido na produção no
sistema agroindustrial do leite, há um crescimento de, aproximadamente, cinco reais
no aumento do Produto Interno Bruto – PIB, o que coloca o agronegócio do leite à
frente de setores importantes como o da siderurgia e o da indústria têxtil
(EMBRAPA, 2003).
However, the domestic market is being threatened by products from the
countries of the Southern Common Market (MERCOSUR) in terms of its low
production cost. Thus, the competitiveness and survival of dairy products are linked
to a national quality management. By this fact, the main determinants for longevity of
dairy is a national quality management based on reducing costs and waste, since
most of the population still considers the price as a major factor in the purchase
decision (SCALCO; TOLEDO, 2002). The end of the price-fixing of milk in 1991 and
the economic opening of the country exposed the weaknesses and deficiencies in
organization and technology in the dairy sector national (WINCLER; SANTOS;
MACHADO, 2013).
For industries, one of the key to success is to stabilize their processes
ensuring product reliability by reducing waste. An accepted definition of quality is to
reduce the variability that the smaller, the better the reliability and acceptance of the
215
INDEPENDENT JOURNAL OF MANAGEMENT & PRODUCTION (IJM&P)
http://www.ijmp.jor.br
ISSN: 2236-269X
v. 5, n. 1, October – January 2014.
product or service. To reduce variability tools Statistical Process Control (SPC) to
demonstrate efficient stabilization of production processes (KHEDIRI; WEIHS;
LIMAM, 2010; MILAN; FERNANDES, 2002).
The Statistical Process Control (SPC) is a set of statistical tools for quality
oriented problem solving environment in processes and decision making by
managers. The CEP seeks accuracy in manufacturing, using data to analyze the
process. In the CEP process prevents loss (waste) products through control limits
(CHAKRABORTY; TAH, 2006; DINIZ, 2001). It is quite simple being used in various
industries worldwide. Through it, it is possible to control important features of the
product and the process instantly, ensuring quality levels at an affordable cost. The
SPC uses statistics to analyze the limitations of the product and process (NOMELINI;
FERREIRA; OLIVEIRA, 2009; SINGH; GILBREATH, 2002).
The SPC is composed of seven major tools, which were understood by
histograms, check sheets, Pareto charts, cause-effect diagrams, diagrams
concentration defect (stratification), scatter diagrams, and control charts (Vieira,
1999). Among the tools SPC control charts are one of the most popular tools. These
graphics can be based on attributes, or variables (SOUZA; RIGÃO, 2005).
A control chart is composed of three parallel lines, one central represents the
average value (CL), the lower representing the lower control limit (LCL) and upper
one representing the upper control limit (UCL). Are presented on points representing
the samples taken at various times of the process (DINIZ, 2001; VIEIRA, 1999).
The control process is performed by measuring the variables in separate
points in control charts. During the measurements, the results are checked against
the control limits which are expected according to the desired pattern. The results
obtained from the measurements indicates that the process has random or specific
causes of variability (KHEDIRI; WEIHS; LIMAM, 2010; PAESE; CATEN; RIBEIRO,
2001).
So that the process is under control it is necessary that your points are within
the control limits and your presentation is random at the top and bottom of the middle
line representing the quality characteristic (VIEIRA, 1999; DINIZ, 2001; CARVALHO,
2008). The measurements show that outside the control limits of variability are
considered special, i.e. affecting the quality of the product. Upon detecting such
216
INDEPENDENT JOURNAL OF MANAGEMENT & PRODUCTION (IJM&P)
http://www.ijmp.jor.br
ISSN: 2236-269X
v. 5, n. 1, October – January 2014.
causes of variation can act on the process to improve the quality of the product
continuously (CARVALHO, 2008; DINIZ, 2001; MICHEL; FOGLIATTO, 2002;
RAMOS, 2000; VIEIRA, 1999).
Although the agrifood sector present an unquestionable relevance to Brazil, is
only seen a small amount of research surrounding the issue of quality management
in the sector (TOLEDO; BATALHA; AMARAL, 2000). Given the above, this paper
aims to apply Statistical Process Control (SPC) in the process of filling of butter in a
Cooperative Dairy located in Lavras in southern Minas Gerais and check if this
process has stability and content 200g pots of butter is within the standards of the
National Institute of Metrology and Industrial Quality (INMETRO).
2. MATERIAL AND METHODS
The study was conducted under a Cooperative Dairy Lavras located in the
south of Minas Gerais. The Statistical Process Control (SPC) was applied in the
process of filling of butter in 200g pots in order to verify that the products are under
statistical control and meet specifications INMETRO No. 248, July 17, 2008. To
obtain the weights of the pots of butter (finished product), they were weighed on the
same plant by using two scales Gehaka - semi-analytical model BK-300, with a
maximum capacity of 310g, as recorded in INMETRO INMETRO seal 188 / 2003.
The two scales showed no significant difference in the values acquired through
weighing, only differences being observed in the third house after of the point.
The data analyzed correspond to eight productions (batches) of butter in 200g
pots - between the months of May and August of 2011. To carry out all the
procedures for applying the SPC (applying the Student t test and Wilcoxon test) was
used R-software, as well as their respective libraries for each proposed analysis thus
were made use of packages: library (qcc); require (gdata); library (BSDA) and
function t test. Through the R-software, were generated consolidated statistics as the
histogram, control charts for variables and the t test. The conventions used in control
charts were described as upper specification limit and lower specification limit, which
match the criteria defined by INMETRO in the ordinance in question. The lower and
upper control limits of the statistical analysis are determined in accordance with the
process variability purchased in batches surveyed.
217
INDEPENDENT JOURNAL OF MANAGEMENT & PRODUCTION (IJM&P)
http://www.ijmp.jor.br
ISSN: 2236-269X
v. 5, n. 1, October – January 2014.
The National Institute of Metrology, Standardization and Industrial Quality
(INMETRO) regularly conducts tests concerning the veracity of a product in relation
to its weight, volume and diameter. Such tests are reported in the media and the
credibility of the industries analyzed is put to the test with such disclosure. It is a
federal agency under the Ministry of Development, Industry and Foreign Trade,
whose mission is to provide confidence to the Brazilian society in the measurements
and products through metrology and conformity assessment, promoting the
harmonization of consumer relations, innovation and the country's competitiveness
(INMETRO, 2011).
The butter milk derivative is produced and marketed in weight (grams and
kilogram) without the presence of the consumer. In this respect, INMETRO No. 248,
July 17, 2008 aims to establish criteria for checking the actual content of premeasured products with nominal content (Qn) equal, expressed in units of the
International System of Units. This Ordinance applies to the metrological control of
pre-measured products in manufacturing environments, deposits and retail outlets.
According to INMETRO No. 248, July 17, 2008, Product Pre-Measured
content rating equal is defined as any packaged product and / or measured without
the presence of the consumer, with equal and predetermined nominal content in
packaging during manufacturing. In the production process it is clear that there are
variability’s. At this point, the said Ordinance establishes individual tolerances for
checking the weight / volume of the product in relation to its liquidity. Table 1
provides acceptable tolerance by the standard:
Table 1: Tolerances for individual allowable mass and volume
INDIVIDUAL TOLERANCE (T)
Nominal content (Qn)
grams or millgrams
5 to 50
50 to 100
100 to 200
200 to 300
300 to 500
500 to 1000
1000 to 10000
10000 to 15000
15000 to 25000
Percentage (%) of Qn
9
4,5
3
1,5
1
Source: INMETRO (2008)
grams or millgrams
4,5
9
15
150
-
218
INDEPENDENT JOURNAL OF MANAGEMENT & PRODUCTION (IJM&P)
http://www.ijmp.jor.br
ISSN: 2236-269X
v. 5, n. 1, October – January 2014.
Since pots of butter (pots) are 200g obeys individual tolerance 9g contained in
Table 1. The INMETRO No. 248, July 17, 2008, this content is already subtracted the
average weight of packaging, in this context, this individual tolerance it is only the
product.
However, INMETRO No. 248, July 17, 2008, also provides for batches
produced the quantity of items to be sampled and the amount of items containing
liquid below the individual tolerance contained in Table 1. Table 2 presents the
sample to the control and maximum number of defective items:
Table 2: Sample for control and maximum number of defective items
Batch Size
9 to 25
26 to 50
51 to 149
150 to 4000
4001 to 10000
Sample Size
Criteria for
acceptance
average
X ≥ Qn – 2.059 x S
5
X ≥ Qn – 0.847 x S
13
X ≥ Qn – 0.640 x S
20
X ≥ Qn – 0.485 x S
32
X ≥ Qn – 0.295 x S
80
Source: INMETRO (2008)
Maximum
defective below
Qn-T
0
1
1
2
5
Regarding Table 2, to accept the corresponding average of the sample as
mean (X), must be greater or equal to the nominal capacity (Qn), unless the tabular
values contained in the table for each sample size, multiplied by the deviation
standard (S) of the samples collected.
3. RESULTS
The samples were arranged according to the eight batches sampled between
May and August 2011, which are presented in Table 3 arranged in eight (08)
samples, divided into rational subgroups with n = 32:
The sample size was set at n = 32, according to INMETRO No. 248, July 17,
2008, for the production of dairy fits the average of 1,000 pots of butter per batch.
Therefore, it was determined that the jump from one sample to another 31 was
produced items, i.e. items produced every 31 withdrawing a sample and so forth.
In the literature (DINIZ, 2000; MONTGOMERY, 2009; RAMOS, 1999), is very
easily to control charts for variables to have answers expressed by a number on a
scale discrete measures. Thus, in Table 4, shows the limits of the control charts as
well as the main equations adopted in this work:
219
INDEPENDENT JOURNAL OF MANAGEMENT & PRODUCTION (IJM&P)
http://www.ijmp.jor.br
ISSN: 2236-269X
v. 5, n. 1, October – January 2014.
Table 3: Samples collected in the period from May to August/2011
Sample 1
202.4
205.8
205.1
205.5
206.6
205.3
206.4
207.6
204.4
205.4
206.1
206.6
206.1
206.7
206.8
206.9
206.6
206.1
216.0
210.5
215.7
210.6
216.1
206.2
215.2
203.1
214.1
213.1
203.8
203.8
213.9
213.0
Sample 2
201.4
209.5
208.3
209.5
216.0
211.0
208.7
209.7
207.2
207.1
208.3
208.0
208.1
207.9
206.8
207.7
208.2
206.9
207.3
208.9
207.7
210.7
208.7
209.9
209.1
210.2
210.4
216.2
209.2
206.8
211.0
208.1
Sample 3
199.3
208.8
209.3
209.3
206.0
207.6
208.4
210.2
209.1
206.2
206.4
206.2
207.1
208.7
208.9
203.9
206.2
205.8
206.6
206.7
206.9
206.9
207.5
210.4
207.9
208.6
207.1
207.5
207.8
207.3
209.2
207.3
Sample 4 Sample 5
203.0
201.9
205.6
205.7
203.2
204.5
203.9
208.2
202.8
210.1
205.7
210.6
204.5
209.6
207.5
209.4
208.9
209.7
208.0
210.2
210.7
210.6
207.7
210.5
211.7
212.6
214.5
211.3
212.9
211.1
213.5
209.1
209.4
208.5
210.5
209.5
209.9
211.1
208.6
210.0
207.7
208.9
208.5
211.6
208.3
207.8
209.5
211.6
206.3
213.5
208.7
211.6
210.2
208.5
211.3
210.6
212.6
210.7
209.5
214.4
208.4
208.2
207.6
209.4
Source: Survey data
Sample 6
203.2
207.4
207.6
209.3
209.1
208.5
208.6
210.5
209.2
208.5
210.7
211.0
209.3
208.4
211.2
210.1
208.4
208.5
210.2
211.8
210.7
209.4
211.7
208.5
209.4
210.7
208.9
208.4
211.0
212.6
210.6
209.0
Sample 7
202.6
204.2
207.7
208.4
209.6
210.2
208.9
211.5
212.3
211.2
210.3
209.0
211.6
211.8
210.4
209.2
210.1
209.2
211.5
209.8
212.4
210.1
211.3
209.1
211.5
212.2
211.3
210.7
211.4
212.5
211.4
212.5
Sample 8
201.1
204.2
203.1
204.0
207.3
207.7
207.8
208.3
210.6
210.4
208.2
208.5
209.5
210.3
211.7
210.6
211.0
212.4
211.1
211.9
210.2
208.6
210.6
212.3
210.3
208.2
212.8
210.2
212.1
210.4
211.3
210.6
To prove that the average weight of butter jars fit the average interval specified
by ordinance, formulated two hypotheses, where
equal); and,
(average limits are
(average limits are different). In this respect, Ferreira
(2009) describes a good test for this type of comparison is the average student t test.
Therefore, reject
in favor of
at a significance level of 5%, in other words, the
average interval specified is 191g and 209g, while the average interval was found in
the sample of 208.60g and 209.29g. The Table 5 shows the results of the
comparisons
= 200g and the average sample:
220
INDEPENDENT JOURNAL OF MANAGEMENT & PRODUCTION (IJM&P)
http://www.ijmp.jor.br
ISSN: 2236-269X
v. 5, n. 1, October – January 2014.
Table 4: Limits of graphs and equations adopted in the research
Mean and standard
deviation
e LCL
Mean and standard deviation
unknown
µY
Y
µY ± kσ Y
Y ± ksY
Formulas adopted in line with INMETRO 248/2008
x i is the average of the sampled values
n
Average
Deviation
xi =
s=
n
∑
i =1
∑x
i =1
xi
n
i
n
( x − x)
n −1
z
xi = i
n
Jump
is the sample size
x i is the average of the sampled values
2
i
is the observed value of each point
xi
s
n
is the standard deviation of the sample
is the sample size
xi
the jump is performed for each sample
zi
n
is the lot size produced
is the observed value of each point
is the sample size
Source: Authors
Table 5. Results of comparisons between
Item
Global
Sample 1 (Y1)
Sample 2 (Y2)
Sample 3 (Y3)
Sample 4 (Y4)
Sample 5 (Y5)
Sample 6 (Y6)
Sample 7 (Y7)
Sample 8 (Y8)
LCL
208.60
206.66
207.96
206.61
207.39
208.86
208.83
209.39
208.27
= 200g and the average sample
CL
UCL
208.94
209.29
208.17
209.67
208.89
209.82
207.35
208.09
208.49
209.58
209.73
210.61
209.45
210.07
210.18
210.98
209.29
210.31
Source: Survey data
p-value
2.20E-16
2.67E-09
2.20E-16
2.20E-16
2.20E-16
2.20E-16
2.20E-16
2.20E-16
2.20E-16
Assurance
95%
95%
95%
95%
95%
95%
95%
95%
95%
It is clarified that the test was applied globally (all elements of the sample) and
then to the sample group only as a precaution, in order to verify if any sample would
cause variation between them. Note that the test was significant at 95% confidence
level with p-value greater than 16th after of the point.
Figure 1 shows the control charts generated by R software with sample data,
organized as follows: R Chart - Graph control amplitude; S Chart - Graph Control
Standard Deviation; xbar Chart (left) - Graph Control Average of the natural limits of
the process; xbar Chart (right) - Average Control graph with the limits INMETRO.
221
INDEPENDENT JOURNAL OF MANAGEMENT & PRODUCTION (IJM&P)
http://www.ijmp.jor.br
ISSN: 2236-269X
v. 5, n. 1, October – January 2014.
Figure 1: Graphs of the research generated by the software R
Source: Survey data
A distribution cannot be defined solely by their average, requiring a knowledge
of dispersion around the sample mean. This knowledge can be acquired through the
graph of the standard deviation or the graph of amplitude (DINIZ, 2001).
The values of the samples in Chart 1 (amplitude) had low variability, and only one
sample (sample 5) was presented outside the control limits. In Chart 2 (standard
deviation) all samples were stable, with all the elements contained within the lower
and upper control.
Charts 3 and 4 show the natural limits of the samples (Chart 3) and the
specification limits (Chart 4). Note that in both graphs for red-flagged samples, whose
significance is the lack of stability. According to Montgomery (2009), processes that
have special causes of variation are called out of statistical control, since they are
responsible for the increase in manufacturing costs. The same author also states that
the stability of a process cannot be measured only by the fact that the points are
222
INDEPENDENT JOURNAL OF MANAGEMENT & PRODUCTION (IJM&P)
http://www.ijmp.jor.br
ISSN: 2236-269X
v. 5, n. 1, October – January 2014.
within the control limits. He argues that there are cases in which the existence of
more than 7 points between sequential mean and limits, sets up lack of stability.
The ability of a process can be understood as the natural variability of item
regarding their specifications. Thus, the ability to identify a process, it is necessary to
use capability indices, the most used and Cp index Cpk. Figure 2 shows two graphs
of process capability of the dairy:
Figure 2: Graphs of capacity generated by the software R
Source: Survey data
The index Cp is defined by Ramos (2000) as being the ratio between the total
dispersion and engineering tolerate the procedure. The same authors also described
that this index compares the total variation allowed by specification with the
dispersion consumed by the process. If Cp 1, this indicates that the process is
capable of achieving the specification. Already another index (Cpk) is also defined by
the same author as the average distance evaluation process regarding the
specification limits, taking into account that it is lower, i.e. more critical. If Cpk 1,
then the process is capable. Montgomery (2004) argues that Cp analyzes the
potential capacity of the process, while Cpk analyzes the effective capacity.
223
INDEPENDENT JOURNAL OF MANAGEMENT & PRODUCTION (IJM&P)
http://www.ijmp.jor.br
ISSN: 2236-269X
v. 5, n. 1, October – January 2014.
Note in the chart 1 of Figure 2, both the Cp value as the Cpk is > 1, the two
indices of 1.23. Already chart 2 of the same figure shows the index Cp with the same
1.23 and Cpk index of 0.0078. This difference between the indices Cpk charts,
occurs because of the first to be generated by the natural limits of the process and
the second by the specification limits. The process analyzed as shown in Figure 3,
shows low variability in their control limits with a standard deviation of 2.43; however
is outside the limits specified by ordinance mentioned.
4. CONCLUSIONS
The implementation of the SPC in the filling dairy process identified instability
and even still possible to know the number of grams in losses filling product (butter)
excess in 200g pots.
The dairy analyzed satisfactorily meets the minimum specifications of
INMETRO No. 248, July 17, 2008, which establishes a lower control limit of 191g and
an average weight of 200g. However, it is observed that the average interval of the
weights is not centered in 200g, according to the results of the tests: Student t and
Wilcoxon. The true average is centered on 208.94 g with 95% confidence. Thus, it
appears that the company is sending over 4.47% of output per batch equivalent to
8,943g.
It is observed that on the product weight must be corrected in order to reduce
operating costs of the company, since 45 pots (8.943g) of butter are lost production
(batch). The process has low variability, but it is mostly above the upper specification
limit. For this purpose, it is recommended to realign the process, maintaining low
rates of change, so that it does not cause damage to the company which results in
considerable loss since the raw material used in the production of butter (cream) is
great economic value in the dairy industry.
REFERENCES
CAPUCHO, T. O.; PARRÉ, J. L. (2012) Milk production in Paraná: a study
considering the spatial effects. Informe GEPEC Journal. v. 16, n: 1, p. 112-127.
CARVALHO, M. M.; (2008) Qualidade. In: BATALHA, M. O. Introdução à
engenharia da produção. Rio de Janeiro: Elsevier. cap. 4, p. 53-77.
CHAKRABORTY, S.; TAH, D. (2006) Real time statistical process advisor for
effective quality control. Decision Support Systems. v. 42, p. 700-711.
224
INDEPENDENT JOURNAL OF MANAGEMENT & PRODUCTION (IJM&P)
http://www.ijmp.jor.br
ISSN: 2236-269X
v. 5, n. 1, October – January 2014.
DINIZ, M. G. (2001) Desmistificando o controle estatístico de processo. São
Paulo: Artliber.
EMBRAPA. (2003) Empresa Brasileira de Agropecuária. Embrapa - Gado de leite.
Sistema de Produção de Leite (Zona da Mata Atlântica), jan. 2003. Disponível em: <
http://sistemasdeproducao.cnptia.embrapa.br/FontesHTML/Leite/LeiteZonadaMataAt
lantica/index.htm > Acesso: 21 ago. 2012.
FERREIRA, D. F. (2009) Estatística básica. Lavras: UFLA.
INMETRO (2008) - INSTITUTO NACIONAL DE METROLOGIA, NORMALIZAÇÃO
E QUALIDADE INDUSTRIAL. Portaria INMETRO N° 248, de 17 de julho de 2008.
KHEDIRI, I. B.; WEIHS, C.; LIMAM, M. (2010) Support Vector Regression control
charts for multivariate nonlinear autocorrelated processes. Chemometrics and
Intelligent Laboratory Systems. v. 103, p. 76–81.
MILAN, M.; FERNANDES, R. A. T. (2002) Quality of tillage operations by statistical
process control. Scientia Agricola. v.59, n:2, p. 261-266, abr/jun.
MONTGOMERY, D. C. (2009) Introdução ao controle estatístico de qualidade.
Rio de Janeiro: LTC.
NOMELINI, Q. S. S.; FERREIRA, E. B.; OLIVEIRA, M. A. (2009) Studies on nonrandom patterns in Shewhart control charts. Gestão & Produção (UFSCar). v: 16, n:
3, p. 414-421.
PAESE, C.; CATEN, C. T.; RIBEIRO, J. L. D. (2001) Aplicação da análise de
variância na implantação do CEP. Produção. v. 11, n. 1, p. 17-26, nov.
R DEVELOPMENT Core Team. (2009) A language and environment for statistical
computing. Foundation for Statistical Computing, Vienna, Austria. Disponível em:
< http://www.R-project.org > Acesso em: 21 out. 2010.
RAMOS, A. W. (2000) CEP para processos contínuos e em bateladas. São Paulo.
Edgard Blücher.
SCALCO, A. R.; TOLEDO, J. C. (2002) Gestão da qualidade em laticínios do estado
de São Paulo: situação atual e recomendações. RAUSP. v. 37, n. 2, p. 17-25,
abr/jun.
SINGHA, R.; GILBREATHB, G. (2002) A real-time information system for multivariate
statistical process control. International Journal Production Economics. v. 75,
p.161–172.
SOUZA, A. F. C. (2006) Utilização de técnicas de análise multivariada para
identificação do perfil dos laticínios de micro e pequeno porte do Estado de
Minas Gerais. 2006. 96f. Dissertação (Mestrado em Ciência e Tecnologia de
Alimentos) Universidade Federal de Viçosa. Viçosa.
SOUZA, A. M.; RIGÃO, M. H. (2005) Identificação de variáveis fora de controle em
processos produtivos multivariados. Produção. v. 15, n. 1, p. 74-86, jan/abr.
TOLEDO, J. C.; BATALHA, M. O.; AMARAL, D. C. (2000) Qualidade na indústria
agroalimentar: situação atual e perspectivas. Revista de Administração de
Empresas (FGV). São Paulo. v. 40, n. 2, p. 90-101, abr/jun.
VIERIA, S. (1999) Estatística para a qualidade: como avaliar com precisão a
qualidade em produtos e serviços. Rio de Janeiro: Elsevier.
225
INDEPENDENT JOURNAL OF MANAGEMENT & PRODUCTION (IJM&P)
http://www.ijmp.jor.br
ISSN: 2236-269X
v. 5, n. 1, October – January 2014.
WINCKLER, N. C.; SANTOS, T. S.; MACHADO, J. A. D. (2013) Coopetition between
household farmers of milk production chain in west of Santa. Revista Brasileira de
Gestão e Desenvolvimento Regional. v. 9, n. 1, p. 40-66, jan/mar.
226
Download